shawenegog lake - mississippi valley conservation …€¦ · shawenegog lake shawenegog lake, also...
TRANSCRIPT
State of the Lake
Environment Report
December 2004
Shawenegog Lake
Shawenegog Lake
Shawenegog Lake, also known locally as McClintock Lake, is located in the Township of North
Frontenac. Shawenegog Lake is at an elevation of 268 metres above sea level. The lake
perimeter is 18.0 kilometres; the deepest point is 28 metres. Shawenegog Lake supports a warm
water fishery, in particular, Walleye, Northern Pike, Smallmouth Bass, and White Fish. There
are approximately 36 properties on the lake, according to the Lake Association.
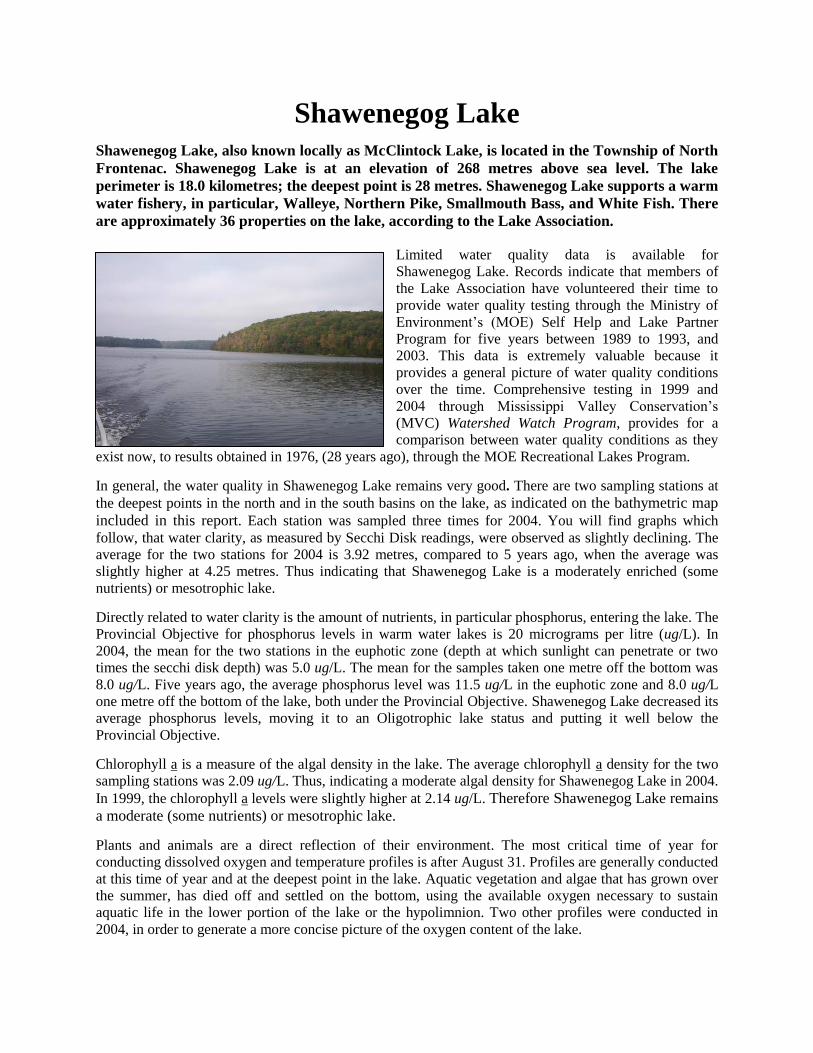
Limited water quality data is available for
Shawenegog Lake. Records indicate that members of
the Lake Association have volunteered their time to
provide water quality testing through the Ministry of
Environment’s (MOE) Self Help and Lake Partner
Program for five years between 1989 to 1993, and
2003. This data is extremely valuable because it
provides a general picture of water quality conditions
over the time. Comprehensive testing in 1999 and
2004 through Mississippi Valley Conservation’s
(MVC) Watershed Watch Program, provides for a
comparison between water quality conditions as they
exist now, to results obtained in 1976, (28 years ago), through the MOE Recreational Lakes Program.
In general, the water quality in Shawenegog Lake remains very good. There are two sampling stations at
the deepest points in the north and in the south basins on the lake, as indicated on the bathymetric map
included in this report. Each station was sampled three times for 2004. You will find graphs which
follow, that water clarity, as measured by Secchi Disk readings, were observed as slightly declining. The
average for the two stations for 2004 is 3.92 metres, compared to 5 years ago, when the average was
slightly higher at 4.25 metres. Thus indicating that Shawenegog Lake is a moderately enriched (some
nutrients) or mesotrophic lake.
Directly related to water clarity is the amount of nutrients, in particular phosphorus, entering the lake. The
Provincial Objective for phosphorus levels in warm water lakes is 20 micrograms per litre (ug/L). In
2004, the mean for the two stations in the euphotic zone (depth at which sunlight can penetrate or two
times the secchi disk depth) was 5.0 ug/L. The mean for the samples taken one metre off the bottom was
8.0 ug/L. Five years ago, the average phosphorus level was 11.5 ug/L in the euphotic zone and 8.0 ug/L
one metre off the bottom of the lake, both under the Provincial Objective. Shawenegog Lake decreased its
average phosphorus levels, moving it to an Oligotrophic lake status and putting it well below the
Provincial Objective.
Chlorophyll a is a measure of the algal density in the lake. The average chlorophyll a density for the two
sampling stations was 2.09 ug/L. Thus, indicating a moderate algal density for Shawenegog Lake in 2004.
In 1999, the chlorophyll a levels were slightly higher at 2.14 ug/L. Therefore Shawenegog Lake remains
a moderate (some nutrients) or mesotrophic lake.
Plants and animals are a direct reflection of their environment. The most critical time of year for
conducting dissolved oxygen and temperature profiles is after August 31. Profiles are generally conducted
at this time of year and at the deepest point in the lake. Aquatic vegetation and algae that has grown over
the summer, has died off and settled on the bottom, using the available oxygen necessary to sustain
aquatic life in the lower portion of the lake or the hypolimnion. Two other profiles were conducted in
2004, in order to generate a more concise picture of the oxygen content of the lake.
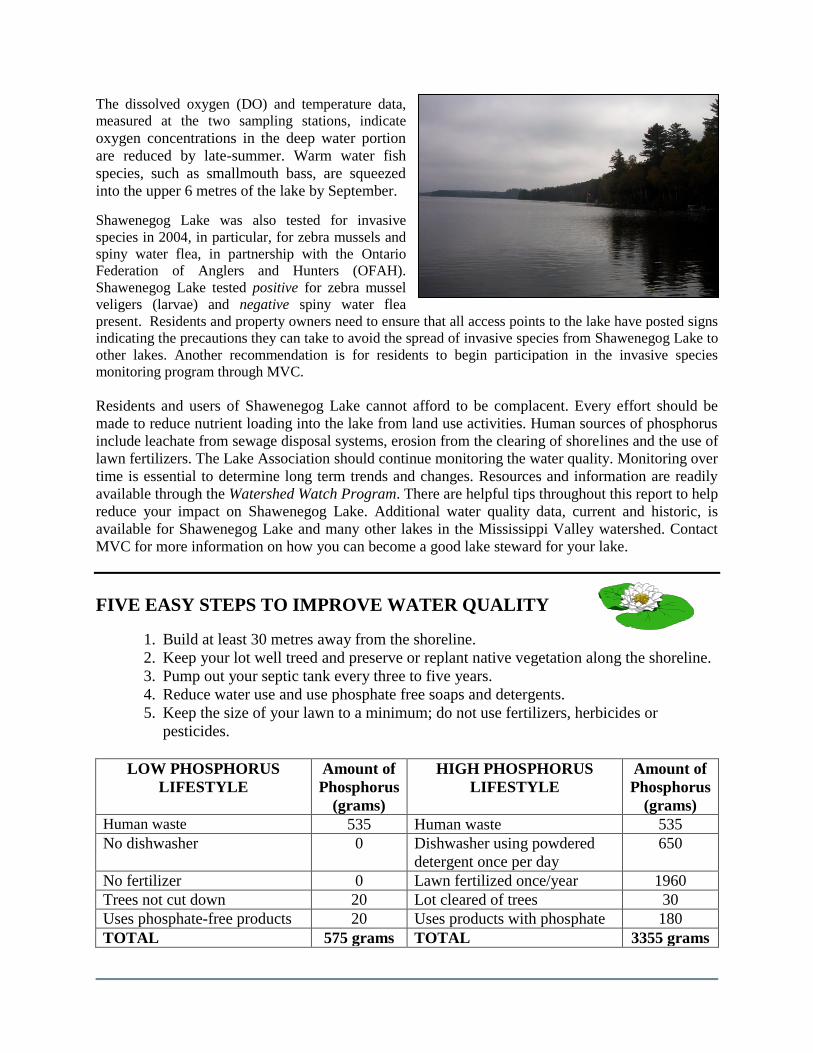
The dissolved oxygen (DO) and temperature data,
measured at the two sampling stations, indicate
oxygen concentrations in the deep water portion
are reduced by late-summer. Warm water fish
species, such as smallmouth bass, are squeezed
into the upper 6 metres of the lake by September.
Shawenegog Lake was also tested for invasive
species in 2004, in particular, for zebra mussels and
spiny water flea, in partnership with the Ontario
Federation of Anglers and Hunters (OFAH).
Shawenegog Lake tested positive for zebra mussel
veligers (larvae) and negative spiny water flea
present. Residents and property owners need to ensure that all access points to the lake have posted signs
indicating the precautions they can take to avoid the spread of invasive species from Shawenegog Lake to
other lakes. Another recommendation is for residents to begin participation in the invasive species
monitoring program through MVC.
Residents and users of Shawenegog Lake cannot afford to be complacent. Every effort should be
made to reduce nutrient loading into the lake from land use activities. Human sources of phosphorus
include leachate from sewage disposal systems, erosion from the clearing of shorelines and the use of
lawn fertilizers. The Lake Association should continue monitoring the water quality. Monitoring over
time is essential to determine long term trends and changes. Resources and information are readily
available through the Watershed Watch Program. There are helpful tips throughout this report to help
reduce your impact on Shawenegog Lake. Additional water quality data, current and historic, is
available for Shawenegog Lake and many other lakes in the Mississippi Valley watershed. Contact
MVC for more information on how you can become a good lake steward for your lake.
FIVE EASY STEPS TO IMPROVE WATER QUALITY
1. Build at least 30 metres away from the shoreline.
2. Keep your lot well treed and preserve or replant native vegetation along the shoreline.
3. Pump out your septic tank every three to five years.
4. Reduce water use and use phosphate free soaps and detergents.
5. Keep the size of your lawn to a minimum; do not use fertilizers, herbicides or
pesticides.
LOW PHOSPHORUS
LIFESTYLE
Amount of
Phosphorus
(grams)
HIGH PHOSPHORUS
LIFESTYLE
Amount of
Phosphorus
(grams)
Human waste 535 Human waste 535
No dishwasher 0 Dishwasher using powdered
detergent once per day
650
No fertilizer 0 Lawn fertilized once/year 1960
Trees not cut down 20 Lot cleared of trees 30
Uses phosphate-free products 20 Uses products with phosphate 180
TOTAL 575 grams TOTAL 3355 grams

How Does Shawenegog Lake Measure Up?
1976 – 2004 Water Quality Results – North Basin
Secchi Disk Total Phosphorus Total Phosphorus Chlorophyll a
Sample Year Depth Euphotic Zone 1 Metre off Bottom Composite
[Various Stations] [Metres] [Micrograms/Litre] [Micrograms/Litre] [Micrograms/Litre]
**1976 5.0 11.0 6.5 4.11
1989 5.6 6.00
1990 5.3 4.00
1991 6.0 2.90
1992 5.8 4.30
1993 5.6 3.10
1999 4.4 11.5 8.0 2.60
2003 4.8
*2004 4.0 5.3 7.0 2.00
n 9 3 3 8
Minimum 4.0 5.3 6.5 2.0
Maximum 6.0 11.5 8.0 6.0
Mean 5.2 9.3 7.2 3.6
Standard Deviation 0.67082039 3.444318994 0.763762616 1.2515469
1976 – 2004 Water Quality Results – South Basin
Secchi Disk Total Phosphorus Total Phosphorus Chlorophyll a
Sample Year Depth Euphotic Zone 1 Metre off Bottom Composite
[Various Stations] [Metres] [Micrograms/Litre] [Micrograms/Litre] [Micrograms/Litre]
**1976 5.1 10.2 3.93
1999 4.1 14.5 15.8 1.68
*2004 3.8 4.7 9.0 2.17
n 3 3 2 3
Minimum 3.8 4.7 9.0 1.7
Maximum 5.1 14.5 15.8 3.9
Mean 4.3 9.8 12.4 2.6
Standard Deviation 0.66905406 4.912229636 4.808326112 1.183230042
*Mean based on less than 6 measurements **Includes Recreational Lakes Program Data
Chlorophyll-a data prior to 1985 has been adjusted to reflect new lab procedures
in filtering resulting in an increase in chl.a concentrations by 35%
How to protect or restore a shoreline depends on the conditions of the site and the energy and resources of the owner.
There are four main strategies to choose from:
PRESERVATION ENHANCEMENT When purchasing a lakefront property, Native species are planted and a natural shoreline is retained and non-native species are removed. access to the lake is designed to avoid shoreline damage.
NATURALIZATION RESTORATION Degraded shorelines are left alone to Cleared areas are planted with return to their natural state. native species.
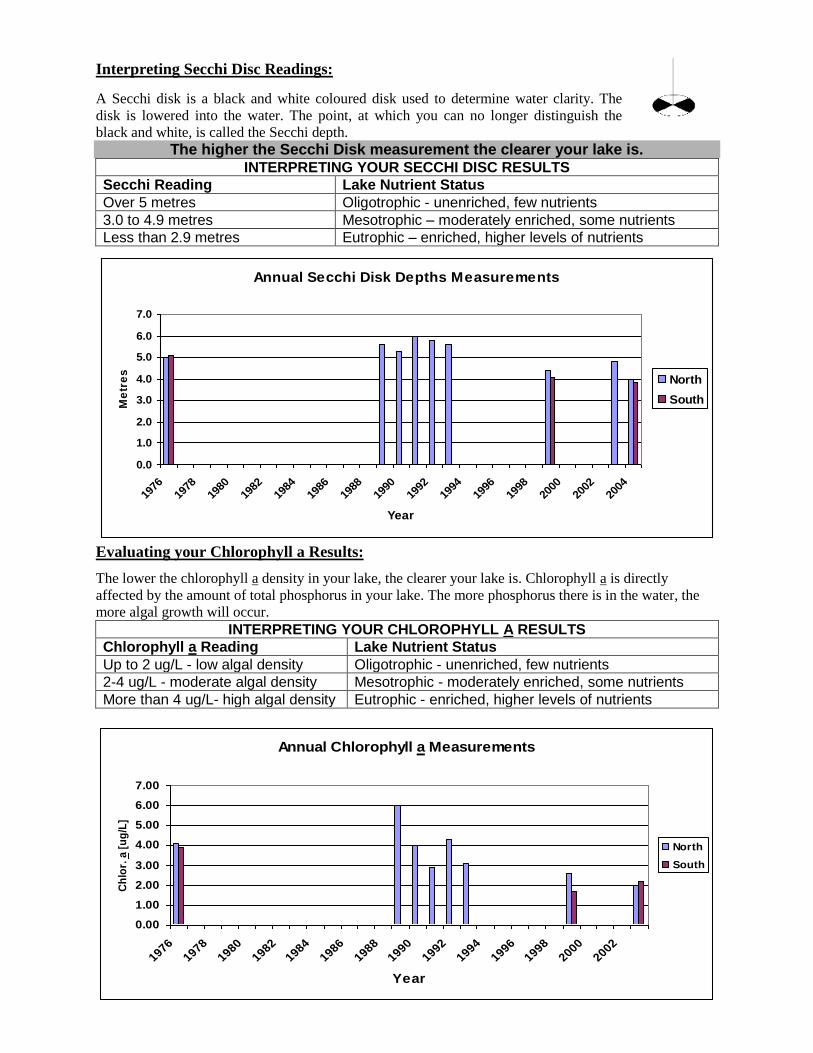
Interpreting Secchi Disc Readings:
A Secchi disk is a black and white coloured disk used to determine water clarity. The
disk is lowered into the water. The point, at which you can no longer distinguish the
black and white, is called the Secchi depth.
The higher the Secchi Disk measurement the clearer your lake is. INTERPRETING YOUR SECCHI DISC RESULTS
Secchi Reading Lake Nutrient Status
Over 5 metres Oligotrophic - unenriched, few nutrients
3.0 to 4.9 metres Mesotrophic – moderately enriched, some nutrients
Less than 2.9 metres Eutrophic – enriched, higher levels of nutrients
Annual Secchi Disk Depths Measurements
0.0
1.0
2.0
3.0
4.0
5.0
6.0
7.0
1976
1978
1980
1982
1984
1986
1988
1990
1992
1994
1996
1998
2000
2002
2004
Year
Me
tre
s
North
South
Evaluating your Chlorophyll a Results:
The lower the chlorophyll a density in your lake, the clearer your lake is. Chlorophyll a is directly
affected by the amount of total phosphorus in your lake. The more phosphorus there is in the water, the
more algal growth will occur.
INTERPRETING YOUR CHLOROPHYLL A RESULTS
Chlorophyll a Reading Lake Nutrient Status
Up to 2 ug/L - low algal density Oligotrophic - unenriched, few nutrients
2-4 ug/L - moderate algal density Mesotrophic - moderately enriched, some nutrients
More than 4 ug/L- high algal density Eutrophic - enriched, higher levels of nutrients
Annual Chlorophyll a Measurements
0.00
1.00
2.00
3.00
4.00
5.00
6.00
7.00
1976
1978
1980
1982
1984
1986
1988
1990
1992
1994
1996
1998
2000
2002
Year
Ch
lor.
a [
ug
/L]
North
South
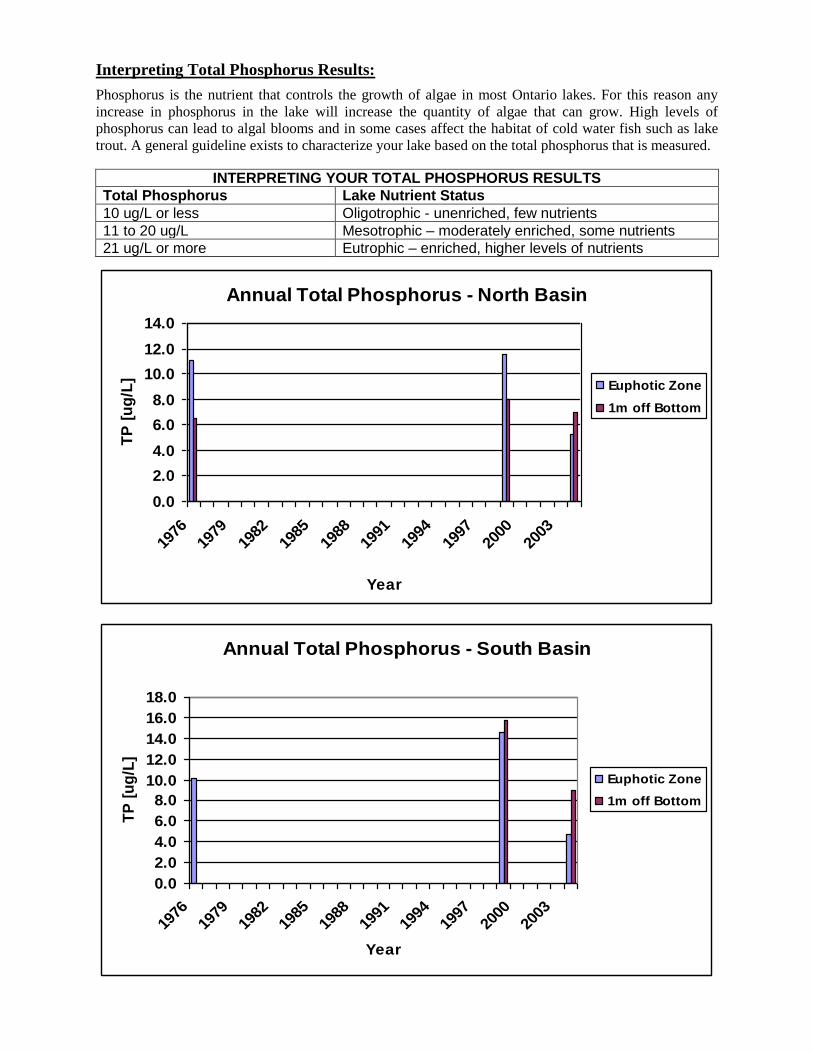
Interpreting Total Phosphorus Results:
Phosphorus is the nutrient that controls the growth of algae in most Ontario lakes. For this reason any
increase in phosphorus in the lake will increase the quantity of algae that can grow. High levels of
phosphorus can lead to algal blooms and in some cases affect the habitat of cold water fish such as lake
trout. A general guideline exists to characterize your lake based on the total phosphorus that is measured.
INTERPRETING YOUR TOTAL PHOSPHORUS RESULTS
Total Phosphorus Lake Nutrient Status
10 ug/L or less Oligotrophic - unenriched, few nutrients
11 to 20 ug/L Mesotrophic – moderately enriched, some nutrients
21 ug/L or more Eutrophic – enriched, higher levels of nutrients
Annual Total Phosphorus - North Basin
0.0
2.0
4.0
6.0
8.0
10.0
12.0
14.0
1976
1979
1982
1985
1988
1991
1994
1997
2000
2003
Year
TP
[u
g/L
]
Euphotic Zone
1m off Bottom
Annual Total Phosphorus - South Basin
0.0
2.0
4.0
6.0
8.0
10.0
12.0
14.0
16.0
18.0
1976
1979
1982
1985
1988
1991
1994
1997
2000
2003
Year
TP
[u
g/L
]
Euphotic Zone
1m off Bottom
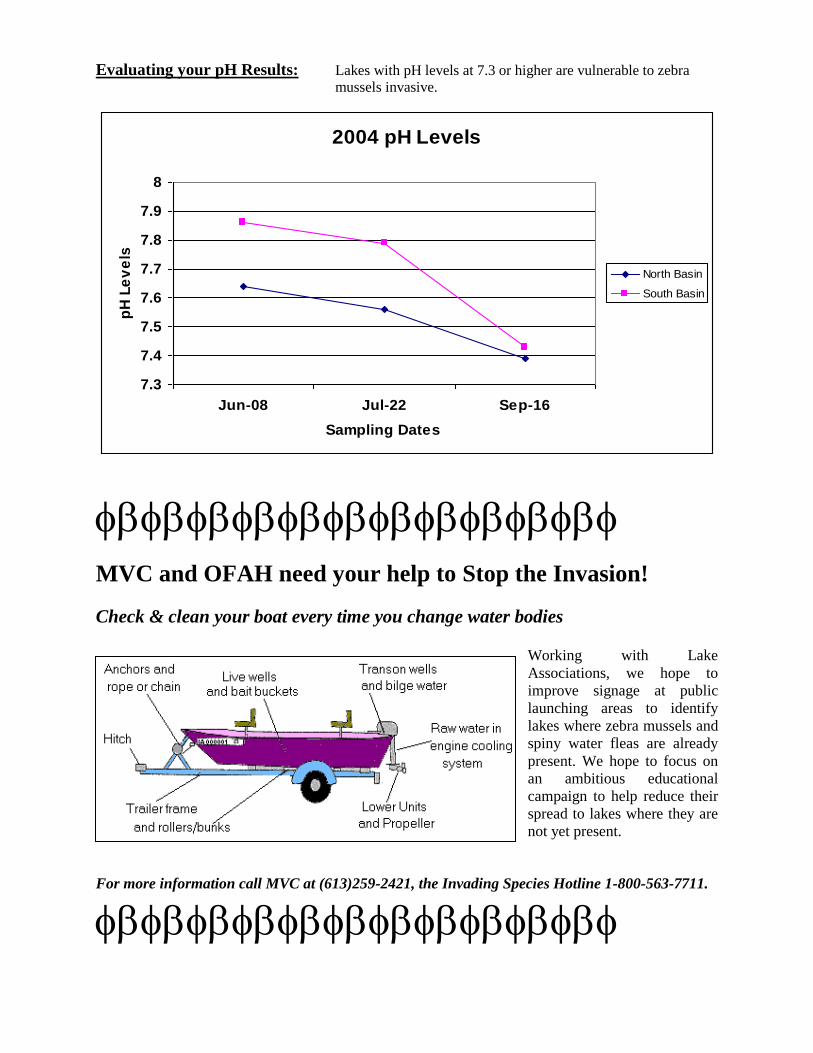
Evaluating your pH Results: Lakes with pH levels at 7.3 or higher are vulnerable to zebra
mussels invasive.
2004 pH Levels
7.3
7.4
7.5
7.6
7.7
7.8
7.9
8
Jun-08 Jul-22 Sep-16
Sampling Dates
pH
Le
ve
ls
North Basin
South Basin
MVC and OFAH need your help to Stop the Invasion!
Check & clean your boat every time you change water bodies
Working with Lake
Associations, we hope to
improve signage at public
launching areas to identify
lakes where zebra mussels and
spiny water fleas are already
present. We hope to focus on
an ambitious educational
campaign to help reduce their
spread to lakes where they are
not yet present.
For more information call MVC at (613)259-2421, the Invading Species Hotline 1-800-563-7711.
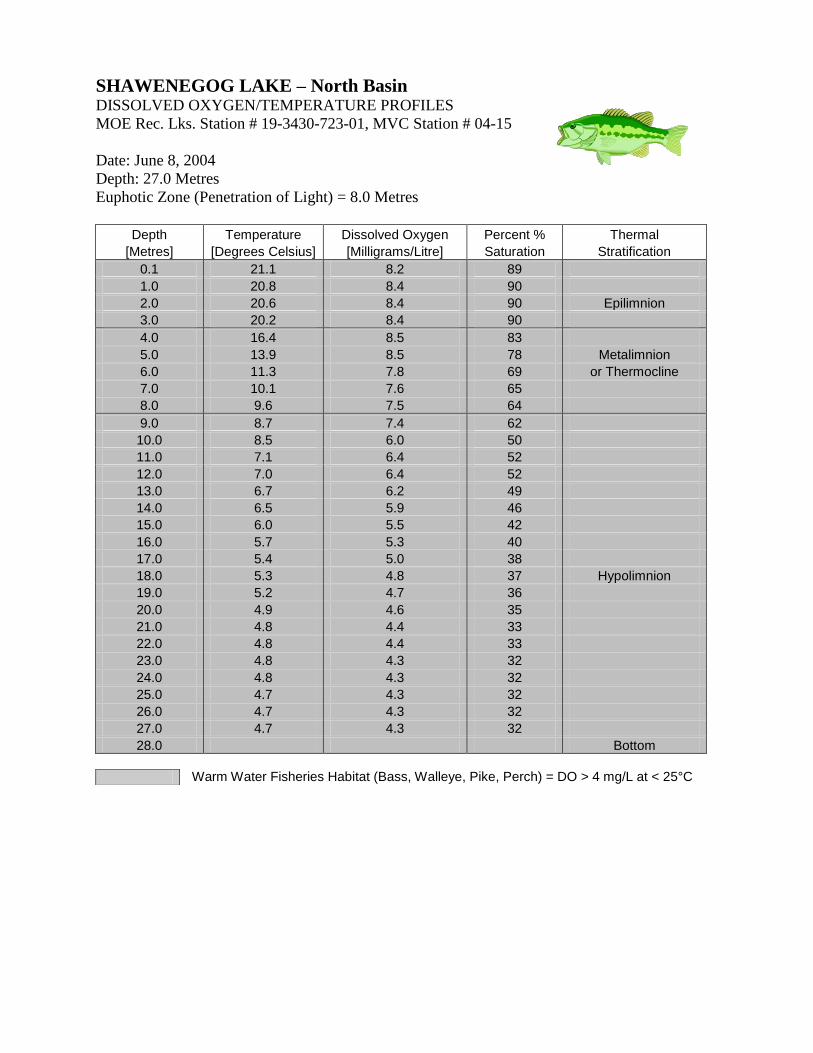
SHAWENEGOG LAKE – North Basin DISSOLVED OXYGEN/TEMPERATURE PROFILES
MOE Rec. Lks. Station # 19-3430-723-01, MVC Station # 04-15
Date: June 8, 2004
Depth: 27.0 Metres
Euphotic Zone (Penetration of Light) = 8.0 Metres
Depth Temperature Dissolved Oxygen Percent % Thermal
[Metres] [Degrees Celsius] [Milligrams/Litre] Saturation Stratification
0.1 21.1 8.2 89
1.0 20.8 8.4 90
2.0 20.6 8.4 90 Epilimnion
3.0 20.2 8.4 90
4.0 16.4 8.5 83
5.0 13.9 8.5 78 Metalimnion
6.0 11.3 7.8 69 or Thermocline
7.0 10.1 7.6 65
8.0 9.6 7.5 64
9.0 8.7 7.4 62
10.0 8.5 6.0 50
11.0 7.1 6.4 52
12.0 7.0 6.4 52
13.0 6.7 6.2 49
14.0 6.5 5.9 46
15.0 6.0 5.5 42
16.0 5.7 5.3 40
17.0 5.4 5.0 38
18.0 5.3 4.8 37 Hypolimnion
19.0 5.2 4.7 36
20.0 4.9 4.6 35
21.0 4.8 4.4 33
22.0 4.8 4.4 33
23.0 4.8 4.3 32
24.0 4.8 4.3 32
25.0 4.7 4.3 32
26.0 4.7 4.3 32
27.0 4.7 4.3 32
28.0 Bottom
Warm Water Fisheries Habitat (Bass, Walleye, Pike, Perch) = DO > 4 mg/L at < 25°C
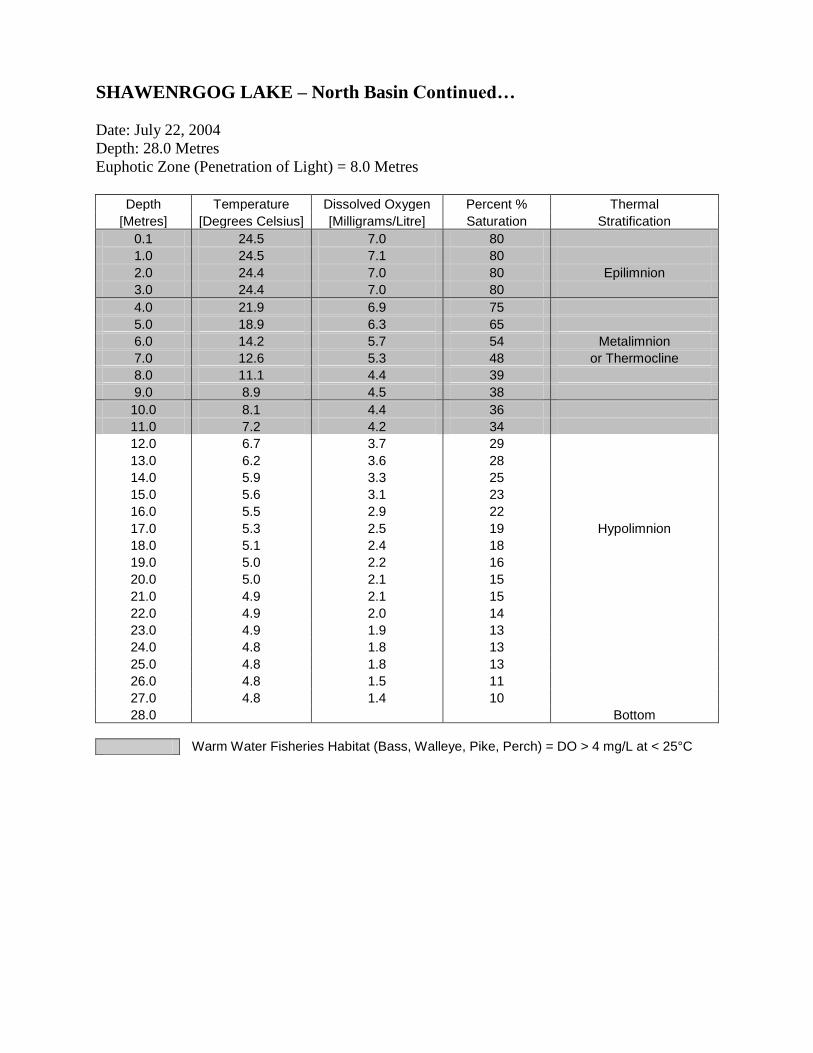
SHAWENRGOG LAKE – North Basin Continued…
Date: July 22, 2004
Depth: 28.0 Metres
Euphotic Zone (Penetration of Light) = 8.0 Metres
Depth Temperature Dissolved Oxygen Percent % Thermal
[Metres] [Degrees Celsius] [Milligrams/Litre] Saturation Stratification
0.1 24.5 7.0 80
1.0 24.5 7.1 80
2.0 24.4 7.0 80 Epilimnion
3.0 24.4 7.0 80
4.0 21.9 6.9 75
5.0 18.9 6.3 65
6.0 14.2 5.7 54 Metalimnion
7.0 12.6 5.3 48 or Thermocline
8.0 11.1 4.4 39
9.0 8.9 4.5 38
10.0 8.1 4.4 36
11.0 7.2 4.2 34
12.0 6.7 3.7 29
13.0 6.2 3.6 28
14.0 5.9 3.3 25
15.0 5.6 3.1 23
16.0 5.5 2.9 22
17.0 5.3 2.5 19 Hypolimnion
18.0 5.1 2.4 18
19.0 5.0 2.2 16
20.0 5.0 2.1 15
21.0 4.9 2.1 15
22.0 4.9 2.0 14
23.0 4.9 1.9 13
24.0 4.8 1.8 13
25.0 4.8 1.8 13
26.0 4.8 1.5 11
27.0 4.8 1.4 10
28.0 Bottom
Warm Water Fisheries Habitat (Bass, Walleye, Pike, Perch) = DO > 4 mg/L at < 25°C
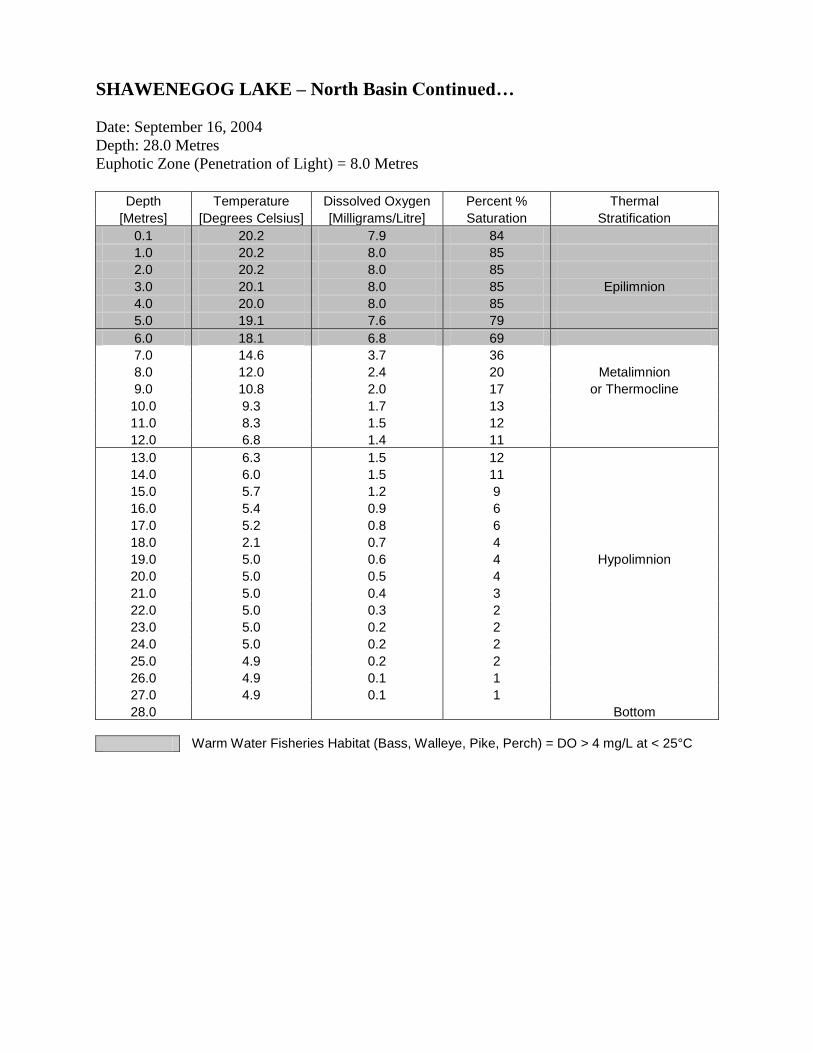
SHAWENEGOG LAKE – North Basin Continued…
Date: September 16, 2004
Depth: 28.0 Metres
Euphotic Zone (Penetration of Light) = 8.0 Metres
Depth Temperature Dissolved Oxygen Percent % Thermal
[Metres] [Degrees Celsius] [Milligrams/Litre] Saturation Stratification
0.1 20.2 7.9 84
1.0 20.2 8.0 85
2.0 20.2 8.0 85
3.0 20.1 8.0 85 Epilimnion
4.0 20.0 8.0 85
5.0 19.1 7.6 79
6.0 18.1 6.8 69
7.0 14.6 3.7 36
8.0 12.0 2.4 20 Metalimnion
9.0 10.8 2.0 17 or Thermocline
10.0 9.3 1.7 13
11.0 8.3 1.5 12
12.0 6.8 1.4 11
13.0 6.3 1.5 12
14.0 6.0 1.5 11
15.0 5.7 1.2 9
16.0 5.4 0.9 6
17.0 5.2 0.8 6
18.0 2.1 0.7 4
19.0 5.0 0.6 4 Hypolimnion
20.0 5.0 0.5 4
21.0 5.0 0.4 3
22.0 5.0 0.3 2
23.0 5.0 0.2 2
24.0 5.0 0.2 2
25.0 4.9 0.2 2
26.0 4.9 0.1 1
27.0 4.9 0.1 1
28.0 Bottom
Warm Water Fisheries Habitat (Bass, Walleye, Pike, Perch) = DO > 4 mg/L at < 25°C
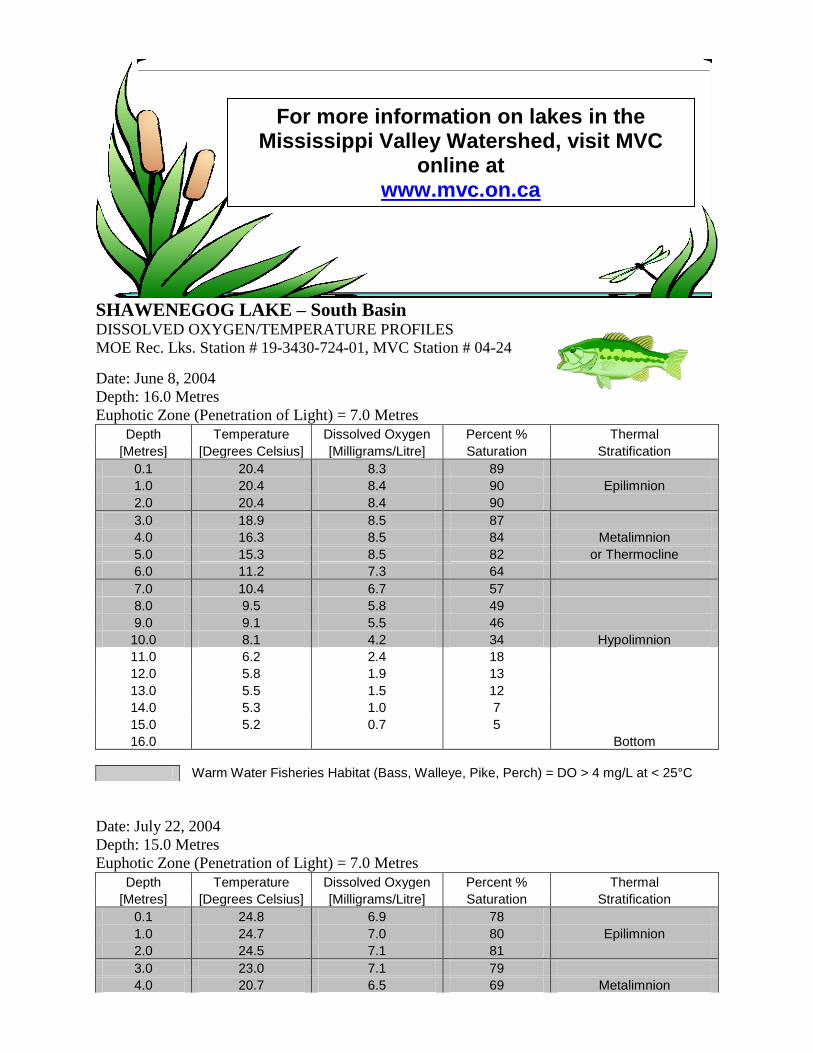
SHAWENEGOG LAKE – South Basin DISSOLVED OXYGEN/TEMPERATURE PROFILES
MOE Rec. Lks. Station # 19-3430-724-01, MVC Station # 04-24
Date: June 8, 2004
Depth: 16.0 Metres
Euphotic Zone (Penetration of Light) = 7.0 Metres
Depth Temperature Dissolved Oxygen Percent % Thermal
[Metres] [Degrees Celsius] [Milligrams/Litre] Saturation Stratification
0.1 20.4 8.3 89
1.0 20.4 8.4 90 Epilimnion
2.0 20.4 8.4 90
3.0 18.9 8.5 87
4.0 16.3 8.5 84 Metalimnion
5.0 15.3 8.5 82 or Thermocline
6.0 11.2 7.3 64
7.0 10.4 6.7 57
8.0 9.5 5.8 49
9.0 9.1 5.5 46
10.0 8.1 4.2 34 Hypolimnion
11.0 6.2 2.4 18
12.0 5.8 1.9 13
13.0 5.5 1.5 12
14.0 5.3 1.0 7
15.0 5.2 0.7 5
16.0 Bottom
Warm Water Fisheries Habitat (Bass, Walleye, Pike, Perch) = DO > 4 mg/L at < 25°C
Date: July 22, 2004
Depth: 15.0 Metres
Euphotic Zone (Penetration of Light) = 7.0 Metres
Depth Temperature Dissolved Oxygen Percent % Thermal
[Metres] [Degrees Celsius] [Milligrams/Litre] Saturation Stratification
0.1 24.8 6.9 78
1.0 24.7 7.0 80 Epilimnion
2.0 24.5 7.1 81
3.0 23.0 7.1 79
4.0 20.7 6.5 69 Metalimnion
For more information on lakes in the Mississippi Valley Watershed, visit MVC
online at www.mvc.on.ca
5.0 16.2 5.1 50 or Thermocline
6.0 12.6 3.8 34
7.0 10.8 2.5 21
8.0 10.0 2.1 17
9.0 9.2 1.6 13
10.0 6.6 0.5 4
11.0 6.0 0.3 2 Hypolimnion
12.0 5.8 0.2 2
13.0 5.8 0.2 2
14.0 5.8 0.2 2
15.0 Bottom
Warm Water Fisheries Habitat (Bass, Walleye, Pike, Perch) = DO > 4 mg/L at < 25°C
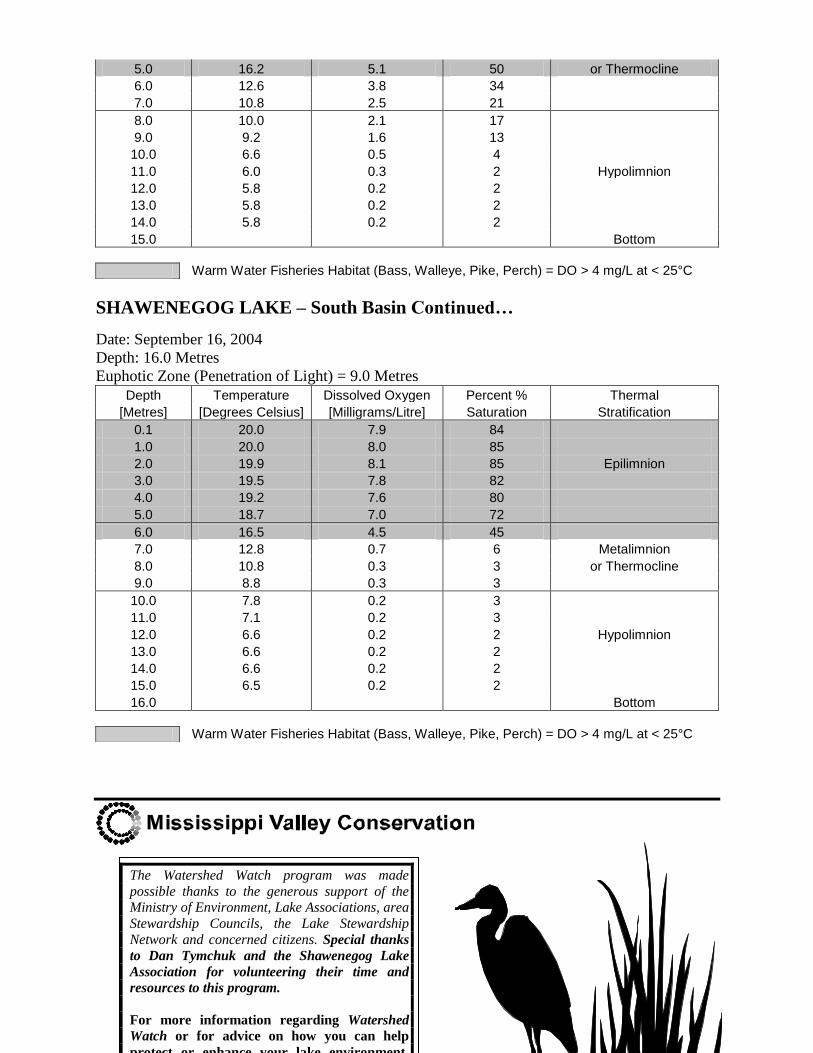
SHAWENEGOG LAKE – South Basin Continued…
Date: September 16, 2004
Depth: 16.0 Metres
Euphotic Zone (Penetration of Light) = 9.0 Metres
Depth Temperature Dissolved Oxygen Percent % Thermal
[Metres] [Degrees Celsius] [Milligrams/Litre] Saturation Stratification
0.1 20.0 7.9 84
1.0 20.0 8.0 85
2.0 19.9 8.1 85 Epilimnion
3.0 19.5 7.8 82
4.0 19.2 7.6 80
5.0 18.7 7.0 72
6.0 16.5 4.5 45
7.0 12.8 0.7 6 Metalimnion
8.0 10.8 0.3 3 or Thermocline
9.0 8.8 0.3 3
10.0 7.8 0.2 3
11.0 7.1 0.2 3
12.0 6.6 0.2 2 Hypolimnion
13.0 6.6 0.2 2
14.0 6.6 0.2 2
15.0 6.5 0.2 2
16.0 Bottom
Warm Water Fisheries Habitat (Bass, Walleye, Pike, Perch) = DO > 4 mg/L at < 25°C
The Watershed Watch program was made
possible thanks to the generous support of the Ministry of Environment, Lake Associations, area
Stewardship Councils, the Lake Stewardship
Network and concerned citizens. Special thanks
to Dan Tymchuk and the Shawenegog Lake
Association for volunteering their time and
resources to this program.
For more information regarding Watershed
Watch or for advice on how you can help
protect or enhance your lake environment,
