shear alfve´n wave radiation from a source with small ...plasma.physics.ucla.edu/older publ....
TRANSCRIPT

Shear Alfven wave radiation from a source with small transversescale length
D. Leneman, W. Gekelman, and J. MaggsUniversity of California at Los Angeles, Room 15-70, 1000 Veteran Avenue, Los Angeles, California 90024
�Received 14 March 2000; accepted 13 July 2000�
Shear Alfven waves are studied in the kinetic and inertial regimes. The waves are launched from anantenna which is on the order of the electron collisionless skin-depth, ��c/�pe , in size. Theexperiment is performed in the LArge Plasma Device, LAPD �W. Gekelman et al., Rev. Sci.Instrum. 62, 2875 �1991�� at the University of California, Los Angeles, using a new antenna designthat modulates parallel plasma electron current. The plasma is 100 skin-depths in diameter and 3.6Alfven wavelengths long. The results include the calculation of the wave currents based onmeasurements of the wave magnetic field. Differences in the perpendicular phase velocity of thewave in the kinetic regime as compared to the inertial regime are also reported. Results generallycompare favorably with predictions of a theory which includes collisional damping and kineticelectron dynamics with fluid ions. © 2000 American Institute of Physics.�S1070-664X�00�04610-3�
I. INTRODUCTION
Alfven waves are known to be very important in thedynamics of magnetized plasmas in space1–4 and in labora-tories on earth.5,6 They transport electromagnetic energy,may accelerate plasma particles, and are produced in manymagnetized plasma environments involving changes inplasma currents or magnetic field configuration. There aretwo basic Alfven waves in the magnetohydrodynamic�MHD� limit. One is compressional, where plasma densityoscillates in phase with magnetic field strength and, for aplane wave, the wave number vector, k, wave magnetic field,B, and the background magnetic field, B0 are coplanar. Theother is the shear mode which has oscillations in B that areperpendicular to B0 . Shear Alfven waves propagate at fre-quencies below the ion cyclotron frequency (�ci), while thecompressional wave can propagate at frequencies above andbelow this value. The currents associated with the shearwave are carried by both electrons and ions, but these twospecies perform different roles. The electrons carry the wavecurrents which are parallel to B0 and the ions carry the per-pendicular currents though the polarization drift.
The experiments described in this article are concernedwith shear Alfven wave radiation from sources with trans-verse scale comparable to the electron collisionless skin-depth, �, which is the speed of light divided by the electronplasma frequency, c/�pe . When the source is of this scale,there are important differences in the properties of the shearwave depending on the ratio of the Alfven wave phase speed,vA , to the electron thermal speed, ve , in the plasma. Hereve�(2kTe /me)
1/2, where Te and me are the electron tem-perature and mass. The Alfven wave phase speed is definedas
vA�vA0�1���/�ci�2�1/2. �1�
Here � is the wave frequency, vA0�B0 /(4�nimi)1/2, ni is
the ion density, mi is the ion mass, and B0��B0�. If vA /ve is
much smaller than 1, the wave is termed kinetic,7,8 i.e., theplasma electrons respond as a fluid to the wave parallel elec-tric field. If vA /ve is much larger than 1, the wave is termedinertial,9,10 i.e., the electron inertia determines their responseto the wave fields. In a quasi-neutral plasma,
mi /me�8�nekTemi /B02me��ve /vA0�
2, �2�
where is the electron beta. Equation �2� indicates mi /me
is a convenient parameter to use for determining how kineticor inertial the shear Alfven wave is.
One motivation behind this research effort is that shearwaves launched with small sources have an electric field par-allel to B0 , E � . This field can, in turn, interact with particlesin the plasma. Another motivation is to study shear waveradiation as it may spontaneously occur in a plasma. In thisexperiment the radiation is unaffected by the machineboundaries so the findings described here might be helpful inthe interpretation of some low-frequency (���ci) spaceplasma phenomena.
In space plasmas there are field-aligned current filamentswith transverse size as small as the electron collisionlessskin-depth.11–14 Alfven wave sources of this size arepredicted15–17 and observed18–20 to have a profound impacton the radiation observed. For example, the wave energy willspread radially away from the flux tube of the source as itpropagates axially. There are at least two possible scenariosfor the generation of localized currents in space. A fluctuat-ing electric field, aligned with the background magneticfield, and localized on the skin-depth scale, would generatesuch a structure. This electric field could be caused by an-other disturbance. Another possibility is the transient, local-ized electric field associated with the formation or decay ofdouble layers thought to exist in the auroral ionosphere.21
Such a transient structure would have a broad frequencyspectrum. Each frequency component less than �ci wouldradiate its own shear Alfven wave structure with its own
PHYSICS OF PLASMAS VOLUME 7, NUMBER 10 OCTOBER 2000
39341070-664X/2000/7(10)/3934/13/$17.00 © 2000 American Institute of Physics
Downloaded 23 Apr 2008 to 128.97.43.195. Redistribution subject to AIP license or copyright; see http://pop.aip.org/pop/copyright.jsp
characteristic radial spreading. If the source current circu-lates and closes back on itself as in the model described inthis article the magnetic field associated with the wave struc-ture will be radially confined. If the current closes at a verylarge radius, the wave structure will be more extensive, ex-hibiting a 1/r radial decay in amplitude at large r values.
Such structures may also naturally occur at the edge oflaboratory plasmas.6 Magnetic field measurements on TO-KAMAK edge plasmas show5 waves with high correlationlengths along the magnetic field and short correlation lengthsacross it. These are most likely shear waves and may play asignificant role in edge plasma physics.
This article is organized as follows: first, an overview ofthe theory is presented. Next the experimental arrangementincluding a brief discussion of the plasma device is de-scribed. The data are then compared with the theoretical pre-dictions. Comparisons are made for the dispersion relation,the shape of radial profiles of the wave magnetic field mag-nitude, the radial effect of damping, radial wave propagation,and the wave current structure. We then present a summaryof the results.
II. THEORY AND EXPECTED WAVE BEHAVIOR
Before describing the experiment, a brief description ofthe relevant theory16,17 is in order. The theory describes shearAlfven wave radiation from one disk-shaped source with ra-dius a� . The disk is oriented so that the normal of itssurface is aligned with the background magnetic field. Thefield-aligned current density at the source �axial position z�0) is modeled as constant, for radial distances, r, less thana; and 0, for r�a . The amplitude of the ac flowing to thedisk is I0 . The azimuthal symmetry of the model implies thatthe wave magnetic field, B, will be azimuthally symmetricand in the azimuthal direction. Radial and axial componentsof B are not expected unless ���ci . The spatial depen-dence of the azimuthal component of B, B� , is given by
16
B��r ,z �
�2I0ca �
0
� sin�k�a �
k�
J1�k�r � exp „ik ��k��z… dk� . �3�
Here J1 is the first-order Bessel function and k � and k� arethe parallel and perpendicular components of the wave num-ber vector. The dispersion relation,17 which includes damp-ing, is
�1�i ���vA /ve�2��2�Z������k���2. �4�
Here Z�(�) is the derivative of the plasma dispersionfunction22 with respect to its argument, ���(1�i ), ���/(k �ve), and ��c /� , where �c is the dominant colli-sion rate. The function k �(k�) in Eq. �3� can be found fromEq. �4�. The inclusion of the plasma dispersion functionproperly describes the electron motion along the magneticfield for all values of the wave parallel phase velocity. Thedispersion relation is simplified in the inertial or kinetic limitwhen is set to 0. In the inertial limit � is large, Z�(�)→1/�2, and the dispersion relation becomes �/k ��vA�1�(k��)2��1/2. In the kinetic limit � is small and Z�(�)
→�2. Therefore, �/k ��vA0�1�(�/�ci)2�(k��s)
2�1/2
where �s is (Te /mi)1/2/�ci and is the relevant spatial scale
for plasmas with mi /me�1. In the experiments reportedhere, an attempt is made to cover a significant portion of , space and evaluate the affects of these parameters on thewave.
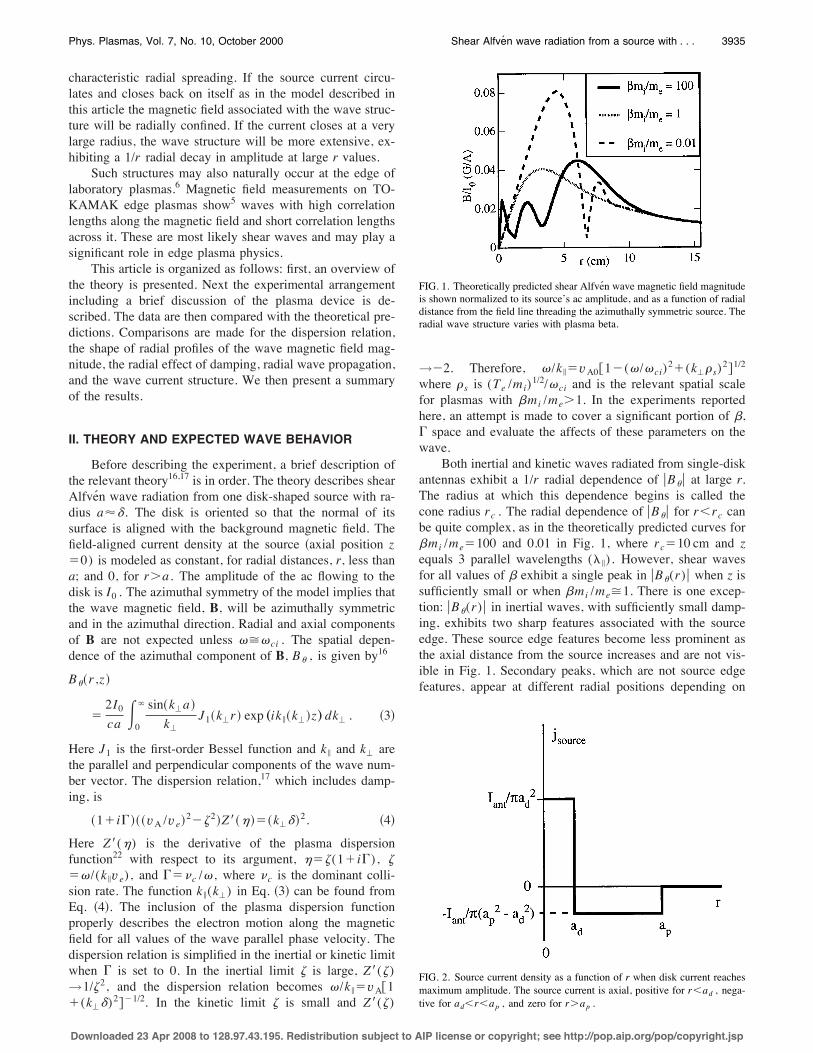
Both inertial and kinetic waves radiated from single-diskantennas exhibit a 1/r radial dependence of �B�� at large r.The radius at which this dependence begins is called thecone radius rc . The radial dependence of �B�� for r�rc canbe quite complex, as in the theoretically predicted curves formi /me�100 and 0.01 in Fig. 1, where rc�10 cm and zequals 3 parallel wavelengths (� �). However, shear wavesfor all values of exhibit a single peak in �B�(r)� when z issufficiently small or when mi /me�1. There is one excep-tion: �B�(r)� in inertial waves, with sufficiently small damp-ing, exhibits two sharp features associated with the sourceedge. These source edge features become less prominent asthe axial distance from the source increases and are not vis-ible in Fig. 1. Secondary peaks, which are not source edgefeatures, appear at different radial positions depending on
FIG. 1. Theoretically predicted shear Alfven wave magnetic field magnitudeis shown normalized to its source’s ac amplitude, and as a function of radialdistance from the field line threading the azimuthally symmetric source. Theradial wave structure varies with plasma beta.
FIG. 2. Source current density as a function of r when disk current reachesmaximum amplitude. The source current is axial, positive for r�ad , nega-tive for ad�r�ap , and zero for r�ap .
3935Phys. Plasmas, Vol. 7, No. 10, October 2000 Shear Alfven wave radiation from a source with . . .
Downloaded 23 Apr 2008 to 128.97.43.195. Redistribution subject to AIP license or copyright; see http://pop.aip.org/pop/copyright.jsp

whether the shear wave is in the inertial or kinetic regime�Fig. 1�; as the axial distance from the source increases, sodoes the number of peaks �assuming very small damping�. Inthe inertial regime the secondary peaks appear at larger radiithan that of the main lobe, but in the kinetic regime, thesecondary peaks appear at radii smaller than that of the mainlobe.
In these experiments, waves are radiated using a dual-disk antenna �described later� rather than a single-disk an-tenna. The dual-disk antenna does not create a wave radialprofile with a 1/r fall off at large r because of the antennadesign. The theory for a single-disk source must be modifiedto model the double-disk source. In a modified theory usedhere, the disks broadcast out of phase and all the ac flowingout of one disk returns through the plasma to the otherthrough an annular area coplanar with the disks. The innerradius of the annulus is denoted by ad �the actual radius ofthe disks� and the outer radius is denoted by ap . Figure 2shows the model current profile of the source. The wave fieldis calculated by summing two integrals of the form given byEq. �3�, where in one integral a�ad and in the other a�ap . The two integrals are subtracted since one disk is ra-diating 180° out of phase with respect to the other. The re-lation of I0 in Eq. �3� to the amplitude of the ac flowing tothe antenna disks, Iant , is
I0�Iant /�1��ad /ap�2� . �5�
Results of this model will be compared with data later.The effect of collisional damping on the structure of the
shear wave is incorporated into the theory where it is param-etrized by . Two common types of collisional damping inlaboratory devices are electron–ion Coulomb collisions andelectron collisions with neutral gas �He, for example�. In thisexperiment the Coulomb collision frequency, �ei , is domi-nant since it is at least ten times the electron-neutral collisionfrequency. The published theory does not include the veloc-ity dependence of Coulomb collisions but, nevertheless, pre-dicts that greater damping smoothes out sharp features,broadens peaks in �B�(r)�, and moves them out to largerradii. If is large enough, a peak in �B�(r)� can appearoutside the predicted cone radius.
The ratio of the perpendicular group velocity to the par-allel group velocity, vg� /vg� , for the inertial and kineticlimits is given in Eqs. �6� and �7�, respectively,
vg�vg�
����k��2/vA�„1��k���2…�1/2, �6�
vg�vg�
���k��s2/vA0�„1���/�ci�
2��k��s�2…�3/2. �7�
The minus sign appearing in Eq. �6� indicates that the inertialwave is a backward wave in the perpendicular direction. Ex-perimentally, the wave energy is observed to spread radiallyoutward, i.e., in the positive r direction, as it must. There-fore, the radial phase velocity for the backwards inertialwave is expected to be inwards �in the negative r direction�.
FIG. 3. Side view of the LArge Plasma Device �LAPD� at UCLA.
FIG. 4. Typical plasma density profile �measured with a Langmuir probe�from averages over 20 plasma pulses. The error bars represent the standarddeviation of the average.
3936 Phys. Plasmas, Vol. 7, No. 10, October 2000 Leneman, Gekelman, and Maggs
Downloaded 23 Apr 2008 to 128.97.43.195. Redistribution subject to AIP license or copyright; see http://pop.aip.org/pop/copyright.jsp
III. EXPERIMENTAL SETUP
A. The LAPD
The plasma device used for these experiments is calledthe LArge Plasma Device �LAPD�23 and is depicted in Fig.3. The LAPD vacuum vessel has an overall length of 11 m.The experimental region is a 1 m diameter, 10 m long cyl-inder. A 1 m long end section supports the cathode assemblyof an electron beam source and has large pump-out ports forthe high vacuum system. The vacuum system consists of apair of turbomolecular pumps backed by rotary vane pumps,the chamber is back filled with He.
The energy source for the ionization required to producethe plasma consists of an electron beam accelerated by apotential of up to 55 V. Electrons are drawn out of a heatedsheet of BaO-coated nickel and accelerated by the electricpotential applied between the Ni sheet �the cathode� and awire grid �the anode� placed 0.7 m downstream. Since theemissivity of the coating decreases on the millisecond timescale,24 plasma is most efficiently produced in the pulsed
mode. Operating this way considerably increases the lifetimeof the cathode coating since data cannot be acquired continu-ously, in any event, due to probe positioning delays. Theplasma in the 9.3 m long section beyond the anode iscurrent-free and quiescent (�n/n2% over the time of atypical experiment�. Therefore the antenna placement andthe measurement locations are all in this region. Thecathode-emitted beam electrons which make it past the an-ode are fully pitch angle scattered and, in the present experi-ment, their mean-free path for inelastic collisions ranges be-tween 5 and 15 m. Langmuir probes show no signs of abump-on-tail electron distribution in the non-current-carrying region.
The background magnetic field, B0 , is produced by elec-tromagnets surrounding the 10 m cylindrical section of themachine. The field is solenoidal and aligned along the axis ofthe vacuum vessel. The magnets are sufficiently separated toallow easy access to the ports and to accommodate a widerange of angular manipulation of the probe apparatus, whileat the same time maintaining a nearly uniform field ��2% atthe edge of the plasma� for high-quality experiments.
B. Plasma characteristics
The LAPD is capable of producing plasmas with elec-tron density, ne�5�1012 cm�3 and Te up to 15 eV. In theexperiments described, the parameter regime was restrictedto ne�2.4�1012 cm�3 and Te�12 eV. The cathode coatingtechnique used in these experiments produces plasmas withspatial variations �see Fig. 4�. Typical transverse spatialvariations in the electron density over the middle 20 cm ofthe plasma are �7% and �10% in the electron temperature.The highest transverse spatial variation for ne is �10% andfor Te it is �15%. Axial variations are smaller: the radiallyaveraged ne typically varies less than �3% over 7 m. Theradially averaged Te monotonically decreases with distancefrom the electron beam source, typically dropping by 14%over 7 m. After the voltage on the cathode is turned off, thisgradient in Te decreases considerably.
These data are derived from Langmuir curves averagedover an ensemble of 20 samples because the plasma variesslightly from pulse to pulse. In 20 separate plasma pulses theLangmuir characteristic was recorded at the same time afterthe start of each pulse and at the same position in the cham-ber. The error bars shown in Fig. 4 represent the standarddeviation of the ensemble. The wave field data to be pre-sented also consist of averages over 20 separate pulses of
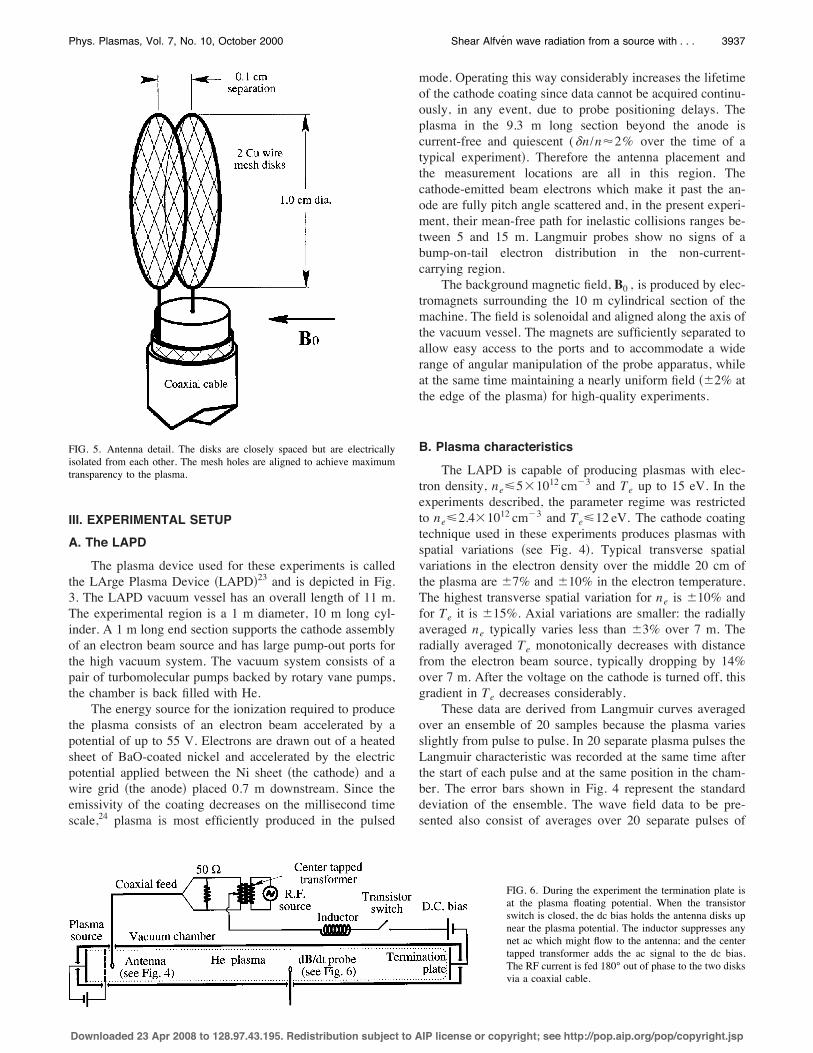
FIG. 5. Antenna detail. The disks are closely spaced but are electricallyisolated from each other. The mesh holes are aligned to achieve maximumtransparency to the plasma.
FIG. 6. During the experiment the termination plate isat the plasma floating potential. When the transistorswitch is closed, the dc bias holds the antenna disks upnear the plasma potential. The inductor suppresses anynet ac which might flow to the antenna; and the centertapped transformer adds the ac signal to the dc bias.The RF current is fed 180° out of phase to the two disksvia a coaxial cable.
3937Phys. Plasmas, Vol. 7, No. 10, October 2000 Shear Alfven wave radiation from a source with . . .
Downloaded 23 Apr 2008 to 128.97.43.195. Redistribution subject to AIP license or copyright; see http://pop.aip.org/pop/copyright.jsp

plasma. It is experimentally determined that this average issufficient to characterize the wave properties in spite of thepulse to pulse variability of the plasma.
In practice there is also a systematic perturbation of theplasma by the wave launching antenna. It produces a radialdepression in plasma density and electron temperature whichextends along its flux tube. The contrast of the depression
near the antenna is not much larger than the random spatialvariability shown in Fig. 4, and decreases by a factor of 2 forevery axial meter away from the wave source. Nevertheless,it is located on the flux tube defined by the source andbroader in the transverse direction than the random spatialvariations.
C. Wave source
The shear Alfven wave antenna is constructed from twoidentical Cu wire mesh disks �see Fig. 5�. Their radius, ad , is0.50 cm while the electron skin-depth in the experimentsranges from 0.34 to 0.45 cm. The disks are glued togetherwith high-temperature, vacuum compatible epoxy such thatthe meshes line up for maximum transparency. The layer ofepoxy between them assures electrical isolation. Current isfed to the disks via a coaxial cable where each conductorservices one disk. The combination is supported by a smallmetal shaft which is 0.3 cm in diameter. The shaft is insu-lated from the antenna disks and the chamber wall. For rea-sons presented later, a dc bias voltage is placed in seriesbetween the copper plate that terminates the plasma and thetwo disks, as in the circuit schematized in Fig. 6.
FIG. 7. dB/dt probe. The probe has a small profile in the plasma andmeasures all three components of dB/dt along one background magneticfield line.
FIG. 8. Measurement geometry. The layout of the r, � measurement loca-tions is shown in part �a�. Part �b� is a perspective drawing depicting theperpendicular measurement planes along the z axis and their relation to theantenna position. For each set of plasma conditions a minimum of fourplanes of data is acquired.
FIG. 9. Measured versus calculated wave phase for each case and z position.Here �c��z/vA , where vA is defined in Eq. �1�. The slope of the line fit is0.97.
TABLE I. and values for each experimental case studied. The thirdcolumn is included because vA differs from vA0 due to finite wave fre-quency, �. The last column is the average slope of �(r). For a given , asmi /me decreases, so does ��/�r . In case 5 the average slope is negative.
Case no. mi /me vA /ve ��/�r (°/cm)
1 1.02�0.07 6.8 �5% 0.31�2% �28�92 1.03�0.12 1.00�8% 0.78�4% �12�93 1.00�0.05 0.50�4% 1.03�2% �5�74 8.2 �0.5 1.02�5% 0.77�2% 0�45 7.5 �0.2 0.23�2% 1.56�2% �3�4
3938 Phys. Plasmas, Vol. 7, No. 10, October 2000 Leneman, Gekelman, and Maggs
Downloaded 23 Apr 2008 to 128.97.43.195. Redistribution subject to AIP license or copyright; see http://pop.aip.org/pop/copyright.jsp
The antenna dc bias allows the production of large sinu-soidal current fluctuations. If a small, sinusoidally time-varying voltage is applied to a disk whose dc voltage is heldat the plasma floating potential, it will collect an excess ofelectrons on positive swings and an excess of ions on nega-tive swings. If the amplitude of the ac voltage is increased,the current collected in the negative swings saturates because
the ion current is limited by the ion sound speed. The result-ing ac resembles the rectified current of a diode. Applying apositive dc bias to the disk allows the use of larger ac volt-ages without deformation in the sinusoidal current becausethe oscillating voltage will now modulate primarily electroncurrent. This technique makes it possible to produce oscillat-ing current with peak-to-peak amplitude near the electronsaturation current.
In the dual-disk design, the dc voltage is applied to bothdisks and ac voltage is applied so that the electron currentflowing to each disk is modulated 180° out of phase. For agiven dc bias, the ac amplitude is limited to a value whichensures that the negative swing stays above the plasma float-ing potential. In practice the dc bias is set in order to reason-ably minimize the effects of drawing current to the antenna.Since drawing a current produces a density and electron tem-perature depression in the plasma, the bias is set so the prod-uct neTe in the depression is not less than 0.6 of neTe in thesurrounding plasma. In most cases the bias is about 2.5Te V�where Te is in eV�. The ac voltage amplitude is chosen sothat the higher harmonics in the received signals are below10% of the fundamental. The combined requirements of ac
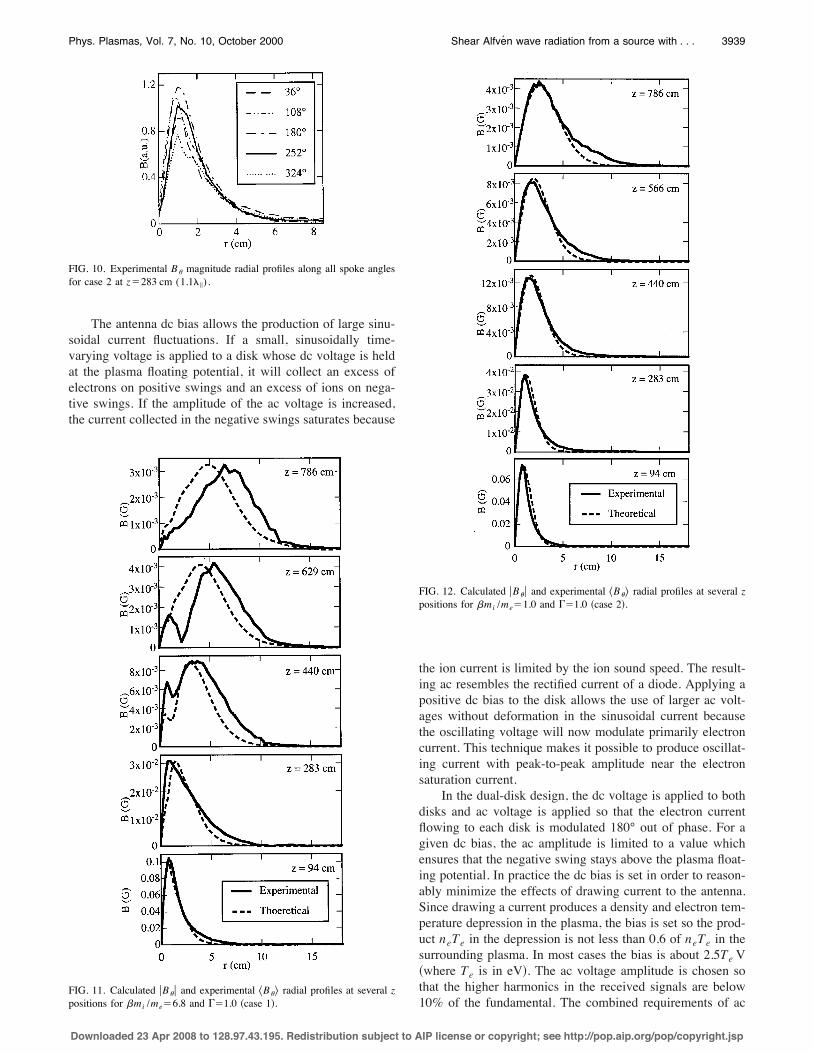
FIG. 10. Experimental B� magnitude radial profiles along all spoke anglesfor case 2 at z�283 cm (1.1� �).
FIG. 11. Calculated �B�� and experimental �B�� radial profiles at several zpositions for mi /me�6.8 and �1.0 �case 1�.
FIG. 12. Calculated �B�� and experimental �B�� radial profiles at several zpositions for mi /me�1.0 and �1.0 �case 2�.
3939Phys. Plasmas, Vol. 7, No. 10, October 2000 Shear Alfven wave radiation from a source with . . .
Downloaded 23 Apr 2008 to 128.97.43.195. Redistribution subject to AIP license or copyright; see http://pop.aip.org/pop/copyright.jsp

and dc voltages necessitate the use of a center tapped trans-former �see Fig. 6�.
The dual construction of the antenna is necessary for anear-zero net ac flowing in the feed. In previous theoreticaland experimental studies16,17,20,25 a single-disk antenna wasmodeled and used, and a net ac flowed in a conductor in thesupport shaft of the antenna. The radial current element alsoradiated a wave which was superimposed on the radiationfrom the disk. Since this current is not modeled in the theory,it is difficult to make conclusions concerning the radial ef-fects of damping, radial propagation, and the detailed struc-ture of the wave.
Although there is no net ac flowing to the two-disksource, an Alfven wave is launched because the disks stillmodulate dc plasma currents: as one disk draws more elec-trons, the other draws correspondingly fewer. To balance theantenna current system a choke is used �see Fig. 6� to reducethe net ac in the coaxial feed to the acceptable level of 3% to4% of the ac to either disk. The current flowing to the an-tenna is digitized during the experiment in order to monitorthe constancy of the source over 24 h data runs.
The antenna is located at the radial center of the plasma,0.3 m from the anode, in the experimental region of theLAPD. Its center defines the position of the magnetic field
aligned aligned z axis (r�0), as well as the position of theplane where z�0.
D. Alfven wave detector
In the present study only the Alfven wave’s magneticfield, B, is measured. Three small wire coils are used tomeasure dB/dt as a function of time �t� and position �incylindrical coordinates, r, � and z�. The coils are mutuallyorthogonal �see Fig. 7� in order to measure the three compo-nents of dB/dt which lie along their axes. Since the launchedand received signal is sinusoidal, it is immaterial that dB/dtis measured instead of B.
The voltage measured between the coil leads can be con-taminated by the influence of the wave electric field. To re-duce this effect, each coil consists of two oppositely woundmulti-turn loops and the respective signals are subtracted toreject the common mode.26 The coils and their coaxial cablesare housed in a metal cover sufficiently thick to shield outthe wave electric field. A slit is cut in each coil cover in orderto prevent the formation of eddy currents. Figure 7 showshow the three sets of paired loops are arranged, supported,and fed with coaxial cables. Each loop pair has 116 wind-ings, an inner diameter of 0.4 cm, an outer diameter of 0.6cm, and is 0.3 cm tall. The probe can resolve spatial changesof 0.5 cm scale. The three coils are positioned along andcentered on a common B0 field line. This arrangement ispreferable because the wave radiation is expected to have a 1cm scale in the perpendicular direction and a 1 m scale in theparallel direction. The coils and their covers are not sup-
FIG. 13. Calculated �B�� and experimental �B�� radial profiles at several zpositions for mi /me�0.5 and �1.0 �case 3�.
FIG. 14. Calculated �B�� and experimental �B�� radial profiles at several zpositions for mi /me�1.0 and �8.2 �case 4�.
3940 Phys. Plasmas, Vol. 7, No. 10, October 2000 Leneman, Gekelman, and Maggs
Downloaded 23 Apr 2008 to 128.97.43.195. Redistribution subject to AIP license or copyright; see http://pop.aip.org/pop/copyright.jsp

ported by their leads nor are the leads exposed to the plasmaas Fig. 7 suggests. A vacuum compatible epoxy is used toinsulate the leads as well as to attach the coil covers to thesupport structure and hold their mutual orthogonality towithin 0.01 rad. The fully assembled dB/dt probe was cali-brated using a long thin wire with a known ac flowing in it.The probe was positioned over a range of distances from 0.5to 200 cm and tested over a range of frequencies from 100kHz to 1 MHz.
E. Measurement technique and data acquisition
The dB/dt of the launched Alfven wave is measured at235 positions in several planes perpendicular to B0 in theplasma volume. At each position the experiment is repeated20 times, and the received dB/dt signal is averaged andstored on disk for later analysis. The pattern of measurementlocations is the same in each plane. It consists of a five-spoked acquisition grid depicted in Fig. 8�a�. The density ofmeasurement points is higher near the center in order to bet-ter sample the fine structure of the radiation pattern. The r, �arrangement of the measurement locations affords efficientmonitoring of symmetry over �. The probe location is set bya computer-controlled drive mechanism, which manipulatesthe support shaft of the probe from outside the vacuum ves-sel. Where the current density, j (j�1/�0“ÃB), is to becalculated, nine data planes spaced as closely as � �/4 areacquired.
The accuracy of alignment of the probe coil axes withrespect to B0 is �0.02 rad. Therefore measurements of theaxial component of B have a maximum inaccuracy of 2% ofthe magnitude of the perpendicular component of B. Theaccuracy in positioning the probe is �0.02 cm in the hori-zontal direction of Fig. 8�a�. When a continuous series of
FIG. 15. Calculated �B�� and experimental �B�� radial profiles at several zpositions for mi /me�0.23 and �7.5 �case 5�.
FIG. 16. Experimental and theoretical wave phase as a function of r forseveral z positions and for mi /me�6.8 and �1.0 �case 1�. The positiveslope indicates radially outward propagation.
TABLE II. Values of plasma current source outer diameter, ap , and rangeof values of the damping parameter used in the theoretical fits to the data ineach case. The required damping parameter, , at z�283 cm for cases 1 and2 is 0.2.
Case no. ap (cm) Axial range of
1 3.0 0.4–0.62 2.2 0.7–1.23 2.2 0.5–1.14 2.8 8.5–10.05 2.3 6.5–8.0
3941Phys. Plasmas, Vol. 7, No. 10, October 2000 Shear Alfven wave radiation from a source with . . .
Downloaded 23 Apr 2008 to 128.97.43.195. Redistribution subject to AIP license or copyright; see http://pop.aip.org/pop/copyright.jsp
points is sampled, as in the series of points in a spoke, theprecision in the vertical direction �of Fig. 8�a�� is �0.04 cm.Given the wave structures encountered, the positioning inac-curacy has a noticeable effect only where r is less than about0.5 cm.
There are other possible sources of inaccuracy: pulse-to-pulse differences in the plasma, Alfvenic noise at the fre-quency of the launched wave, reflections at machine bound-aries, and perturbations due to the probe itself. The effect ofplasma variations and background Alfven waves is reducedby averaging over a 20 pulse ensemble. In this experimentthere were no detectable reflected waves from either the endplate, the anode or the cathode. The dB/dt probe is largeenough that it could impede wave currents; this was testedby detecting the wave with a second probe. It was found thatthe presence of the first probe did not significantly changethe signals received at the second probe.
The plasma conditions are varied in order to observe thewave in two different collisionality regimes �different valuesof �. By varying the plasma , the Alfven wave is observedin the kinetic, inertial, and intermediate regimes. Five differ-ent plasma conditions, or cases, are studied. Table I showsthe parameters and assigns numbers for each case. Since � iscomparable to �ci in this experiment, the wave’s parallelphase speed, vA , is not equal to vA0 �see Eq. �1��, therefore
vA /ve is physically more meaningful than mi /me
�(ve /vA0)2 and is included in the table. The errors listed in
the table are all due to the axial gradient of Te . Three valuesof mi /me are studied where is approximately 1. Addi-tionally, two cases with a high value of are examined.
Since data from different cases must be compared at thesame scaled distance (z/� �) from the source, and since axialprobe access is limited to regularly spaced ports, it is desir-able that � � is the same value in each case, � ��2.50m. Thisvalue is chosen because it affords an attainable and interest-ing range in , space. Since �ei depends on ne and Te ,
27
moving in , space involves one or more of the experi-mental parameters ne , Te , B0 , and �. In principle, since theLAPD’s operation imposes a constraint on ne and Te , andsince , , and � � are fixed for each case, there are fourconstraints on ne , Te , B0 , and �. So, they are uniquelydetermined and all must be changed to obtain a desired or.
IV. OBSERVATIONS AND COMPARISON WITHTHEORY
Figure 9 is a scatter plot of the measured wave phase,�m , versus a calculated phase, �c , for each case and z po-
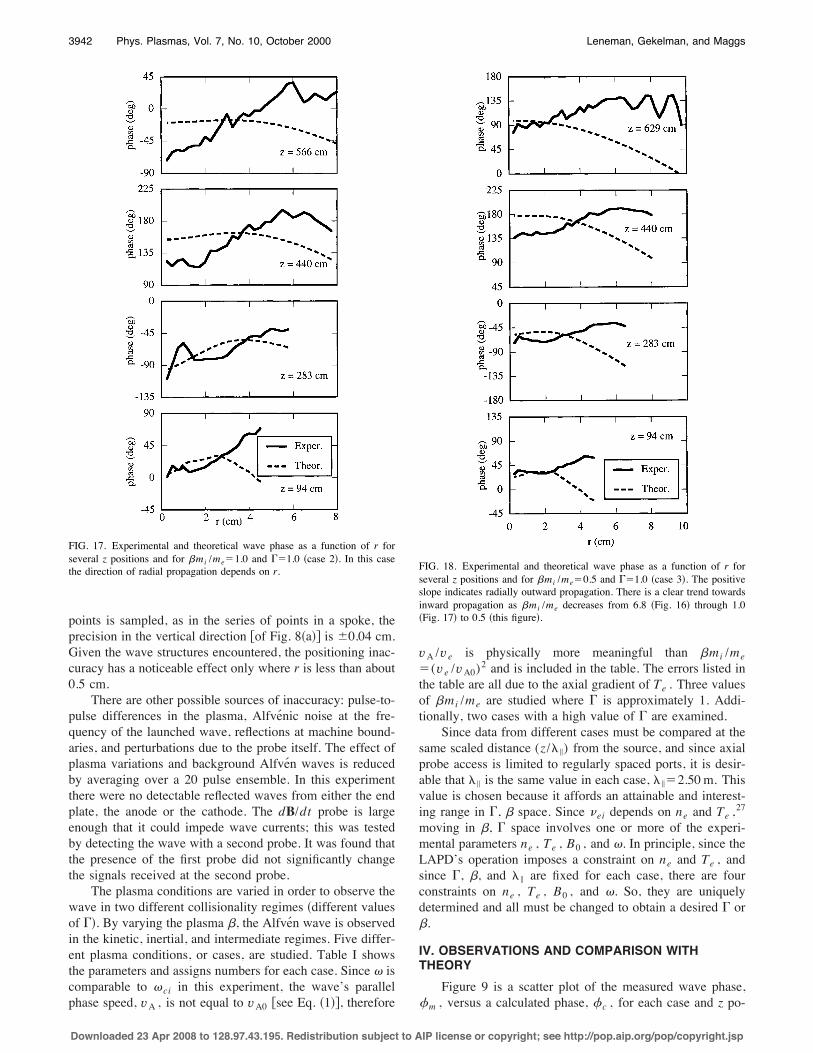
FIG. 17. Experimental and theoretical wave phase as a function of r forseveral z positions and for mi /me�1.0 and �1.0 �case 2�. In this casethe direction of radial propagation depends on r. FIG. 18. Experimental and theoretical wave phase as a function of r for
several z positions and for mi /me�0.5 and �1.0 �case 3�. The positiveslope indicates radially outward propagation. There is a clear trend towardsinward propagation as mi /me decreases from 6.8 �Fig. 16� through 1.0�Fig. 17� to 0.5 �this figure�.
3942 Phys. Plasmas, Vol. 7, No. 10, October 2000 Leneman, Gekelman, and Maggs
Downloaded 23 Apr 2008 to 128.97.43.195. Redistribution subject to AIP license or copyright; see http://pop.aip.org/pop/copyright.jsp
sition sampled. The wave phase was measured by fitting asine curve with phase as a free parameter to the wave mag-netic field data. This phase is then averaged over the fivespoke angles and over about a 3 cm radial interval centeredat about r�7 cm to give �m for each z position. The quantity�c is calculated according to �c��z/�vA0(1�(�/�ci)
2)1/2� , where a plane wave is assumed (k��0).The best fit to the data is a straight line with a slope of 0.97,where a slope of 1 would indicate exact agreement of mea-surement and calculation. This plot indicates that the ob-served disturbance axially propagates with the phase of ashear Alfven wave over a wide range of densities and back-ground magnetic fields.
To compare the observations with theory we considerthe radial dependence of the amplitude of the wave magneticfield. Given the symmetry of the source, and from theoreticalconsiderations, the wave radiation pattern is expected to beazimuthally symmetric. Figure 10 shows the magnitude ofthe azimuthal component of the wave magnetic field, B� , asa function of r along each of the spoke angles, at a distanceof 1.1� � from the antenna. A similar degree of azimuthalsymmetry is observed in all the cases studied. Accordinglythe data are reduced by averaging over the five spoke angles.
The observed departure from symmetry is likely due toasymmetries in the source current density which probablyarise from spatial variations in plasma density observed nearthe disks of the antenna.
Figures 11–15 show azimuthally averaged B�(r),�B�(r)� �solid line�, and the best theoretical fit to these data�dashed line� at various axial positions for the five casesstudied. Notice that the vertical scale changes as z varies. Inthe fits, ap and are free parameters. Here is treated as afree parameter because the Krook collision operator does notinclude any velocity dependence and, as such, is only a crudemodel for Coulomb collisions. The radius ap is free becausemechanical constraints made the measurement of the mag-netic field near the antenna impractial. We constrain ap tohave one value in any particular case, whereas is allowedto change axially within a case. We find that for z�� � , thetheoretical profile is much more dependent on ap than . Atfarther positions the reverse is true.
Without exception, this two-disk model produces radialprofiles which drop to zero faster than 1/r , and the radius atwhich they peak depends on ap and . This radius is com-parable to those observed in the experiments when ap isbetween 2 and 3 cm and is comparable to the values in
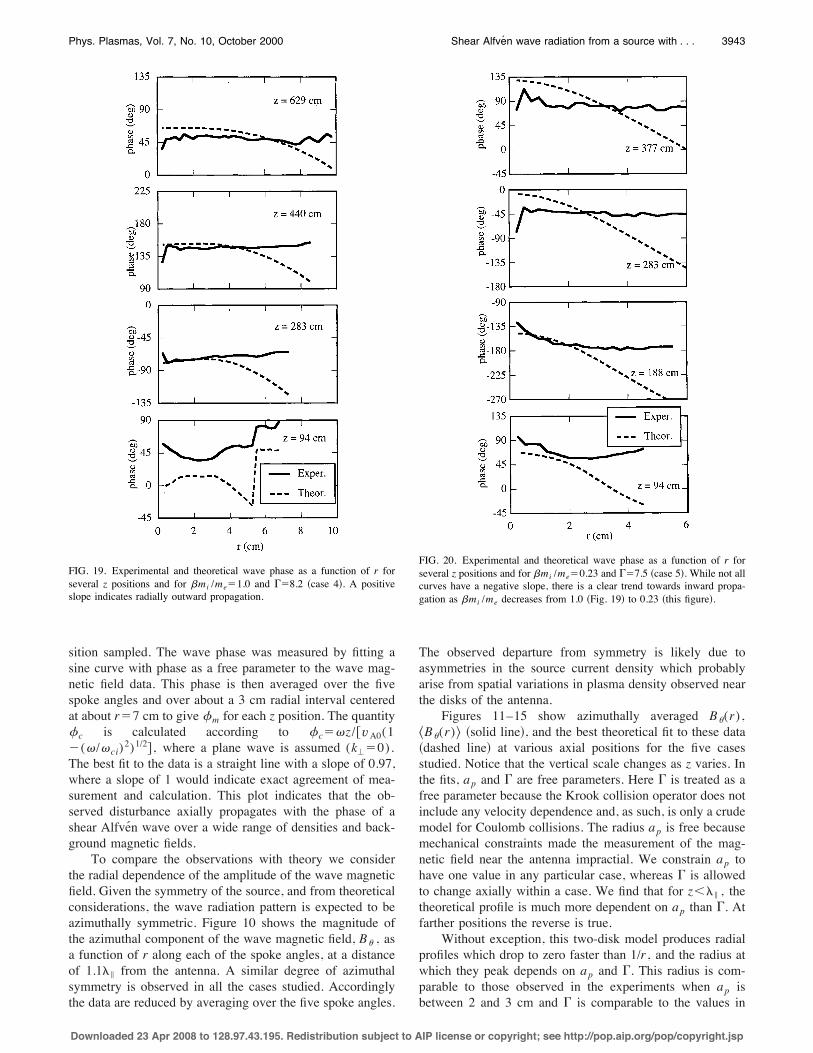
FIG. 19. Experimental and theoretical wave phase as a function of r forseveral z positions and for mi /me�1.0 and �8.2 �case 4�. A positiveslope indicates radially outward propagation.
FIG. 20. Experimental and theoretical wave phase as a function of r forseveral z positions and for mi /me�0.23 and �7.5 �case 5�. While not allcurves have a negative slope, there is a clear trend towards inward propa-gation as mi /me decreases from 1.0 �Fig. 19� to 0.23 �this figure�.
3943Phys. Plasmas, Vol. 7, No. 10, October 2000 Shear Alfven wave radiation from a source with . . .
Downloaded 23 Apr 2008 to 128.97.43.195. Redistribution subject to AIP license or copyright; see http://pop.aip.org/pop/copyright.jsp

Table I. This is an indication that the model accurately de-scribes the source. Table II shows the parameters required tomake these fits. The required values for used in the fitscorrespond reasonably well to the experimental values �seeTable I�. Only in cases 1 and 2 where z�283 cm do therequired values differ by more than a factor of 2 from theexperimental value.
Overall, the fits are reasonable for cases 2–5. In case 1,the most kinetic, no values of ap and gave satisfactory fitsfor axial positions beyond z�283 cm. The cause of this dis-crepancy may be the radial depression in Te caused by theantenna, which could have a pronounced effect in the kineticcase. Including the axial and radial variation in ne and Temay improve the theoretical model. The shapes of the pro-
files also suggest that the putative source return currentshould taper off to zero as opposed to being sharply cut off atap .
The axial decay of the wave agrees well with the predic-tions of the model used to describe the two-disk antenna. Infact, the axial decay is not very sensitive to the values of calculated on the basis of measured experimental parameters.This insensitivity arises from the antenna design. As men-tioned earlier, the wave structure is dependent on the modelparameter ap which defines the extent of the return currentsin the vicinity of the two-disk antenna. This parameter playsa key role in determining the rate of axial decay in the firstfew wavelengths and results in a rate of decay much larger
FIG. 21. Wave current density as a function of r and z calculated from thecurl of measured B at an arbitrary time and averaged over � for case 1(mi /me�6.8). �a� The magnitude of the vectors is rescaled to take outthe axial and radial decrease in amplitude. �b� The magnitude is rescaledfor the axial decrease in amplitude only so the structure where r�1 cmand z�400 cm is visible. �c� Current density calculated from theory usingthe same parameters that produce the fits for case 1 (mi /me�6.8). Thisfigure can be compared to part �a� since the vectors have been rescaledaxially and radially in the same way.
3944 Phys. Plasmas, Vol. 7, No. 10, October 2000 Leneman, Gekelman, and Maggs
Downloaded 23 Apr 2008 to 128.97.43.195. Redistribution subject to AIP license or copyright; see http://pop.aip.org/pop/copyright.jsp

than that caused by either collisional or collisionless damp-ing.
By comparing the measured radial profiles in Figs. 12and 14, the effect of different damping parameters � �1.0and 8.2� can be seen. As expected, at each axial location, theradial profile peaks at a larger r and the profile is broader forthe higher case �Fig. 14�. The rate of spreading depends on�/�ci ; but in both these cases, the ratio is the same, 0.63.
Theory predicts that the phase of the kinetic wave exhib-its outward radial propagation, while the inertial wave exhib-its inward radial propagation.16,17 confirmation of this predic-tion is illustrated in Figs. 16–20, which show the theoretical�dashed line� and azimuthally averaged experimental �solidline� radial dependence of the wave phase, �(r). The theo-retical curves are generated using the same parameters usedin the fits to the profiles discussed in Sec. III B. Figure 16shows very good agreement between theory and experimentand the measured propagation is clearly outward �in the posi-tive r direction�. In Figs. 17 and 18 the agreement is poor,but the transition away from the outward propagation of Fig.16 where mi /me is highest is evident. Figure 19 showsgood agreement between theory and experiment, but in Fig.20 there is only agreement for 0.25 cm�r�2.5 cm and zequals 94 and 188 cm. Nevertheless, there is a clear trendtowards inward �in the negative r direction� radial propaga-tion as mi /me decreases. The last column of Table I showsthe average slope of �(r), ��/�r , for all cases. The slope��/�r is taken from r�0.5 cm to the point where the am-plitude profile drops to twice the background noise level.Among cases with the same value of , the decrease in��/�r , and the trend towards negative values, as de-creases is evident.
The wave current density is calculated from the curl ofthe experimentally measured wave magnetic field. Figure21�a� shows r�j� �which is rj(r ,� ,z) averaged over �� at anarbitrary time for case 1. There are clear vortex patternswhich give a coherent picture of how the currents close. The�j� field is rescaled in z to take out the axial decay of thewave amplitude and multiplied by r to take out the radialdilution inherent to the cylindrical geometry. The rescalingin z is accomplished by normalizing �j� to its maximum am-plitude at each axial location. This technique is employed tomake it easier to see the circulation patterns. Figure 21�b�displays �j� rescaled in z only in order to show the parallelcurrent for r�2 cm. The enhanced parallel current in theregion where r is less than about 1 cm and z�400 cm cor-responds to the extra peak in �B�(r)� appearing in Fig. 11.
Figure 21�a� can be compared with Figure 21�c� whichshows the current density calculated from theory using thesame parameters that produce the fits in Fig. 11. The vectorshave been rescaled in the same way as those in Fig. 21�a�.There is surprising agreement in light of the poor fits to theradial profiles in Fig. 11.
V. CONCLUSION
From the data and calculations presented several conclu-sions can be made.
�1� Measurements of wave phase as a function of axialposition confirm that the disturbances observed in the presentexperiments are shear Alfven waves, and that their axialphase velocity satisfies the finite frequency correction givenby
vA�vA0�1���/�ci�2�1/2.
�2� The azimuthal component of the wave field is sym-metric within experimental limitations. The most likely ex-perimental reason for the asymmetries observed is variationsin plasma conditions local to the wave source. In addition,the wave magnetic field is predominantly in the azimuthaldirection.
�3� A secondary peak at smaller radius characteristic ofthe kinetic shear Alfven wave has been observed. In the mostkinetic case studied �case 1 where mi /me�6.8) the ob-served wave exhibits a peak structure in the radial profile ofB� at small r, which theory predicts to occur. The subsidiarypeaks for kinetic shear waves are predicted to only appear atlower r values than the main peak while secondary peaks forinertial waves should appear only at r values larger than thatof the main peak. Therefore the extra peak appearing in case1 inside the main peak is a distinctive mark of the kineticwave.
�4� The wave structures spread radially with increasingaxial distance from the source. For four of these five casesthe wave structure spreads at the rate predicted by theory.For case 1 �the most kinetic� it spreads faster than predicted.
�5� When is increased, the peaks of the amplitudeprofiles move radially outward and broaden.
�6� The radial propagation of the shear Alfven wave hasbeen observed. The radial phase velocity decreases in thetransition from the kinetic to the inertial regimes where theinertial wave is a radially backward wave.
All of the above statements are consistent with thesingle-disk theory by Morales et al.16,17 The following state-ments are consistent with the double-disk superpositonmodel.
�7� All observed radial profiles drop off faster than 1/r .The rapid radial decay indicates the reversal of axial currentsas the radius increases.
�8� The wave amplitude undergoes an axial decreasemore rapid than the decay expected from damping.
�9� The Alfven wave current density calculated from theobserved wave magnetic field explicitly displays oppositelyflowing axial currents. The current density field also showsthat the exterior axial currents return to the core axial cur-rents via successive radial structures to complete closed cur-rent paths which lie within half a parallel wavelength.
ACKNOWLEDGMENTS
This work was supported by the Office of Naval Re-search and the National Science Foundation �ATM�. The au-thors gratefully acknowledge valuable discussions with Dr.George Morales and Dr. Steven Vincena.
1J. Piddington, Sol. Phys. 38, 465 �1974�.2J. Hollweg, M. Bird, H. Volland, P. Edenhofer, C. Stelzried, and B. Seidel,J. Geophys. Res. 87, 1 �1982�.
3945Phys. Plasmas, Vol. 7, No. 10, October 2000 Shear Alfven wave radiation from a source with . . .
Downloaded 23 Apr 2008 to 128.97.43.195. Redistribution subject to AIP license or copyright; see http://pop.aip.org/pop/copyright.jsp

3D. Hayward and J. Dungey, Planet. Space Sci. 31, 579 �1983�.4V. Chmyrev, S. Bilichenko, O. Pokhotelov, V. Marchenko, V. Lararev, A.Streltsov, and L. Stenflo, J. Geophys. Res. 38, 841 �1988�.5S. J. Zweben, C. R. Menyuk, and R. J. Taylor, Phys. Rev. Lett. 42, 1270�1979�.6B. D. Fried, G. J. Morales, and R. J. Taylor, Bull. Am. Phys. Soc. 36, 2499�1991�.7A. Hasegawa, Proc. J. Geophys. Res. 81, 5083 �1976�.8R. Lysak and W. Lotko, J. Geophys. Res. 101, 5085 �1996�.9C. Geortz and R. Boswell, J. Geophys. Res. 84, 7239 �1979�.10R. Lysak and C. Carlson, Geophys. Res. Lett. 8, 269 �1981�.11R. Lundin, L. Eliasson, G. Herendel, M. Boehm, and B. Holback, Geo-phys. Res. Lett. 21, 1903 �1994�.
12J. P. McFadden, C. W. Carlson, and M. H. Boehm, J. Geophys. Res. 95,6533 �1990�.
13J. E. Borovsky, J. Geophys. Res. 98, 6101 �1993�.14H. Luhr, J. Warnecke, L. J. Zanetti, P. A. Lindqvist, and T. J. Hughes,Geophys. Res. Lett. 21, 1883 �1994�.
15R. Cross, An Introduction to Alfven Waves �A Hilger, Bristol, England,1988�.
16G. J. Morales, R. S. Loritsch, and J. E. Maggs, Phys. Plasmas 1, 3765�1994�.
17G. J. Morales and J. E. Maggs, Phys. Plasmas 4, 4118 �1997�.18M. Ono, Phys. Rev. Lett. 42, 1267 �1979�.19G. Borg, M. Brennan, R. Cross, L. Giannone, and I. Donnelly, PlasmaPhys. Controlled Fusion 27, 1125 �1985�.
20W. Gekelman, D. Leneman, J. Maggs, and S. Vincena, Phys. Plasmas 1,3775 �1994�.
21F. S. Mozer, C. W. Carlson, M. K. Hudson, R. B. Torbert, B. Parady, andJ. Yatteau, Phys. Rev. Lett. 38, 292 �1977�.
22B. Fried and S. Conte, The Plasma Dispersion Function �Academic, NewYork, 1961�.
23W. Gekelman, H. Pfister, Z. Lucky, J. Bamber, D. Leneman, and J.Maggs, Rev. Sci. Instrum. 62, 2875 �1991�.
24L. S. Nergaard, RCA Rev. 13, 464 �1952�.25W. Gekelman, S. Vincena, D. Leneman, and J. Maggs, J. Geophys. Res.102, 7225 �1997�.
26R. H. Lovberg, in Plasma Diagnostic Techniques, edited by R. H. Huddle-stone and S. L. Leonard �Academic, New York, 1965�, p. 75.
27R. A. Koch and W. Horton, Jr., Phys. Fluids 18, 861 �1975�.
3946 Phys. Plasmas, Vol. 7, No. 10, October 2000 Leneman, Gekelman, and Maggs
Downloaded 23 Apr 2008 to 128.97.43.195. Redistribution subject to AIP license or copyright; see http://pop.aip.org/pop/copyright.jsp