shear behavior of high- strength self-consolidating … journal...the factors that affect the shear...
TRANSCRIPT
31PCI Journal | May–June 2016
Self-consolidating concrete (SCC) has been gain-ing popularity since its development in Japan in the late 1980s.1 In the transportation industry, its
unique properties led to the development of more efficient cross sections for long-span bridges, reducing the need for intermediate supports and cutting construction costs. However, longer spans cause higher web-shear stresses near supports.
For SCC, reductions in coarse aggregate content and size theoretically reduce the aggregate interlock component of the concrete’s shear strength. This could cause lower design shear strengths in prestressed concrete elements. By investigating the structural performance of SCC, designers can feel more comfortable taking advantage of the eco-nomic benefits associated with SCC. This leads to more efficient use of materials in design and safer work environ-ments at precast concrete manufacturing facilities.
This study consisted of the full-scale implementation of high-strength SCC, SCC, and high-volume fly ash concrete in a three-span continuous precast, prestressed concrete bridge near Linn, Mo.2 Following the completion and evaluation of the shear testing, construction commenced on the bridge in the summer of 2013.
■ Self-consolidating concrete (SCC) typically contains a lower coarse aggregate content and size than conventional concrete, which potentially hinders the aggregate interlock contribution to a concrete’s shear strength.
■ Current reinforced and prestressed concrete design equations, which were developed for conventional concrete elements, were verified with two full-scale precast, prestressed concrete Nebraska University girders to assess the shear behavior of high-strength SCC.
■ The girders exceeded the predicted factored concrete shear resistance from current U.S. design standards.
Shear behavior of high-strength self-consolidating concrete in Nebraska University bridge girders
Alex Griffin and John J. Myers
May–June 2016 | PCI Journal32
MI
yf f fcre
t
c pe d=
+ −( )6λ '
(22.5.8.3.2)
where
λ = modification factor for lightweight concrete
fc' = specified compressive strength of concrete
bw = web width of the section
dp = effective depth, defined as the distance from the extreme compression fiber to the centroid of the prestressing steel
Vd = shear force at section due to unfactored dead load
Vi = factored shear force at section due to externally applied loads
Mcre = moment causing flexural cracking at section due to externally applied loads
Mmax = maximum factored moment at section due to ex-ternally applied loads
fpc = compressive stress in concrete at centroid of cross section
Vp = vertical component of effective prestress force at section
I = moment of inertia of section about centroidal axis
yt = distance from centroid of section to tension face
fpe = compressive stress in concrete due to effective prestress at extreme fiber where externally applied loads induce tensile stresses
fd = stress due to unfactored dead load at extreme fiber where externally applied loads induce tensile stresses
The concrete contribution to shear strength Vc is the lesser of flexure-shear strength Vci and web-shear strength Vcw. When the concrete alone cannot carry the shear load, the additional required shear strength is carried through the shear reinforcement and is calculated following Eq. (22.5.10.5.3).3 ACI 318-14 cites a critical section to investigate shear at a distance of h/2 from the point of sup-port, where h is the overall depth of the member.
V
A f d
ssv y=
(22.5.10.5.3)
Shear design practices
Shear behavior in reinforced and prestressed concrete is still not a well-understood phenomenon. In contrast to the mechanics-based approach to the flexural response of reinforced and prestressed concrete members, shear failures can be quite difficult to predict due to the numer-ous factors that contribute to shear strength. All prediction equations, such as in the American Concrete Institute’s (ACI’s) Building Code Requirements for Structural Con‑crete (ACI 318‑14) and Commentary (ACI 318R‑14)3 and the American Association of State Highway and Transpor-tation Officials’ AASHTO LRFD Bridge Design Specifi‑cations,4 are based, at least to some extent, on empirical relationships.
The factors that affect the shear strength of reinforced and prestressed concrete members are discussed in the 1999 ACI–American Society of Civil Engineers (ASCE) 445 report.5 It cites six mechanisms that contribute to the shear strength of a concrete member:
• uncracked concrete in the flexural compression zone
• interface shear transfer, also referred to as aggregate interlock
• dowel action from the longitudinal reinforcement
• arch action, in which the load is funneled to the adja-cent support via a direct compression strut, for shear span–to–depth ratios a/d lower than approximately 1.0
• residual tensile stresses across hairline cracks less than 0.006 in. (0.15 mm) and between cracks
• tensile force from the transverse shear reinforcement
For a traditional SCC mixture, in which the coarse ag-gregate size and content are less than that of conventional concrete, it may be reasonable to expect that the interface shear transfer mechanism may be negatively affected. Shear testing on a variety of SCC mixtures is necessary to quantitatively evaluate this difference.
The current ACI 318-14 approach to predict the shear strength of prestressed concrete members is summarized in Eq. (22.5.8.3.1a) to (22.5.8.3.2).3
V f b d V
V M
Mci c w p di cre= + +
0 6. 'λ
max (22.5.8.3.1a)
V f f b d Vcw c pc w p p= +( ) +3.5λ ' .0 3 (22.5.8.3.1c)
33PCI Journal | May–June 2016
Vu = factored shear force at section
Aps = area of prestressing steel
fpo = stress in prestressing steel, defined as the prestress-ing steel modulus of elasticity multiplied by the locked-in difference in strain between the prestress-ing steel and the surrounding concrete
Es = modulus of elasticity of reinforcing bars
As = area of nonprestressed tension reinforcement
Ep = modulus of elasticity of prestressing steel
The applied moment, axial load, and prestressing force influence the net longitudinal strain. Two different equa-tions are used to determine β, depending on the presence of transverse reinforcement. Equation (5.8.3.4.2-1) is used with shear reinforcement, while Eq. (5.8.3.4.2-2) is used without shear reinforcement.
β =
+( )4 8
1 750
.
sε (5.8.3.4.2-1)
β
ε=
+( ) +4 8
1 750
51
39
.
( )s xes (5.8.3.4.2-2)
where
sxe = effective value of sx which allows for the influence of aggregate size
sx = crack spacing parameter
When transverse reinforcement is not included, as was the case during the second test, an effective crack spacing parameter sxe (Eq. [5.8.3.4.2-5]) is included to account for the spacing of longitudinal reinforcement and maximum aggregate size ag; it is to be taken not less than 12.0 in. (305 mm) nor greater than 80.0 in. (2030 mm).
s saxe xg
=+
1 38
0 63
.
.
(5.8.3.4.2-5)
Unlike the ACI 318-14 provisions, in the AASHTO LRFD specifications, the shear reinforcement’s contribution to the shear strength of the member (Eq. [C5.8.3.3-1]) is a func-tion of the angle of inclination of diagonal compressive stresses θ (Eq. [5.8.3.4.2-3]). The ACI 318-14 equation assumes the diagonal shear cracks form a 45-degree angle with the horizontal; however, when an axial prestress-ing force is applied, the diagonal shear crack forms at an angle less than 45 degrees. Thus, the shear reinforcement’s
where
Vs = nominal shear strength provided by shear reinforcement
Av = area of shear reinforcement with spacing s
fy = specified yield strength of reinforcement
d = distance from extreme compression fiber to centroid of longitudinal tension reinforcement
s = center-to-center spacing of transverse reinforcement
The AASHTO LRFD specifications predict the shear strength carried by the concrete following a simplified version of the modified compression field theory.4 This theory uses the conditions of equilibrium, compatibility, and the stress-strain relationships of the reinforcement and the diagonally cracked concrete to predict the shear response.6
The concrete contribution to shear following the general procedure is calculated using Eq. (5.8.3.3-3).
V f b dc c v v= 0 0316. 'β (5.8.3.3-3)
where
β = factor relating the effect of the longitudinal strain on the shear capacity of the concrete, as indicated by the ability of diagonally cracked concrete to transmit tension
bv = effective web width
dv = effective shear depth; distance between tensile and compressive resultant forces due to flexure
The factor β depends on the net longitudinal strain at the section at the centroid of the longitudinal reinforcement εs (Eq. [5.8.3.4.2-4]).
ε s
u
vu u p ps po
s s p ps
M
dN V V A f
E A E A=
+ + − −
+
0 5.
(5.8.3.4.2-4)
where
Mu = factored moment at the section
Nu = applied factored axial force (positive for tension)
May–June 2016 | PCI Journal34
et al.7 and Kim et al.8 conducted push-off tests with SCC and high-strength SCC specimens against conventional concrete mixtures of similar compressive strengths. The push-off test is a small-scale concrete test that allows the researcher to determine the shear stress that can be carried across a crack for a given concrete mixture. The results from both studies are summarized here.
Myers et al. reported that the coarse aggregate fraction and concrete type (high-strength SCC compared with HSC) had little impact on the shear resistance of the specimens for the mixtures they investigated. They found reduced shear stresses for a given crack opening for higher-strength concretes. At higher compressive strengths, the crack prop-agated through the limestone aggregate, rather than around the aggregate. The researchers noted no distinguishable difference in shear stress at a given crack opening between the high-strength SCC and HSC mixtures for a given ag-gregate type. Because the only significant variable be-tween high-strength SCC and HSC is the coarse aggregate content (10% difference in coarse aggregate content in the Myers et al. study), the volume of coarse aggregate had a negligible effect on the observed shear stress between the two mixtures in the range of aggregate contents studied. The most distinguishable findings related to the aggregate type. The limestone aggregate carried significantly less shear stress across a crack opening than the investigated river gravel did, a result of the reduced stiffness of lime-stone aggregates. This difference in aggregate strength caused the formation of cracks around the river gravel but through the limestone. Thus, the river gravel exhibited greater aggregate interlock.7
Kim et al. observed similar trends regarding push-off tests of high- and lower-strength SCC and conventional concrete mixtures. Push-off tests revealed a decreasing contribution of aggregate interlock at high compressive-strength levels and an increased contribution of river gravel over limestone aggregates. Unlike in the Myers et al. study, Kim et al. found statistically significant data showing that for the investigated aggregates, the volume of coarse aggregate influenced the contribution of aggregate inter-lock. In addition, the researchers noted a lower fraction reduction factor c and a lower friction coefficient µ for high-strength SCC compared with HSC at maximum shear stress for the mixtures investigated. The fraction reduction factor accounts for the reduced contact area at a crack due to particle fracturing resulting from the smaller volume of coarse aggregate in the high-strength SCC mixture.8
Shear tests on high-strength SCC
Results of shear tests among SCC mixtures can show some degree of variability. Not all SCC mixtures are identical. The coarse aggregate size and content vary among con-crete mixtures and a wide range of aggregate types (and corresponding stiffnesses) are found across the globe. As
predicted contribution to the shear strength will be larger according to the AASHTO LRFD specifications.
V
A f d
ssv y v=
cotθ
(C5.8.3.3-1)
θ ε= +29 3500 s (5.8.3.4.2-3)
High-strength self-consolidating concrete
SCC is a highly flowable nonsegregating concrete that can spread into place, fill formwork, and encapsulate reinforce-ment without any mechanical consolidation.1 It has been documented to reduce costs associated with fabrication and long-term maintenance, expedite the construction process, and provide a safer work environment at precast concrete facilities.1 Because mechanical vibration is not required, there is a reduction in labor cost and a reduced risk of employee injury. In the case of high-strength SCC, there is the additional benefit of increased durability due to the lower water–cementitious materials ratio w/cm and the lack of mechanical vibration.7
Traditionally, SCC incorporates aggregate size and content modifications in conjunction with high-range water-reduc-ing admixtures and/or viscosity-modifying admixtures to produce a flowable, nonsegregating concrete. However, reductions in coarse aggregate size and proportions com-bined with an increase in paste content may affect some mechanical properties, namely the modulus of elasticity, creep, and shrinkage compared with conventional concrete. The effects on these mechanical properties can lead to increased deflections and prestress losses in pretensioned elements. These material modifications coupled with a lower w/cm theoretically decrease the interface shear trans-fer contribution to the concrete’s shear strength. This leads to additional concerns when implementing high-strength SCC.
Lower coarse aggregate levels may affect the ability of the concrete to transmit shear stresses through aggregate interlock. Furthermore, Kim et al. wrote that when weaker limestone aggregates are used in a high-strength concrete (HSC) application, the shear failure plane can propagate through the aggregate particles rather than at the paste-aggregate interface zone.8 Consequently, the contribution to shear strength from aggregate interlock is expected to be negatively affected in high-strength SCC compared with regular-strength SCC mixtures.
Case studies of high-strength SCC in push-off tests
To examine the difference in shear friction behavior between conventional concrete and SCC mixtures, Myers

35PCI Journal | May–June 2016
reported by Myers et al. and Kim et al., the aggregate stiff-ness plays a large role in a concrete’s shear resistance.7,8 Myers et al. also reported coarse aggregate contents as low as 30% by weight of total aggregate at some precast con-crete manufacturers in the United States, while this study investigated a coarse aggregate content of 48%.7 Thus, one would not expect these two SCC mixtures to exhibit simi-lar results in shear. Despite the lack of uniformity among SCC mixtures, it is important to recognize the current shear strength trends in both reinforced concrete and precast/pre-stressed concrete beams fabricated with SCC.
Hassan et al. reported that reinforced SCC beams had a diminishing shear resistance and ductility compared with their conventional-slump concrete counterparts. Their beams consisted of 3⁄8 in. (9.53 mm) crushed limestone with coarse aggregate contents (by weight of total ag-gregate) of 49% and 61% for the SCC and conventional concrete mixtures, respectively.9 Lin and Chen found that for an equivalent coarse aggregate content, SCC beams had increased shear resistance; however, for typical SCC beams in which the coarse aggregate content is lower than that of a conventional concrete mixture at a given com-pressive strength, the shear resistance was found to be less than the conventional concrete beam.10 Thus, the coarse aggregate content was a significant factor in the ultimate shear strength. Their investigated coarse aggregate contents (by weight of total aggregate) ranged from 55% for the conventional concrete beams to 46% for the SCC beams. The aggregate type was not specified; however, the coarse aggregate size was 3⁄8 in.10 In reinforced concrete beams, these two sets of shear tests found the shear strength of SCC to be less than that of conventional concrete.
Myers et al. conducted shear tests on midsized precast, prestressed rectangular beams.7 The tests included high- and lower-strength SCC and conventional concrete beams for a total of four specimens. The rectangular beams were 8 × 16 in. (200 × 410 mm) without web reinforcement with a span-to-depth ratio a/d of 3.75. The percentage of coarse aggregate content for the mixtures varied from 48% for SCC to 58% for conventional concrete. Locally avail-able Missouri coarse aggregates were investigated. The SCC and high-strength SCC beams experienced increased deflections over the conventional-slump concrete beams, partly attributed to the lower modulus of elasticity reported in the SCC mixtures. The failure loads for the high-strength SCC beams exceeded the failure loads predicted by ACI 318-14, the AASHTO LRFD specifications, and finite element model software on the order of 50% to 70%. The normalized shear stress at failure for the high-strength SCC beams slightly outperformed that of the HSC mixtures. The two SCC beams exhibited less variation at ultimate failure loads than the conventional concrete beams.7
Full-scale structural performance testing on AASHTO LRFD specifications Type II girders with web reinforce-
ment was completed by Khayat and Mitchell as part of the National Cooperative Highway Research Project (NCHRP) report 628.11 Four girders were fabricated from 8000 and 10,000 psi (55 and 69 MPa) SCC as well as conventional concrete. Both mixtures contained 1⁄2 in. (13 mm) crushed aggregate with coarse aggregate contents ranging from 46% to 53% for the respective 8000 psi and 10,000 psi SCC mixtures to 58% to 59% for the 8000 psi and 10,000 psi conventional concrete mixtures, respectively. The researchers noted the following in terms of shear performance:
• all four girders exceeded the nominal shear resistance according to the AASHTO LRFD specifications
• the high-strength SCC maximum shear load was 6.5% less than that of the 10,000 psi (69 MPa) conventional concrete girder
• both the HSC and high-strength SCC girders experi-enced initial shear cracking at similar loads
• the high-strength SCC girders exhibited less deflection prior to shear failure compared with the other investi-gated mixtures11
The reduced deflection ductility and shear resistance associated with the SCC mixtures was attributed to the reduction in coarse aggregate volume, thereby reducing the energy-absorbing characteristic of aggregate interlock.11
Labonte tested a collection of AASHTO LRFD speci-fications Type II girders to assess their structural per-formance.12 Two girders were fabricated to be tested in shear, one with SCC and one with conventional-slump concrete. Both girders were tested with shear reinforce-ment and contained 3⁄4 in. (19 mm) coarse aggregate at 48% by weight of total aggregate. The cylinder compres-sive strength at the time of the testing was 10,000 and 7500 psi (69 and 52 MPa) for the SCC and conventional concrete girder, respectively. The researcher observed that the conventional concrete girder outperformed the SCC girder in shear by 8.7% despite the higher compres-sive strength of the SCC girder. The SCC girder still exceeded the estimates of ACI 318-14 and the AASHTO LRFD specifications by at least 50%.12
The aforementioned results indicate that, depending on the mixture constituents, SCC mixtures exhibit lower shear stresses at failure than conventional concrete mixtures at similar compressive strengths. The results, however, can vary significantly with the type, size, and content of the coarse aggregate, as reported in Myers et al.’s study.7 Two researchers were identified who tested full-scale SCC bridge girders in shear. However, these tests included the effects of shear reinforcement. This study aims to bridge the gap by providing a benchmark for the shear strength of
May–June 2016 | PCI Journal36
full-scale precast high-strength SCC bridge girders without shear reinforcement.
Research methodology
Two Nebraska University (NU) 53 girders were inves-tigated, identified as girder 1 and girder 2, and both welded-wire reinforcement and mild steel bars were examined as the primary method of shear reinforcement in half of each girder. The first test was conducted on the half with web reinforcement, and the second test was conducted on the section without web reinforcement. After delivery of the girders, a 6 in. (150 mm) thick composite cast-in-place concrete deck was placed to simulate a road deck.
Girder description
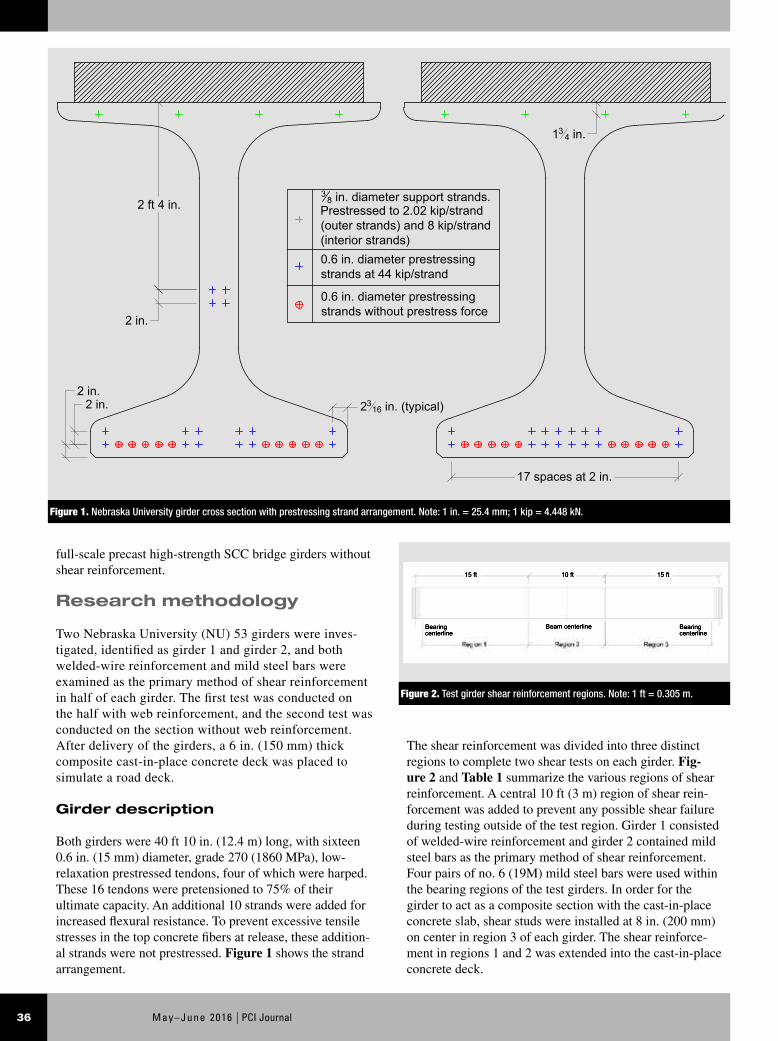
Both girders were 40 ft 10 in. (12.4 m) long, with sixteen 0.6 in. (15 mm) diameter, grade 270 (1860 MPa), low-relaxation prestressed tendons, four of which were harped. These 16 tendons were pretensioned to 75% of their ultimate capacity. An additional 10 strands were added for increased flexural resistance. To prevent excessive tensile stresses in the top concrete fibers at release, these addition-al strands were not prestressed. Figure 1 shows the strand arrangement.
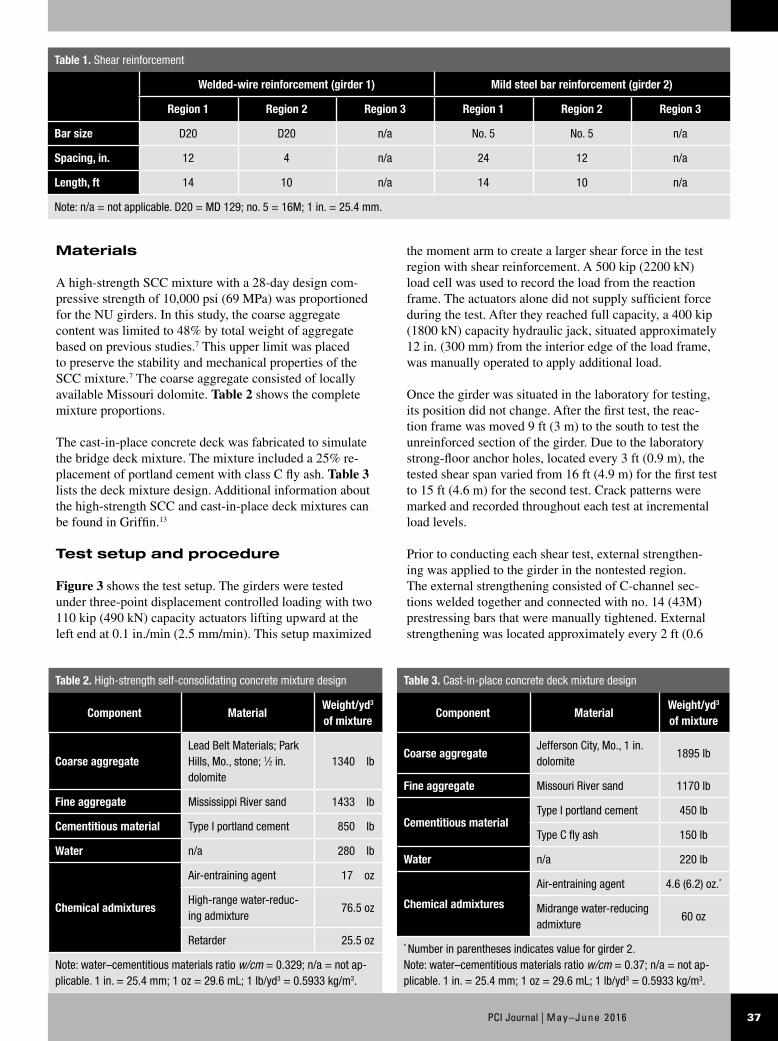
The shear reinforcement was divided into three distinct regions to complete two shear tests on each girder. Fig-ure 2 and Table 1 summarize the various regions of shear reinforcement. A central 10 ft (3 m) region of shear rein-forcement was added to prevent any possible shear failure during testing outside of the test region. Girder 1 consisted of welded-wire reinforcement and girder 2 contained mild steel bars as the primary method of shear reinforcement. Four pairs of no. 6 (19M) mild steel bars were used within the bearing regions of the test girders. In order for the girder to act as a composite section with the cast-in-place concrete slab, shear studs were installed at 8 in. (200 mm) on center in region 3 of each girder. The shear reinforce-ment in regions 1 and 2 was extended into the cast-in-place concrete deck.
Figure 1. Nebraska University girder cross section with prestressing strand arrangement. Note: 1 in. = 25.4 mm; 1 kip = 4.448 kN.
17 spaces at 2 in.
2 in.
2 ft 4 in.
2 in.2 in. 23
16 in. (typical)
38 in. diameter support strands.
Prestressed to 2.02 kip/strand(outer strands) and 8 kip/strand(interior strands)0.6 in. diameter prestressingstrands at 44 kip/strand
0.6 in. diameter prestressingstrands without prestress force
134 in.
Figure 2. Test girder shear reinforcement regions. Note: 1 ft = 0.305 m.
㔀 昀琀 㔀 昀琀 昀琀
䈀攀愀洀 挀攀渀琀攀爀氀椀渀攀 䈀攀愀爀椀渀最挀攀渀琀攀爀氀椀渀攀
䈀攀愀爀椀渀最 挀攀渀琀攀爀氀椀渀攀
37PCI Journal | May–June 2016
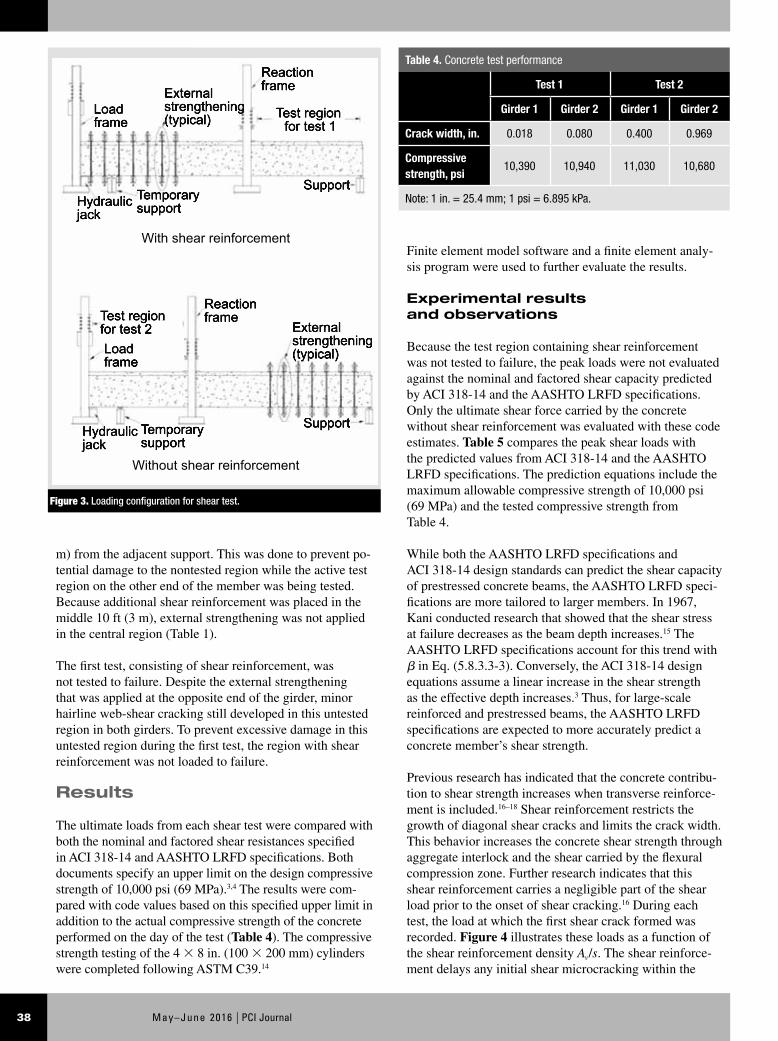
the moment arm to create a larger shear force in the test region with shear reinforcement. A 500 kip (2200 kN) load cell was used to record the load from the reaction frame. The actuators alone did not supply sufficient force during the test. After they reached full capacity, a 400 kip (1800 kN) capacity hydraulic jack, situated approximately 12 in. (300 mm) from the interior edge of the load frame, was manually operated to apply additional load.
Once the girder was situated in the laboratory for testing, its position did not change. After the first test, the reac-tion frame was moved 9 ft (3 m) to the south to test the unreinforced section of the girder. Due to the laboratory strong-floor anchor holes, located every 3 ft (0.9 m), the tested shear span varied from 16 ft (4.9 m) for the first test to 15 ft (4.6 m) for the second test. Crack patterns were marked and recorded throughout each test at incremental load levels.
Prior to conducting each shear test, external strengthen-ing was applied to the girder in the nontested region. The external strengthening consisted of C-channel sec-tions welded together and connected with no. 14 (43M) prestressing bars that were manually tightened. External strengthening was located approximately every 2 ft (0.6
Table 1. Shear reinforcement
Welded-wire reinforcement (girder 1) Mild steel bar reinforcement (girder 2)
Region 1 Region 2 Region 3 Region 1 Region 2 Region 3
Bar size D20 D20 n/a No. 5 No. 5 n/a
Spacing, in. 12 4 n/a 24 12 n/a
Length, ft 14 10 n/a 14 10 n/a
Note: n/a = not applicable. D20 = MD 129; no. 5 = 16M; 1 in. = 25.4 mm.
Materials
A high-strength SCC mixture with a 28-day design com-pressive strength of 10,000 psi (69 MPa) was proportioned for the NU girders. In this study, the coarse aggregate content was limited to 48% by total weight of aggregate based on previous studies.7 This upper limit was placed to preserve the stability and mechanical properties of the SCC mixture.7 The coarse aggregate consisted of locally available Missouri dolomite. Table 2 shows the complete mixture proportions.
The cast-in-place concrete deck was fabricated to simulate the bridge deck mixture. The mixture included a 25% re-placement of portland cement with class C fly ash. Table 3 lists the deck mixture design. Additional information about the high-strength SCC and cast-in-place deck mixtures can be found in Griffin.13
Test setup and procedure
Figure 3 shows the test setup. The girders were tested under three-point displacement controlled loading with two 110 kip (490 kN) capacity actuators lifting upward at the left end at 0.1 in./min (2.5 mm/min). This setup maximized
Table 3. Cast-in-place concrete deck mixture design
Component MaterialWeight/yd3 of mixture
Coarse aggregateJefferson City, Mo., 1 in. dolomite
1895 lb
Fine aggregate Missouri River sand 1170 lb
Cementitious materialType I portland cement 450 lb
Type C fly ash 150 lb
Water n/a 220 lb
Chemical admixtures
Air-entraining agent 4.6 (6.2) oz.*
Midrange water-reducing admixture
60 oz
* Number in parentheses indicates value for girder 2. Note: water–cementitious materials ratio w/cm = 0.37; n/a = not ap-plicable. 1 in. = 25.4 mm; 1 oz = 29.6 mL; 1 lb/yd3 = 0.5933 kg/m3.
Table 2. High-strength self-consolidating concrete mixture design
Component MaterialWeight/yd3 of mixture
Coarse aggregateLead Belt Materials; Park Hills, Mo., stone; 1⁄2 in. dolomite
1340 lb
Fine aggregate Mississippi River sand 1433 lb
Cementitious material Type I portland cement 850 lb
Water n/a 280 lb
Chemical admixtures
Air-entraining agent 17 oz
High-range water-reduc-ing admixture
76.5 oz
Retarder 25.5 oz
Note: water–cementitious materials ratio w/cm = 0.329; n/a = not ap-plicable. 1 in. = 25.4 mm; 1 oz = 29.6 mL; 1 lb/yd3 = 0.5933 kg/m3.
May–June 2016 | PCI Journal38
Finite element model software and a finite element analy-sis program were used to further evaluate the results.
Experimental results and observations
Because the test region containing shear reinforcement was not tested to failure, the peak loads were not evaluated against the nominal and factored shear capacity predicted by ACI 318-14 and the AASHTO LRFD specifications. Only the ultimate shear force carried by the concrete without shear reinforcement was evaluated with these code estimates. Table 5 compares the peak shear loads with the predicted values from ACI 318-14 and the AASHTO LRFD specifications. The prediction equations include the maximum allowable compressive strength of 10,000 psi (69 MPa) and the tested compressive strength from Table 4.
While both the AASHTO LRFD specifications and ACI 318-14 design standards can predict the shear capacity of prestressed concrete beams, the AASHTO LRFD speci-fications are more tailored to larger members. In 1967, Kani conducted research that showed that the shear stress at failure decreases as the beam depth increases.15 The AASHTO LRFD specifications account for this trend with β in Eq. (5.8.3.3-3). Conversely, the ACI 318-14 design equations assume a linear increase in the shear strength as the effective depth increases.3 Thus, for large-scale reinforced and prestressed beams, the AASHTO LRFD specifications are expected to more accurately predict a concrete member’s shear strength.
Previous research has indicated that the concrete contribu-tion to shear strength increases when transverse reinforce-ment is included.16–18 Shear reinforcement restricts the growth of diagonal shear cracks and limits the crack width. This behavior increases the concrete shear strength through aggregate interlock and the shear carried by the flexural compression zone. Further research indicates that this shear reinforcement carries a negligible part of the shear load prior to the onset of shear cracking.16 During each test, the load at which the first shear crack formed was recorded. Figure 4 illustrates these loads as a function of the shear reinforcement density Av/s. The shear reinforce-ment delays any initial shear microcracking within the
m) from the adjacent support. This was done to prevent po-tential damage to the nontested region while the active test region on the other end of the member was being tested. Because additional shear reinforcement was placed in the middle 10 ft (3 m), external strengthening was not applied in the central region (Table 1).
The first test, consisting of shear reinforcement, was not tested to failure. Despite the external strengthening that was applied at the opposite end of the girder, minor hairline web-shear cracking still developed in this untested region in both girders. To prevent excessive damage in this untested region during the first test, the region with shear reinforcement was not loaded to failure.
Results
The ultimate loads from each shear test were compared with both the nominal and factored shear resistances specified in ACI 318-14 and AASHTO LRFD specifications. Both documents specify an upper limit on the design compressive strength of 10,000 psi (69 MPa).3,4 The results were com-pared with code values based on this specified upper limit in addition to the actual compressive strength of the concrete performed on the day of the test (Table 4). The compressive strength testing of the 4 × 8 in. (100 × 200 mm) cylinders were completed following ASTM C39.14
Table 4. Concrete test performance
Test 1 Test 2
Girder 1 Girder 2 Girder 1 Girder 2
Crack width, in. 0.018 0.080 0.400 0.969
Compressive strength, psi
10,390 10,940 11,030 10,680
Note: 1 in. = 25.4 mm; 1 psi = 6.895 kPa.
Figure 3. Loading configuration for shear test.
䠀礀搀爀愀甀氀椀挀樀愀挀欀
吀攀猀琀 爀攀最椀漀渀 昀漀爀 琀攀猀琀 ㈀
吀攀猀琀 爀攀最椀漀渀 昀漀爀 琀攀猀琀
䰀漀愀搀昀爀愀洀攀
刀攀愀挀琀椀漀渀昀爀愀洀攀
刀攀愀挀琀椀漀渀昀爀愀洀攀
䠀礀搀爀愀甀氀椀挀樀愀挀欀
吀攀洀瀀漀爀愀爀礀猀甀瀀瀀漀爀琀
吀攀洀瀀漀爀愀爀礀猀甀瀀瀀漀爀琀
䰀漀愀搀 昀爀愀洀攀
䔀砀琀攀爀渀愀氀猀琀爀攀渀最琀栀攀渀椀渀最⠀琀礀瀀椀挀愀氀⤀
䔀砀琀攀爀渀愀氀猀琀爀攀渀最琀栀攀渀椀渀最⠀琀礀瀀椀挀愀氀⤀
匀甀瀀瀀漀爀琀
匀甀瀀瀀漀爀琀
With shear reinforcement
Without shear reinforcement

39PCI Journal | May–June 2016
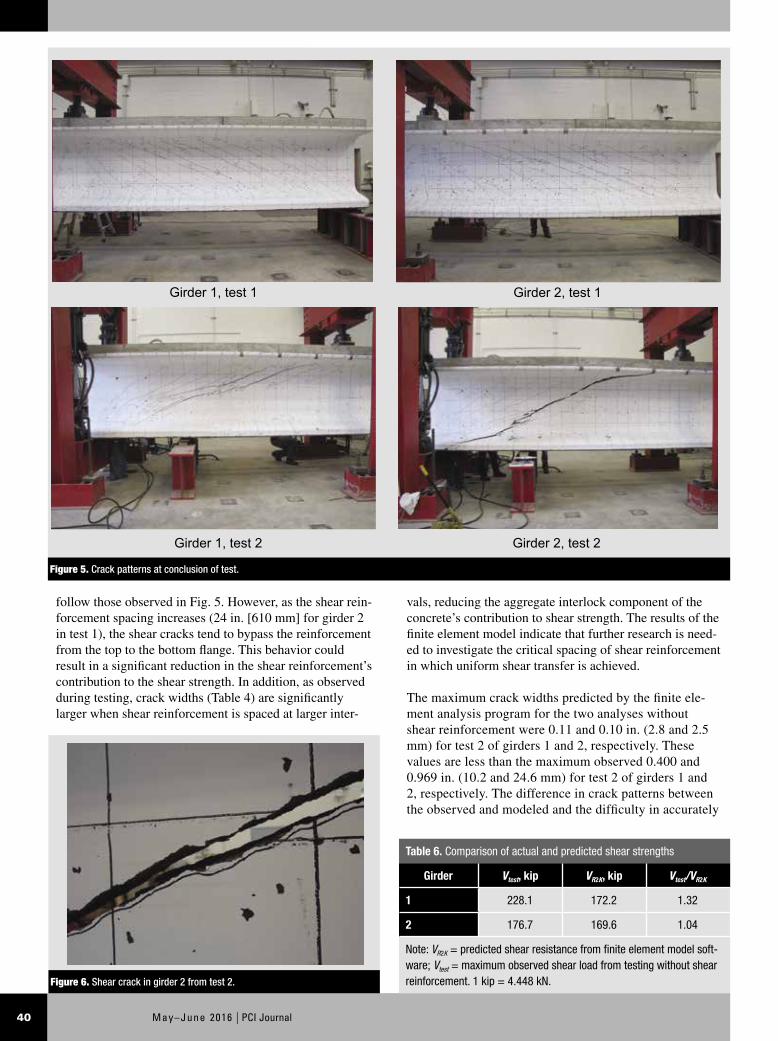
marily of a few web-shear cracks due to the lower ultimate load at the conclusion of the test. Both girders failed as a result of excessive principal tensile stresses in the web. As the load increased, the initial web-shear cracks propagated through the upper and lower flanges toward the supports. Girder 2 failed in a more brittle manner, which is evident due to the increased crack width at failure (Table 4). At the conclusion of test 2, the shear crack surface of girder 2 was examined. The crack was relatively smooth, passing through the coarse aggregate particles (Fig. 6).
Modeling comparisons
The finite element modeling software used in this study is a sectional analysis tool derived from the modified com-pression field theory to predict the response of reinforced and prestressed concrete beams and columns.19 The results are expected to predict the shear capacity more accurately than the AASHTO LRFD specifications equations because the AASHTO LRFD specifications model is a simpli-fied version of the modified compression field theory and contains boundary values for several of the variables.4 The program has been shown to be an accurate prediction model for the shear response of prestressed concrete.20
Because the tests with shear reinforcement were not tested to failure, the results of the finite element modeling analysis were focused on the tests without shear reinforce-ment. Table 6 lists the actual and predicted shear capacity of girders 1 and 2 for test 2. The finite element modeling estimate of the shear strength is highly dependent on the tensile strength of the concrete. Numerous factors contrib-ute to the tensile strength of concrete, causing significant variability at a given compressive strength. These include w/cm, type of cement, type of aggregate, quality of mixture water, curing conditions, age of concrete, maturity of con-crete, and rate of loading.21
For a compressive strength of 10,000 psi (69 MPa), the de-fault estimated tensile strength in the finite element model-ing software is 355 psi (2.45 MPa). An increase of the tensile strength to, for example, 500 psi (3.4 MPa) leads to a shear capacity of 201 kip (895 kN), an increase of 17%. Consequently, the tensile strength estimate in the finite ele-ment modeling software could contribute to the difference between the tested and predicted shear strengths.
A nonlinear finite element analysis program specializing in reinforced and prestressed concrete was used to evalu-ate the qualitative results of the testing, specifically crack patterns and the effect of varying the coarse aggregate size in the high-strength SCC mixture.
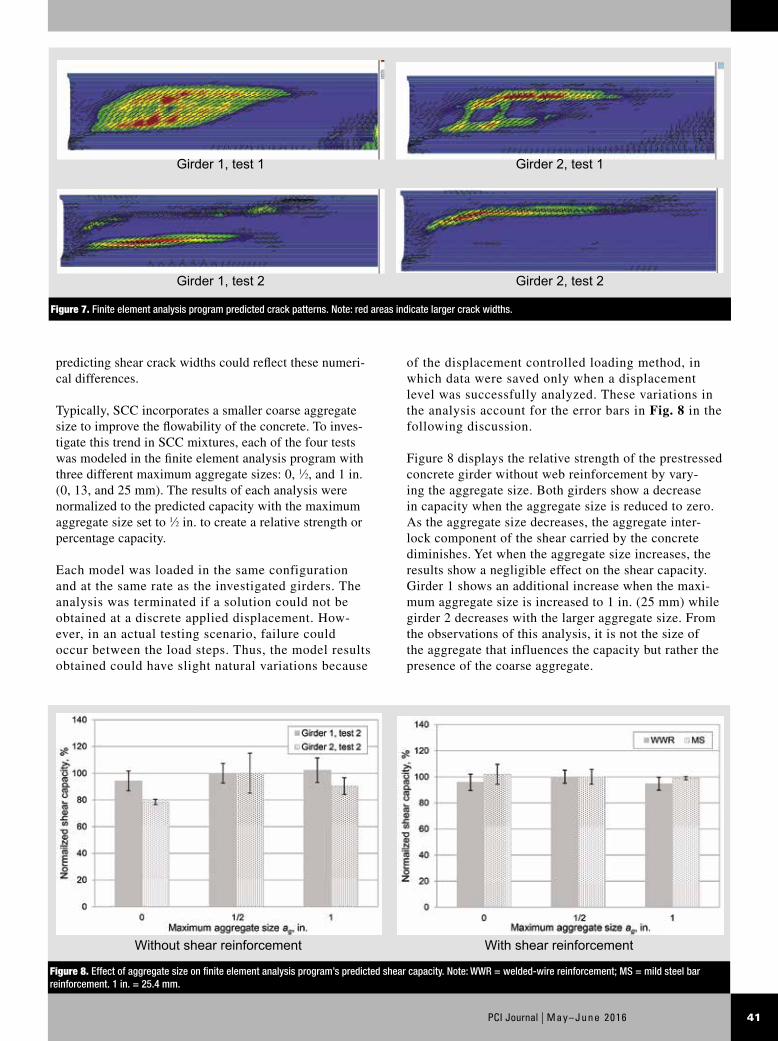
Figure 7 shows the crack patterns at failure as predicted by the finite element analysis program. When the shear reinforcement is closely spaced (12 in. [300 mm] on center for girder 1 in test 1), the predicted crack patterns closely
web from propagating to the girder surface. Thus, the shear reinforcement does influence the formation of the first vis-ible diagonal shear crack.
Figure 5 shows the observed crack patterns at the conclu-sion of each test. Both web-shear and flexure-shear crack-ing were observed in the shear tests with web reinforce-ment. The influence of the shear reinforcement is clearly noted through the well-distributed and equally spaced web-shear cracks. The welded-wire reinforcement (spaced at closer intervals) produced narrower cracks at smaller in-tervals. The tests without web reinforcement consisted pri-
Table 5. Comparison of actual and predicted shear capacities
ACI 318-14
Girder Vtest, kip Vc, kip ϕVc, kip Vtest/Vc
1 230.0196.0 147.0 1.17
201.0 150.7 1.14
2 178.5196.0 147.0 0.91
200.0 149.7 0.89
Average of test 2 for girders 1 and 2 1.04
Average of test 2 for girders 1 and 2 1.02
AASHTO LRFD specifications
1 228.1159.7 143.7 1.43
166.4 149.8 1.37
2 176.7159.7 143.7 1.11
164.6 148.1 1.07
Average of test 2 for girders 1 and 2 1.27
Average of test 2 for girders 1 and 2 1.22
Note: Shaded indicates actual compressive strength used in calcula-tions. Vc = nominal shear strength provided by the concrete; Vcalc = nominal shear strength provided by the concrete; Vtest = maximum observed shear load from testing wihtout shear reinforcement; ϕ = strength reduction factor. 1 kip = 4.448 kN.
Figure 4. Shear force at first diagonal shear crack. Note: 1 in.2/ft = 2117 mm2/m; 1 kip = 4.448 kN.
嘀
May–June 2016 | PCI Journal40
vals, reducing the aggregate interlock component of the concrete’s contribution to shear strength. The results of the finite element model indicate that further research is need-ed to investigate the critical spacing of shear reinforcement in which uniform shear transfer is achieved.
The maximum crack widths predicted by the finite ele-ment analysis program for the two analyses without shear reinforcement were 0.11 and 0.10 in. (2.8 and 2.5 mm) for test 2 of girders 1 and 2, respectively. These values are less than the maximum observed 0.400 and 0.969 in. (10.2 and 24.6 mm) for test 2 of girders 1 and 2, respectively. The difference in crack patterns between the observed and modeled and the difficulty in accurately
follow those observed in Fig. 5. However, as the shear rein-forcement spacing increases (24 in. [610 mm] for girder 2 in test 1), the shear cracks tend to bypass the reinforcement from the top to the bottom flange. This behavior could result in a significant reduction in the shear reinforcement’s contribution to the shear strength. In addition, as observed during testing, crack widths (Table 4) are significantly larger when shear reinforcement is spaced at larger inter-
Table 6. Comparison of actual and predicted shear strengths
Girder Vtest, kip VR2K, kip Vtest/VR2K
1 228.1 172.2 1.32
2 176.7 169.6 1.04
Note: VR2K = predicted shear resistance from finite element model soft-ware; Vtest = maximum observed shear load from testing without shear reinforcement. 1 kip = 4.448 kN.Figure 6. Shear crack in girder 2 from test 2.
Figure 5. Crack patterns at conclusion of test.
Girder 1, test 1
Girder 2, test 2
Girder 2, test 1
Girder 1, test 2
41PCI Journal | May–June 2016
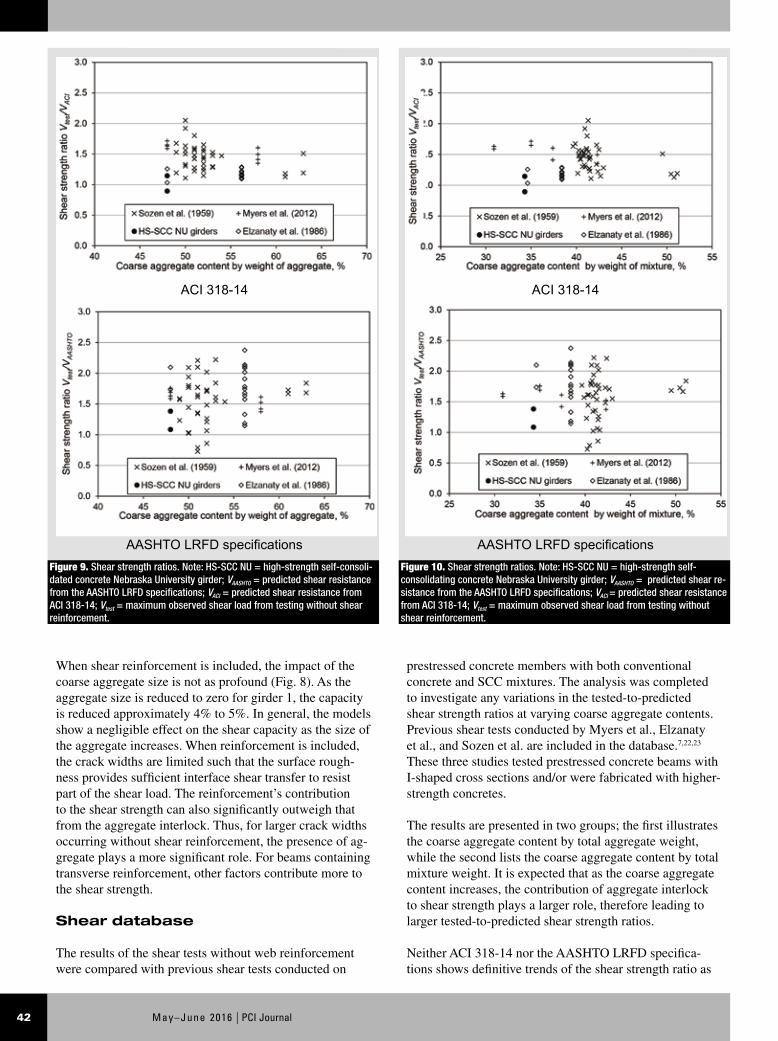
of the displacement controlled loading method, in which data were saved only when a displacement level was successfully analyzed. These variations in the analysis account for the error bars in Fig. 8 in the following discussion.
Figure 8 displays the relative strength of the prestressed concrete girder without web reinforcement by vary-ing the aggregate size. Both girders show a decrease in capacity when the aggregate size is reduced to zero. As the aggregate size decreases, the aggregate inter-lock component of the shear carried by the concrete diminishes. Yet when the aggregate size increases, the results show a negligible effect on the shear capacity. Girder 1 shows an additional increase when the maxi-mum aggregate size is increased to 1 in. (25 mm) while girder 2 decreases with the larger aggregate size. From the observations of this analysis, it is not the size of the aggregate that influences the capacity but rather the presence of the coarse aggregate.
predicting shear crack widths could reflect these numeri-cal differences.
Typically, SCC incorporates a smaller coarse aggregate size to improve the flowability of the concrete. To inves-tigate this trend in SCC mixtures, each of the four tests was modeled in the finite element analysis program with three different maximum aggregate sizes: 0, 1⁄2, and 1 in. (0, 13, and 25 mm). The results of each analysis were normalized to the predicted capacity with the maximum aggregate size set to 1⁄2 in. to create a relative strength or percentage capacity.
Each model was loaded in the same configuration and at the same rate as the investigated girders. The analysis was terminated if a solution could not be obtained at a discrete applied displacement. How-ever, in an actual testing scenario, failure could occur between the load steps. Thus, the model results obtained could have slight natural variations because
Figure 8. Effect of aggregate size on finite element analysis program’s predicted shear capacity. Note: WWR = welded-wire reinforcement; MS = mild steel bar reinforcement. 1 in. = 25.4 mm.
Without shear reinforcement With shear reinforcement
Figure 7. Finite element analysis program predicted crack patterns. Note: red areas indicate larger crack widths.
Girder 1, test 1
Girder 1, test 2
Girder 2, test 1
Girder 2, test 2
May–June 2016 | PCI Journal42
prestressed concrete members with both conventional concrete and SCC mixtures. The analysis was completed to investigate any variations in the tested-to-predicted shear strength ratios at varying coarse aggregate contents. Previous shear tests conducted by Myers et al., Elzanaty et al., and Sozen et al. are included in the database.7,22,23 These three studies tested prestressed concrete beams with I-shaped cross sections and/or were fabricated with higher-strength concretes.
The results are presented in two groups; the first illustrates the coarse aggregate content by total aggregate weight, while the second lists the coarse aggregate content by total mixture weight. It is expected that as the coarse aggregate content increases, the contribution of aggregate interlock to shear strength plays a larger role, therefore leading to larger tested-to-predicted shear strength ratios.
Neither ACI 318-14 nor the AASHTO LRFD specifica-tions shows definitive trends of the shear strength ratio as
When shear reinforcement is included, the impact of the coarse aggregate size is not as profound (Fig. 8). As the aggregate size is reduced to zero for girder 1, the capacity is reduced approximately 4% to 5%. In general, the models show a negligible effect on the shear capacity as the size of the aggregate increases. When reinforcement is included, the crack widths are limited such that the surface rough-ness provides sufficient interface shear transfer to resist part of the shear load. The reinforcement’s contribution to the shear strength can also significantly outweigh that from the aggregate interlock. Thus, for larger crack widths occurring without shear reinforcement, the presence of ag-gregate plays a more significant role. For beams containing transverse reinforcement, other factors contribute more to the shear strength.
Shear database
The results of the shear tests without web reinforcement were compared with previous shear tests conducted on
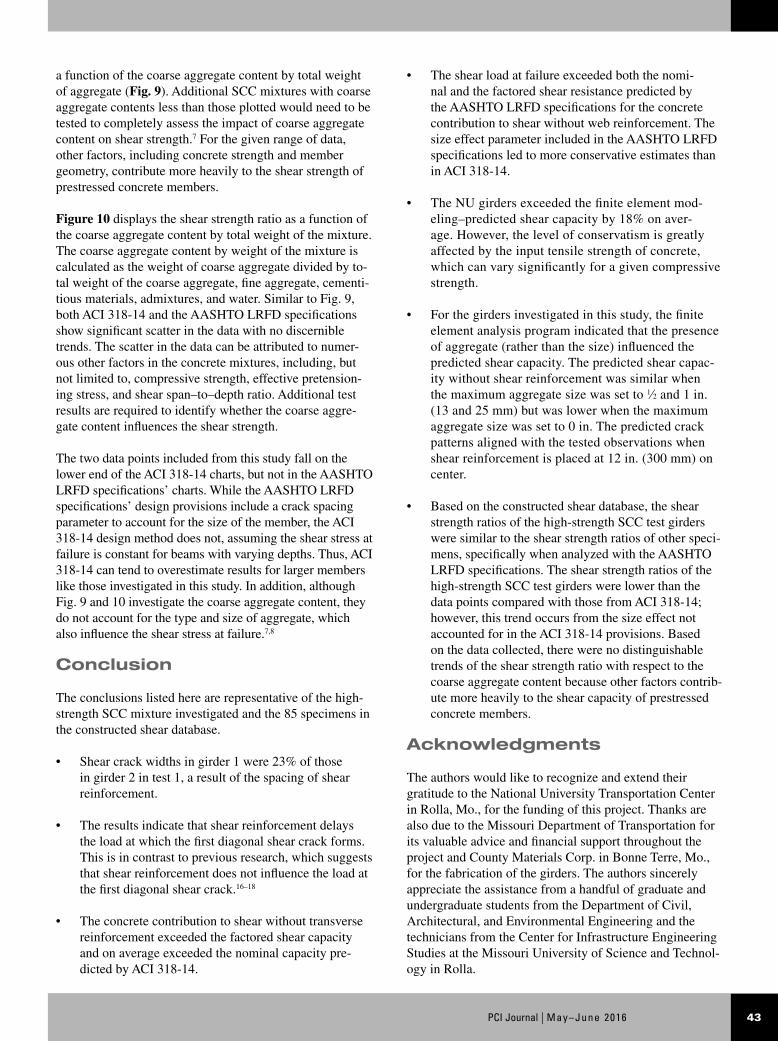
Figure 9. Shear strength ratios. Note: HS-SCC NU = high-strength self-consoli-dated concrete Nebraska University girder; VAASHTO = predicted shear resistance from the AASHTO LRFD specifications; VACI = predicted shear resistance from ACI 318-14; Vtest = maximum observed shear load from testing without shear reinforcement.
ACI 318-14
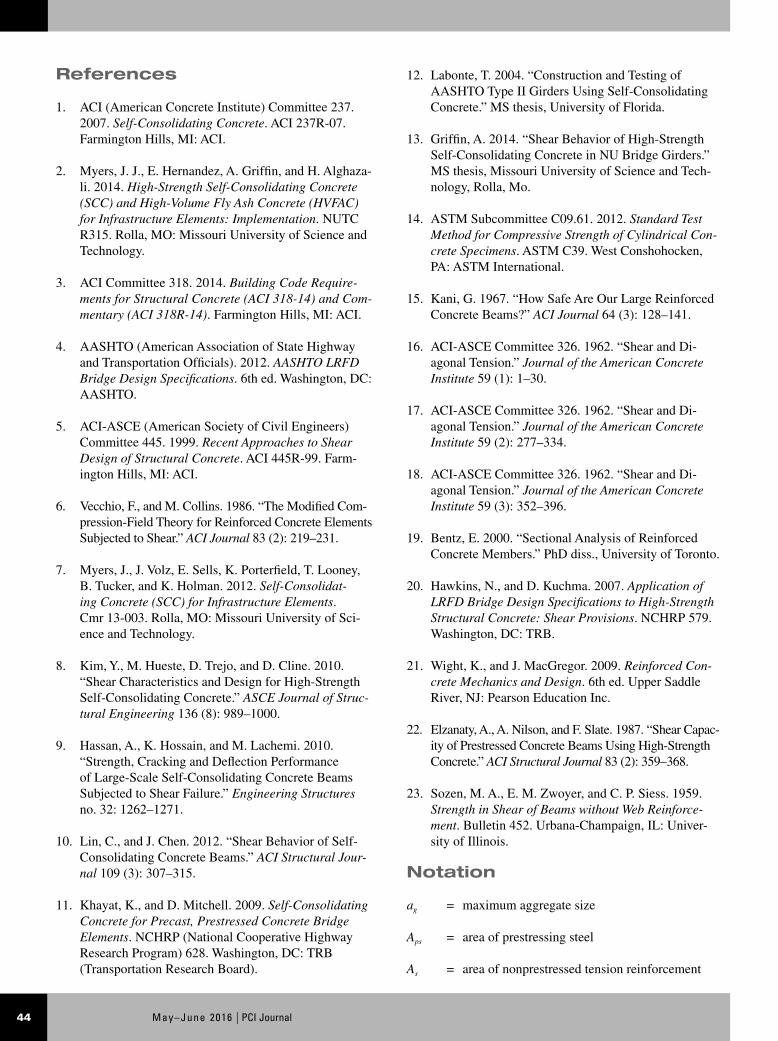
AASHTO LRFD specificationsFigure 10. Shear strength ratios. Note: HS-SCC NU = high-strength self-consolidating concrete Nebraska University girder; VAASHTO = predicted shear re-sistance from the AASHTO LRFD specifications; VACI = predicted shear resistance from ACI 318-14; Vtest = maximum observed shear load from testing without shear reinforcement.
ACI 318-14
AASHTO LRFD specifications
43PCI Journal | May–June 2016
• The shear load at failure exceeded both the nomi-nal and the factored shear resistance predicted by the AASHTO LRFD specifications for the concrete contribution to shear without web reinforcement. The size effect parameter included in the AASHTO LRFD specifications led to more conservative estimates than in ACI 318-14.
• The NU girders exceeded the finite element mod-eling–predicted shear capacity by 18% on aver-age. However, the level of conservatism is greatly affected by the input tensile strength of concrete, which can vary significantly for a given compressive strength.
• For the girders investigated in this study, the finite element analysis program indicated that the presence of aggregate (rather than the size) influenced the predicted shear capacity. The predicted shear capac-ity without shear reinforcement was similar when the maximum aggregate size was set to 1⁄2 and 1 in. (13 and 25 mm) but was lower when the maximum aggregate size was set to 0 in. The predicted crack patterns aligned with the tested observations when shear reinforcement is placed at 12 in. (300 mm) on center.
• Based on the constructed shear database, the shear strength ratios of the high-strength SCC test girders were similar to the shear strength ratios of other speci-mens, specifically when analyzed with the AASHTO LRFD specifications. The shear strength ratios of the high-strength SCC test girders were lower than the data points compared with those from ACI 318-14; however, this trend occurs from the size effect not accounted for in the ACI 318-14 provisions. Based on the data collected, there were no distinguishable trends of the shear strength ratio with respect to the coarse aggregate content because other factors contrib-ute more heavily to the shear capacity of prestressed concrete members.
Acknowledgments
The authors would like to recognize and extend their gratitude to the National University Transportation Center in Rolla, Mo., for the funding of this project. Thanks are also due to the Missouri Department of Transportation for its valuable advice and financial support throughout the project and County Materials Corp. in Bonne Terre, Mo., for the fabrication of the girders. The authors sincerely appreciate the assistance from a handful of graduate and undergraduate students from the Department of Civil, Architectural, and Environmental Engineering and the technicians from the Center for Infrastructure Engineering Studies at the Missouri University of Science and Technol-ogy in Rolla.
a function of the coarse aggregate content by total weight of aggregate (Fig. 9). Additional SCC mixtures with coarse aggregate contents less than those plotted would need to be tested to completely assess the impact of coarse aggregate content on shear strength.7 For the given range of data, other factors, including concrete strength and member geometry, contribute more heavily to the shear strength of prestressed concrete members.
Figure 10 displays the shear strength ratio as a function of the coarse aggregate content by total weight of the mixture. The coarse aggregate content by weight of the mixture is calculated as the weight of coarse aggregate divided by to-tal weight of the coarse aggregate, fine aggregate, cementi-tious materials, admixtures, and water. Similar to Fig. 9, both ACI 318-14 and the AASHTO LRFD specifications show significant scatter in the data with no discernible trends. The scatter in the data can be attributed to numer-ous other factors in the concrete mixtures, including, but not limited to, compressive strength, effective pretension-ing stress, and shear span–to–depth ratio. Additional test results are required to identify whether the coarse aggre-gate content influences the shear strength.
The two data points included from this study fall on the lower end of the ACI 318-14 charts, but not in the AASHTO LRFD specifications’ charts. While the AASHTO LRFD specifications’ design provisions include a crack spacing parameter to account for the size of the member, the ACI 318-14 design method does not, assuming the shear stress at failure is constant for beams with varying depths. Thus, ACI 318-14 can tend to overestimate results for larger members like those investigated in this study. In addition, although Fig. 9 and 10 investigate the coarse aggregate content, they do not account for the type and size of aggregate, which also influence the shear stress at failure.7,8
Conclusion
The conclusions listed here are representative of the high-strength SCC mixture investigated and the 85 specimens in the constructed shear database.
• Shear crack widths in girder 1 were 23% of those in girder 2 in test 1, a result of the spacing of shear reinforcement.
• The results indicate that shear reinforcement delays the load at which the first diagonal shear crack forms. This is in contrast to previous research, which suggests that shear reinforcement does not influence the load at the first diagonal shear crack.16–18
• The concrete contribution to shear without transverse reinforcement exceeded the factored shear capacity and on average exceeded the nominal capacity pre-dicted by ACI 318-14.
May–June 2016 | PCI Journal44
12. Labonte, T. 2004. “Construction and Testing of AASHTO Type II Girders Using Self-Consolidating Concrete.” MS thesis, University of Florida.
13. Griffin, A. 2014. “Shear Behavior of High-Strength Self-Consolidating Concrete in NU Bridge Girders.” MS thesis, Missouri University of Science and Tech-nology, Rolla, Mo.
14. ASTM Subcommittee C09.61. 2012. Standard Test Method for Compressive Strength of Cylindrical Con‑crete Specimens. ASTM C39. West Conshohocken, PA: ASTM International.
15. Kani, G. 1967. “How Safe Are Our Large Reinforced Concrete Beams?” ACI Journal 64 (3): 128–141.
16. ACI-ASCE Committee 326. 1962. “Shear and Di-agonal Tension.” Journal of the American Concrete Institute 59 (1): 1–30.
17. ACI-ASCE Committee 326. 1962. “Shear and Di-agonal Tension.” Journal of the American Concrete Institute 59 (2): 277–334.
18. ACI-ASCE Committee 326. 1962. “Shear and Di-agonal Tension.” Journal of the American Concrete Institute 59 (3): 352–396.
19. Bentz, E. 2000. “Sectional Analysis of Reinforced Concrete Members.” PhD diss., University of Toronto.
20. Hawkins, N., and D. Kuchma. 2007. Application of LRFD Bridge Design Specifications to High‑Strength Structural Concrete: Shear Provisions. NCHRP 579. Washington, DC: TRB.
21. Wight, K., and J. MacGregor. 2009. Reinforced Con‑crete Mechanics and Design. 6th ed. Upper Saddle River, NJ: Pearson Education Inc.
22. Elzanaty, A., A. Nilson, and F. Slate. 1987. “Shear Capac-ity of Prestressed Concrete Beams Using High-Strength Concrete.” ACI Structural Journal 83 (2): 359–368.
23. Sozen, M. A., E. M. Zwoyer, and C. P. Siess. 1959. Strength in Shear of Beams without Web Reinforce‑ment. Bulletin 452. Urbana-Champaign, IL: Univer-sity of Illinois.
Notation
ag = maximum aggregate size
Aps = area of prestressing steel
As = area of nonprestressed tension reinforcement
References
1. ACI (American Concrete Institute) Committee 237. 2007. Self‑Consolidating Concrete. ACI 237R-07. Farmington Hills, MI: ACI.
2. Myers, J. J., E. Hernandez, A. Griffin, and H. Alghaza-li. 2014. High‑Strength Self‑Consolidating Concrete (SCC) and High‑Volume Fly Ash Concrete (HVFAC) for Infrastructure Elements: Implementation. NUTC R315. Rolla, MO: Missouri University of Science and Technology.
3. ACI Committee 318. 2014. Building Code Require‑ments for Structural Concrete (ACI 318‑14) and Com‑mentary (ACI 318R‑14). Farmington Hills, MI: ACI.
4. AASHTO (American Association of State Highway and Transportation Officials). 2012. AASHTO LRFD Bridge Design Specifications. 6th ed. Washington, DC: AASHTO.
5. ACI-ASCE (American Society of Civil Engineers) Committee 445. 1999. Recent Approaches to Shear Design of Structural Concrete. ACI 445R-99. Farm-ington Hills, MI: ACI.
6. Vecchio, F., and M. Collins. 1986. “The Modified Com-pression-Field Theory for Reinforced Concrete Elements Subjected to Shear.” ACI Journal 83 (2): 219–231.
7. Myers, J., J. Volz, E. Sells, K. Porterfield, T. Looney, B. Tucker, and K. Holman. 2012. Self‑Consolidat‑ing Concrete (SCC) for Infrastructure Elements. Cmr 13-003. Rolla, MO: Missouri University of Sci-ence and Technology.
8. Kim, Y., M. Hueste, D. Trejo, and D. Cline. 2010. “Shear Characteristics and Design for High-Strength Self-Consolidating Concrete.” ASCE Journal of Struc‑tural Engineering 136 (8): 989–1000.
9. Hassan, A., K. Hossain, and M. Lachemi. 2010. “Strength, Cracking and Deflection Performance of Large-Scale Self-Consolidating Concrete Beams Subjected to Shear Failure.” Engineering Structures no. 32: 1262–1271.
10. Lin, C., and J. Chen. 2012. “Shear Behavior of Self-Consolidating Concrete Beams.” ACI Structural Jour‑nal 109 (3): 307–315.
11. Khayat, K., and D. Mitchell. 2009. Self‑Consolidating Concrete for Precast, Prestressed Concrete Bridge Elements. NCHRP (National Cooperative Highway Research Program) 628. Washington, DC: TRB (Transportation Research Board).
45PCI Journal | May–June 2016
Av = area of shear reinforcement within spacing s
Av/s = shear reinforcement density
a/d = shear span–to–depth ratio
bv = effective web width
bw = web width of the section
c = fraction reduction factor
d = distance from extreme compression fiber to centroid of longitudinal tension reinforcement
dp = effective depth, defined as the distance from the extreme compression fiber to the centroid of the prestressing steel
dv = effective shear depth; distance between tensile and compressive resultant forces due to flexure
Ep = modulus of elasticity of prestressing steel
Es = modulus of elasticity of reinforcing bars
fc' = specified compressive strength of concrete
fd = stress due to unfactored dead load at extreme fi-ber where externally applied loads induce tensile stresses
fpc = compressive stress in concrete at centroid of cross section
fpe = compressive stress in concrete due to effective prestress at extreme fiber where externally ap-plied loads induce tensile stresses
fpo = stress in prestressing steel defined as the pre-stressing steel modulus of elasticity multiplied by the locked-in difference in strain between the prestressing steel and the surrounding concrete
fy = specified yield strength of reinforcement
h = overall height of member
I = moment of inertia of section about centroidal axis
Mcre = moment causing flexural cracking at section due to externally applied loads
Mmax = maximum factored moment at section due to externally applied loads
Mu = factored moment at the section
Nu = applied factored axial force (positive for tension)
s = center-to-center spacing of transverse reinforcement
sx = crack spacing parameter
sxe = effective value of sx that allows for influence of aggregate size
V = shear force at first crack
VAASHTO = predicted shear resistance from the AASHTO LRFD specifications
VACI = predicted shear resistance from the ACI 318-14
Vc = nominal shear strength provided by the concrete
Vci = nominal shear strength provided by concrete when diagonal cracking results from combined shear and moment
Vcw = nominal shear strength provided by concrete when diagonal cracking results from high prin-cipal stresses in the web
Vd = shear force at section due to unfactored dead load
Vi = factored shear force at section due to externally applied loads
Vp = vertical component of effective prestress force at section
VR2K = predicted shear resistance from finite element model software
Vs = nominal shear strength provided by shear reinforcement
Vtest = maximum observed shear load from testing without shear reinforcement
w/cm = water–cementitious materials ratio
Vu = factored shear force at section
yt = distance from centroid of section to tension face
β = factor relating the effect of the longitudinal strain on the shear capacity of the concrete as
May–June 2016 | PCI Journal46
indicated by the ability of diagonally cracked concrete to transmit tension
εs = net longitudinal tensile strain in the section at the centroid of the tension reinforcement
θ = angle of inclination of diagonal compressive stresses
λ = modification factor for lightweight concrete
µ = friction coefficient
ϕ = strength reduction factor
About the authors
Alex Griffin is a former graduate research assistant in the Depart-ment of Civil, Architectural and Environmental Engineering at the Missouri University of Science and Technology in Rolla, Mo. He is an engineer in training and
works in the structural department at Burns and McDonnell in Kansas City, Mo.
John J. Myers, PhD, PE, FACI, FASCE, FTMS, is a professor in the Department of Civil, Architec-tural and Environmental Engineer-ing and director of the Structural Engineering Research Laboratory at the Missouri University of Science and Technology.
Abstract
Current reinforced and prestressed concrete design equations were developed for conventional concrete elements. Self-consolidating concrete (SCC) typically contains a lower coarse aggregate content and size than conventional concrete, which potentially hinders the aggregate interlock contribution to a concrete’s shear strength. Thus, shear design equations must be verified with SCC mixtures.
Two full-scale precast, prestressed concrete Nebraska University girders were tested to assess the shear behavior of high-strength SCC. Both girders were designed to permit two tests on each girder, both with and without shear reinforcement. Ultimate shear loads and crack patterns were documented and compared with code estimates, finite element models, and a col-lected prestressed concrete shear database.
The girders exceeded the predicted factored concrete shear resistance from current U.S. design standards. However, additional test data are required to identify any distinguish-able trends of the shear strength of SCC mixtures.
Keywords
Aggregate, bridge, cracking, finite element analysis, finite element model, fly ash, full-scale, high-strength concrete, NU girder, SCC, self-consolidating concrete, shear strength.
Review policy
This paper was reviewed in accordance with the Precast/Prestressed Concrete Institute’s peer-review process.
Reader comments
Please address reader comments to [email protected] or Precast/Prestressed Concrete Institute, c/o PCI Journal, 200 W. Adams St., Suite 2100, Chicago, IL 60606. J