shear heating in continental strike-slip shear zones: …lacassin/papers/leloup shear-heating...
TRANSCRIPT

Geophys. J. Int. (1999) 136, 19–40
Shear heating in continental strike-slip shear zones:model and field examples
Philippe Herve Leloup,1 Yannick Ricard,2 Jean Battaglia1 and Robin Lacassin11 L aboratoire de tectonique et mecanique de la lithosphere, CNRS-UMR 7578, Institut de physique du globe de Paris, 4 place Jussieu,
75252 Paris cedex 05, France
2 L aboratoire de Sciences de la T erre, URA 726, Ecole Normale Superieure de Lyon, 46 allee d’Italie, 69364 Lyon cedex 07, France
Accepted 1998 July 6. Received 1998 June 21; in original form 1998 February 24
SUMMARYA two-layer (crust and upper mantle), finite difference steady-state thermomechanicalmodel of a long-lived (several million years) lithospheric strike-slip fault is presented,and its predictions compared with field observations from various major fault zones.In order to estimate the maximum amount of shear heating, all mechanical energy isassumed to be dissipated in heat, in ductile as well as in brittle layers. Deformationfollows a friction law in the brittle layer(s), and a power-flow law in the ductile one(s).Variations of several independent parameters and their influence on the thermo-mechanical state of the fault zone and on shear heating are systematically explored.Shear heating is found to be more important in fault zones affecting an initially coldlithosphere, and increases with slip rate, friction coefficient and stiffness of materials.In extreme cases (slip rate of 10 cm yr−1, stiff lithosphere), shear heating could lead totemperature increases close to 590 °C at the Moho, and 475 °C at 20 km depth. Formore common cases, shear heating leads to smaller temperature increases, but can stillexplain high-grade metamorphic conditions encountered in strike-slip shear zones.However, modelled temperature conditions often fall short of those observed. Thiscould be due to heat transport by mechanisms more efficient than conduction. Commonsyntectonic emplacement of granitic melts in ductile strike-slip shear zones can beexplained by lower crust partial melting induced by shear heating in the upper mantle.Besides slip rate, the possibility of such melting depends mostly on the upper mantlerheology and on the fertility of the lower crust: for hard upper mantle and highly fertilelower crust, partial melting could occur at rates of 1 cm yr−1, while in most cases itwould result from the breakdown of micas for slip rates over 3 cm yr−1. As a result ofshear heating, partial melting of the upper mantle could occur in the presence of smallamounts of fluids. Rise of magmas and/or hot fluids in the shear zone will furtherenhance the temperature increase in shallower parts of the fault zone. In nature, shearheating would inevitably cause strain localization in the deeper parts of strike-slipfaults, as is often observed in the field for crustal shear zones.
Key words: crustal deformation, fault models, finite difference methods, heat flow,lithospheric deformation, tectonics.
Nicolas et al. 1977) and by some geophysicists (e.g. Scholz 1980;1 INTRODUCTION
Barr & Dahlen 1989; Molnar & England 1990), theoreticalcalculations suggest that it is unlikely to be of prime importancePrograde metamorphism is due to temperature increase(Brun & Cobbold 1980; Fleitout & Froidevaux 1980). Indeed,resulting from four main possible causes: deep burial of rocks,when a rock produces heat by friction, it necessarily becomesrise of regional or local heat flow, thickening of radioactive-warmer and softer, a phenomenon that buffers the heatrich crust, and shear heating. Most metamorphic rocks cropproduction.out in collision belts where all these processes may have
In this debate, metamorphism associated with major strike-acted together, making the importance of each one difficult toslip faults is of particular interest, as burial of rocks, heat-flowdecipher. In particular, the efficiency of shear heating (or strainregional increase, and crustal thickening are limited for suchheating) is a subject of debate. While shear heating has long
been considered a major heat source by field geologists (e.g. faults. Field observations along continental strike-slip shear
19© 1999 RAS
20 P. H. L eloup et al.
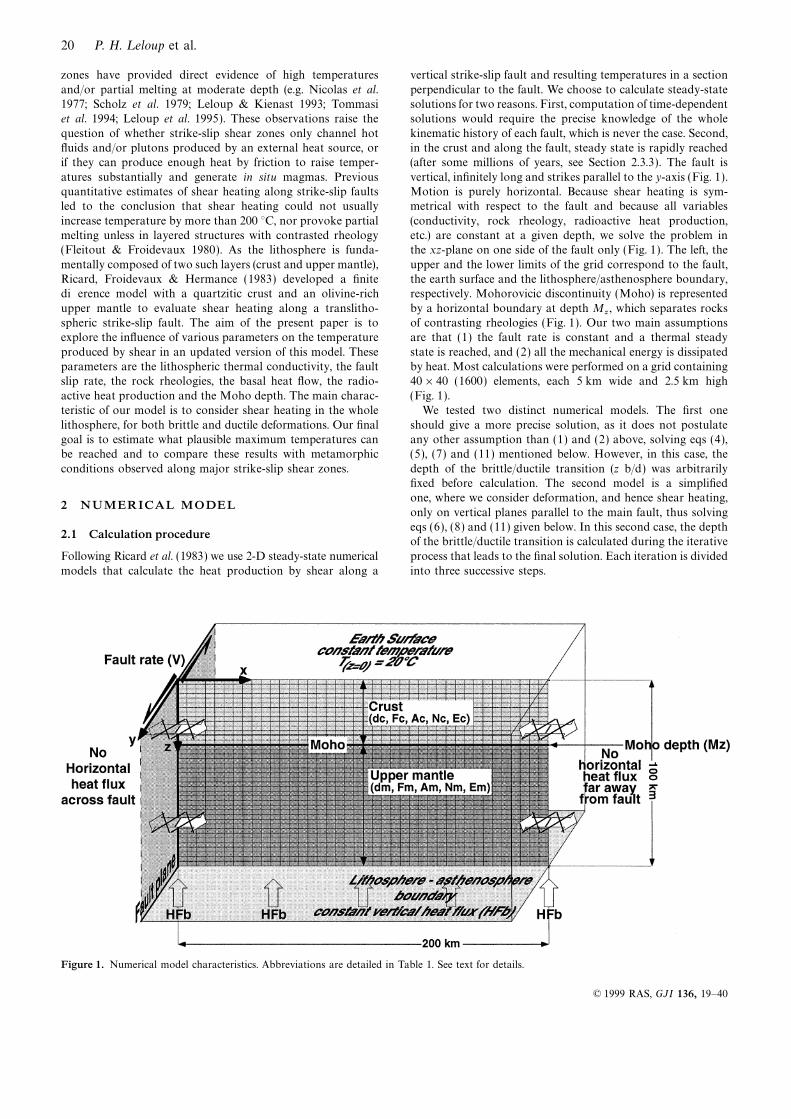
zones have provided direct evidence of high temperatures vertical strike-slip fault and resulting temperatures in a section
perpendicular to the fault. We choose to calculate steady-stateand/or partial melting at moderate depth (e.g. Nicolas et al.1977; Scholz et al. 1979; Leloup & Kienast 1993; Tommasi solutions for two reasons. First, computation of time-dependent
solutions would require the precise knowledge of the wholeet al. 1994; Leloup et al. 1995). These observations raise the
question of whether strike-slip shear zones only channel hot kinematic history of each fault, which is never the case. Second,in the crust and along the fault, steady state is rapidly reachedfluids and/or plutons produced by an external heat source, or
if they can produce enough heat by friction to raise temper- (after some millions of years, see Section 2.3.3). The fault is
vertical, infinitely long and strikes parallel to the y-axis (Fig. 1).atures substantially and generate in situ magmas. Previousquantitative estimates of shear heating along strike-slip faults Motion is purely horizontal. Because shear heating is sym-
metrical with respect to the fault and because all variablesled to the conclusion that shear heating could not usually
increase temperature by more than 200 °C, nor provoke partial (conductivity, rock rheology, radioactive heat production,etc.) are constant at a given depth, we solve the problem inmelting unless in layered structures with contrasted rheology
(Fleitout & Froidevaux 1980). As the lithosphere is funda- the xz-plane on one side of the fault only (Fig. 1). The left, the
upper and the lower limits of the grid correspond to the fault,mentally composed of two such layers (crust and upper mantle),Ricard, Froidevaux & Hermance (1983) developed a finite the earth surface and the lithosphere/asthenosphere boundary,
respectively. Mohorovicic discontinuity (Moho) is representeddifference model with a quartzitic crust and an olivine-rich
upper mantle to evaluate shear heating along a translitho- by a horizontal boundary at depth Mz, which separates rocks
of contrasting rheologies (Fig. 1). Our two main assumptionsspheric strike-slip fault. The aim of the present paper is toexplore the influence of various parameters on the temperature are that (1) the fault rate is constant and a thermal steady
state is reached, and (2) all the mechanical energy is dissipatedproduced by shear in an updated version of this model. Theseparameters are the lithospheric thermal conductivity, the fault by heat. Most calculations were performed on a grid containing
40×40 (1600) elements, each 5 km wide and 2.5 km highslip rate, the rock rheologies, the basal heat flow, the radio-
active heat production and the Moho depth. The main charac- (Fig. 1).We tested two distinct numerical models. The first oneteristic of our model is to consider shear heating in the whole
lithosphere, for both brittle and ductile deformations. Our final should give a more precise solution, as it does not postulateany other assumption than (1) and (2) above, solving eqs (4),goal is to estimate what plausible maximum temperatures can
be reached and to compare these results with metamorphic (5), (7) and (11) mentioned below. However, in this case, the
depth of the brittle/ductile transition (z b/d) was arbitrarilyconditions observed along major strike-slip shear zones.fixed before calculation. The second model is a simplifiedone, where we consider deformation, and hence shear heating,
2 NUMERICAL MODELonly on vertical planes parallel to the main fault, thus solvingeqs (6), (8) and (11) given below. In this second case, the depth
2.1 Calculation procedureof the brittle/ductile transition is calculated during the iterative
process that leads to the final solution. Each iteration is dividedFollowing Ricard et al. (1983) we use 2-D steady-state numerical
models that calculate the heat production by shear along a into three successive steps.
Figure 1. Numerical model characteristics. Abbreviations are detailed in Table 1. See text for details.
© 1999 RAS, GJI 136, 19–40

Shear heating in strike-slip shear zones 21
Figure 2. Vertical variations of temperature and shear stress along
the fault for reference parameters (bold numbers in Table 1).
(a) Temperature profiles before and during shearing, and correspond-
ing temperature increase. (b) Shear-stress profile during shearing in Figure 3. Temperatures, strain rates and frictional heat productionthe case of shear heating (continuous line) and no shear heating for reference parameters (bold numbers in Table 1) in a vertical half-
( long-dashed line). The peak in shear stress is located either in the space perpendicular to the fault. (a) Isotherms during shearing (continuous
last grid element above, or in the first below, the brittle/ductile lines) compared to initial ones (dashed lines). (b) Temperature increase
transition. due to shear heating. Note that temperatures mostly increase along
the fault near the brittle/ductile transition and in the upper mantle.
(c) Shear strain in ductile layers.(1) Given ‘initial’ temperatures, a strength profile is calcu-
lated: at a given depth, the deformation mechanism (brittle ora normal geotherm computed without shear heating (Fig. 2a).
ductile) is assumed to be the one for which the shear stress onBasic formulae used for calculation are detailed in the following
the fault is the lowest.paragraphs.
(2) When the depth of the brittle/ductile transition has beenThe differences between the full and simplified solutions
determined, shear heating is calculated as a function of depth,are discussed in Appendix A. As the predicted temperature
applying a friction law for the brittle part of the fault and aincreases near the fault differ by less than 10 per cent and final
power-flow law for its ductile part.temperatures by less than 5 per cent, we present in this paper
(3) Knowing both this frictional heat production and thesimplified solutions, where the depth of the brittle/ductile
radiogenic heat production, the heat diffusion equation istransition is calculated, not imposed.
solved to calculate ‘new’ temperatures.
We iterate these three steps until temperatures do not2.2 Boundary conditions and parameters
evolve significantly between successive calculations, implyingthat a steady-state solution has been found. Vertical profiles of As the fault is strike slip, there is no vertical motion. Horizontal
motion of velocity V /2 along the y-axis is imposed on the righttemperature, temperature increase and shear stress are drawn
(Fig. 2), together with ‘maps’ of temperatures and temperature side of the computation box and in the brittle layer, whilethe fault itself stays fixed. The resultant initial velocity fieldincreases in vertical cross-sections perpendicular to the fault
(Fig. 3). Temperature increases are calculated with respect to consists of two rigid blocks separated by the fault in the brittle
© 1999 RAS, GJI 136, 19–40
22 P. H. L eloup et al.
layer (relative velocity on the fault is V ), and a continuous where F is the friction coefficient, and tb and sn are the shearvelocity field in the ductile layer (total relative velocity between and normal stresses, respectively. sn is assumed to be close toboundaries is V ). At large depth, the horizontal velocity becomes lithostatic stress. tb thus increases with depth as a function ofa function of x only (∂v/∂z=0 is imposed at z=100 km). After the weight of the overlying rocks.calculation, ductile deformation is mostly localized in a shear At a depth z,zone, with a half-width of less than 25 km (see below). Suchlocalization is achieved more quickly if an initial Gaussian-shaped tb(z)=Fg P z
0r(u) du , (2)
temperature perturbation, of a few tenths of a degree, is imposedin the initial temperature distribution. Such boundary conditions where g is the gravity acceleration (g#9.8 m s−2) and r(z) theimply that far-field forces of plate-tectonic type (generated depth-dependent density.outside the model box) are driving the fault kinematics.
On the other hand, in the viscous layer, the deformation isA constant temperature of 20 °C is maintained at the top
a function of both x and z, and the shear stresses txy
and tyzboundary of the grid (earth’s surface, Figs 1, 2a and 3b). By
are non-zero:symmetry, horizontal heat flow across the fault is null (Fig. 1).We assume that shear-heating effects are negligible more than ∂t
xy∂x
+∂tyz
∂z=0 . (3)200 km away from the fault, implying that heat flow across a
vertical boundary at x=200 km is negligible (Fig. 1). HeatFollowing experimental results, and thus assuming a non-flow at the base of the lithosphere (z=100 km) is constant andlinear law of deformation of the form e=AtN exp(−E/RT )equal to HFb (Fig. 1).between deviatoric stresses and strain rate (e.g. WeertmanBesides HFb, 14 other parameters are fixed for each run1978), one writes(Table 1). Three of these parameters define general charac-
teristics of the model: the fault slip rate (V ), the thermal ∂V∂x
=A(t2xy+t2
yz)(N−1)/2t
xyexp(−E/RT ) (4)conductivity (K), and the Moho depth (M
z). Five parameters
define the rheology of each layer. The density (r), and theandfriction coefficient (F) allow us to calculate the friction law
when the material is brittle. The pre-exponent constant (A), ∂V∂z
=A(t2xy+t2
yz)(N−1)/2t
yzexp(−E/RT ) . (5)the power-flow-law exponent (N ), and the activation energy
(E) define a power-flow law when rocks deform ductilely (seeIn the two previous equations, V is the velocity along the y-axis,below). The last parameter is the radioactive heat production
per unit time and volume (Qr ), which is depth-dependent. T the temperature, E the activation energy of ductile defor-mation, N the power-law exponent, A the pre-exponent con-
stant, and R the universal gas constant (R=8.32 J mol−1 K−1).2.3 Main governing equationIn the Appendix, we show how to solve these equationscoupled with the equation of heat conservation.2.3.1 Strength profile
It seems obvious, however, that the mechanical behaviourAlong the fault, in the brittle zone, it is assumed that the is dominated by shear on vertical planes parallel to the mainCoulomb criterion for failure is reached: fault (t
xy≠0) rather than by shear on the horizontal plane
(tyz#0). In this case, by integration of (4) one derives thetb#Fsn , (1)
Table 1. Thermal and mechanical parameters.
Parameter Abbreviation unit range
Thermal parametersThermal conductivity K W m−1 K−1 1.5–2.5–4Basal heat flow HFb mW m−2 10–20–30Crust radioactive heat production Qr mW m−3 0–1–2Moho Depth M
zkm 25–35–60
Mechanical parametersSlip rate V cm yr−1 0–3–10Crust density rc kg m−3 2800Upper mantle density rm kg m−3 3200Crust friction coefficient Fc dimensionless 0.001–0.6–0.85Upper mantle friction coefficient Fm dimensionless 0.001–0.6–0.85
Power flow law coefficients pre-exponent constant: A exponent: N activation energy: E[Pa−N s−1] [dimensionless] [105 J mol−1]
Crust Ac Nc Ecsoft: Westerly granite (wet) 7.962 10−16 1.9 1.4average: Westerly granite (dry) 3.16 10−26 3.3 1.86hard: orthopyroxenite (dry ) 1.26 10−15 2.4 2.93Upper mantle Am Nm Emsoft: Anita bay dunite 7.94 10−17 3.35 4.44average: Mt Burnet dunite (wet) 7.94 10−34 5.1 3.92hard: dunite (dry) 7.94 10−18 3.6 5.35
© 1999 RAS, GJI 136, 19–40

Shear heating in strike-slip shear zones 23
simplified equation2.3.3 Heat diVusion
If the thermal conductivity is everywhere given by K, thetd(z)=t
xy=AVN2 P2
0expA− E
RT (u, z)B duB1/N . (6)steady-state heat conduction is
The errors introduced by this approximation are discussed in V2T +Qf+Qr
K=0 . (11)
the Appendix.
By plotting td(z) and tb(z) as a function of depth, one obtains We approximate (11) by a finite difference method, calculatinga lithospheric strength profile (Fig. 2b). At a given depth, the the ‘new’ temperature at any point of the grid as a function of
‘old’ temperatures at the four neighbouring points and of therelevant deformation mechanism is the one for which the shearlocal heat production. The solution is considered to be stablestress is minimum (e.g. Goetze & Evans 1979; Brace &when an iteration does not change the temperature of anyKohlstedt 1980).nodes of the grid by more than 10−3 °C.
Heat production by shear is maximum along the fault
where shear stress is maximum: at the brittle/ductile transition2.3.2 Heat production(10–20 km deep) and in the uppermost mantle (Fig. 2b). A
One of the two basic assumptions of the model is that all simple heat diffusion scaling of the form d=2√kt (t being themechanical energy is dissipated in heat (Joule 1850). The heat timescale necessary for heat to diffuse to a distance d from theproduced by shear per unit time and volume (Q in [W m−3]) heat source, and k being the lithosphere thermal diffusivity ofis simply given by #1 10−6 m2 s−1) indicates that, near the fault, heat produced
by shear diffuses through the crust in less than 4 Myr. Thesteady regime is in fact reached even more quickly, as the shearQf=t
xy∂V∂x
+tyz∂V∂z
. (7)stress, and hence heat production, is greater at the beginning
of deformation when temperatures are lower. Far from theHere again, as discussed in the Appendix, we assume that most fault zone and in the lower part of the lithosphere, where noof the heat is produced by shear heating along vertical planes. heat is produced, the temperature changes slowly by diffusion.Eq. (7) simplifies to In these regions, however, temperature changes are so small
that metamorphism does not take place and field observations
cannot constrain our modelling. In agreement with 1-D modelsQf=txy∂V∂x
. (8)(Fleitout & Froidevaux 1980), steady-state temperatures closeto the fault, in the crust and in the upper mantle, will be
If td(z)>tb(z) we assume that rocks deform brittlely. Heat reached after only a few million years of strike-slip faulting atproduction is localized along the fault plane (first column of a constant rate.the grid) and only half of this heat diffuses in each side.
Therefore (8) becomes2.4 Parameter values
As many parameters (at least 15) are involved in our calcu-Qf(x=0,z)=tb(z)
V
2l, (9)
lations, we decided to choose for each one a possible rangeof variation and a reference value (Table 1). This reference
where l is the width along the x-axis of the considered unit cell. corresponds to the a priori most plausible values inferred fromIf td(z)<tb(z) rocks deform ductilely and heat is produced our knowledge of the lithosphere and of large continental
wherever the deformation takes place. Consequently, (8) leads strike-slip faults. In this way, we can explore the influence ofto each parameter individually: except for the one under investi-
gation, all parameters are fixed to their reference values.Qf(x,z)=AtN+1d(z) exp(−E/RT
(x,z)) . (10) Thermal conductivity, basal heat flow, radiogenic heating, and
Moho depth influence the temperature structure of the litho-Although no localization of deformation is imposed within sphere both before and during shearing: these will be referred
the ductile shear zone, steady-state solutions show a strong to as thermal parameters as opposed to the mechanical oneslocalization of deformation and heat production. In the ductile (slip rate, friction coefficient and power law parameters) thatshear zone, strain rates are maximum below the brittle fault are only important when motion takes place along the fault.and decrease by one order of magnitude in a zone of half-
width #20 km (Fig. 3c). Such strain localization in the ductile3 RESULTSlayer is explained by shear heating: a slight temperature
increase, for example due to the proximity of localized brittle3.1 Reference model: a plausible lithospheric fault modeldeformation, leads to higher strain rates inducing more shear
heating that contributes to raising the temperature even further. In the reference model all parameters are set to their referenceConsequently, maximum ductile shear heating takes place in value (Table 1). The crust is 35 km thick, with a homogeneousthe centre of the shear zone and becomes negligible less than radioactivity of 1 mW m−3, a friction coefficient of 0.6 and the80 km away from the fault. power-flow law of dry Westerly granite (Hansen & Carter
Heat is also produced by radioactive decay in an amount 1983). Mantle rocks do not show any radioactivity and haveQr(z) defined by a radioactive heat production profile chosen the rheology of wet Mt Burnet dunite (Post 1977). Thermal
conductivity is set to 2.5 W m−1 K−1, and basal heat flow tofor each run.
© 1999 RAS, GJI 136, 19–40

24 P. H. L eloup et al.
20 mW m−2. These parameters lead to a normal geotherm temperatures (930 °C at the Moho) (Fig. 4). Extreme values of
where the Moho is at 534 °C (Fig. 2a), and a surface heat flow conductivity lead to thermal structures before shearing thatof 53 mW m−2 (Fig. 2c). After motion on the fault at a rate are not realistic. Indeed, a value of K=4 W m−1 K−1 wouldof 3 cm yr−1 and consequent shear heating, isotherms are imply that low greenschist metamorphism would be barelyperturbed and temperature substantially increases close to the attained in the lower crust, while for K=1.5 W m−1 K−1fault (Fig. 3a). For example, the temperature at the Moho the whole lower crust would be at temperatures compatiblereaches 735 °C in the fault zone, while it remains at 534 °C far with partial melting. Average lithospheric conductivity thusfrom it (Figs 2a and 3a). Surface heat flow on the fault trace probably lies between 2 and 3 W m−1 K−1.reaches 109 mW m−2 (Fig. 6d). Temperature mostly increasesat two depths: in the crust at the brittle/ductile transition
(+176 °C, #10 km depth), and in the mantle just below the3.2.2 Radiogenic heating and basal heat flow
Moho discontinuity (+208 °C) (Fig. 3b). These zones corre-Radioactive heat production decreases with depth in the crustspond to places where shear stress is maximum (Fig. 2b).and is negligible in the mantle, although various radioactiveDuctile deformation is localized below the main brittle fault.heat production profiles appear consistent with the observedIn the crust, the maximum strain rate is 9×10⁻¹⁴ s−1, in thesurface heat flow (e.g. Chapman & Furlong 1991). Radioactiveshear-zone centre, just below the brittle/ductile transition
(Fig. 3c). Strain rates decrease by one order of magnitude less heat production in amphibolite facies rocks representative ofthan 25 km from the left boundary of the grid. The higher the middle crust and in granulites of the lower crust is betweenstrain rates (>10−14 s−1), typical of geological deformation rates, 1 and 1.6 mW m−3, and between 0.4 and 0.45 mW m−3,define a vertical shear zone affecting the whole lithosphere. respectively (e.g. Pinet et al. 1991). A model with heat pro-
duction values of 2 mW m−3 in the upper 10 km, 1.6 mW m−3from 10 to 20 km and 0.4 mW m−3 for the lower crust is3.2 Variations of thermal parametersthus probably realistic (model 1, Fig. 5). In an attempt to
simplify this crust profile we tested two alternative models: a3.2.1 L ithospheric average thermal conductivitysingle radioactive layer 15 km thick in which Qr=2 mW m−3
Average conductivity for the whole crust probably ranges (model 2, Fig. 5) (England & Thompson 1984); and a homo-between 1.5 and 3 W m−1 K−1 (England & Thompson 1984). geneous crustal heat production of 1 mW m−3 (model 3, Fig. 5).Conductivity of the lithospheric mantle is usually assumed to The choice of one of these models is not critical for the finalbe equal to 3 W m−1 K−1 (Pinet et al. 1991; Gaudemer et al. temperatures reached along the fault, but has repercussions1988). We decided to take 2.5 W m−1 K−1 as the reference for the importance of shear heating (Fig. 5b). We chose modelvalue for lithospheric heat conductivity and to test variations 3 as our reference heat production profile because it is simpleof this parameter between 1 and 4 W m−1 K−1 (Table 1). and leads to temperatures that do not differ more than
Such variations significantly change the model by affecting 10 per cent from model 1 (Fig. 5).the initial thermal structure of the lithosphere. For high thermal If the crustal radioactive heat production is zero, the shear-conductivities, initial temperatures are very low (for example
heating effect is very important and the temperature increases340 °C at the Moho for K=4 W m−1 K−1), and the shear-
by nearly 400 °C at the Moho (model 4, Fig. 5b). A uniformheating effect is important (+320 °C), leading to moderate
radioactive heat production set to 2 mW m−3 would producefinal temperatures (660 °C at the Moho) (Fig. 4). On the other
nearly no shear-heating effect (model 5, Fig. 5b). These resultshand, a low thermal conductivity induces high initial temper-
mean that a cooler lithosphere before shearing induces a largeratures (880 °C at the Moho for K=1.5 W m−1 K−1), and then
temperature increase by shear heating, but finally reachesa small shear heating effect (+50 °C) and very high final
temperatures very close from those attained from hotter initial
conditions.
Sclater et al. (1980) estimated the basal heat flow below
continents to be between 17 and 31 mW m−2. A detailed
study of the Canadian and Scandinavian shields led Pinet
and co-workers to estimate a basal heat flow as low as
#10 mW m−2 under cratons (Pinet & Jaupart 1987; Pinet
et al. 1991). This basal heat flow is higher in thinned areas
and probably in young orogenic areas. We choose HFb=20 mW m−2 as our reference value with variations between 10
and 30 mW m−2 (Table 1). A basal heat flow of 20 mW m−2,together with a uniform crustal radioactive heat production of
1 mW m−3, gives a surface heat flow of 53 mW m−2, typical
for continents.
A high basal heat flow obviously leads to high temperatures
in the crust (Fig. 6a). But, as is the case for radioactivity, shear
heating decreases sharply with increasing initial temperature,
buffering final temperatures. Crustal temperatures along theFigure 4. Influence of thermal conductivity on Moho initial temper-fault after shearing do not vary by more than 100 °C whateverature (Ti), temperature increase (dT) and final temperature (T) atthe basal heat flow (Fig. 6b) and for any radioactive heatshear zone centre. All other parameters are set to their reference values
(see Table 1). production below 1.5 mW m−3 (Fig. 5b).
© 1999 RAS, GJI 136, 19–40

Shear heating in strike-slip shear zones 25
Figure 5. Influence of crustal radioactivity on thermal state. All other parameters are set to their reference values (see Table 1). (a) Proposed
models for vertical distribution of radioactivity in crust. See text for details. (b) Temperature and temperature-increase profiles along the fault for
proposed vertical distributions of radioactivity.
cold one. This buffering effect was expected from previous3.2.3 Moho depth
calculations (Yuen et al. 1978; Fleitout & Froidevaux 1980;Brun & Cobbold 1980; Thatcher & England 1998).The Moho depth (M
z) influences the thermal structure as it
fixes the thickness of the radioactive crust and the depth of
the rheological limit (Fig. 7a). Surprisingly, when Mz
varies3.3 Variations of mechanical parameters
between 20 and 45 km, the final temperature does not varymuch (Fig. 7b). When the crust is thin (i.e. M
z=20 km) these
3.3.1 Slip ratefinal temperatures are mostly due to shear heating, while inthe case of a thick crust (i.e. M
z=45 km) they are mostly due The slip rate on the fault (V ) determines the deformation rate,
the shear stress profile, and consequently the heat productionto radioactivity. The corresponding surface heat flows are
nearly constant over the fault: #110 mW m−2. by shearing. As we assume steady state, our model is appro-priate only for faults that maintain a nearly constant slip rateIn a single-layer model (i.e. without the Moho discontinuity)
the thermal structure of the lithosphere changes radically because for several million years. As we also assume that the fault
separates two blocks of similar thermal state, our model isheat production is restricted near the brittle/ductile transition.A single-layer model, with the power-law flow of the crust, better adapted for continent/continent transform faults or
intracontinental strike-slip faults. Important intracontinentaland a heat production of 1 mW m−3 in the upper 35 km, leads
to much lower temperatures in the lower crust, and a surface strike-slip faults currently exhibit strike-slip rates of severalcentimetres per year for several million years (e.g. #3.5 cm yr−1heat flow (105 mW m−2) comparable to that of the reference
model. For this single-layer model, the temperature increase for the Altyn Tagh fault, Tapponnier et al. 1986).
Assuming that 10 cm yr−1 is the maximum plausible rateat 35 km depth is only +80 °C (final temperature 615 °C), ascompared with +200 °C (final temperature 735 °C) for the that could be maintained during several million years, we
tested rates between 0 and 10 cm yr−1. In this range, the finaltwo-layer reference model. This illustrates the importance of astiff upper mantle to reach high temperatures in the lower temperatures significantly increase with the slip rate (Fig. 8a).
This increase is not linear and is better fitted by a second-crust (Fleitout & Froidevaux 1980). On the other hand, a
single-layer model, with the power-law flow of the upper order polynomial: a buffering effect induces the final temper-atures to saturate at high slip rates (Fig. 8a). However, formantle, shows substantial shear heating at the brittle/ductile
transition: at 15 km depth, the temperature increases by 485 °C common rates, lower than 6 cm yr−1, final temperatures on
the fault can be approximately fitted by a linear relationship,and reaches 628 °C. Below this transition, the shear-heatingeffect decreases sharply, and, below 40 km depth, final temper- the increase of temperature being of the order of 50 °C cm−1 yr
(Fig. 8a). Slip rate also influences the depth of the brittle/atures become lower than those of the reference model. The
corresponding surface heat flow over the fault is 125 mW m−2. ductile transition: if the slip rate increases, the depth of thebrittle/ductile transition decreases following approximately aVariations of the thermal parameters shows that shear
heating is much lower in an initially hot lithosphere than in a second-order polynomial (Fig. 8c). Similarly, the surface heat
© 1999 RAS, GJI 136, 19–40

26 P. H. L eloup et al.
Figure 6. Influence of basal heat flow (HFb) on the thermal structure of lithosphere before and during shearing. All other parameters are set to
their reference values (see Table 1). (a) Vertical profile along the fault of initial temperature (Ti) for heat basal flow (HFb)=10, 20 and 30 mW m−2.(b) Vertical profile along the fault of temperature increase (dT) and final temperature (T) for heat basal flow (HFb)=10, 20 and 30 mW m−2.(c) Initial temperature, temperature increase, and final temperature on the fault, at the Moho and at 20 km depth, as a function of HFb. (d) Surface
heat flow, along a line perpendicular to the fault, for heat basal flow (HFb)=10, 20 and 30 mW m−2.
flow above the fault increases with the slip rate, following the Byerlee’s value as an upper limit for frictional resistance in
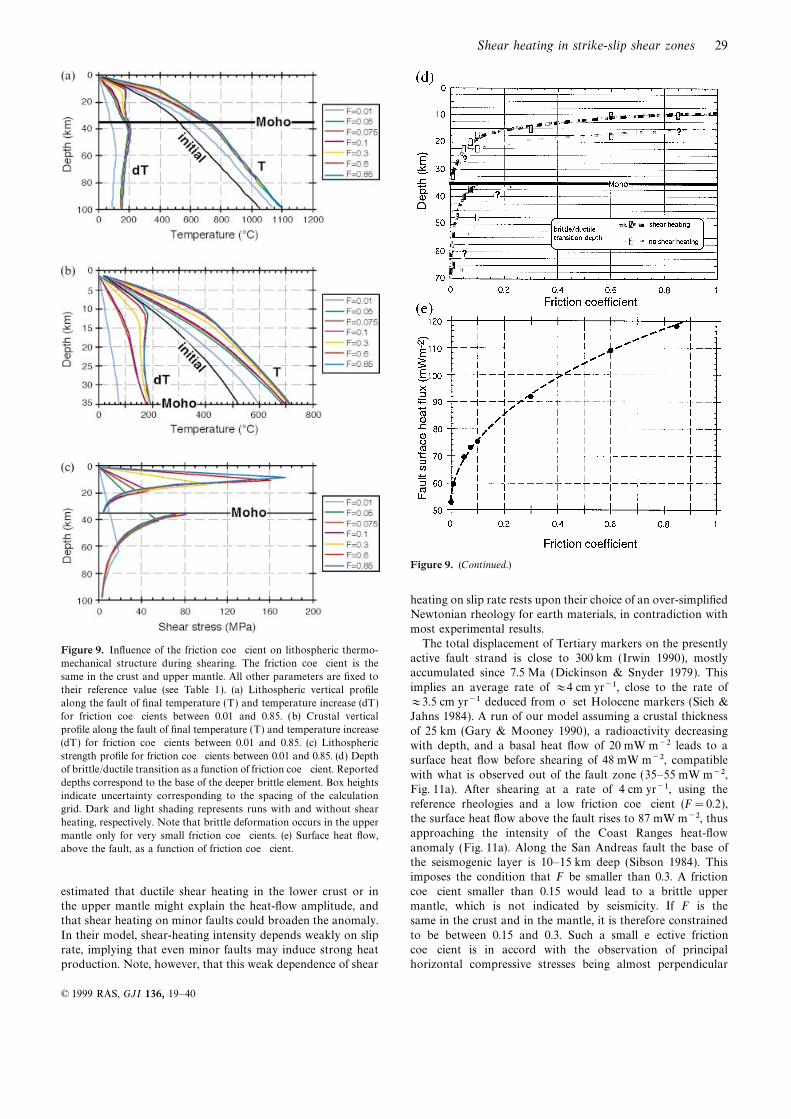
a fault zone, we tested values of F between 0.01 and 0.85same type of relationship (Fig. 8d).(0.6 being the reference value—see Table 1).
The friction coefficient fixes the slope of the brittle part of3.3.2 Friction coeYcient
the strength profile and the associated heat production byshearing. However, as the upper mantle only exhibits brittleAt sample scale, for most crustal rocks, the friction coefficient
(F) has a value between 0.85 and 0.6 depending on the level deformations for very small friction coefficients (F#0.1,
Figs 9c and d), final temperatures in the mantle and the lowerof normal stress (Byerlee 1978). In a large-scale fault zone,however, the effective friction coefficient probably depends on crust are nearly constant whatever the friction coefficient is
(700±25 °C at the Moho, Fig. 9b). The only exception is forthe level of crushing, lubrication and fluid pressure. Taking
© 1999 RAS, GJI 136, 19–40

Shear heating in strike-slip shear zones 27
coefficient: for reference parameters it reaches 118 mW m−2for F=0.85 (Fig. 9e). The brittle/ductile transition deepenswith decreasing friction coefficient, particularly for values of Fbelow 0.2 (Fig. 9d). Along the San Andreas fault and the
Alpine fault in New Zealand, earthquake focal depths extend to15 and 20 km, respectively (Chen & Molnar 1983). As a firstapproximation, such depths for the brittle/ductile transition
would correspond to low friction coefficients between 0.05 and0.3 (Figs 8c and 9d) and surface heat flows from 92 to70 mW m−2 (compared with 53 mW m−2 before shearing,
Fig. 9e). Alternatively, if there is no shear heating along thefault, these depths would correspond to higher frictioncoefficients (F>0.2), (Fig. 9d) and much higher peak shear
stresses (Fig. 2b).
3.3.3 Power-law coeYcients
Besides slip rate, ductile shear heating is determined by the
power-flow law used. Using a review of power laws of naturalrocks (Carter & Tsenn 1987), we tested three of them for eachlayer (crust and mantle): the hardest, the softest and an
intermediate one. Power-flow laws of dry orthopyroxenite(Raleigh et al. 1971), dry Westerly granite (Hansen & Carter1983) and wet Westerly granite (Hansen & Carter 1983) are
used for ‘hard’, ‘average’ and ‘soft’ crust, respectively, whilethose of dry dunite (Chopra & Paterson 1984), wet Mt Burnet
Dunite (Post 1977) and wet Anita bay dunite (Chopra &Paterson 1981) are used for ‘hard’, ‘average’ and ‘soft’ mantle,respectively (Table 1). ‘Hard’ rheologies induce a much more
efficient shear heating, particularly in the middle crust. At20 km deep, a hard crust is 190 °C hotter than a soft crust(Fig. 10). In the lower crust, hard mantle and soft mantle
lead to temperatures at the Moho of 845 °C and 693 °C,respectively (Fig. 10).
3.4 Maximum plausible shear heating along atranslithospheric strike-slip fault.
Given the above results, it is possible to determine which para-meter values lead to maximum shear heating: a fast slipping
fault (V =10 cm yr−1) with a high friction coefficient (F=0.6),affecting an initially cold lithosphere (HFb=10 mW m−2,K=2.5 W m−1 K−1, radioactive heat production profile 1)
Figure 7. Influence of crustal thickness (Mz) on thermal and mech-
composed of hard crust and mantle. A run with theseanical structure of lithosphere before and during shearing. All other
values leads to very high final temperatures of 933 °C at theparameters are set to their reference values (see Table 1). In all cases,
Moho (temperature increase of 587 °C), and 743 °C at 20 kmvertical profiles along the fault are shown for Mz=20, 35 and 45 km.
(temperature increase of 474 °C). This probably corresponds(a) Shear-stress profile along the fault. (b) Initial temperature (Ti).to the absolute maximum shear-heating effect that one could(c) Temperature increase (dT) and final temperature (T).expect along translithospheric strike-slip faults. This level of
shear heating is much higher than expected from previousstudies and would eventually induce P–T conditions compatibleextremely low friction coefficients (e.g. F=0.01), which resultwith partial fusion of granitic rocks at 10 km depth.in a brittle behaviour of most of the lithosphere, small shear
heating and a final temperature at the Moho of only 600 °C(Figs 9a and b). However, such deep brittle deformation, down
4 DISCUSSION: COULD HIGH HEATto 65 km (Figs 9c and d), is incompatible with the fact that
FLOW OBSERVED IN LITHOSPHERICseismicity along continental strike-slip faults is restricted in
SHEAR ZONES RESULT FROM SHEARthe crust (e.g. Chen & Molnar 1983).
HEATING?Changes of the friction coefficient have a much greater effect
in the upper crust, significantly changing the final temperatures, Observations of thermal state along major long-lastingstrike-slip faults can be compared with calculations, thusthe depth of the brittle/ductile transition, and the surface heat
flow (Figs 8 and 9). Surface heat flow increases with friction allowing discussion of the basic assumptions of our model.
© 1999 RAS, GJI 136, 19–40

28 P. H. L eloup et al.
Figure 8. Influence of fault slip rate (V ) on the thermal and mechanical state of lithosphere. (a) and (b) Temperature and temperature increase
at 20 km depth and 35 km depth (Moho) as a function of slip rate. Dashed lines are fits by a second-order polynomial, straight solid lines are
linear fits for slip rates up to 4 cm year−1. In (a) F=0.6 while in (b) F=0.1. All other parameters but slip rate are set to their reference values
(see Table 1). (c) Depth of brittle/ductile transition as a function of slip rate for F=0.6 and F=0.1. Solid lines correspond to a second-order
polynomial fit to the data. Error bars indicate uncertainty corresponding to the spacing of the calculation grid. (d) Surface heat flow above the
fault as a function of slip rate for F=0.6 and F=0.1. Solid lines correspond to a second-order polynomial fit to the data.
Unfortunately, the thermal states of major active strike-slip takes place in a broad zone with several surface strike-slip
fault strands, and with no heat-flow anomaly (Fig. 19 offaults are not well known, the best documented being that ofthe San Andreas fault zone. Lachenbruch & Sass 1980). North of 35°N, where deformation
is localized along one main fault strand, there is a large-scale,
#80 km wide, heat-flow anomaly—the Coast Ranges anomaly4.1 Thermal state of the active North America/Pacific
(Lachenbruch & Sass 1980) (Fig. 11a). In this area, heat flowstransform boundary
are between 50 and 100 mW m−2 near the fault, and drop to
42–55 mW m−2 80 km farther east. Along strike, the CoastThe absence of a localized heat-flow anomaly associated withthe present-day San Andreas fault trace (Lachenbruch & Sass Ranges heat-flow anomaly decreases towards the north and
finally vanishes at the Mendocino triple junction (Fig. 12 of1980) has been taken as evidence for low shear stress and/or
the absence of shear heating along major strike-slip faults. Lachenbruch & Sass 1980). The heat-flow anomaly is thusclearly associated with the fault zone.However, the San Andreas fault zone has a complex history,
which should be taken into account. Since the onset of the Some authors have attempted to explain this anomaly by
the effect of the northward migration of the Mendocinosubduction of the Farallon–Pacific ridge below North America,at approximately 30 Ma, the transform boundary between triple junction, without a contribution from shear heating
(e.g. Dickinson 1981; Zandt & Furlong 1982). In this case, aNorth America and the Pacific has been a lengthening right-lateral fault zone linking two triple junctions that migrate in good fit to the observed anomaly is only obtained for extreme
conditions, such as the opening of a lithospheric gap andopposite directions (Atwater & Molnar 1973). Within this
broad zone, the main fault has jumped eastwards several times upwelling of the asthenosphere along the triple-junction path(e.g. Lachenbruch & Sass 1980). On the other hand, shear-(e.g. Dickinson 1981) and coincides with the San Andreas fault
only since 7.5–5 Ma (Dickinson & Snyder 1979). Thus, the heating models have been proposed for the San Andreas
fault, and seem to explain the main heat-flow characteristicsthermal state of the San Andreas zone probably results fromvarious processes: subduction, opening of an asthenospheric satisfactorily. Using a previous version of the model presented
in this paper, Ricard et al. (1983) obtain a better fit of thewindow, and progressive eastward migration of the strike–slip
boundary. along-strike shape of the heat-flow anomaly than if shearheating is neglected, but with a modelled across-strike anomalyIn the area south of #35°N, below which the Farallon–
Pacific ridge subducted, the present-day transform motion narrower than observed. Thatcher & England (1998) also
© 1999 RAS, GJI 136, 19–40
Shear heating in strike-slip shear zones 29
Figure 9. (Continued.)
heating on slip rate rests upon their choice of an over-simplifiedNewtonian rheology for earth materials, in contradiction withmost experimental results.
The total displacement of Tertiary markers on the presentlyFigure 9. Influence of the friction coefficient on lithospheric thermo-active fault strand is close to 300 km (Irwin 1990), mostlymechanical structure during shearing. The friction coefficient is theaccumulated since 7.5 Ma (Dickinson & Snyder 1979). Thissame in the crust and upper mantle. All other parameters are fixed toimplies an average rate of #4 cm yr−1, close to the rate oftheir reference value (see Table 1). (a) Lithospheric vertical profile#3.5 cm yr−1 deduced from offset Holocene markers (Sieh &along the fault of final temperature (T) and temperature increase (dT)
for friction coefficients between 0.01 and 0.85. (b) Crustal vertical Jahns 1984). A run of our model assuming a crustal thicknessprofile along the fault of final temperature (T) and temperature increase of 25 km (Gary & Mooney 1990), a radioactivity decreasing(dT) for friction coefficients between 0.01 and 0.85. (c) Lithospheric with depth, and a basal heat flow of 20 mW m−2 leads to astrength profile for friction coefficients between 0.01 and 0.85. (d) Depth surface heat flow before shearing of 48 mW m−2, compatibleof brittle/ductile transition as a function of friction coefficient. Reported
with what is observed out of the fault zone (35–55 mW m−2,depths correspond to the base of the deeper brittle element. Box heights
Fig. 11a). After shearing at a rate of 4 cm yr−1, using theindicate uncertainty corresponding to the spacing of the calculation
reference rheologies and a low friction coefficient (F=0.2),grid. Dark and light shading represents runs with and without shearthe surface heat flow above the fault rises to 87 mW m−2, thusheating, respectively. Note that brittle deformation occurs in the upperapproaching the intensity of the Coast Ranges heat-flowmantle only for very small friction coefficients. (e) Surface heat flow,anomaly (Fig. 11a). Along the San Andreas fault the base ofabove the fault, as a function of friction coefficient.
the seismogenic layer is 10–15 km deep (Sibson 1984). Thisimposes the condition that F be smaller than 0.3. A friction
coefficient smaller than 0.15 would lead to a brittle upperestimated that ductile shear heating in the lower crust or inthe upper mantle might explain the heat-flow amplitude, and mantle, which is not indicated by seismicity. If F is the
same in the crust and in the mantle, it is therefore constrainedthat shear heating on minor faults could broaden the anomaly.
In their model, shear-heating intensity depends weakly on slip to be between 0.15 and 0.3. Such a small effective frictioncoefficient is in accord with the observation of principalrate, implying that even minor faults may induce strong heat
production. Note, however, that this weak dependence of shear horizontal compressive stresses being almost perpendicular
© 1999 RAS, GJI 136, 19–40

30 P. H. L eloup et al.
Figure 10. Influence of possible flow laws on lithospheric temperature structure along the fault during shearing. Hard, average and soft crust and
mantle refer to various power-flow laws used: see text and Table 1 for details. Initial: geotherm before shearing; dT: temperature increase due to
shear heating; T: final temperature.
to the fault zone (Zoback et al. 1987; Mount & Suppe 1987). are unfortunately not available east of the fault, where thecoast range anomaly is better defined. However, the lack ofFor a friction coefficient of 0.2, maximum shear stresses in
the crust are #70 MPa (Fig. 11c). This corresponds to a hot springs east of the San Andreas fault seems to limit the
importance of such phenomena, unless heat discharge occurs4.7 MPa km−1 vertical shear-stress gradient to compare withthe #7.9 MPa km−1 measured near the San Andreas fault in in numerous springs at temperatures only slightly above the
ambient. Obviously, heat-flow measurements do not providewells up to 850 m deep (Mc Garr et al. 1982). In the absence
of shear heating, our calculations indicate a brittle upper enough constraints on the deep thermal structure of the faultzone to distinguish between these hypotheses. In any case, ourmantle and a deep (≥20 km) crustal brittle/ductile transition,
even for very high friction coefficients (>0.6) that would model underestimates the thermal-anomaly width and thus
probably the total heat production.correspond to high crustal shear stresses (>325 MPa).However, notwithstanding that we take into account shear
heating in the whole lithosphere, the modelled surface heat-4.2 High-temperature metamorphism in exhumed
flow anomaly vanishes less than 50 km from the fault (Fig. 11a).strike-slip shear zones
This is a much smaller distance than that observed (Lachenbruch& Sass 1980). The broad measured anomaly has been inter- Large, exhumed strike-slip shear zones are listed in Table 2
with their main thermal characteristics. These shear zonespreted as due to shear heating either on horizontal planes(Lachenbruch & Sass 1980) or in a 80 km wide shear zone share two common features. First, down to the base of the
crust (granulite facies), strike-slip deformation appears to be(England & Molnar 1991). Given the complex history of the
fault zone both hypotheses are plausible although clearly localized in mylonitic zones usually less than 25 km wide.Second, metamorphic peak temperatures are high in the faultad hoc. The existence of a wide shear zone is in contradiction
with the fact that shear heating necessarily induces a progressive zones, and often lead to crustal partial melting.
We distinguish two main types of strike-slip faults: orogen-strain localization. It is possible that steady state is not yetreached in California and that the upper mantle still deforms parallel and orogen-oblique. Orogen-parallel strike-slip faults
that develop in the hanging walls of subduction zones (e.g. theover a wide zone. Alternatively, in our steady-state model,temperature increase in the lower crust and upper mantle Sumatra fault, Fitch 1972), and in internal part of orogenic
zones (e.g. the Insubric fault in the Alps, Lacassin 1989) resultoccurs in a wide zone. For example, at a depth of 20 km, the
temperature increases by 150 °C 25 km away from the fault from slip partitioning between thrusting and strike-slip faulting.Together with shear heating, subduction and/or thickening(Fig. 11b). From such depths, hot fluids could migrate upwards,
thus increasing and widening the surface heat-flow anomaly. processes affect the thermal regime of such faults. This must
be kept in mind during any comparison with geological data.In the upper crust, fluids could also migrate laterally alongpre-existing discontinuities (faults, bedding, etc.), broadening On the other hand, orogen-oblique strike-slip faults develop
in most cases during indentation tectonics (e.g. Tapponnierthe anomaly further. Supporting this idea, intense fluid
migration in the upper crust has been suggested west of the & Molnar 1976) and cut across contemporaneous thrustsand fold. The Altyn Tagh Fault of northern Tibet (e.g. Peltzerfault on the basis of high H2O content, high d18O, and low
dD of granitoids (O’Neil & Hanks 1980). Such measurements et al. 1988) is a good example of a present-day cross-cutting
© 1999 RAS, GJI 136, 19–40

Shear heating in strike-slip shear zones 31
Tab
le2.
Ther
malre
gim
ein
som
est
rike-
slip
fault
zones
.
Nam
elo
cati
on
typ
ele
ngt
h(L
inkm
)ti
min
g(T
)M
etam
orp
his
msy
nk
inem
atic
mag
mat
ism
Ref
eren
ces
wid
th(w
inkm
)st
rik
e-sl
ipra
teP
–Tes
tim
ate
s87/86
Sr
ofgra
nitoid
s
off
set
(oin
km
)(r
incm
/yr)
shea
rse
nse
(S)
Alp
ine
fault
–N
ewZ
eala
nd
South
Pla
teboundary
L#
600
km
T:since#
36
Ma
Low
am
phib
olite
som
epeg
matitic
dykes
?Sib
son
etal.
Isla
nd
$oro
gen
oblique
inla
nd
r#1–2.5
inth
eT
:490–540°C
(1979)
–Tra
nsform
bet
wee
nin
the
Mio
cene
w1.5
km
Mio
cene,
#3.5
with
P:5.4
–6.6
kb?
Gra
pes
(1995)
Paci
fic
&A
ust
ralia
$oro
gen
-para
llel
o#
480
km
com
pre
ssio
nA
rgon
and
Sr
Sch
olz
etal.
since
10–5
Ma
S:dex
tral
since
.D
eple
tion
(1979)
Gre
atSla
ve
Lake
–N
ort
hW
est
Ter
rito
ries
Intr
aco
ntinen
tal
L#
1300
km
T#
2–1.9
Ga
Gra
nulite
togre
ensh
ist
synkin
ematic
bath
olith
eH
offm
an
(1987)
shea
r-zo
ne
Canada
oro
gen
-oblique
w≤
25
km
bel
t1:840°C
&8.2
kb
(cand
Kf-
cdio
rite
)H
anm
er(1
988)
GS
Lsz
–B
oundary
bet
wee
nth
eo#
300–700
km
bel
t2:880°C
&7.5
kb
and
mig
matite
s.
slave
and
Churc
hill
S:dex
tral
bel
t3:680°C
&4
kb
som
ela
tedia
base
dik
es.
pro
vin
ces
Ailao
Shan–R
ed–
SE
Asia
Intr
aco
ntinen
tal
L≥
1000
km
T:O
ligo-M
ioce
ne,
Am
phib
olite
synkin
ematic
leuco
cla
yer
sL
eloup
etal.
Riv
er–
Boundary
bet
wee
noro
gen
-oblique
inla
nd
from
#40?
to(P
5kb-T
700°C
)and
monzo
nitic
bodie
s(1
995)
AS
RR
szIn
doch
ina
and
South
w#
20
km
16
Ma
togre
ensh
ist
(0.7
071
to0.7
234)
Sch
are
ret
al.
Chin
a.
o≥
700±
200
km
r#4±
1(1
994)
S:sinistr
al
Zhang
(1995)
Dom
Fel
icia
no
bel
t–
South
ern
Bra
zil–
Uru
guay
Oro
gen
-para
llel
L>
500
km
T:P
an
Afric
an
pro
gra
de
2gen
erations:
Tom
masi
etal.
(Bra
zil)
–in
tern
alpart
ofco
llisio
nw≤
15
km
met
am
orp
hism
from
1)
cdio
rite
-adam
elites
(1994)
bel
tbet
wee
nR
iode
laS:sinistr
al
#550°C
to#
675°C
(0.7
163)
pla
ta&
Kala
hari
#425°C
at#
3K
b2)Sodipota
ssic
to
crato
ns
per
alc
aline
leuco
c(0
.7329)
South
Am
eric
an
–South
Britt
any
(Fra
nce
)O
rogen
-para
llel
L>
300
km
T:C
arb
onifer
ous
trip
lepoin
tA
nd-S
ill-K
yN
um
erous
and
larg
e2
Jegouzo
(1980)
shea
r-zo
ne
–Sep
ara
tece
ntr
aland
w:2
bra
nch
es?–
330–290?
Ma
(#T
450°C
,P
mic
as
leuco
cre
sultin
gStr
ong
&H
anm
er
SA
szSouth
ern
am
eric
an
hundre
ds
m4.5
kb)
from
anate
xis
(1981)
dom
ain
wid
ese
para
ted
togre
ensc
hist
ofth
ese
dim
ents
.
by
adef
orm
ed0.7
03
to0.7
102
(incr
ease
bel
tup
tow
ith
tim
e)
60
km
wid
e.
S:D
extr
al
Coım
bra
–B
adajo
z–
–C
entr
alP
ort
ugal&
Oro
gen
-para
llel
L>
400
km
T:U
pper
gra
nulite
?–am
phib
olite
–N
um
erous
and
larg
e2
Burg
etal.
(1981)
Cord
oba
shea
r-Spain
w#
20
km
Carb
onifer
ous
gre
ensh
ist
mic
as
leuco
gra
nites
zone
S:sinistr
al
Ser
rada
Fre
ita
–C
entr
alP
ort
ugal
Oro
gen
-para
llel
L>
70
km
T:C
arb
onifer
ous
am
phib
olite
Larg
e2
mic
ras
Rea
vy
etal.
(1991)
shea
r-zo
ne
w#
2km
(sillim
anite)
leuco
gra
nite
0.7
136
S:sinistr
al
© 1999 RAS, GJI 136, 19–40

32 P. H. L eloup et al.
strike slip, with a rate of 1–2.5 cm yr−1 (e.g. Stock & Molnar
1987).Close to the fault, the Mesozoic schistosity is transposed by
a steeper one, parallel to the fault (e.g. Findlay 1987). This
transposition corresponds to the formation of metamorphicisogrades parallel to the Alpine fault: metamorphism increasesfrom phrenite-pumpellyite #14 km from the fault (#260 °Cand 4.2 kb) to garnet-oligoclase amphibolite facies within6 km (e.g. Grapes 1995). Along the fault, in the K-feldsparzone, pressure–temperature conditions of metamorphism are
in the range 5.4–6.6 Kb (20–24 km) and 490–540 °C (Grapes1995). K–Ar ages, which are Cretaceous (150–120 Ma) morethan 25 km east of the fault (e.g. Harper & Landis 1967), show
a progressive younging towards the fault, and become youngerthan 30 Ma less than 10 km from it (e.g. Adams & Gabites1985; Sheppard et al. 1975). Fission-track ages follow the same
trend, with no apatite age older than 35 Ma less than 40 kmfrom the Alpine fault and no zircon age older than 10 Ma inthe amphibolite zone (Kamp et al. 1989).
It is thus clear that, during the Cenozoic, the low-gradeschists metamorphosed in the Mesozoic suffered a secondprograde metamorphism coeval with strike-slip deformation
along the Alpine fault. Shear heating is a very appealingmechanism to explain such a thermal event. Scholz et al. (1979)
calculated that, if depth-averaged shear stress on the fault wasin excess of 50 MPa, the temperature increase induced by shearheating could lead to argon degassing, explaining the observed
age pattern. Our model confirms this calculation. The present-day crustal thickness far from the Alpine fault (#30 km;Woodward 1979) gives a lower bound for the crustal thickness
in the Oligocene. At this time, the geotherm was thus probablyclose to our initial geotherm calculated for a crustal thick-ness of 35 km (Fig. 12). After strike-slip faulting at a rate of2.5 cm yr−1, and for the reference parameters, our model
Figure 11. Shear-heating model applied to the San Andreas faultindicates that temperatures close to 540 °C are attained in the
between 35 and 40°N. Run executed with the following parameters:shear zone at a depth of #23 km, in very good agreementK=2.5 Wm−1 K−1, HFb=20 mW m−2, Qr (in mW m−3 )=2 from 0with the P–T estimates. This would imply at least #23 km ofto 7.5 km, 1.6 to 15 km, 0.4 to Moho, M
z=25 km, V =4 cm yr−1,
late Cenozoic uplift east of the Alpine fault at an average rateFc=0.1, Fm=0.1, average crust, average mantle. (a) Heat-flowof #2.3 mm yr−1 in order to bring these high-temperaturemeasurements (regions 3, 4, 5 and 6 of Lachenbruch & Sass 1980)
plotted together with heat flow from model (continuous line) and an rocks to the surface. Such rates are compatible with the upliftestimate of heat flow considering substantial heat advection in the rates of 2.6–7 mm yr−1 estimated for the last #340 000 yearsmiddle and upper crust (dashed line). The diagonal pattern shows the (Bull & Cooper 1986). Indeed, since #10 Ma, the relativeheat-flow value outside the San Andreas fault zone. (b) Temperature Australia/Pacific motion has been oblique to the Alpine faultincrease in the lithosphere due to shear heating according to the model
(e.g. De Mets et al. 1990; Berryman et al. 1992; Wellman 1984),(no heat advection). In the crust, a temperature increase of more than
thus inducing rapid uplift of the Southern Alps that fringe100 °C is restricted to within 50 km of the fault. (c) Corresponding
the fault to the SE. Such uplift has deformed the meta-lithospheric shear-stress profile in the fault zone.morphic isogrades formed previously during purely strike-slipdeformation. Several authors thus explain the increase of
metamorphism towards the fault by an increase of exhumationstrike-slip fault. Far from the collision front, such faults affecta mildly deformed lithosphere, and their characters may be rather than shear heating (e.g. Wellman 1979; Adams 1979).
This hypothesis seems unconvincing because it needs andirectly compared with the results of our model.unlikely ‘40Ar partial retention zone’ to explain the age pattern(e.g. Adams & Gabites 1985; Kamp et al. 1989), and does not
4.2.1 Shear heating in orogen-oblique strike-slip shear zonesfit with the thermobarometric data nor the present-day topo-graphy. Nonetheless, only further field work could confirmT he Alpine fault of New Zealand: The New Zealand Alpine fault,
part of the Australia–Pacific plate boundary, is a #600 km shear heating as the primary metamorphic process.
Great Slave shear zone (NW territories, Canada): Deep strike-long straight fault marked by a #1.5 km wide stripe ofcataclasites, pseudotachylites and mylonites (Sibson et al. slip mylonites crop out in the #1300 km long Precambrian
Great Slave Lake (GSL) shear zone of NW Canada (Table 2)1979). The fault cuts and offsets by 480 km a Jurassic-
Cretaceous subduction complex (Wellman 1955). Most of this (e.g. Hoffman 1987; Hanmer 1988). At large scales, the faultzone cuts across previous structures and offsets the Thelonoffset took place in the Oligo-Miocene (e.g. Cooper et al.
1987), when the Australia/Pacific motion was almost purely and Taltson volcanic arcs. Finite dextral offset is estimated to
© 1999 RAS, GJI 136, 19–40

Shear heating in strike-slip shear zones 33
Figure 12. Shear-zone crustal geotherms calculated for a 4 cm yr−1 shear rate compared with thermobarometric data of ASSR and GSL shear
zones and crustal melting curves. Steady-state model geotherms. Initial: reference model before shearing; Average: V=4 cm yr−1, otherwise reference
parameters; maximum: maximum shear heating for V=4 cm yr−1 (F=0.6, hard crust, hard mantle); Minimum: minimum shear heating for
V =4 cm yr−1 (F=0.1, soft crust, soft mantle). Simplified crustal melting curves. Wet solidus: H20-saturated metapelite solidus (Thompson 1982);
Muscovite breakdown: muscovite dehydration melting (Mus+Alb+Q�Ksp+Als+L) (Peto 1976); Biotite break-down: biotite dehydration
melting (Bio+Als+Pl+Q�Gar+Ksp+L) (Le Breton & Thompson 1988). P–T estimates. ASRR shear zone: Peak (P1b and DNCV) and
retrograde (P2) paragenesis (Leloup & Kienast 1993; Leloup, unpublished data); Great slave lake shear zone (GSL): GSL1, 2 and 3 correspond
to P–T estimates in the granulite, upper amphibolite and amphibolite belts of the shear zone, respectively (Hanmer 1988).
be between 300 and 700 km. The shear zone, up to 25 km Ailao Shan–Red River shear zone (China and V ietnam): The
Ailao Shan–Red River (ASRR) shear zone is possibly the best-wide, is made of five parallel mylonitic belts (1–5) formedunder granulite to greenschist metamorphic facies. Through documented example of a mid-crustal orogen-oblique shear zone.
This zone allowed the lateral escape of the Indochina block intime, deformation progressively occurred in narrower belts
of lower metamorphic grade (Hanmer 1988). Belts 1 and 2, of response to the India/Eurasia collision (e.g. Tapponnier et al.1986; Tapponnier et al. 1990; Leloup et al. 1995). The ASRRgranulite and upper amphibolite facies, respectively, formed in
lower crustal conditions at high temperatures (#8.2 Kb and shear zone is nearly 1000 km long with ductile left-lateral strike-
slip shear exposed in four elongated mylonitic cores less than#840 °C for belt 1, and #7.5 Kb and #880 °C for belt 2)(Fig. 12). Belt 3 formed at around 15 km depth (#4 Kb) at 20 km wide. Displacement is estimated at 700±200 km (Leloup
et al. 1995). Thermo-barometric studies show that transcurrenttemperatures of about 680 °C (Fig. 12). Belts 4 and 5 are
1–1.5 km wide zones of rocks deformed under greenschist strain occurred under amphibolite facies conditions (3–8 kb and550–825 °C; Fig. 12). Leucocratic and monzonitic melts werefacies in which P–T conditions are difficult to assess. During
strike-slip faulting, the shear zone has been progressively emplaced during strike-slip shear. Such rocks yield U/Pb ages
between 26.3 and 22.4 Ma, implying Lower Miocene shearuplifted and cooled along a steep geothermal gradient. Strike-slip deformation was coeval with extensive in situ melt pro- (Scharer et al. 1990; Scharer et al. 1994; Zhang 1995).
Geochemical data indicate that magmatic rocks in the ASRRduction, as attested by syntectonic migmatization in belts 1
and 2, and syntectonic granitoid intrusions in belts 1–4. Some zone originated from partial melting in both the lower andmiddle crust (Zhang 1995). A strike-slip rate of 4±1 cm yr−1late-syntectonic mafic dykes (diabase) are found in belt 2. U/Pb
ages of zircons from the intrusions bracket deformation age seems to have been maintained between #35 and 16 Ma (Briaiset al. 1993; Leloup et al. 1994; Harrison et al. 1996). The crustbetween #1.98 and #1.925 Ga (Hanmer 1988).
Strike-slip deformation along the GSL occurred at high is #35 km thick (Yan Qizhong et al. 1985) and Tertiary
thickening is moderate along most of the fault. This led Lelouptemperatures in a narrow zone. This suggests that shear heatingwas the main mechanism of producing heat along this fault. & Kienast (1993) to propose shear heating as the main cause
of the high temperatures observed in the ASRR shear zone.To obtain a final geotherm compatible with the P–T estimates
in the GSL, it is necessary to use parameters leading to the The geotherm calculated for reference parameters (crust35 km thick, HFb=20 mW m−2) and a strike-slip rate ofabsolute maximum shear-heating effect that one could expect
along a translithospheric strike-slip fault (V =10 cm yr−1, 4 cm yr−1 ( labelled ‘average’ on Fig. 12) is much hotter than
the initial one but still too cold to explain the ASRR peakF=0.6, hard crust and mantle, see Section 3.4). While veryunlikely, such a possibility cannot be ruled out, as the old age metamorphic conditions. The maximum shear-heating effect
would be obtained using a high friction coefficient (i.e. F=0.6)of the GSL precludes any determination of the palaeo-slip rate.
© 1999 RAS, GJI 136, 19–40

34 P. H. L eloup et al.
and hard rheologies. The resulting geotherm (labelled ‘maxi- composed of a fertile ‘granite minimum’ component (40 wt per
cent) and a refractory component, located at 30 km depth,mum’ on Fig. 12) is barely compatible even with the higher Pand lower T estimates in the ASRR shear zone. produces #5.5 vol per cent of melt when the temperature of
muscovite breakdown is reached (#700 °C). The melt fractionP–T conditions recorded in the ASRR and GSL shear zones
are similar and define a geotherm probably typical of large attains #8 vol per cent just below the temperature of biotitebreakdown (#770 °C) and suddenly rises to #16 vol per centcontinental orogen-oblique shear zones (Fig. 12). In both
cases, our calculations fail to model this geotherm, or do it above it (Fig. 2 of Thompson & Conolly 1995). In the case of
the ASRR shear zone (V =4 cm yr−1 ), conditions compatiblefor unrealistic parameters only (e.g. slip rate of 10 cm yr−1 forthe GSL). Surprisingly, our model thus underestimates the with partial melting are easily reached (Fig. 12). The modelled
geotherms are compatible with water-saturated partial meltingfinal temperatures. This was not expected, as several charac-
teristics of the model tend to maximize the shear-heating effect: below #30 km for soft rheologies and low friction coefficient(‘minimum’, Fig. 12), #25 km for reference parameters (‘average’)(1) 100 per cent of the mechanical energy is converted to heat;
(2) latent-heat-consuming metamorphic reactions are neglected; and #16 km for hard rheologies and high friction (‘maximum’).
Muscovite breakdown would occur below #32 km (‘average’)(3) steady state is assumed, requiring several million years ofuninterrupted strike-slip faulting; (4) shear heating is taking or 21 km (‘maximum’), while biotite breakdown would occur
only for maximum conditions below #32 km.place in both ductile and brittle fields of the crust and mantle.
Our choice of using a simplified solution, neglecting shear Comparing the modelled geotherms with the peridotitesolidus permits the discussion of the possibility of mantleheating on horizontal planes, leads to a slight underestimation
of the shear heating effect (see Appendix A). This underestimation partial melting (Fig. 13). For a dry upper mantle, temperatures
before and during shearing are far too low to produce partialis, however, too small to explain the discrepancy between themodel results and the observed P–T conditions. In our model, melting of the lithospheric mantle. Even decompression by a
dramatic vertical uplift (arrow 1 on Fig. 13) could not induceheat transfer occurs only by conduction, while in nature heat
advection processes may be important. Advection might trans- such melting. For an improbable water-saturated upper mantle,partial melting may be reached at much lower temperaturesport heat from regions where it is produced, mostly at the brittle/
ductile transition and in the upper mantle, towards colder areas. (Fig. 13). It would occur at the base of the lithosphere beforeshearing (100 km depth) and below#76 km (23 kb) to#57 kmFurthermore, in a long-lasting shear zone, such a mechanism
may increase the global heat production. Indeed, if heat diffuses (17 kb) during shearing, depending on the final geotherm
considered (Fig. 13). As the upper mantle probably contains aslowly, temperatures rise rapidly near the heat source, bufferingheat production by shear heating. On the other hand, if heat small fluid fraction, an intermediate solidus should be used. In
that case, partial melting could occur during shearing in theis removed from where it is produced, the buffering effect is
reduced as sheared rocks remain colder and thus stiffer. lower part of the lithosphere, below #86 km (26 kb) (Fig. 13).After shearing, decompression melting of the lithosphericmantle would be possible for rocks initially located in the
4.2.2 Heat advection in strike-slip shear zoneslower part of the lithosphere (arrow 2 on Fig. 13), but in mostcases after a large adiabatic uplift (arrow 3 on Fig. 13). LargeVarious mechanisms may account for a more efficient heat
transport than the isotropic diffusion considered in our model. rapid uplift is unlikely to occur along the entire length of a
strike-slip shear zone but may exist locally, for example belowIn shear zones, the mylonitic schistosities and foliations areparallel to the zone. Sedimentary rocks show a strong aniso- large pull-apart basins. The contribution of mantle-derived
melts could be at the origin of the mafic dykes observed in thetropy in thermal conductivity, which is low (<2 W m−1 K−1)perpendicular to bedding and up to three times higher parallel GSL shear zone and could have enhanced lower crustal melting
and alkaline magma production in the ASRR shear zone. Into it (Deming 1994). If such anisotropy existed in foliatedmetamorphic rocks, heat would diffuse more rapidly along the most strike-slip zones, however, the mantle contribution to
magmatism seems limited and most plutonic rocks show 87/86Srshear zone than across it, even in the case of purely conductiveheat transfer. Furthermore, hot fluids move easily along the ratios greater than 0.7 (Table 2).
Lithospheric-scale shear heating and heat advection bymylonitic fabric, making the shear zone a good heat pathway.
Melted rocks and rising magmas can be very efficient heat rising melts or fluids is thus a plausible mechanism to explainhigh-grade metamorphism and high heat flows in largecarriers. In dikes feeding some Himalayan leucogranite batho-
liths the estimated magma ascent rates of melts produced by orogen-oblique strike-slip shear zones. We propose a model of
a lithospheric shear zone (Fig. 14) where high temperatures inmuscovite breakdown are of the order of 1 m s−1 (Scaillet et al.1996). This mechanism could thus carry heat nine orders of the lower crust are triggered by shear heating in the upper
mantle. Melt ascent in the shear zone accentuates the thermalmagnitude more efficiently than conduction. Melt ascent isvery probably enhanced in a vertical shear zone. However, anomaly associated with the fault and may promote strain
localization. Mantle melting at the base of the lithosphere, byis shear heating able to produce crustal partial melting?
In most cases, modelled final temperatures in the lower shear heating and eventually with local decompression, mayfurther enhance crustal melting.crust are hotter than the water-saturated solidus for meta-
pelites (Fig. 12). Nevertheless, substantial melting in such
conditions would require a large reservoir of free water and a4.2.3 Shear heating in orogen-parallel strike-slip shear zones
large porosity, both unexpected in the lower crust. In theabsence of free water, partial fusion may occur by dehydration Most strike-slip shear zones that have developed within orogenic
belts show a spatial and temporal coincidence of transcurrentmelting (or breakdown) of hydrous minerals (mainly micas andamphiboles) (e.g. Thompson & Conolly 1995; Gardien et al. shear, high-temperature metamorphism and granitoid magma-
tism (e.g. Hutton & Reavy 1992). For example, the Hercynian1994). According to Thompson & Conolly (1995), a dry rock
© 1999 RAS, GJI 136, 19–40

Shear heating in strike-slip shear zones 35
Figure 13. Shear-zone lithospheric geotherms calculated for a 4 cm yr−1 shear rate compared with peridotite melting curves. Steady-state model
geotherms. Same as in Fig. 12. Simplified upper mantle melting curves. Wet solidus: H20-saturated peridotite (Kushiro et al. 1968); dry solidus: dry
peridotite solidus (Wyllie 1971); solidus for pyrolite with #0.2 per cent H20 (Green 1973). Arrows 2 and 3 correspond to possible decompression
paths leading from a shear-heating geotherm to mantle partial fusion in the case of a slightly hydrous upper mantle. Note that such decompression
melting is impossible if starting from the initial geotherm.
shear zones of Brittany (e.g. Jegouzo 1980; Strong & Hanmer that shear heating in the upper mantle inducing melting of the
base of the crust, rise of melts in the fault pathway and, finally,1981), and Iberia (Burg et al. 1981; Reavy et al. 1991) areassociated with synkinematic two-mica leucogranites that mid-crustal fusion, explains the relative timing and composition
of syn-shear granites of the Don Feliciano belt (Tommasiresult from partial melting of crustal material, probably meta-
sediments (Table 2) (Reavy et al. 1991; Strong & Hanmer 1981). et al. 1994).Along the Don Feliciano transcurrent belt of Brazil, twogenerations of granitoids were emplaced during deformation
5 IMPLICATIONS ON DEEP STRUCTURE(Tommasi et al. 1994): first, calc-alkaline metaluminus grano-
OF LITHOSPHERIC FAULTS AND STRAINdiorites to adamellites probably resulting from fluid-absent
LOCALIZATIONlower crustal melting; second, sodi-potassic to sodic pera-
luminous leucogranites that probably result from partial Most previous studies have considered that shear heating takesplace in the brittle portion of faults only. If this were the case,melting of fluid-bearing middle crust.
In orogens, crustal shortening induces the thickening and near-surface high temperatures along strike-slip faults could
be explained but for improbable high shear stresses, whileburial of the radiogenic layers. After thermal relaxation, thisresults in an overall heating of the crust that is regarded lower crustal high-grade metamorphism and partial fusion in
exhumed strike-slip shear zones would be difficult to justify.as responsible for regional metamorphism (e.g. England &
Thompson 1984; Gaudemer et al. 1988). However, even in the The steady-state model of a translithospheric strike-slip faultzone presented here may explain the association of deformation,most favourable case (instantaneous doubling of crust), thermal
relaxation produce only 5 wt per cent melt in the lower crust metamorphism and plutonism frequently observed in ductile
shear zones, without requiring shear stresses higher than40 Myr after thickening (Thompson & Conolly 1995). In orderto produce larger amounts of melt, mantle delamination (e.g. several tens of megapascals in the crustal part of the fault zone.
As expected from previous theoretical calculations (Brun &Houseman et al. 1981) is often invoked. It has been interpreted
as responsible for granitoid emplacement in a strike-slip regime Cobbold 1980; Fleitout & Froidevaux 1980; Ricard et al. 1983),a buffering effect exists as shear heating produces less heatin the British Caledonides (Hutton & Reavy 1992). However,
this mechanism would produce a thermal anomaly and melt at high temperatures. However, consideration of a two-layermedium (crust and mantle), and shear heating in both brittleemplacement over an area broader than the strike-slip shear
zone. Furthermore, delamination can only occur after significant and ductile regimes, limits the buffering effect. In particular, at
temperatures for which shear heating in the soft lower crustcrustal thickening, late in the collision history. It may thusexplain magmatism only in the case of late to post-orogenic is negligible, deformation of the strong ductile upper mantle
continues to produce heat. Shear heating will be particularlystrike-slip faults.
On the other hand, shear heating could explain high- strong if the fault affects an initially cold lithosphere, if theshear rate is high, if effective friction is high and if the crusttemperature metamorphism and the onset of magmatism in
strike-slip shear zones earlier in the collision history. Even and the mantle have hard rheologies. In favourable cases,
temperatures higher than previously thought could be reached,small, because in a hot lithosphere, shear heating might inducestrain localization and account for the additional heat needed with an absolute upper bound of #600 °C for the temperature
increase.to produce partial melting in thermal relaxation models. Note
© 1999 RAS, GJI 136, 19–40

36 P. H. L eloup et al.
Figure 14. Sketch of a continental strike-slip fault at lithospheric scale, modified from Leloup et al. (1995). (a) Structure of shear zone at
lithospheric scale. Because of shear heating, the 300 °C, 500 °C and 700 °C isotherms (upper limits of greenschist facies, amphibolite facies and
hydrous partial melting, respectively) are shallower in the shear zone. Shear heating in the upper mantle can be strong enough to initiate partial
melting of the lower crust, and hence to induce the ascent of crustal melts in the shear zone. (b) Strength profiles along shear zone for cases of:
no shear heating (dashed line), shear heating and heat transport only by conduction (grey line), shear heating inducing partial melting of lower
crust and heat advection in the shear zone (black line). (c) Estimates of surface heat flow across the fault for the cases in (b). Because of shear
heating, heat flow is higher near the fault. The heat-flow anomaly is possibly amplified and broadened by heat advection (rise of melts in the shear
zone and migration of hot fluids out of the upper crustal shear zone).
Our purely conductive model underestimates the temper- In our model, ductile deformation is not a priori localized,but shear heating leads to localization in a narrow shear zoneatures observed in natural shear zones, leading us to infer that
the fault zone is probably a good pathway for hot fluids, a few tens of kilometres wide. This modelled shear zone is 2–3times larger than those observed in the field. It probablyenhancing convective heat transport. First, this would sub-
stantially raise temperatures in the upper part of the shear implies that shear heating is not the only strain-softening
mechanism. Together with the probable major effect of meltszone, thus increasing both vertical and horizontal thermalgradients. Second, this efficient heat transport would extract emplaced in the shear zone, other softening mechanisms such
as structural softening (rotation of structures to a more favour-heat from where it is produced, thus increasing the net heatproduction by shear. These two effects can be particularly able orientation with respect to the stress regime, formation
of a fault-parallel mylonitic anisotropy) or small-scale mech-strong when lower-crust partial fusion occurs, possibly giving
rise to the very fast ascent of magmas in the shear zone. anisms (dynamic recrystallization, grain size reduction etc.)may concur to further decrease the shear-zone width andMelting of water-saturated rocks could occur quite
easily in lithospheric shear zones, even at low shear rates enhance strain localization.
(V #1 cm yr−1). In the absence of such water-saturated rocks,melting can occur by dehydration melting of muscovite and
ACKNOWLEDGMENTSbiotite at higher shear rates (V ≥3 cm yr−1 ) and for average
and hard mantle rheologies. Thus, crustal thickening is This manuscript benefited from constructive reviews byMousumi Roy and an anonymous reviewer. We thankunnecessary to explain the high-grade metamorphism and
magmatism associated with strike-slip fault zones. P. Tapponnier, G. King, S. Tait and many others for discussions
© 1999 RAS, GJI 136, 19–40

Shear heating in strike-slip shear zones 37
Fitch, T.J., 1972. Plate convergence, transcurrent faults and internalduring the extended gestation of this paper. This is IPGPdeformation adjacent to southeast Asia and the western Pacific,contribution no. 1548.J. geophys. Res., 77, 4432–4460.
Fleitout, L. & Froidevaux, C., 1980. Thermal and mechanical evolution
of shear zones, J. struct. Geol., 2, 159–164.REFERENCES
Gardien, V., Thompson, A.B., Grujic, D. & Ulmer, P., 1994. The role
source composition on melt fraction generation during crustalAdams, J., 1979. Vertical drag on the Alpine fault, New Zealand, inanatexis, EOS, T rans. Am. geophys. Un., 75, 359–360.The origin of the Southern Alps, eds Walcott, R.I. & Cresswell, M.M.,
Gary, S.F. & Mooney, W., 1990. Lithospheric structure and tectonicsR. Soc. NZ bull., 18, 47–53.from seismic-refraction and other data, in T he San Andreas FaultAdams, C.J. & Gabites, J.E., 1985. Age of metamorphism and upliftSystem, California, Chapter 8, ed. Wallace, R.E., US geol. Surveyin the Haast schist group at Haast pass, lake Wanaka and lakeProf. Paper, 1515, 61–80.Hawea, South Island, New Zealand, NZ J. Geol. Geophys., 28,
Gaudemer, Y., Jaupart, C. & Tapponnier, P., 1988. Thermal control.85–96.on post-orogenic extension in collision belts, Earth planet. Sci. L ett.,Atwater, T. & Molnar, P., 1973. Relative motion of the Pacific and89, 48–62.North American plates deduced from sea-floor spreading in the
Goetze, C. & Evans, B., 1979. Stress and temperature in the bendingAtlantic, Indian and South Pacific Oceans, in Proc. conf. tectoniclithosphere as constrained by experimental rock mechanics, Geophys.problems of the San Andreas fault system, eds Kovach, R.L. &J. R. astr. Soc., 59, 463–478.Nur, A., Stanford Univ. publ. geol. Sci., 13, 136–148.
Grapes, R.H., 1995. Uplift and exhumation of alpine schist, SouthernBarr, T.D. & Dahlen, F.A., 1989. Brittle frictional mountain building 2.Alps, New Zealand: thermobarometric constraints, NZ J. Geol.Thermal structure and heat budget., J. struct. Geol., 94, 3923–3947.Geophys., 38, 525–533.Berryman, K.R., Beanland, S., Cooper, A.F., Cutten, H.N.,
Green, D.H., 1973. Experimental melting studies on a model upperNorris, R.J. & Wood, P.R., 1992. The Alpine fault, New Zealandmantle composition at high pressure under water-saturated andvariation in Quaternary structural style and geomorphic expression,water-undersaturated conditions, Earth planet. Sci. L ett., 19,Ann. T ect., 6 (sup.), 126–163.37–53.Brace, W.F. & Kohlstedt, D.L., 1980. Limits on lithospheric stress
Hanmer, S., 1988. Great Slave Lake shear zone, Canadianimposed by laboratory experiments, J. geophys. Res., 85, 6248–6252.shield: reconstructed vertical profile of a crustal-scale fault zone,Brun, J.P. & Cobbold, P.R., 1980. Strain heating and thermal softeningT ectonophysics, 149, 245–264.in continental shear zones: a review, J. struct. Geol., 2, 149–158.
Hansen, F.D. & Carter, N.L., 1983. Semibrittle creep of dry andBull, W.J. & Cooper, A.F., 1986. Uplifted marine terraces along thewet Westerly granite at 1000 MPa, in Proc. Conf. 24th US symp.Alpine fault, New Zealand, Science, 234, 1225–1228.on rock mechanics, pp. 429–447, Texas A&M University, CollegeBurg, J.P., Iglesias, M., Laurent, P., Matte, P. & Ribeiro, A., 1981.Station.Variscan intracontinental deformation: the Coimbra-Cordoba shear
Harper, C.T. & Landis, C.A., 1967. K–Ar ages from regionally meta-zone (SW Iberian peninsula), T ectonophysics, 78, 161–177.morphosed rocks, South Island, New Zealand, Earth planet. Sci.Byerlee, J., 1978. Friction of rocks, Pure appl. Geophys., 116, 615–626.L ett., 2, 419–429.Carter, N.L. & Tsenn, M.C., 1987. Flow properties of continental
Hoffman, P.F., 1987. Continental transform tectonics: Great Slave Lakelithosphere, T ectonophysics, 136, 27–63.shear zone (ca.1.9 Ga), northwest Canada, Geology, 15, 785–788.Chapman, D.S. & Furlong, K.P., 1991. Thermal state of the con-
Houseman, G., McKenzie, D. & Molnar, P., 1981. Convectivetinental lower crust, in Development in Geotectonics, No. 23, edsinstability of a thickened boundary layer and its relevance for theFountain, D.M., Arculus, R. & Kay, R.W., Elsevier.thermal evolution of continental convergent belts, J. geophys. Res.,Chen, W.P. & Molnar, P., 1983. Focal depths of intracontinental and86, 6115–6132.intraplate earthquakes and their implications for the thermal and
Hutton, D.H.W. & Reavy, R.J., 1992. Strike-slip tectonics and granitemechanical properties of the lithosphere, J. geophys. Res., 88, 4183–4214.petrogenesis, T ectonics, 11, 960–967.Chopra, P.N. & Paterson, M.S., 1981. The experimental deformation
Irwin, W.P., 1990. Geology and plate-tectonic development, in T heof dunite, T ectonophysics, 78, 453–473.San Andreas fault system, California, Chapter 3, ed. Wallace, R.E.,Chopra, P.N. & Paterson, M.S., 1984. The role of water in theUS geol. Survey Prof. Paper, 1515, 61–80.deformation of dunite, J. geophys. Res., 89, 7861–7876.
Jegouzo, P., 1980. The South Armorican shear zone, J. struct. Geol.,Cooper, A.F., Barreiro, B.A., Kimbrough, D.L. & Mattinson, J.M.,2, 39–47.1987. Lamprophyre dike intrusion and the age of the Alpine fault,
Joule, J.P., 1850. On the mechanical equivalent of heat, Phil. T rans.New Zealand, Geology, 15, 941–944.R. Soc. L ond., 140, 61–82.De Mets, C., Gordon, R.G., Argus, D.F. & Stein, S., 1990. Current
Kamp, P.J.J., Green, P.F. & White, S.H., 1989. Fission-track analysisplate motions, Geophys. J. Int., 101, 425–478.reveals character of collisional tectonics in New Zealand, T ectonics,Deming, D., 1994. Estimation of the thermal conductivity anisotropy8, 169–195.of rock with application to the determination of terrestrial heat
Kushiro, I., Syono, Y. & Akimoto, S., 1968. Melting of a peridotiteflow, J. geophys. Res., 99, 22 087–22 091.nodule at high pressures and high water pressures, Geophys. Res.Dickinson, W.R., 1981. Plate tectonics and the continental margin ofL ett., 73, 6023–6029.California, in The Geotectonic Development of California (Rubey Vol. 1),
Lacassin, R., 1989. Plate-scale kinematics and compatibility of crustalpp. 1–28, ed. Ernst, W.G., Prentice-Hall, Englewood Cliffs, NJ.shear zones in the Alps, in Alpine T ectonics, eds Coward, M.P.,Dickinson, W.R. & Snyder, W.S., 1979. Geometry of triple junctionsDietrich, D. & Park, R.G., Geol. Soc. Spec. Publ., 45, 339–352.related to San Andreas transform, J. geophys. Res., 84, 561–572.
Lachenbruch, A.H. & Sass, J.H., 1980. Heat flow and energetics of theEngland, P. & Molnar, P., 1991. Inferences of deviatoric stress inSan Andreas fault zone, J. geophys. Res., 85, 6185–6222.actively deforming belts from simple physical models, Phil. T rans.
Le Breton, N. & Thompson, A.B., 1988. Fluid-absent (dehydration)R. Soc. L ond., A, 337, 151–164.melting of biotite in metapelites in the early stages of crustalEngland, P.C. & Thompson, A.B., 1984. Pressure–temperature–timeanatexis, Contrib. Mineral. Petrol., 99, 226–237.paths of regional metamorphism I. Heat transfer during the evolution
Leloup, P.H. & Kienast, J.R., 1993. High Temperature meta-of regions of thickened continental crust, J. Petrol., 25, 894–928.
morphism in a major Tertiary ductile continental strike-slip shearFindlay, R.H., 1987. Structure and interpretation of the Alpine schists
zone: the Ailao Shan-Red River (P.R.C.), Earth planet. Sci. L ett.,in Copland and Cook River Valleys, South island, New Zealand,
NZ J. Geol. Geophys., 30, 117–138. 118, 213–234.
© 1999 RAS, GJI 136, 19–40

38 P. H. L eloup et al.
Leloup, P.H., Lacassin, R., Tapponnier, P., Scharer, U., Zhong Dalai, Sheppard, D.S., Adams, C.J. & Bird, G.W., 1975. Age of metamorphism
and uplift in the Alpine schist belt, New Zealand, Geol. Soc. Am.Liu Xiaohan, Zhang Liangshang, Ji Shaocheng & Phan Trong
Trinh, 1995. The Ailao Shan-Red River shear zone (Yunnan, China), Bull., 86, 1147–1153.
Sibson, R.H., 1984. Roughness at the base of the seismogenic zone:Tertiary transform boundary of Indochina, T ectonophysics, 251,3–84. contributing factors, J. geophys. Res., 89, 5791–5799.
Sibson, R.H., White, S.H. & Atkinson, B.K., 1979. Fault rock distri-Mc Garr, A., Zoback, M.D. & Hanks, T.C., 1982. implication of an
elastic analysis of in situ stress measurements near the San Andreas bution and structure within the Alpine fault zone: a preliminary
account, in T he Origin of the Southern Alps, eds Walcott, R.I. &fault, J. geophys. Res., 87, 7797–7806.
Molnar, P. & England, P., 1990. Temperatures, heat flux, and Cresswell, M.M., R. Soc. NZ Bull., 18, 55–65.
Sieh, K.E. & Jahns, R.H., 1984. Holocene activity of the Sanfrictional stress near major thrust faults, J. geophys. Res., 95,4833–4856. Andreas fault at Wallace Creek, California, Geol. Soc. Am. Bull.,
95, 883–896.Mount, V.S. & Suppe, J., 1987. State of stress near the San
Andreas fault: implications for wrench tectonics, Geology, 15, Stock, J. & Molnar, P., 1987. Revised history of early Tertiary plate
motion in the south-west Pacific, Nature, 325, 495–499.1143–1146.
Nicolas, A., Bouchez, J.L., Blaise, J. & Poirier, J.P., 1977. Geological Strong, D.F. & Hanmer, S.K., 1981. The leucogranites of southern
brittany: origin by faulting, frictional heating, fluid flux and fractionalaspects of deformation in continental shear zones, T ectonophysics,
42, 55–73. melting, Can. Min., 19, 163–176.
Tapponnier, P., Lacassin, R., Leloup, P.H., Scharer, U., Zhong Dalai,O’Neil, J.R. & Hanks, T.C., 1980. Geochemical evidence for water–rock
interaction along the San Andreas and Garlock faults of California, Liu Xiaohan, Ji Shaocheng, Zhang Lianshang & Zhong Jiayou,
1990. The Ailao Shan/Red River metamorphic belt: Tertiary left-J. geophys. Res., 85, 6286–6292.
Peltzer, G., Tapponnier, P., Gaudemer, Y., Meyer, B., Guo, S., Yin, K., lateral shear between Indochina and South China, Nature, 343,431–437.Chen, Z. & Dai, H., 1988. Offsets of late Quaternary morphology,
rate of slip, and recurrence of large earthquakes on the Changma Tapponnier, P. & Molnar, P., 1976. Slip-line field theory and
large-scale continental tectonics, Nature, 264, 319–324.fault (Gansu, China), J. geophys. Res., 93, 7793–7812.
Peto, P., 1976. An experimental investigation of melting relations Tapponnier, P., Peltzer, G. & Armijo, R., 1986. On the mechanics of
the collision between India and Asia, in Collision T ectonics, edsinvolving muscovite and paragonite in the silica-saturated portion
of the system K2O-Na2O-Al2O3-SiO2-H2O to 15kb total pressure, Coward, M.P. & Ries, A.C., Geol. Soc. Spec. Publ., 19, 115–157.
Thatcher, W. & England, P.C., 1998. Ductile shear zones beneathin Progress in experimental petrology. T hird progress report of research
supported by NERC at Edinburgh and Manchester universities, strike-slip faults: implications for the thermomechanics of the San
Andreas fault zone, J. geophys. Res., 103, 891–905.publications series D, vol. 6, pp. 41–45, ed. Biggar, G.M., NERC,
London. Thompson, A.B., 1982. Dehydration melting of pelitic rocks and the
generation of H2O-undersaturated granitic liquids, Am. J. Sci., 282,Pinet, C. & Jaupart, C., 1987. the Vertical distribution of radiogenic
heat production in the Precambrian crust of Norway and Sweden: 1567–1595.
Thompson, A.B. & Conolly, A.D., 1995. Melting of the continentalgeothermal implications, J. geophys. Res., 14, 260–263.
Pinet, C., Jaupart, C., Mareschal, J.C., Gariepy, C., Bienfait, G. & crust: some thermal and petrological constrains on anatexis in
continental collision zones and other tectonic settings, J. geophys.Lapointe, R., 1991. Heat flow and structure of the lithosphere in the
Eastern Canadian shield, J. geophys. Res., 96, 19 941–19 963. Res., 100, 15 565–15 579.
Tommasi, A., Vauchez, A., Fernandes, L.A.D. & Porcher, C.C., 1994.Post, R.L., 1977. High-temperature creep of Mt Burnet Dunite,
T ectonophysics, 42, 75–110. Magma-assisted strain localization in an orogen-parallel transcurent
shear zone of southern Brazil, T ectonics, 13, 421–437.Raleigh, C.B., Kirby, S.H., Carter, N.L. & Ave Lallemant, H.G., 1971.
Slip and the clinoenstatite transformation as competing rate Weertman, J., 1978. Creep laws for the mantle of the earth, Phil. T rans.
R. Soc. L ond., 288, 9–26.processes in enstatite, J. geophys. Res., 76, 4011–4022.
Reavy, R.J., Stephens, W.E., Fallick, A.E., Halliday, A.N. & Wellman, H.R., 1955. New Zealand Quaternary tectonics, Geol. Rund.,
43, 248–257.Godinho, M.M., 1991. Geochemical and isotopic constraints on
granite petrogenesis: the Serra da Freita pluton, a typical granite Wellman, H.W., 1979. An uplift map for the South Island of New
Zealand, and a model for uplift of the Southern Alps, in The originbody from the Portuguese Hercynian, Geol. Soc. Am. Bull., 103,392–401. of the Southern Alps, eds Walcott, R.I. & Cresswell, M.M., R. Soc.
NZ Bull., 18, 13–20.Ricard, Y., Froidevaux, C. & Hermance, J.F., 1983. Model heat flow
and magnetotellurics for the San Andreas and oceanic transform Wellman, H.W., 1984. The Alpine fault, New Zealand, near Milford
Sound and to the southwest, Geol. Mag., 121, 437–441.faults., Ann. Geophys., 1, 47–52.
Scaillet, B., Holtz, M., Pichavant, M. & Schmidt, M., 1996. The Woodward, D.J., 1979. The crustal structure of the Southern Alps, New
Zealand, as determined by gravity, R. Soc. NZ Bull., 18, 95–98.viscosity of Himalayan leucogranites: implications for mechanisms
of granitic magma ascent., J. geophys. Res., 101, 27 691–27 699. Wyllie, P.J., 1971. T he Dynamic Earth: a T ext Book in Geosciences,
John Wiley & Sons, New York.Scharer, U., Tapponnier, P., Lacassin, R., Leloup, P.H., Zhong Dalai
& Ji Shaocheng, 1990. Intraplate tectonics in Asia: a precise age for Yan Qizhong, Zhang Guoqing, Kan Rongju & Hu Hongxiang, 1985.
The crust structure of Simao to Malong profile, Yunnan povince,large-scale Miocene movement along the Ailao Shan-Red River
shear zone, China, Earth planet. Sci. L ett., 97, 65–77. China, J. seism. Res., 8, 249–264.
Yuen, D.A., Fleitout, L., Schubert, G. & Froidevaux, C., 1978. ShearScharer, U., Lian-Sheng, Z. & Tapponnier, P., 1994. Duration of strike-
slip movements in large shear zones: the Red River belt, China., deformation zones along major transform faults and slabs, Geophys.
J. R. astr. Soc., 54, 93–120.Earth planet. Sci. L ett., 126, 379–397.
Scholz, C.H., 1980. Shear heating and the state of stress on faults, Zandt, G. & Furlong, K.P., 1982. Evolution and thickness of the
lithosphere beneath coastal California, Geology, 10, 376–381.J. geophys. Res., 85, 6174–6184.
Scholz, C.H., Beavan, J. & Hanks, T.C., 1979. Frictional meta- Zhang, L.-S., 1995. Age, duree et magmatisme du decrochement
Tertiaire du Fleuve Rouge, Yunnan, Chine, PhD thesis, Universitemorphism, argon depletion, and tectonic stress on the Alpine fault,
New Zealand, J. geophys. Res., 84, 6770–6782. Paris 7, France.
Zoback, M.D. et al., 1987. New evidence on the state of stress ofSclater, J.G., Jaupart, C. & Galson, D., 1980. The heat flow through
oceanic and continental crust and the heat loss of the earth, Rev. the San Andreas of the San Andreas fault system, Science, 238,1105–1111.Geophys. Space Phys., 18, 269–311.
© 1999 RAS, GJI 136, 19–40

Shear heating in strike-slip shear zones 39
stresses (see eqs 4 and 5) areAPPENDIX A: FULL MODELFORMULATION AND COMPARISON
txy=g
∂V∂x
, (A2)WITH SIMPLIFIED SOLUTIONS
For ductile deformation, we introduce the equivalent viscosityg, which is a function of stress and temperature:
tyz=g
∂V∂z
. (A3)g−1=A e−E/RT(t2
yx+t2
yz)(N−1)/2 . (A1)
Therefore, the relationships between velocity gradients and The viscosity can therefore be expressed as a function of the
(a) (a)
(b) (b)
(c) (c)
(d) (d)
Figure A1. Full model (fine grid, exact solution) results for reference Figure A2 As Fig. A1, but neglecting shear heating on horizontal
parameters. Vertical sections perpendicular to the fault (brittle fault planes.
at x=0, at the left boundary of the calculation grid). Depth and
distance from fault in kilometres. Depth of the brittle/ductile transition
is imposed at 10 km to allow comparison with Fig. 3. (a) Final
isotherms. (b) Temperature increase due to shear heating. (c) Viscosity
( logarithmic scale). (d) Velocity field (in cm yr−1, with respect to the
main fault).
© 1999 RAS, GJI 136, 19–40
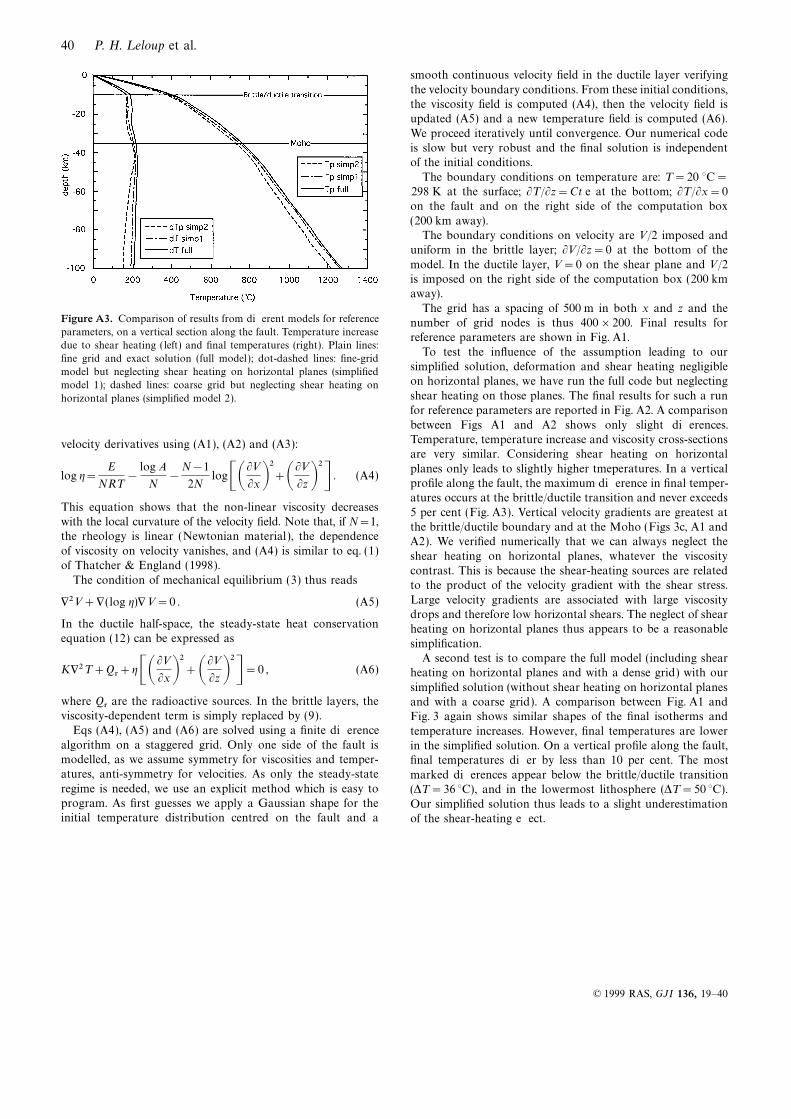
40 P. H. L eloup et al.
smooth continuous velocity field in the ductile layer verifying
the velocity boundary conditions. From these initial conditions,the viscosity field is computed (A4), then the velocity field isupdated (A5) and a new temperature field is computed (A6).
We proceed iteratively until convergence. Our numerical codeis slow but very robust and the final solution is independentof the initial conditions.
The boundary conditions on temperature are: T =20 °C=298 K at the surface; ∂T /∂z=Ct e at the bottom; ∂T /∂x=0on the fault and on the right side of the computation box
(200 km away).The boundary conditions on velocity are V /2 imposed and
uniform in the brittle layer; ∂V /∂z=0 at the bottom of the
model. In the ductile layer, V =0 on the shear plane and V /2is imposed on the right side of the computation box (200 kmaway).
The grid has a spacing of 500 m in both x and z and theFigure A3. Comparison of results from different models for reference number of grid nodes is thus 400×200. Final results forparameters, on a vertical section along the fault. Temperature increase reference parameters are shown in Fig. A1.due to shear heating ( left) and final temperatures (right). Plain lines:
To test the influence of the assumption leading to ourfine grid and exact solution (full model); dot-dashed lines: fine-grid
simplified solution, deformation and shear heating negligiblemodel but neglecting shear heating on horizontal planes (simplifiedon horizontal planes, we have run the full code but neglectingmodel 1); dashed lines: coarse grid but neglecting shear heating onshear heating on those planes. The final results for such a runhorizontal planes (simplified model 2).for reference parameters are reported in Fig. A2. A comparison
between Figs A1 and A2 shows only slight differences.Temperature, temperature increase and viscosity cross-sectionsvelocity derivatives using (A1), (A2) and (A3):are very similar. Considering shear heating on horizontal
planes only leads to slightly higher tmeperatures. In a verticallog g=
E
NRT−
log A
N−
N−1
2NlogCA∂V∂xB2+A∂V∂z B2D . (A4)
profile along the fault, the maximum difference in final temper-atures occurs at the brittle/ductile transition and never exceeds
This equation shows that the non-linear viscosity decreases 5 per cent (Fig. A3). Vertical velocity gradients are greatest atwith the local curvature of the velocity field. Note that, if N=1, the brittle/ductile boundary and at the Moho (Figs 3c, A1 andthe rheology is linear (Newtonian material ), the dependence A2). We verified numerically that we can always neglect theof viscosity on velocity vanishes, and (A4) is similar to eq. (1) shear heating on horizontal planes, whatever the viscosityof Thatcher & England (1998). contrast. This is because the shear-heating sources are related
The condition of mechanical equilibrium (3) thus reads to the product of the velocity gradient with the shear stress.
Large velocity gradients are associated with large viscosityV2V +V ( log g)VV =0 . (A5)drops and therefore low horizontal shears. The neglect of shear
In the ductile half-space, the steady-state heat conservation heating on horizontal planes thus appears to be a reasonableequation (12) can be expressed as simplification.
A second test is to compare the full model (including shearKV2T +Qr+gCA∂V∂xB2+A∂V∂z B2D=0 , (A6) heating on horizontal planes and with a dense grid) with our
simplified solution (without shear heating on horizontal planeswhere Qr are the radioactive sources. In the brittle layers, the and with a coarse grid). A comparison between Fig. A1 andviscosity-dependent term is simply replaced by (9). Fig. 3 again shows similar shapes of the final isotherms and
Eqs (A4), (A5) and (A6) are solved using a finite difference temperature increases. However, final temperatures are loweralgorithm on a staggered grid. Only one side of the fault is in the simplified solution. On a vertical profile along the fault,modelled, as we assume symmetry for viscosities and temper- final temperatures differ by less than 10 per cent. The mostatures, anti-symmetry for velocities. As only the steady-state marked differences appear below the brittle/ductile transitionregime is needed, we use an explicit method which is easy to (DT =36 °C), and in the lowermost lithosphere (DT =50 °C).program. As first guesses we apply a Gaussian shape for the Our simplified solution thus leads to a slight underestimationinitial temperature distribution centred on the fault and a of the shear-heating effect.
© 1999 RAS, GJI 136, 19–40