shear-induced nitric oxide production by endothelial...
TRANSCRIPT

Article
Shear-Induced Nitric Oxide Production byEndothelial Cells
Krishna Sriram,1 Justin G. Laughlin,1 Padmini Rangamani,1,* and Daniel M. Tartakovsky1,*1Department of Mechanical and Aerospace Engineering, University of California-San Diego, La Jolla, California
ABSTRACT We present a biochemical model of the wall shear stress-induced activation of endothelial nitric oxide synthase(eNOS) in an endothelial cell. The model includes three key mechanotransducers: mechanosensing ion channels, integrins, andG protein-coupled receptors. The reaction cascade consists of two interconnected parts. The first is rapid activation of calcium,which results in formation of calcium-calmodulin complexes, followed by recruitment of eNOS from caveolae. The second isphosphorylation of eNOS by protein kinases PKC and AKT. The model also includes a negative feedback loop due to inhibitionof calcium influx into the cell by cyclic guanosine monophosphate (cGMP). In this feedback, increased nitric oxide (NO) levelscause an increase in cGMP levels, so that cGMP inhibition of calcium influx can limit NO production. The model was used topredict the dynamics of NO production by an endothelial cell subjected to a step increase of wall shear stress from zero to afinite physiologically relevant value. Among several experimentally observed features, the model predicts a highly nonlinear,biphasic transient behavior of eNOS activation and NO production: a rapid initial activation due to the very rapid influx of calciuminto the cytosol (occurring within 1–5 min) is followed by a sustained period of activation due to protein kinases.
INTRODUCTION
Nitric oxide (NO) plays a crucial biological role in thevasculature by stimulating the relaxation of vascular smoothmuscle (1) and, therefore, regulating vascular resistance andblood pressure. It also has various secondary roles in thevasculature, e.g., the elimination of free radicals (2), andthe prevention of plaque buildup (3). NO is produced byendothelial cells (ECs) upon exposure to mechanical forces,such as hemodynamic shear stress and intraluminal pressure(4). The mechanical stimulation of ECs triggers a complexcascade of biochemical reactions, which involves multiplecellular mechanosensors and enzymes. The ultimate targetof this cascade is the activation of the endothelial nitric ox-ide synthase (eNOS) enzyme, which catalyzes the oxidationof the L-form of the a-amino acid arginine (L-Arg) (1,4,5),resulting in the production of NO.
Several mechanosensors are responsible for the initiationof the signal transduction cascade in an EC after mechanicalstimulation (6–12), three of which are experimentally stud-ied and incorporated into our model. First, the opening ofmechanosensing ion channels (MSICs) mediates the influx
of calcium from extracellular fluid into the cytosol (6). Sec-ond, the deformation of an EC activates G-protein-coupledreceptors (GPCRs), which leads to the release of calciumions inside the EC (7,10,13). Third, shear stress applied toan EC stimulates integrins—transmembrane receptorsanchoring an EC to the extracellular matrix—which acti-vates phosphatidylinositide 3-kinases (PI3K) enzymes(14–16), leading to the release of calcium inside the EC.Our model does not account for other potential mechanosen-sors (e.g., sodium and potassium ion channels; lipid raftsand vesicles; cytoskeletal remodeling; signaling via cadher-ins and other transmembrane proteins) because experi-mental evidence of their importance and functionality isrelatively scarce.
The majority of previous modeling studies have focusedon the influx of calcium ions into ECs exposed to externalshear stress (17–22). Consequently, these and other similarmodels treat MSICs as the sole mechanosensor responsiblefor shear-induced endothelial production of NO. On thebiochemical side, these models have ignored the details ofeNOS phosphorylation and activation of protein kinasesresponsible for this phosphorylation. A recent computa-tional model (23) ameliorates these deficiencies by incorpo-rating a more detailed description of the kinetics of eNOSactivation by calcium-calmodulin complexes and protein ki-nase B (AKT), after exposure to shear stress. This model
Submitted October 14, 2015, and accepted for publication May 23, 2016.
*Correspondence: [email protected] or [email protected]
Krishna Sriram and Justin G. Laughlin contributed equally to this work.
Editor: Jeffrey Fredberg.
Biophysical Journal 111, 1–14, July 12, 2016 1
Please cite this article in press as: Sriram et al., Shear-Induced Nitric Oxide Production by Endothelial Cells, Biophysical Journal (2016), http://dx.doi.org/10.1016/j.bpj.2016.05.034
BPJ 7395
http://dx.doi.org/10.1016/j.bpj.2016.05.034
! 2016 Biophysical Society.

also incorporates two additional mechanosensors—GPCRsand integrins. However, it does not account for the inhibi-tory role of protein kinase C (PKC) or the role of cyclicguanosine monophosphate (cGMP) in providing negativefeedback to the eNOS activation cascade. In addition,an analysis for how NO production (and eNOSactivation) changes for different values of shear stress waslacking.
We build upon these and other previous efforts to developa comprehensive model of NO production in ECs, whichdescribes the biochemical reaction cascade induced by thethree types of mechanosensors (MSICs, GPCRs, and in-tegrins). Specifically, it relies on the experimental andmodeling studies (7,13–15,17,19,20,24) to represent boththe calcium influx via MSICs and the activation of GPCRsand PI3K as functions of the applied shear stress. Our modelaccounts for the formation of calcium-CaM complexes,which leads to the recruitment of eNOS into an eNOS-CaM complex; the latter is subsequently phosphorylatedby AKT (4), the details of which have been ignored in pre-vious studies (17–22). It also includes a negative feedbackmediated by cGMP.
We use this model to elucidate the impact of the kinasesAKT and PKC on shear-induced NO production by ECs.The model elucidates the role of calcium in the endotheliumNO production, which remains an open question (4,25,26).Our analysis suggests that calcium affects both the early andlater stages of NO production, albeit to different degrees.
MATERIALS AND METHODS
Mathematical model of endothelial NO production
We assume that a layer of ECs is continuously supplied with metabolic sub-strates sufficient for maintaining endothelial NO production. Blood flowover the endothelial layer exerts shear stress t on the surface of the outercell wall, which triggers a cascade of biochemical reactions resulting inendothelial NO production. The reactions are assumed to occur in thecytosol, which is treated as a well-mixed continuum, i.e., concentration gra-dients are ignored. In what follows, the concentration of any reactant A isdenoted by (A), with units of micromoles (mM).
Activation of G proteins
Deformation of a cell membrane by wall shear stress (WSS) activatesGPCRs, which are mechanically coupled to the cell membrane and serveas force transducers that activate G proteins (10,27,28). The rate of G-pro-tein activation is given by (13,24)
d½G"dt
¼ ka½R$"ð½Gt" & ½G"Þ & kd½G"; (1)
where ½G" is the concentration of activated G-proteins; ka and kd are, respec-tively, the forward and backward rate constants for G-protein activation(numerical values of these and all the other reaction rate constants andmodel parameters are reported in Table 1); ½R$" is a fraction of the GPCRsactivated by shear stress; and ½Gt " is the total concentration of G-proteinspresent in the cell. We assume the instantaneous activation of GPCRs inresponse to WSS t and fit the experimental ½R$" versus t data fromFig. 4d in Chachisvilis et al. (7) with a curve
½R$" ¼ tanh!ptL
"; (2)
where t is in dynes/cm2. The data reported in Chachisvilis et al. (7) justifythe assumption of instantaneous GPCR activation/inactivation: activation(or inactivation) of GPCRs in response to applied (or removed) WSS occurson a timescale of 1 ns.
Activation of G proteins triggers the hydrolysis of PIP2 (phosphatidylino-sitol 4,5-bisphosphate) and formation of IP3 (inositol triphosphate) inaccordance with a rate equation (13,17)
d½IP3"dt
¼ rf ½PIP2" & m1½IP3";
rf ¼ aKcpMATP½G";(3)
where m1 is the rate of IP3 degradation, and rf is the ½G"-dependent rate ofIP3 formation from PIP2 whose parameterization with coefficients a, Kcp,and MATP is discussed in Section S1 of the Supporting Material. Equation3 represents an IP3-PIP2 cycle (see Lemon et al. (13) for details), in whichthe produced IP3 degrades to an intermediate phospholipid that is thenconverted back to PIP2. The rate of change of ½PIP2" is described by arate equation (13,29)
d½PIP2"dt
¼ &#rf þ rr
$½PIP2" & rr½IP3" þ rr½PIP2t "
& kþPIP2 ½PIP2" þ k&PIP2 ½PIP3";(4)
in which the first three terms on the right-hand side represent the cycling ofPIP2 to IP3 and back to PIP2, and the remaining two terms account for thephosphorylation of PIP2 to PIP3 (phosphatidylinositol (3,4,5)-triphosphate).Here rr is the rate constant of replenishment of PIP2, and k
þPIP2
and k&PIP2 arethe forward and backward rate constants of PIP3 formation from PIP2. Phos-phorylation of PIP2 forms PIP3, a reaction that is catalyzed by activatedPI3K in accordance with (29)
d½PIP3"dt
¼ kþPIP2 ½PIP2" & k&PIP2 ½PIP3": (5)
The catalytic role of PI3K is sensitive to the level of shear stress and is elab-orated upon in Activation of Protein Kinases.
Calcium signaling
The shear stress t causes the opening of MSICs, resulting in a sharp in-crease in ½Ca2þ"c due to the influx of calcium ions from the extracellularfluid. This and other processes affecting the calcium balance in an endothe-lial cell (e.g., capacitative calcium entry or CCE) are modeled by massbalance equations (17,19,20)
d#%Ca2þ
&cþ%Ca2þ
&b
$
dt¼qrel&qres&qoutþ qin þ kleak
%Ca2þ
&2s;
d%Ca2þ
&s
dt¼ &Vr
!qrel & qres & kleak
%Ca2þ
&2s
";
(6)
where ½Ca2þ"s and ½Ca2þ"b are the calcium concentrations in the EC internalstores (i.e., within the smooth endoplasmic reticulum) and buffered in dis-solved cytosolic proteins, respectively. The fluxes qrel, qres, and qout repre-sent calcium release from internal stores, calcium resequestration into theseinternal stores, and calcium efflux via the sodium-calcium exchanger (20),respectively. These concentration-dependent fluxes are given by
Sriram et al.
Please cite this article in press as: Sriram et al., Shear-Induced Nitric Oxide Production by Endothelial Cells, Biophysical Journal (2016), http://dx.doi.org/10.1016/j.bpj.2016.05.034
BPJ 7395
2 Biophysical Journal 111, 1–14, July 12, 2016
qrel ¼ krel
'½IP3"
k2 þ ½IP3"
(3%Ca2þ
&s;
qres ¼ kres
'½Ca2þ"c
k3 þ ½Ca2þ"c
(2
;
qout ¼ kout
%Ca2þ
&c
k5 þ%Ca2þ
&c
;
(7)
where krel, kres, kout, k1, k3, and k5 are rate constants. Influx of calciumions from the extracellular fluid into the cytosol occurs through both MSICs(17,19) and CCE (30). The corresponding calcium fluxes are related by
qin ¼ qMSIC þ qCCE: (8)
Following Plank et al. (17), Comerford et al. (19), and Wiesner et al. (20),we assume that the rate of calcium influx via MSICs, qMSIC, is linearly pro-portional to the fraction f0 of ion channels open at a given WSS t,
qMSIC ¼ f0ðtÞqmax ¼ qmax
1þ N expð&WÞ;
WðtÞ ¼ W0
!t þ
ffiffiffiffiffiffiffiffiffiffiffiffiffiffiffiffiffiffiffiffi16c2 þ t2
p& 4c
"2
t þffiffiffiffiffiffiffiffiffiffiffiffiffiffiffiffiffiffiffiffi16c2 þ t2
p ;
(9)
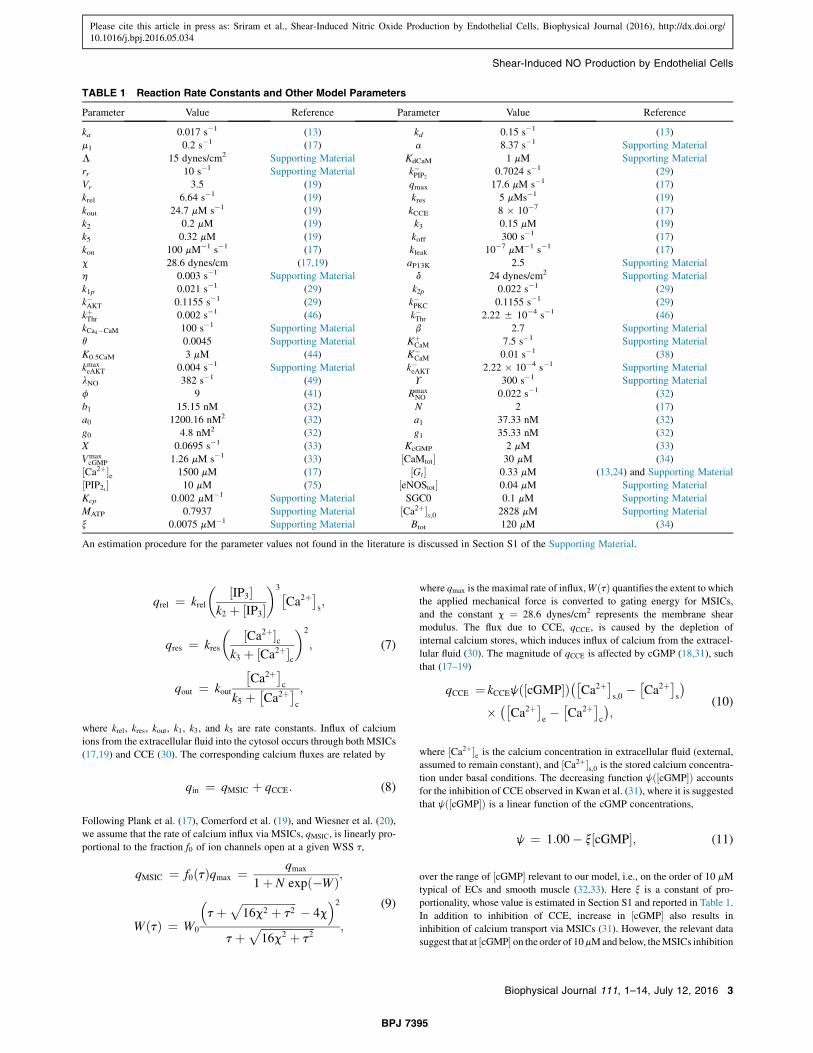
where qmax is the maximal rate of influx,WðtÞ quantifies the extent to whichthe applied mechanical force is converted to gating energy for MSICs,and the constant c ¼ 28.6 dynes/cm2 represents the membrane shearmodulus. The flux due to CCE, qCCE, is caused by the depletion ofinternal calcium stores, which induces influx of calcium from the extracel-lular fluid (30). The magnitude of qCCE is affected by cGMP (18,31), suchthat (17–19)
qCCE ¼ kCCEjð½cGMP"Þ#%Ca2þ
&s;0
&%Ca2þ
&s
$
)#%Ca2þ
&e&%Ca2þ
&c
$;
(10)
where ½Ca2þ"e is the calcium concentration in extracellular fluid (external,assumed to remain constant), and ½Ca2þ"s;0 is the stored calcium concentra-tion under basal conditions. The decreasing function jð½cGMP"Þ accountsfor the inhibition of CCE observed in Kwan et al. (31), where it is suggestedthat jð½cGMP"Þ is a linear function of the cGMP concentrations,
j ¼ 1:00& x½cGMP"; (11)
over the range of ½cGMP" relevant to our model, i.e., on the order of 10 mMtypical of ECs and smooth muscle (32,33). Here x is a constant of pro-portionality, whose value is estimated in Section S1 and reported in Table 1.In addition to inhibition of CCE, increase in ½cGMP" also results ininhibition of calcium transport via MSICs (31). However, the relevant datasuggest that at ½cGMP" on the order of 10mMand below, theMSICs inhibition
TABLE 1 Reaction Rate Constants and Other Model Parameters
Parameter Value Reference Parameter Value Reference
ka 0.017 s&1 (13) kd 0.15 s&1 (13)m1 0.2 s&1 (17) a 8.37 s&1 Supporting MaterialL 15 dynes/cm2 Supporting Material KdCaM 1 mM Supporting Materialrr 10 s&1 Supporting Material k&PIP2 0.7024 s&1 (29)Vr 3.5 (19) qmax 17.6 mM s&1 (17)krel 6.64 s&1 (19) kres 5 mMs&1 (19)kout 24.7 mM s&1 (19) kCCE 8 ) 10&7 (17)k2 0.2 mM (19) k3 0.15 mM (19)k5 0.32 mM (19) koff 300 s&1 (17)kon 100 mM&1 s&1 (17) kleak 10&7 mM&1 s&1 (17)c 28.6 dynes/cm (17,19) aP13K 2.5 Supporting Materialh 0.003 s&1 Supporting Material d 24 dynes/cm2 Supporting Materialk1p 0.021 s&1 (29) k2p 0.022 s&1 (29)k&AKT 0.1155 s&1 (29) k&PKC 0.1155 s&1 (29)kþThr 0.002 s&1 (46) k&Thr 2.22 5 10&4 s&1 (46)kCa4&CaM 100 s&1 Supporting Material b 2.7 Supporting Materialq 0.0045 Supporting Material Kþ
CaM 7.5 s&1 Supporting MaterialK0.5CaM 3 mM (44) K&
CaM 0.01 s&1 (38)kmaxeAKT 0.004 s&1 Supporting Material k&eAKT 2.22 ) 10&4 s&1 Supporting MateriallNO 382 s&1 (49) Y 300 s&1 Supporting Materialf 9 (41) Rmax
NO 0.022 s&1 (32)b1 15.15 nM (32) N 2 (17)a0 1200.16 nM2 (32) a1 37.33 nM (32)g0 4.8 nM2 (32) g1 35.33 nM (32)X 0.0695 s&1 (33) KcGMP 2 mM (33)VmaxcGMP 1.26 mM s&1 (33) ½CaMtot" 30 mM (34)
½Ca2þ"e 1500 mM (17) ½Gt" 0.33 mM (13,24) and Supporting Material½PIP2t " 10 mM (75) ½eNOStot" 0.04 mM Supporting MaterialKcp 0.002 mM&1 Supporting Material SGC0 0.1 mM Supporting MaterialMATP 0.7937 Supporting Material ½Ca2þ"s;0 2828 mM Supporting Materialx 0.0075 mM&1 Supporting Material Btot 120 mM (34)
An estimation procedure for the parameter values not found in the literature is discussed in Section S1 of the Supporting Material.
Shear-Induced NO Production by Endothelial Cells
Please cite this article in press as: Sriram et al., Shear-Induced Nitric Oxide Production by Endothelial Cells, Biophysical Journal (2016), http://dx.doi.org/10.1016/j.bpj.2016.05.034
BPJ 7395
Biophysical Journal 111, 1–14, July 12, 2016 3

is negligible (31). We therefore ignore the role of cGMP inhibition on MSICfunction.
Equation 6 includes calcium concentration in the buffer, ½Ca2þ"b. Asthe cytosolic-calcium concentration ½Ca2þ"c increases, it forms calciumcomplexes with cytosolic proteins in accordance with a rate law (17,34)
d½Ca2þ"bdt
¼ kon%Ca2þ
&c
#Btot &
%Ca2þ
&b
$& koff
%Ca2þ
&b:
(12)
where Btot is the total concentration of calcium binding sites in cytosolicbuffer proteins; and kon and koff are forward and backward buffering rateconstants, respectively.
Activation of protein kinases
Integrins, which anchor an EC to the extracellular matrix, are connected tofocal adhesion sites within the EC and act as mechanotransducers. Applica-tion of mechanical forces results in the tyrosine phosphorylation of focaladhesion kinases (FAKs), ultimately triggering the stimulation of PI3K.In ECs, this process has been studied in vitro, where the activation of integ-rins, FAKs, and PI3K are all measured as functions of mechanical stimula-tion (14–16).
Upon exposure to shear stress, PI3K is phosphorylated rapidly, reachingmaximal activation on the order of 10 s (15,35). This process is caused byactivation of the FAK/Src complex through integrins (36) that serve as forcetransducers that mediate the mechanical signal. Because this timescale is anorder-of-magnitude smaller than that of the other chemical reactions in ourmodel (which generally occur at timescales of ~1–100 min), we neglect thetime lag between the application of mechanical force and PI3K activation;application of force thus results in immediate activation of PI3K. The activePI3K species, PI3K*, then gradually returns to its basal levels of activity,½PI3K$"bas. This process is modeled as
½PI3K$"½PI3K$"bas
¼ 1þ aPI3K tanh!ptd
"e&ht; (13)
where the constants aPI3K, d and h were fitted to the experimental data fromKatsumi et al. (14) and Go et al. (15). The data reported in Go et al. (15)suggest that the decay of ½PI3K$" to its basal level occurs on a relativelyfast timescale of ~5 min, while the corresponding data in Katsumi et al.(14) support a larger timescale of ~30 min. In Eq. 13, this timescale iscontrolled by the parameter h. To account for the timescale variabilityobserved in Katsumi et al. (14) and Go et al. (15), we consider a range ofh-values. Fig. S1 in the Supporting Material reveals that the model predic-tions are relatively insensitive to variations in the value of d; this suggeststhat the transient effects of PI3K activation on NO production are negli-gible. Finally, activation of PI3K increases the rate of PIP2 phosphorylationto PIP3 (29),
kþPIP2 ¼ k1p½PI3K$"
½PI3K$"max
þ k2p
¼ k1p1þ aPI3K
h1þ aPI3K e&ht tanh
!ptd
"iþ k2p; (14)
thus playing a catalytic role in Eq. 5. The values of reaction rate constantsk1p and k2p are given in Sedaghat et al. (29), and it follows from Eq. 13that the maximum concentration of active PI3K is ½PI3K$"max ¼½PI3K$"basð1þ aPI3KÞ.
PIP3 meditates phosphorylation and subsequent activation of protein ki-nases AKT and PKC, which in turn phosphorylate eNOS (29). This activa-tion is modeled by rate laws (29)
d½AKT$"dt
¼ kþAKT½AKT" & k&AKT½AKT$";
d½PKC$"dt
kþPKC½PKC" & k&PKC½PKC$";
(15)
where ½AKT$", ½AKT", ½PKC$", and ½PKC" are concentrations of theactivated (phosphorylated) AKT, unactivated AKT, activated (phosphory-lated) PKC, and unactivated PKC, respectively. The total concentrationsof AKT and PKC are conserved, ½AKT" þ ½AKT$" ¼ ½AKT"tot and½PKC" þ ½PKC$" ¼ ½PKC"tot. The rate constants in Eq. 15 increase with½PIP3" in accordance with (29)
kþAKT ¼ 0:1k&AKT½PIP3" & ½PIP3"min
½PIP3"max & ½PIP3"min
;
kþPKC ¼ 0:1k&PKC½PIP3" & ½PIP3"min
½PIP3"max & ½PIP3"min
;
(16)
where k&AKT and k&PKC are rate constants, ½PIP3"min ¼ 0:0031½PIP2"tot, and½PIP3"max ¼ 0:031½PIP2"tot. The significant transient behavior of ½PIP3"(Fig. S8) renders the rate constants kþAKT and kþPKC time-dependent. This ne-cessitates a numerical solution of the expressions in Eq. 15.
Phosphorylation and formation of eNOS complexes
Calcium forms several complexes with calmodulin (CaM), which then re-cruit eNOS into an eNOS-CaM complex; the presence of heat shock protein90 (Hsp90) enhances the recruitment rate. Of the various Ca2þ/CaM com-plexes only Ca3-CaM and Ca4-CaM appear to actively recruit eNOS.Among the two, Ca4-CaM is the dominant species both in terms of cytosolicconcentration (37) and affinity for eNOS (38). Hence only the role ofCa4-CaM in the recruitment of eNOS is accounted for in our model. Weuse the Hill function to relate the concentration of free Ca4-CaM in thecytosol to the cytosolic calcium concentration (39,40),
d½Ca4 & CaM"dt
¼ kCa4&CaM
q½Ca2þ"bc
KdCaM þ ½Ca2þ"bc½CaM"tot
& ½Ca4 & CaM"
!
:
(17)
Here b is the Hill coefficient, KdCaM is the apparent Ca4-CaM dissociationconstant, kCa4&CaM is the reaction rate constant, and ½CaM"tot is the total con-centration of CaM in the cytosol. The coefficient q determines the limitingamount of free Ca4-CaM in the cytosol at steady state, at large cytosolic cal-cium concentrations ½Ca2þ"c.
We model activation of eNOS from its basal (inactive) state to its fullyactive (Ser-1197 phosphorylated) state as a three-step process (4,9,41–43).
Step 1. Caveolin-bound eNOS (eNOScav) forms a complex withCa4-CaM, which we denote by eNOS-CaM. The rate of its formation ismodeled using Michaelis-Menten kinetics,
d½eNOS& CaM"dt
¼ kþCaM½Ca4CaM"k0:5CaM þ ½Ca4CaM"
½eNOScav"
& k&CaM½eNOS& CaM"
& d½eNOS& CaM$"dt
;
(18)
where the forward ðkþCaMÞ and backward ðk&CaMÞ rate constants, and theMichaelis-Menten constant, k0:5CaM, are obtained from the data presented
Sriram et al.
Please cite this article in press as: Sriram et al., Shear-Induced Nitric Oxide Production by Endothelial Cells, Biophysical Journal (2016), http://dx.doi.org/10.1016/j.bpj.2016.05.034
BPJ 7395
4 Biophysical Journal 111, 1–14, July 12, 2016

in Michel et al. (44), McMurry et al. (38), and Ju et al. (45); and eNOS-CaM* denotes the eNOS-CaM complex stabilized by phosphorylationdue to AKT at Ser-1197.
Step 2. The latter process is assumed to follow first-order kinetics,
d½eNOS& CaM$"dt
¼ kþeAKT½eNOS& CaM"
& k&eAKT½eNOS& CaM$";(19)
where kþeAKT ¼ kmaxAKT½AKT$"=½AKT"tot. The values of rate constants k&eAKT
and kmaxAKT are estimated in Section S1 from the data presented in Takahashi
and Mendelsohn (41). The stabilized complex eNOS-CaM* complex issignificantly more active than eNOS-CaM in stimulating NO productiondue to the catalysis of the L-Arg oxidation reaction (4,9,41–43).
Step 3. Phosphorylation of eNOScav by PKC (at Thr-495) inhibits thisactivation process by blocking the formation of eNOS-CaM (4); caveo-lin-bound eNOS in this inactivated state is denoted by eNOS0cav (eNOS0is caveolin-bound eNOS phosphorylated at Thr-495). We assume thateNOS phosphorylation by PKC follows first-order kinetics,
d%eNOS0
cav
&
dt¼ kþThr
½PKC$"½PKC"tot
½eNOScav" & k&Thr%eNOS0
cav
&;
(20)
where the forward ðkþThrÞ and backward ðk&ThrÞ rate constants are estimatedfrom the data in Bredt et al. (46).
The total amount of eNOS in different complexes is conserved, so thatthe total concentration of eNOS, ½eNOS"tot, remains constant throughoutthese transformations. This yields a constraint on the concentrations ofeNOS in different complexes (23),
½eNOScav" þ%eNOS0
cav
&þ ½eNOS& CaM"
þ ½eNOS& CaM$" ¼ ½eNOStot":(21)
Two simplifications underpin our model of eNOS activation. First, therate of dephosphorylation is assumed constant, even though dephosphory-lation is mediated by various phosphatases (4,47). We adopted this assump-tion because of the paucity of data on whether and how changes in shearstress affect the activation of phosphatases, such as PP2A and calcineurin.Second, the kinetics of eNOS activation is assumed insensitive to fluctua-tions in Hsp90 activity even though formation of eNOS-CaM is mediatedby Hsp90 (4,41). This assumption is reasonable because Hsp90 is usuallypresent in large excesses, on the order of 100 mM (48), over the concentra-tions of other reactants, such as eNOS and CaM.
NO production
Once formed, the eNOS-CaM and eNOS-CaM* complexes catalyze theoxidation of L-Arg, resulting in production of NO. The latter process ismodeled with the rate law,
d½NO"dt
¼ QNO & QsGC & lNO½NO"; (22)
which represents a balance between NO production (with rate QNO) andconsumption. The latter is due to both NO scavenging by soluble guanylatecyclase at rate QsGC (32) and NO metabolism by red blood cells adjacent tothe endothelial cells at rate lNO (49). Following Buerk (50), we use Michae-lis-Menten kinetics with constant O2 supply to model NO production due tooxidation of L-Arg,
QNO ¼ RNO½O2"
kmNO þ ½O2": (23)
Here kmNO is the Michaelis-Menten constant and RNO is the rate of NO pro-duction, which depends on the concentrations of both phosphorylated andunphosphorylated eNOS-CaM such that
RNO ¼ keNOð½eNOS& CaM" þ f½eNOS& CaM$"Þ; (24)
where f indicates the extent to which AKT phosphorylation increaseseNOS activity in the presence of Hsp90. Assuming a constant supply ofL-Arg and other substrates such as BH4 and NADH, the rate keNO remainsconstant. For a constant oxygen supply,
keNO½O2"
kmNO þ ½O2"¼ Y ¼ constant: (25)
The experimental evidence reported in Dimmeler et al. (25), Schmidtet al. (51), and Ahluwalia et al. (52) suggests functional presence of sGCin endothelial cells. We adopt the model of Ahluwalia et al. (32), developedfor smooth muscle cells, to account for the possibility of NO beingscavenged by soluble guanylate cyclase (sGC) to produce sGC-NO, whichcatalyzes production of cGMP from guanosine triphosphate (GTP),
QsGC ¼ RmaxNO
½NO"2 þ b1½NO"a0 þ a1½NO" þ ½NO"2
½sGC"; (26)
where b1, a0, a1, and RmaxNO are constants whose values are obtained in Con-
dorelli and George (32) by fitting NO-cGMP kinetics to experimental data.sGC is activated upon consuming NO, thereby stimulating the conversion ofGTP into cGMP. The rate of cGMP production is expressed as a function ofNO concentration (32),
d½cGMP"dt
¼ VmaxcGMP
g0 þ g1½NO" þ ½NO"2
a0 þ a1½NO" þ ½NO"2
& X½cGMP"2
kcGMP þ ½cGMP";(27)
where VmaxcGMP, g0, g1, X, and kcGMP are constants whose values are obtained
in Condorelli and George (32) by fitting NO-cGMP kinetics to experimentaldata. Increase in the cGMP concentration, ½cGMP", provides a negativefeedback by reducing the capacitative calcium entry (CCE) into the cellin accordance with Eq. 10.
The system of coupled expressions found in Eqs. 1–27 constitutes amodel of eNOS activation and NO production in response to mechanicalstimulation of an endothelial cell by wall shear stress. The reaction networkformed by these equations is shown in Fig. 1. The numerical solution ofthese equations is detailed in Section S3.
RESULTS
Fig. 2 shows the dynamics of concentrations of cytosoliccalcium ð½Ca2þ"cÞ, stored calcium ð½Ca2þ"sÞ, calciumcalmodulin complex ð½Ca4CaM"Þ, and the eNOS-CaM com-plex ð½eNOS& CaM"Þ for different levels of the appliedWSS. The step increase in WSS t, at time t ¼ 0, inducesa quick discharge of internal calcium stores within the cellas calcium enters the cytosolic volume. This results in arapid spike in calcium levels, followed by a more gradualdecline to a steady-state value of ½Ca2þ"c, which exceedsits basal-state counterpart. This predicted behavior is consis-tent with the observations in the literature (8,19,20,53). The
Shear-Induced NO Production by Endothelial Cells
Please cite this article in press as: Sriram et al., Shear-Induced Nitric Oxide Production by Endothelial Cells, Biophysical Journal (2016), http://dx.doi.org/10.1016/j.bpj.2016.05.034
BPJ 7395
Biophysical Journal 111, 1–14, July 12, 2016 5

spike in ½Ca2þ"c causes a corresponding increase in½Ca4CaM", leading to the formation of the eNOS-CaM com-plex. Unphosphorylated eNOS-CaM can lead to NO produc-tion, which is traditionally viewed as a calcium-independentpart of the cascade. Furthermore, eNOS-CaM undergoesphosphorylation by AKT, which leads to further NO pro-duction at the longer timescale, and is also thought to becalcium-independent. The transients for the initial cal-
cium-dependent stage of the reaction cascade occur veryfast (on the order of 100 s); the subsequent, kinase-depen-dent portion of the eNOS activation cascade proceeds at amore gradual pace. This kinase-dependent eNOS activationphase is also calcium-dependent through the eNOS-CaMcomplex. Throughout their time course the concentrationsof all forms of calcium increase with WSS t due to therole of the MSICs and G proteins.
FIGURE 1 Reaction network for shear-induced NO production.
A
C D
B
FIGURE 2 Temporal variability of the concentrations of (A) cytosolic calcium, ½Ca2þ"c and (B) stored calcium, ½Ca2þ"s, and the complexes (C) Ca4CaM,½Ca4CaM" and (D) eNOS-CaM, ½eNOS& CaM" for WSS t ¼ 8, 16, and 24 dynes/cm2.
Sriram et al.
Please cite this article in press as: Sriram et al., Shear-Induced Nitric Oxide Production by Endothelial Cells, Biophysical Journal (2016), http://dx.doi.org/10.1016/j.bpj.2016.05.034
BPJ 7395
6 Biophysical Journal 111, 1–14, July 12, 2016
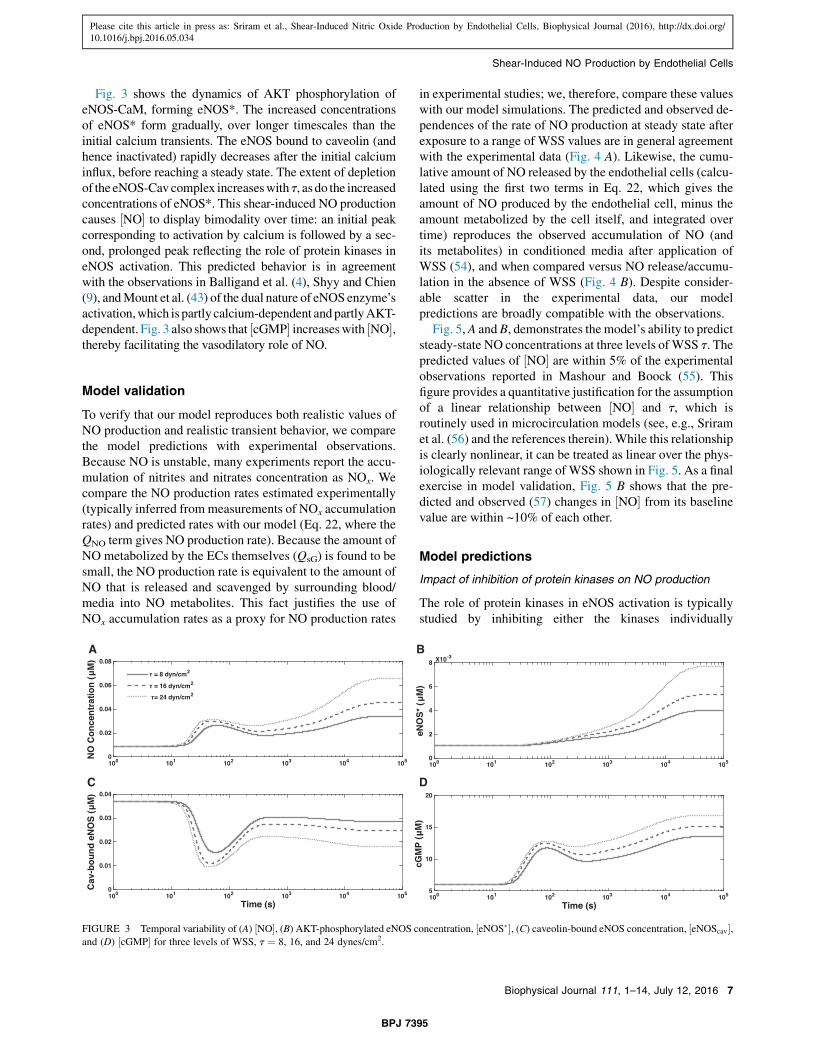
Fig. 3 shows the dynamics of AKT phosphorylation ofeNOS-CaM, forming eNOS*. The increased concentrationsof eNOS* form gradually, over longer timescales than theinitial calcium transients. The eNOS bound to caveolin (andhence inactivated) rapidly decreases after the initial calciuminflux, before reaching a steady state. The extent of depletionof the eNOS-Cav complex increaseswith t, as do the increasedconcentrations of eNOS*. This shear-induced NO productioncauses ½NO" to display bimodality over time: an initial peakcorresponding to activation by calcium is followed by a sec-ond, prolonged peak reflecting the role of protein kinases ineNOS activation. This predicted behavior is in agreementwith the observations in Balligand et al. (4), Shyy and Chien(9), andMount et al. (43) of the dual nature of eNOS enzyme’sactivation,which ispartly calcium-dependent andpartlyAKT-dependent. Fig. 3 also shows that ½cGMP" increaseswith ½NO",thereby facilitating the vasodilatory role of NO.
Model validation
To verify that our model reproduces both realistic values ofNO production and realistic transient behavior, we comparethe model predictions with experimental observations.Because NO is unstable, many experiments report the accu-mulation of nitrites and nitrates concentration as NOx. Wecompare the NO production rates estimated experimentally(typically inferred frommeasurements of NOx accumulationrates) and predicted rates with our model (Eq. 22, where theQNO term gives NO production rate). Because the amount ofNO metabolized by the ECs themselves (QsG) is found to besmall, the NO production rate is equivalent to the amount ofNO that is released and scavenged by surrounding blood/media into NO metabolites. This fact justifies the use ofNOx accumulation rates as a proxy for NO production rates
in experimental studies; we, therefore, compare these valueswith our model simulations. The predicted and observed de-pendences of the rate of NO production at steady state afterexposure to a range of WSS values are in general agreementwith the experimental data (Fig. 4 A). Likewise, the cumu-lative amount of NO released by the endothelial cells (calcu-lated using the first two terms in Eq. 22, which gives theamount of NO produced by the endothelial cell, minus theamount metabolized by the cell itself, and integrated overtime) reproduces the observed accumulation of NO (andits metabolites) in conditioned media after application ofWSS (54), and when compared versus NO release/accumu-lation in the absence of WSS (Fig. 4 B). Despite consider-able scatter in the experimental data, our modelpredictions are broadly compatible with the observations.
Fig. 5, A and B, demonstrates the model’s ability to predictsteady-state NO concentrations at three levels ofWSS t. Thepredicted values of ½NO" are within 5% of the experimentalobservations reported in Mashour and Boock (55). Thisfigure provides a quantitative justification for the assumptionof a linear relationship between ½NO" and t, which isroutinely used in microcirculation models (see, e.g., Sriramet al. (56) and the references therein). While this relationshipis clearly nonlinear, it can be treated as linear over the phys-iologically relevant range of WSS shown in Fig. 5. As a finalexercise in model validation, Fig. 5 B shows that the pre-dicted and observed (57) changes in ½NO" from its baselinevalue are within ~10% of each other.
Model predictions
Impact of inhibition of protein kinases on NO production
The role of protein kinases in eNOS activation is typicallystudied by inhibiting either the kinases individually
A
C D
B
FIGURE 3 Temporal variability of (A) ½NO", (B) AKT-phosphorylated eNOS concentration, ½eNOS$", (C) caveolin-bound eNOS concentration, ½eNOScav",and (D) ½cGMP" for three levels of WSS, t ¼ 8, 16, and 24 dynes/cm2.
Shear-Induced NO Production by Endothelial Cells
Please cite this article in press as: Sriram et al., Shear-Induced Nitric Oxide Production by Endothelial Cells, Biophysical Journal (2016), http://dx.doi.org/10.1016/j.bpj.2016.05.034
BPJ 7395
Biophysical Journal 111, 1–14, July 12, 2016 7

(58,59) or PI3K, which results in the subsequent inhibitionof both AKT and PKC (25,60). Fig. 6 A compares the modelpredictions with the experimental data from Dimmeler et al.(25) for AKT-phosphorylated eNOS (½eNOS$", normalizedwith the concentration at t ¼ 0) in response to a shear stress
of t¼ 12 dynes/cm2 applied for 1 h (as stated in the methodsin Dimmeler et al. (25); they also indicate that experimentswere done at 15 dynes/cm2 in the relevant figure legend.In either case, our results are in general agreement withtheir findings). Also shown are data from model versus
A B
FIGURE 4 (A) Predicted (line) and observed (symbols) dependence of NO production rate on WSS. Predicted NO production rates are given by the QNO
term in Eq. 22, which at steady state is equal to the rate of release of NO by ECs and formation of NO metabolites in the surrounding blood/media (becauseNO consumption by the ECs themselves was found to be negligible). Experimental data are from the following sources: squares are from column C of Table 1in Kuchan and Frangos (26), where NO production rates were estimated using measurements of NOx accumulation rates; circles are from Fig. 4C in Kauret al. (64), where NO production rates were estimated from nitrite accumulation rates; and triangles are from Fig. 8 in Kanai et al. (76), where NO productionrates were estimated from direct measurements of moles of NO released per unit time. Each experimental data set was normalized to the rate at t¼ 0, exceptfor Kanai et al. (76), where the values were normalized to the lowest nonzero measurement, at t¼ 0.2 dynes/cm2; the simulation results were normalized withthe predicted rate at t ¼ 0. (B) The predicted (lines) and observed (symbols) cumulative release of NO to the media/bloodstream as a function of time. Theexperimental data are from the top panel of Fig. 1 in Tsao et al. (54), showing normalized increase (above baseline measurement) of NOx accumulation inconditioned media. Both experimental and model data are normalized against cumulative NO/NOx release at 12 dynes/cm2 after 24 h.
FIGURE 5 (A) The predicted and observed NO concentration at three levels of WSS t (in dynes/cm2). The experimental data are fromMashour and Boock(55). (B) The predicted and observed changes in NO concentration from its basal levels for three values of WSS (in dynes/cm2). The experimental data arefrom Andrews et al. (57).
Sriram et al.
Please cite this article in press as: Sriram et al., Shear-Induced Nitric Oxide Production by Endothelial Cells, Biophysical Journal (2016), http://dx.doi.org/10.1016/j.bpj.2016.05.034
BPJ 7395
8 Biophysical Journal 111, 1–14, July 12, 2016

experiment for the same, but with PI3K inhibited by wort-mannin. Both model and experiment indicate that PI3K in-hibition drastically reduces eNOS activation due to shearstress. Further, this inhibition of PI3K also impacts cGMPconcentration; Fig. 6 B shows the predicted increase incGMP concentrations over basal levels, after 1-h exposureto a shear stress of 15 dynes/cm2, is similar in both modeland experiment. Further, the inhibition of PI3K by wortman-nin induces reduction in cGMP concentrations to a similardegree in model and experiment.
Fig. 6 B shows the impact of the complete inhibitionof PI3K (PI3K-), AKT, and PKC phosphorylation ofeNOS (AKT- and PKC-), and both AKT/AKT- and PKC/PKC- phosphorylation of eNOS occurring simultaneously(Kinases-), on predictions of steady-state NO concentrationat WSS t ¼ 8, 16, and 24 dynes/cm2. Inhibition of PI3Kyields a significant (~70–75%) reduction in ½NO" over arange of t, while the inhibition of PKC alone results in asmaller but still significant (~10–15%) increase in ½NO".The predicted magnitude of reduction in [NO] due toPI3K inhibition is in the vicinity of the data in Galliset al. (61) for reductions in NO synthesis: ~70–75% pre-dicted versus 68% reported. This finding is in agreementwith other experimental studies, which found that PI3K in-hibition leads to decreased eNOS activity (25,61) and thatPKC inhibition elevates eNOS activity (59). BlockingeNOS activation by AKT has a nearly identical effect asinhibiting PI3K; blocking PKC phosphorylation (and inacti-vation) of eNOS does little to retrieve this loss of NO pro-duction. These results indicate that AKT phosphorylation(and activation) of eNOS has a significantly larger net effecton endothelial NO production than does phosphorylation(and inactivation) by PKC. Finally, Fig. 6 B indicates thatincreasing (doubling) AKT activity (by doubling the rate
at which AKT phosphorylates eNOS, analogous to anAKT overexpressor model) significantly increases NO con-centrations, an effect that is further enhanced by blockingPKC phosphorylation of eNOS.
Calcium-calmodulin dependence of eNOSactivation and endothelial NO production
Various stages of eNOS activation and NO production inendothelial cells are thought to be ‘‘calcium-dependent’’or ‘‘calcium-independent’’ (4,25,26). The sensitivity anal-ysis reported below elucidates the dependency of NO pro-duction on calcium/CaM and AKT phosphorylation, i.e.,the calcium-dependent and calcium-independent elementsof the reaction cascade, respectively. In these simulations,the model was initialized using the default parametersspecified in Table 1. Then, the concentrations of extracel-lular calcium and CaM were varied, while maintaining theWSS levels. This facilitates comparison of the model pre-dictions and observational data from experiments, whichconsisted of simultaneous application of WSS and pharma-cological modulation of the different pathways, such ascalcium or AKT signaling.
Fig. 7 A shows ½NO" and cytosolic calcium concentrationsat WSS t ¼ 12 dynes/cm2, for different concentrations ofextracellular calcium. The decrease in the extracellularcalcium concentration leads to the corresponding depletionof intracellular calcium, resulting in the reduction of endo-thelial NO production. The release of stored calcium causesan initial spike in NO production, which diminishes dra-stically at large times (at the timescale on which phos-phorylation by AKT becomes an important driver of NOproduction), because Ca-CaM and thus eNOS-CaM concen-trations fall as calcium is being depleted. Thus, while AKT
FIGURE 6 Impact of modulation of protein kinase activity on NO production. (A) The predicted and observed eNOS phosphorylation by AKT, ½eNOS$", atnormal and completely inhibited kinase activity (PI3K and PI3K&). Also shown is the corresponding effect on cGMP, with and without PI3K inhibition after1 and 2 h. The experimental data are from Dimmeler et al. (25). (B) The predicted changes in steady state ½NO", at three values of WSS, in response toelimination of PI3K activation (PI3K&) and elimination of phosphorylation of eNOS by either AKT (AKT&) or PKC (PKC&). Also shown is the impacton steady-state ½NO" of the simultaneous elimination of eNOS phosphorylation by both AKT and PKC, as well as of the increase in AKT activity with(AKTþ) or without (AKTþ/PKC&) PKC.
Shear-Induced NO Production by Endothelial Cells
Please cite this article in press as: Sriram et al., Shear-Induced Nitric Oxide Production by Endothelial Cells, Biophysical Journal (2016), http://dx.doi.org/10.1016/j.bpj.2016.05.034
BPJ 7395
Biophysical Journal 111, 1–14, July 12, 2016 9
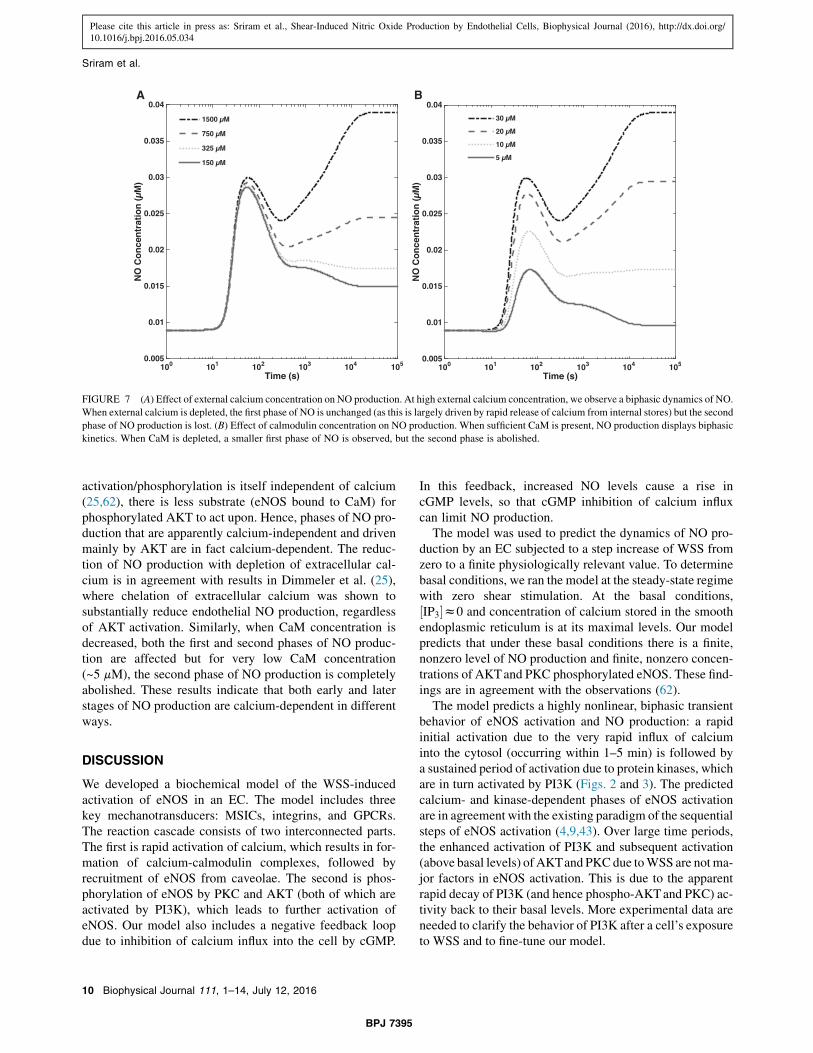
activation/phosphorylation is itself independent of calcium(25,62), there is less substrate (eNOS bound to CaM) forphosphorylated AKT to act upon. Hence, phases of NO pro-duction that are apparently calcium-independent and drivenmainly by AKT are in fact calcium-dependent. The reduc-tion of NO production with depletion of extracellular cal-cium is in agreement with results in Dimmeler et al. (25),where chelation of extracellular calcium was shown tosubstantially reduce endothelial NO production, regardlessof AKT activation. Similarly, when CaM concentration isdecreased, both the first and second phases of NO produc-tion are affected but for very low CaM concentration(~5 mM), the second phase of NO production is completelyabolished. These results indicate that both early and laterstages of NO production are calcium-dependent in differentways.
DISCUSSION
We developed a biochemical model of the WSS-inducedactivation of eNOS in an EC. The model includes threekey mechanotransducers: MSICs, integrins, and GPCRs.The reaction cascade consists of two interconnected parts.The first is rapid activation of calcium, which results in for-mation of calcium-calmodulin complexes, followed byrecruitment of eNOS from caveolae. The second is phos-phorylation of eNOS by PKC and AKT (both of which areactivated by PI3K), which leads to further activation ofeNOS. Our model also includes a negative feedback loopdue to inhibition of calcium influx into the cell by cGMP.
In this feedback, increased NO levels cause a rise incGMP levels, so that cGMP inhibition of calcium influxcan limit NO production.
The model was used to predict the dynamics of NO pro-duction by an EC subjected to a step increase of WSS fromzero to a finite physiologically relevant value. To determinebasal conditions, we ran the model at the steady-state regimewith zero shear stimulation. At the basal conditions,½IP3"z0 and concentration of calcium stored in the smoothendoplasmic reticulum is at its maximal levels. Our modelpredicts that under these basal conditions there is a finite,nonzero level of NO production and finite, nonzero concen-trations of AKTand PKC phosphorylated eNOS. These find-ings are in agreement with the observations (62).
The model predicts a highly nonlinear, biphasic transientbehavior of eNOS activation and NO production: a rapidinitial activation due to the very rapid influx of calciuminto the cytosol (occurring within 1–5 min) is followed bya sustained period of activation due to protein kinases, whichare in turn activated by PI3K (Figs. 2 and 3). The predictedcalcium- and kinase-dependent phases of eNOS activationare in agreement with the existing paradigm of the sequentialsteps of eNOS activation (4,9,43). Over large time periods,the enhanced activation of PI3K and subsequent activation(above basal levels) ofAKTand PKCdue toWSS are notma-jor factors in eNOS activation. This is due to the apparentrapid decay of PI3K (and hence phospho-AKTand PKC) ac-tivity back to their basal levels. More experimental data areneeded to clarify the behavior of PI3K after a cell’s exposureto WSS and to fine-tune our model.
A B
FIGURE 7 (A) Effect of external calcium concentration on NO production. At high external calcium concentration, we observe a biphasic dynamics of NO.When external calcium is depleted, the first phase of NO is unchanged (as this is largely driven by rapid release of calcium from internal stores) but the secondphase of NO production is lost. (B) Effect of calmodulin concentration on NO production. When sufficient CaM is present, NO production displays biphasickinetics. When CaM is depleted, a smaller first phase of NO is observed, but the second phase is abolished.
Sriram et al.
Please cite this article in press as: Sriram et al., Shear-Induced Nitric Oxide Production by Endothelial Cells, Biophysical Journal (2016), http://dx.doi.org/10.1016/j.bpj.2016.05.034
BPJ 7395
10 Biophysical Journal 111, 1–14, July 12, 2016

To validate the model, we compared its predictions withboth quantitative and qualitative experimental observations.The model reproduces the observed dependence of NO pro-duction rate (Fig. 4) and NO concentrations (Fig. 5) onWSS, especially taking into account the significant amountof scatter in the available experimental data. The model re-produces the observed transient behavior of NO productionrate after a cell’s exposure to shear stress (Fig. 4 B).The model predictions of both the increased levels ofAKT phosphorylated eNOS and cGMP concentrations arewithin ~10–15% of their measured counterparts (Fig. 6 A).
Our model predicts that the inhibition of PI3K, which re-sults in downregulation of both AKT and PKC, leads toa drastic reduction (>70%) in NO concentrations (seeFig. 6); this is consistent with the observed behavior(25,61). This suggests that the stimulatory effect of AKTphosphorylation dominates the inhibitory role of PKC, sup-porting the perspective that AKT is by far the most impor-tant protein kinase in eNOS activation. This hypothesis isfurther supported by the model’s prediction that inhibitingPKC alone results in a small but significant (~15%) increasein NO production; hence, PKC has a smaller net effect oneNOS activation than AKT. We are not aware of quantitativemeasurements of the extent of kinase inhibition as a func-tion of eNOS activity, at different levels of shear stress.Yet our model does agree with the empirical evidence forstrong up-regulation of eNOS activity by AKT and weaker,but still significant, down-regulation of eNOS by PKC.
To summarize, our model captures the followingobserved features of eNOS activation by WSS:
1) eNOS activation and NO production are always depen-dent on calcium concentrations and the binding ofeNOS with CaM. In other words, concentrations of cal-cium and CaM remain dependent variables for NO pro-duction/concentration and the depleting or inhibiting ofeither induces a precipitous decline in NO production.
2) Certain elements of the reaction cascade that results ineNOS activation and NO production are reported to becalcium-independent, as observed in Dimmeler et al.(25) and Ozeki et al. (62). In our model, the coupling ofAKT phosphorylation to calcium signaling is weak and,practically, calcium-independent. As a result, eNOS acti-vation and NO production can be altered even if calciumsignaling is unchanged. For example, inhibiting AKTphosphorylation while leaving calcium stimulation un-changed results in a sharp decrease in ½NO" (see Figs. 6and 7), in agreement with the experiment (25).
3) Upon exposure to shear stress, once calcium reaches itssteady state, NO production/concentration continues tochange. Hence, there is a lag between calcium and NOdynamics; this is due to the relatively slow rate at whicheNOS binds with CaM and is then phosphorylated byAKT. That does not imply independence of NO produc-tion from calcium; if calcium levels are changed during
this slower phase of activation, NO production/concen-trations will also change, albeit more gradually.
4) Inactivation of AKT drastically reduces eNOS activity,whereas inhibition of PKC has a smaller, stimulatory ef-fect on eNOS activation. While the elevation (abovebasal levels) of AKTactivation due to WSS is not impor-tant over large timescales, the finite, basal activation ofAKT is essential for maximal eNOS activation and NOproduction.
5) Concentrations of both NO and cGMP increase withWSS. Over a broad range of WSS, this increase is highlynonlinear, but within the physiologically relevant rangesof WSS (~20 dynes/cm2), one can use a linear relationbetween (NO) and WSS (55,56,63).
6) The predicted steady-state and transient variations of NOproduction rates at different WSS levels are in generalagreement with the observations, although the scatterin the reported data is large (26,55,57,63,64).
7) The predicted increase of ½cGMP" with ½NO" (Fig. 6 A) isconsistent with the experimental data (25). Hence themodel supports a role of shear stress as a stimulator ofvasodilation by quantifying the shear-induced NO pro-duction that, in turn, elevates a cGMP level, ultimatelyleading to vasodilation.
8) Removal of WSS leads to an ultimate return to basallevels for all reactants, with the calcium transients oc-curring rapidly and the kinase-dependent transients fo-llowing more slowly. The timescales over which thesystem returns to basal levels of (NO) are in a generalagreement with the experiments (55).
Thus, sustained shear-induced endothelial NO productionrequires both calcium signaling and AKT phosphorylation;the system can, however, be manipulated/modulated by in-hibiting or promoting one pathway without changing theother.
The presented model enhances the current understandingof the mechanistic and biochemical processes involved inthe activation of eNOS and subsequent NO production inECs. The model’s predictions might be used to facilitatethe design of experiments, which focus on inhibition ofthe reactants and mechanosensors involved in the NO pro-duction reaction cascade. This is relevant to several fieldsof biomedical research, e.g., cancer (65), diabetes (66),and heart disease (3), where the regulation of endothelialNO production has significant clinical applications.
Model limitations
While our model captures many of the observed features ofNO production in ECs, it has several limitations. It does notcontain a mechanistic description of ECs. Instead, WSS actsas an input that triggers the reaction cascade resulting ineNOS activation. The lack of a mechanical model precludesthe analysis of such factors as the role of viscoelasticity in
Shear-Induced NO Production by Endothelial Cells
Please cite this article in press as: Sriram et al., Shear-Induced Nitric Oxide Production by Endothelial Cells, Biophysical Journal (2016), http://dx.doi.org/10.1016/j.bpj.2016.05.034
BPJ 7395
Biophysical Journal 111, 1–14, July 12, 2016 11

determining the system’s transient behavior. Consequently,our model cannot be used to reproduce experimentalstudies, which show that viscoelastic properties of the cyto-skeleton have a profound effect on the mechanical behaviorof an EC exposed to oscillatory or pulsatile shear. Futureextensions of our model will combine it with a mechanicalmodel of ECs.
Our model accounts for three mechanosensors: MSICs,GPCRs, and integrins. As experimental data for other me-chanosensors (sodium and potassium ion channels, lipidrafts and vesicles, cytoskeletal remodeling, signaling viacadherins and other transmembrane proteins, etc.) becomeavailable, their effects can be incorporated into our model.Such enhancements of our model are facilitated by itsmodular structure.
SUPPORTING MATERIAL
Supporting Materials and Methods, Supporting Results and Discussion,eight figures, and four tables are available at http://www.biophysj.org/biophysj/supplemental/S0006-3495(16)30359-9.
AUTHOR CONTRIBUTIONS
K.S. performed research and wrote the article; J.G.L. led the revisions effortand edited the article; P.R. helped with analysis and wrote the article;D.M.T. designed research and wrote the article; and all authors agreed onthe content of the article.
ACKNOWLEDGMENTS
This work was supported in part by the Defense Advanced Research Pro-jects Agency under the EQUiPS program, the Air Force Office of ScientificResearch under grant No. FA9550-12-1-0185, and the National ScienceFoundation under grant No. DMS-1522799.
SUPPORTING CITATIONS
References (67–74) appear in the Supporting Material.
REFERENCES
1. Ignarro, L. J. 1989. Endothelium-derived nitric oxide: actions andproperties. FASEB J. 3:31–36.
2. Wink, D. A., K. M. Miranda,., M. B. Grisham. 2001. Mechanisms ofthe antioxidant effects of nitric oxide. Antioxid. Redox Signal.3:203–213.
3. Davies, P. F. 2009. Hemodynamic shear stress and the endothelium incardiovascular pathophysiology. Nat. Clin. Pract. Cardiovasc. Med.6:16–26.
4. Balligand, J. L., O. Feron, and C. Dessy. 2009. eNOS activation byphysical forces: from short-term regulation of contraction to chronic re-modeling of cardiovascular tissues. Physiol. Rev. 89:481–534.
5. Rafikov, R., F. V. Fonseca,., S. M. Black. 2011. eNOS activation andNO function: structural motifs responsible for the posttranslationalcontrol of endothelial nitric oxide synthase activity. J. Endocrinol.210:271–284.
6. Martinac, B. 2004. Mechanosensitive ion channels: molecules of me-chanotransduction. J. Cell Sci. 117:2449–2460.
7. Chachisvilis, M., Y. L. Zhang, and J. A. Frangos. 2006. G protein-coupled receptors sense fluid shear stress in endothelial cells. Proc.Natl. Acad. Sci. USA. 103:15463–15468.
8. Ando, J., and K. Yamamoto. 2009. Vascular mechanobiology: endothe-lial cell responses to fluid shear stress. Circ. J. 73:1983–1992.
9. Shyy, J. Y., and S. Chien. 2002. Role of integrins in endothelial mecha-nosensing of shear stress. Circ. Res. 91:769–775.
10. Storch, U., M. Mederos y Schnitzler, and T. Gudermann. 2012. G pro-tein-mediated stretch reception. Am. J. Physiol. Heart Circ. Physiol.302:H1241–H1249.
11. Clark, C. B., N. L. McKnight, and J. A. Frangos. 2002. Strain and strainrate activation of G proteins in human endothelial cells. Biochem.Biophys. Res. Commun. 299:258–262.
12. Johnson, B. D., K. J. Mather, and J. P. Wallace. 2011. Mechanotrans-duction of shear in the endothelium: basic studies and clinical implica-tions. Vasc. Med. 16:365–377.
13. Lemon, G., W. G. Gibson, and M. R. Bennett. 2003. Metabotropicreceptor activation, desensitization and sequestration-I: modelling cal-cium and inositol 1,4,5-trisphosphate dynamics following receptoractivation. J. Theor. Biol. 223:93–111.
14. Katsumi, A., T. Naoe, ., M. A. Schwartz. 2005. Integrin activationand matrix binding mediate cellular responses to mechanical stretch.J. Biol. Chem. 280:16546–16549.
15. Go, Y. M., H. Park, ., H. Jo. 1998. Phosphatidylinositol 3-kinase gmediates shear stress-dependent activation of JNK in endothelial cells.Am. J. Physiol. 275:H1898–H1904.
16. Morello, F., A. Perino, and E. Hirsch. 2009. Phosphoinositide 3-kinasesignalling in the vascular system. Cardiovasc. Res. 82:261–271.
17. Plank, M. J., D. J. N. Wall, and T. David. 2006. Atherosclerosis andcalcium signalling in endothelial cells. Prog. Biophys. Mol. Biol.91:287–313.
18. Plank, M. J., D. J. N. Wall, and T. David. 2007. The role of endothelialcalcium and nitric oxide in the localisation of atherosclerosis. Math.Biosci. 207:26–39.
19. Comerford, A., M. J. Plank, and T. David. 2008. Endothelial nitricoxide synthase and calcium production in arterial geometries: an inte-grated fluid mechanics/cell model. J. Biomech. Eng. 130:011010.
20. Wiesner, T. F., B. C. Berk, and R. M. Nerem. 1997. A mathematicalmodel of the cytosolic-free calcium response in endothelial cells tofluid shear stress. Proc. Natl. Acad. Sci. USA. 94:3726–3731.
21. Wiesner, T. F., B. C. Berk, and R. M. Nerem. 1996. A mathematicalmodel of cytosolic calcium dynamics in human umbilical vein endo-thelial cells. Am. J. Physiol. 270:C1556–C1569.
22. David, T., S. Alzaidi, and H. Farr. 2009. Coupled autoregulationmodels in the cerebro-vasculature. J. Eng. Math. 64:403–415.
23. Koo, A., D. Nordsletten, ., C. F. Dewey, Jr. 2013. In silico modelingof shear-stress-induced nitric oxide production in endothelial cellsthrough systems biology. Biophys. J. 104:2295–2306.
24. Riccobene, T. A., G. M. Omann, and J. J. Linderman. 1999. Modelingactivation and desensitization of G-protein coupled receptors providesinsight into ligand efficacy. J. Theor. Biol. 200:207–222.
25. Dimmeler, S., I. Fleming, ., A. M. Zeiher. 1999. Activation of nitricoxide synthase in endothelial cells by Akt-dependent phosphorylation.Nature. 399:601–605.
26. Kuchan, M. J., and J. A. Frangos. 1994. Role of calcium and calmod-ulin in flow-induced nitric oxide production in endothelial cells. Am. J.Physiol. 266:C628–C636.
27. Kuchan, M. J., H. Jo, and J. A. Frangos. 1994. Role of G proteins inshear stress-mediated nitric oxide production by endothelial cells.Am. J. Physiol. 267:C753–C758.
28. Jo, H., K. Sipos,., J. M. McDonald. 1997. Differential effect of shearstress on extracellular signal-regulated kinase and N-terminal Jun ki-nase in endothelial cells. Gi2- and Gb/g-dependent signaling pathways.J. Biol. Chem. 272:1395–1401.
Sriram et al.
Please cite this article in press as: Sriram et al., Shear-Induced Nitric Oxide Production by Endothelial Cells, Biophysical Journal (2016), http://dx.doi.org/10.1016/j.bpj.2016.05.034
BPJ 7395
12 Biophysical Journal 111, 1–14, July 12, 2016

29. Sedaghat, A. R., A. Sherman, and M. J. Quon. 2002. A mathematicalmodel of metabolic insulin signaling pathways. Am. J. Physiol. Endo-crinol. Metab. 283:E1084–E1101.
30. Putney, J. W., Jr., L. M. Broad, ., G. S. Bird. 2001. Mechanisms ofcapacitative calcium entry. J. Cell Sci. 114:2223–2229.
31. Kwan, H. Y., Y. Huang, and X. Yao. 2000. Store-operated calcium entryin vascular endothelial cells is inhibited by cGMP via a protein kinaseG-dependent mechanism. J. Biol. Chem. 275:6758–6763.
32. Condorelli, P., and S. C. George. 2001. In vivo control of soluble gua-nylate cyclase activation by nitric oxide: a kinetic analysis. Biophys. J.80:2110–2119.
33. Yang, J., J. W. Clark, ., C. S. Robertson. 2005. Mathematicalmodeling of the nitric oxide/cGMP pathway in the vascular smoothmuscle cell. Am. J. Physiol. Heart Circ. Physiol. 289:H886–H897.
34. Jafri, M. S., S. Vajda, ., B. Gillo. 1992. A membrane model for cyto-solic calcium oscillations. A study using Xenopus oocytes. Biophys. J.63:235–246.
35. Li, S., M. Kim, ., J. Y. Shyy. 1997. Fluid shear stress activation offocal adhesion kinase. Linking to mitogen-activated protein kinases.J. Biol. Chem. 272:30455–30462.
36. Guan, J. L. 1997. Role of focal adhesion kinase in integrin signaling.Int. J. Biochem. Cell Biol. 29:1085–1096.
37. Park, H. Y., S. A. Kim, ., L. Pollack. 2008. Conformational changesof calmodulin upon Ca2þ binding studied with a microfluidic mixer.Proc. Natl. Acad. Sci. USA. 105:542–547.
38. McMurry, J. L., C. A. Chrestensen,., J. C. Salerno. 2011. Rate, affin-ity and calcium dependence of nitric oxide synthase isoform binding tothe primary physiological regulator calmodulin. FEBS J. 278:4943–4954.
39. Persechini, A., and B. Cronk. 1999. The relationship between the freeconcentrations of Ca2þ and Ca2þ-calmodulin in intact cells. J. Biol.Chem. 274:6827–6830.
40. Porumb, T. 1994. Determination of calcium-binding constants by flowdialysis. Anal. Biochem. 220:227–237.
41. Takahashi, S., and M. E. Mendelsohn. 2003. Synergistic activation ofendothelial nitric-oxide synthase (eNOS) by HSP90 and Akt: cal-cium-independent eNOS activation involves formation of an HSP90-Akt-CaM-bound eNOS complex. J. Biol. Chem. 278:30821–30827.
42. Dudzinski, D. M., J. Igarashi, ., T. Michel. 2006. The regulation andpharmacology of endothelial nitric oxide synthase. Annu. Rev. Pharma-col. Toxicol. 46:235–276.
43. Mount, P. F., B. E. Kemp, and D. A. Power. 2007. Regulation of endo-thelial and myocardial NO synthesis by multi-site eNOS phosphoryla-tion. J. Mol. Cell. Cardiol. 42:271–279.
44. Michel, J. B., O. Feron, ., T. Michel. 1997. Caveolin versus calmod-ulin. Counterbalancing allosteric modulators of endothelial nitric oxidesynthase. J. Biol. Chem. 272:25907–25912.
45. Ju, H., R. Zou, ., R. C. Venema. 1997. Direct interaction of endothe-lial nitric-oxide synthase and caveolin-1 inhibits synthase activity.J. Biol. Chem. 272:18522–18525.
46. Bredt, D. S., C. D. Ferris, and S. H. Snyder. 1992. Nitric oxide synthaseregulatory sites. Phosphorylation by cyclic AMP-dependent protein ki-nase, protein kinase C, and calcium/calmodulin protein kinase; identi-fication of flavin and calmodulin binding sites. J. Biol. Chem.267:10976–10981.
47. Greif, D. M., R. Kou, and T. Michel. 2002. Site-specific dephosphory-lation of endothelial nitric oxide synthase by protein phosphatase 2A:evidence for crosstalk between phosphorylation sites. Biochemistry.41:15845–15853.
48. Nollen, E. A., and R. I. Morimoto. 2002. Chaperoning signaling path-ways: molecular chaperones as stress-sensing ‘heat shock’ proteins.J. Cell Sci. 115:2809–2816.
49. Sriram, K., B. Y. S. Vazquez, ., D. M. Tartakovsky. 2011. The effectof small changes in hematocrit on nitric oxide transport in arterioles.Antioxid. Redox Signal. 14:175–185.
50. Buerk, D. G. 2001. Can we model nitric oxide biotransport? A surveyof mathematical models for a simple diatomic molecule with sur-prisingly complex biological activities. Annu. Rev. Biomed. Eng.3:109–143.
51. Schmidt, A., D. Wenzel, ., W. Bloch. 2005. Endostatin down-regu-lates soluble guanylate cyclase (sGC) in endothelial cells in vivo: influ-ence of endostatin on vascular endothelial growth factor (VEGF)signaling. Endothelium. 12:251–257.
52. Ahluwalia, A., P. Foster, ., A. J. Hobbs. 2004. Antiinflammatory ac-tivity of soluble guanylate cyclase: cGMP-dependent down-regulationof P-selectin expression and leukocyte recruitment. Proc. Natl. Acad.Sci. USA. 101:1386–1391.
53. Helmlinger, G., B. C. Berk, and R. M. Nerem. 1995. Calcium responsesof endothelial cell monolayers subjected to pulsatile and steady laminarflow differ. Am. J. Physiol. 269:C367–C375.
54. Tsao, P. S., N. P. Lewis,., J. P. Cooke. 1995. Exposure to shear stressalters endothelial adhesiveness. Role of nitric oxide. Circulation.92:3513–3519.
55. Mashour, G. A., and R. J. Boock. 1999. Effects of shear stress on nitricoxide levels of human cerebral endothelial cells cultured in an artificialcapillary system. Brain Res. 842:233–238.
56. Sriram, K., B. Y. Salazar Vazquez,., D. M. Tartakovsky. 2012. Autor-egulation and mechanotransduction control the arteriolar response tosmall changes in hematocrit. Am. J. Physiol. Heart Circ. Physiol.303:H1096–H1106.
57. Andrews, A. M., D. Jaron, ., K. A. Barbee. 2010. Direct, real-timemeasurement of shear stress-induced nitric oxide produced from endo-thelial cells in vitro. Nitric Oxide. 23:335–342.
58. Matsubara, M., N. Hayashi, ., K. Titani. 2003. Regulation of en-dothelial nitric oxide synthase by protein kinase C. J. Biochem.133:773–781.
59. Hirata, K., R. Kuroda, ., M. Yokoyama. 1995. Inhibition of endothe-lial nitric oxide synthase activity by protein kinase C. Hypertension.25:180–185.
60. Dimmeler, S., B. Assmus,., A. M. Zeiher. 1998. Involvement in sup-pression of apoptosis: fluid shear stress stimulates phosphorylation ofAkt in human endothelial cells. Circ. Res. 83:334–341.
61. Gallis, B., G. L. Corthals, ., M. A. Corson. 1999. Identification offlow-dependent endothelial nitric-oxide synthase phosphorylation sitesby mass spectrometry and regulation of phosphorylation and nitric ox-ide production by the phosphatidylinositol 3-kinase inhibitorLY294002. J. Biol. Chem. 274:30101–30108.
62. Ozeki, M., H. Watanabe,., H. Hayashi. 2004. Akt and Ca2þ signalingin endothelial cells. Mol. Cell. Biochem. 259:169–176.
63. McAllister, T. N., and J. A. Frangos. 1999. Steady and transient fluidshear stress stimulates NO release in osteoblasts through distinctbiochemical pathways. J. Bone Miner. Res. 14:930–936.
64. Kaur, H., R. Carriveau, and B. Mutus. 2012. A simple parallel plateflow chamber to study effects of shear stress on endothelial cells.Am. J. Biomed. Sci. 4:70–78.
65. Xu, W., L. Z. Liu, ., I. G. Charles. 2002. The role of nitric oxide incancer. Cell Res. 12:311–320.
66. Creager, M. A., T. F. Luscher, ., J. A. Beckman. 2003. Diabetes andvascular disease: pathophysiology, clinical consequences, and medicaltherapy. Part I. Circulation. 108:1527–1532.
67. Adams, J. A., G. M. Omann, and J. J. Linderman. 1998. A mathemat-ical model for ligand/receptor/G-protein dynamics and actin polymer-ization in human neutrophils. J. Theor. Biol. 193:543–560.
68. Chen, K., and A. S. Popel. 2006. Theoretical analysis of biochemicalpathways of nitric oxide release from vascular endothelial cells. FreeRadic. Biol. Med. 41:668–680.
69. Chen, X., D. Jaron,., D. G. Buerk. 2006. The influence of radial RBCdistribution, blood velocity profiles, and glycocalyx on coupled NO/O2
transport. J. Appl. Physiol. 100:482–492.
70. Lamkin-Kennard, K. A., D. G. Buerk, and D. Jaron. 2004. Interactionsbetween NO and O2. Microvasc. Res. 68:38–50.
Shear-Induced NO Production by Endothelial Cells
Please cite this article in press as: Sriram et al., Shear-Induced Nitric Oxide Production by Endothelial Cells, Biophysical Journal (2016), http://dx.doi.org/10.1016/j.bpj.2016.05.034
BPJ 7395
Biophysical Journal 111, 1–14, July 12, 2016 13

71. Milo, R. 2013. What is the total number of protein molecules per cellvolume? A call to rethink some published values. BioEssays. 35:1050–1055.
72. Lewicki, J. A., B. Chang, and F. Murad. 1983. Quantification of guany-late cyclase concentrations by a direct double determinant tandem im-munoradiometric assay. J. Biol. Chem. 258:3509–3515.
73. Luby-Phelps, K. 2000. Cytoarchitecture and physical properties ofcytoplasm: volume, viscosity, diffusion, intracellular surface area.Int. Rev. Cytol. 192:189–221.
74. John, K., and A. I. Barakat. 2001. Modulation of ATP/ADP concentra-tion at the endothelial surface by shear stress: effect of flow-inducedATP release. Ann. Biomed. Eng. 29:740–751.
75. Gamper, N., and M. S. Shapiro. 2007. Target-specific PIP2 signalling:how might it work? J. Physiol. 582:967–975.
76. Kanai, A. J., H. C. Strauss, ., T. Malinski. 1995. Shear stress inducesATP-independent transient nitric oxide release from vascular endothe-lial cells, measured directly with a porphyrinic microsensor. Circ. Res.77:284–293.
Sriram et al.
Please cite this article in press as: Sriram et al., Shear-Induced Nitric Oxide Production by Endothelial Cells, Biophysical Journal (2016), http://dx.doi.org/10.1016/j.bpj.2016.05.034
BPJ 7395
14 Biophysical Journal 111, 1–14, July 12, 2016

Biophysical Journal, Volume 111
Supplemental Information
Shear-Induced Nitric Oxide Production by Endothelial Cells
Krishna Sriram, Justin G. Laughlin, Padmini Rangamani, and Daniel M. Tartakovsky

Shear stress induced NO production S1
Supplemental Material for “Shear-Induced Nitric Oxide Production byEndothelial Cells”
S1 Model Parameterization
Most model parameters were taken directly from previous studies (see Table 1). The rest are estimated below.
GPCR activation and IP3
production. The variation of GPCR activation with WSS ⌧ was fitted to the data reported in (7).No IP
3
is produced at ⌧ = 0 (17) and, hence, there is negligible GPCR/G-protein activation. The data in (7) suggest thatG-protein activation reaches its maximum around ⌧ = 15 to 20 dynes/cm2 (7) before plateauing. In Eq. 2, the value of ⇤,which determines shear stress at which G-protein activation reaches its peak, was selected as ⇤ = 15 dynes/cm2. Sensitivity tothis parameter is discussed below. We set K
cp
= 0.002 µM�1, which at maximum G-protein stimulation results in a maximallevel of IP
3
production = 0.00546 µM/s (17).The total concentration of G proteins in the cell was calculated based on numbers from (13, 24, 69), implying 105 G
proteins in a cell volume of 5⇥10�16 m3 (13). This yields [G] = 0.33 µM in a cell. The parameter ↵ in Eq. 3 was hence con-verted from the value used in (13) for 105 G proteins to the value indicated in Table 1 for [G] = 0.33 µM. The ATP-dependentparameter MATP was estimated from (17) as MATP = �1/(�1 + k
c
) = 0.7937 using the notations and reference valuesprovided in (17) for these quantities, under the assumption of a constant “bulk” ATP concentration �1. Lastly, the calciumdependence of IP
3
production was not considered, since previous studies (e.g., (17) and (19)) parameterized this calciumdependence of IP
3
production such that terms canceled, resulting in an IP3
production rate that was effectively independentof calcium.
According to (13), the term rr
in Eq. 4, which quantifies the extent of replenishment of PIP3
by internal stores of phos-pholipids in the cell, can take values ranging from 10 s�1 to 0.015 s�1. Our predictions for [NO] are relatively insensitive (a< 1% variation) to the value of this parameter.
CCE Inhibition. For the low (µM) concentrations of cGMP typically observed in ECs (36), the data in (40) suggest small,but measurable, decrease in CCE with increasing intracellular cGMP concentrations. At higher [cGMP], cGMP almost com-pletely inhibits CCE; however we restrict our analysis to the range of [cGMP] that allows for small degrees of CCE inhibitionby cGMP, with the rate of inhibition increasing linearly with [cGMP]. From the data in (40) for CCE inhibition by cGMP, weestimate ([cGMP]) = 1� 0.0075[cGMP], i.e., ⇠ 15% reduction of CCE at [cGMP] ⇠ 20 µM.
PI3K activation. On exposure to WSS, PI3K activity reaches its maximum of around 3.5 times its basal level (14, 15). Thisgives aPI3K = 2.5 in Eq. 14. We explored a range of values for ⌘, from 0.03 s�1 (a very rapid decay of PI3K activity observedin (15)) to 0 (no decay). We also explored a range of values of �, which corresponds to the WSS at which maximal activationof PI3K occurs. Our model was found to be relatively insensitive to �; we set � = 24 dynes/cm2 in all the simulations.
Ca4
-CaM binding. We assumed the rate of Ca4
-CaM formation to equal the rate of calcium buffering by cytosolic proteins,as suggested in (17, 37). This yields kCa4-CaM = 100 s�1, based on the value used in (17). The maximum [Ca
4
-CaM] atsaturation levels of calcium was set to 4.5 nM/µM of the total available CaM (44). This gives a value of ✓ = 0.0045 in Eq. 17.Following (44), we set the Hill coefficient to � = 2.7.
eNOS-CaM binding. The rate of dissociation of eNOS-CaM was set to K�CaM = 0.01 s�1, based on the values reported
in (32). The maximum rate at which eNOS binds to CaM in the presence of caveolin was estimated by assuming that at basalconditions, 90% of eNOS is in the inactive, non-CaM-bound state. This yields K+
CaM = 7.5 s�1. The rate K0.5CaM = 3.0 µMwas estimated from the data in (31) in the regime where [Cav] is significantly larger than [Ca-CaM] and, hence, [Ca
4
CaM].
eNOS-protein kinase activation kinetics. The rate of phosphorylation of eNOS by PKC was estimated from the data in (30),under the assumption of first-order kinetics. This gives k+Thr = 0.02 s�1 (for full activation of all 100 nM of intracellularPKC) and k+Thr/k
�Thr = 9.0 in Eq. 20. The kinetics of eNOS binding with AKT, in presence of Hsp90, were estimated from
the data in (34) as kmaxeAKT = 0.002 s�1 (for full activation of intracellular AKT) and kmax
eAKT/k�eAKT = 18.0 in Eq. 19, under
the assumption of maximal activation of AKT in (34). Lower levels of AKT activation, i.e., [AKT]/[AKT]tot < 1, shiftthis equilibrium to less AKT-phosphorylated eNOS. This estimate of the rate of AKT phosphorylation of eNOS results inan increase of [eNOS⇤] over its basal state following a step increase in WSS, which is comparable to that reported in (63)

S2 Sriram et al.
(see Fig. 6). An increase of similar magnitude (i.e., two- to three-fold) in eNOS phosphorylation was also measured in (55)following exposure to WSS.
NO production. Based on a range of suggested values discussed in (70), we set [eNOS]tot = 0.04 µM within the cell (seeTable 1). Under the assumption of constant supply of L-Arg and oxygen, the rate of NO production, RNO in Eqs. 23 and 24,depends solely on eNOS activity. Hence, the ratio keNO[O2
]/(kmNO + [O2
]) is assumed to be constant, ⌥ (see Eq. 25). Weset ⌥ = 300 s�1 in Eq. 25, which yields a basal rate of NO production QNO ⇠ 3.4 µM/s, a value consistent with the rangeof basal NO production rates in (70). At physiological WSS values (⌧ ⇠ 20 dynes/cm2), NO production rates are found tobe in the range of 20 µM/s, consistent with the values suggested in previous studies (70–72). At WSS ⌧ = 6 dynes/cm2,the predicted NO production rates are consistent (within 20%) with the values suggested in (70). These observations suggestthat ⌥ = 300 s�1 yields the NO production rates that are consistent with those reported in the literature. Figures 4 and 5demonstrate that the model’s predictions of [NO] are also consistent with their experimentally observed counterparts. Therate of NO scavenging was set to �NO = 382 s�1, the rate at which RBCs adjacent to ECs scavenge NO (33, 71).
Intracellular sGC concentrations. In Eq. 26, we set [sGC] = 0.1 µM. This value was deduced from two observations: thetotal protein concentration in a cell is ⇠ 0.2⇥ 106 proteins per µm3 (73), and the total amount of sGC protein in a variety oftissues is ⇠ 400 ng/mg (74). We verified that decreasing or increasing [sGC] by an order of magnitude has a negligible effect(< 1%) on [NO] because the mass balance in Eq. 22 is dominated by the RBC scavenging term �NO[NO].
S2 Supplemental Results
Consider an endothelial cell at its basal state (WSS ⌧ = 0). We use our model to investigate the response of this EC to astep increase of WSS (⌧ = ⌧
0
> 0) applied at time t = 0. The amplitude and time scale of this response are controlled by anumber of parameters, whose values are discussed in section S1 and summarized in Table 1. Two of these parameters, � and⌘ in Eq. 14, were estimated via a sensitivity analysis. This was done due to the lack of conclusive experimental evidence tofacilitate parameter estimation for these quantities.
Experimental determination of their values is typically based on observations of the rate of decay of [PI3K⇤] to its basalstate. Such estimates of the decay rate ⌘ vary from ⌘ ⇡ 0.003 s�1 (corresponding to a relatively fast time scale of about 5min) (15) to ⌘ ⇡ 0.0005 s�1 (corresponding to a larger time scale of about 30 min) (14). Our model enables one to discrimi-nate between these estimates by propagating their effects through the reactive network. The outcome is presented in Figure S1,which shows the temporal variability of [NO] in response to the applied WSS ⌧ = 12 dynes/cm2 for several values of � and⌘. Measurements of the shear-induced endothelial NO production (26, 60) reveal that [NO] reaches its maximum value atthe new equilibrium (steady state) corresponding to the applied WSS. This behavior is consistent with the [NO] curves for⌘ � 0.003 s�1, while smaller values of ⌘ (e.g., ⌘ = 3.0⇥10�4 s�1 in Fig. S1) result in an unphysical intermediate maximum.In the remainder of this study we therefore use ⌘ = 0.003 s�1, which yields the time scales for the decay of PI3K activityobserved in (15). For this value of ⌘, the predicted dynamics of [NO] is relatively insensitive to the choice of � (Fig. S1b). Weset its value to � = 24 dynes/cm2, in the same range of magnitude as the WSS scaling parameter ⇤ in Eq. 2.
Relative insensitivity of our model to parameter � suggests that the evolution of [NO] over large time intervals after theEC’s exposure to a step increase in WSS is largely unaffected by the shear-induced enhancement in activation of AKT andPKC. This is due to the rapid return of PI3K activity to its basal levels of excitation. At the same time, both AKT and PKCdo play a crucial role in eNOS regulation as discussed below. Specifically, we will show that basal levels of AKT activationare both necessary and sufficient for a high level of eNOS phosphorylation and activation.
S2.1 Parametric sensitivity of the dynamic behavior of NO concentrations
Figure S2 identifies temporal scales of the variation of the components of the eNOS activation process by exhibiting thetransient behavior of [Ca2+]c, [Ca
4
CaM], [eNOS-CaM], [eNOS⇤] and [NO] for WSS ⌧ = 12 dynes/cm2. It elucidates thecalcium-dependent and kinase-dependent phases of the eNOS activation cycle, with the calcium-dependent activation occur-ring very rapidly. The biphasic transient behavior is predicted to occur over a wide range of shear stress (see, e.g., Fig. 3 in themain text) for eNOS activation and NO production. The two distinct phases of NO production correspond to the initial tran-sient calcium response, and a more sustained but gradual increase in NO production following eNOS phosphorylation. Therapid calcium transient drives a spike in calcium-calmodulin complex formation [Ca
4
CaM]. This results in enhanced recruit-ment of eNOS otherwise bound to caveolin, resulting in activation of the eNOS enzyme. During this early phase activation,eNOS phosphorylation by AKT plays a relatively minor role, as evidenced by the relatively slow increases in [eNOS⇤] (on the

Shear stress induced NO production S3
(A) (B)
Figure S1: Temporal variation of NO concentration produced by an endothelial cell in response to WSS ⌧ = 12 dynes/cm2 for (A)� = 24 dynes/cm2 and several values of ⌘, and (B) ⌘ = 0.003 s�1 and several values of �. These two parameters control the amplitude andtime scale of the decay of PI3K activity to its basal level.
order of 103 s). The more gradual phase of the increased NO production/concentration starts when [Ca2+]c reaches its steadystate, which occurs on time scales on the order of 102 s. This steady-state value of [Ca2+]c is elevated above its counterpart inbasal, unstimulated cells. That, in turn, increases the steady-state amount of calcium-calmodulin complexes above their basallevels. Calmodulin-bound eNOS, eNOS-CaM, is then gradually phosphorylated by AKT, gradually increasing NO productionas eNOS becomes phosphorylated and activated.
Figure S2: Temporal variation of [IP3], [Ca2+]c, [NO], [eNOS-CaM] (concentration of eNOS bound to CaM, i.e., unphosphorylated byAKT), [Ca4CaM] and [eNOS⇤] (concentration of eNOS phosphorylated by AKT) for WSS ⌧ = 12 dynes/cm2.
To explore this dynamic behavior in greater detail, time scales of certain critical reaction processes were varied and theirimpact on the transient behavior of [NO], following the exposure to WSS, was studied. The initial calcium transients aredetermined by the production of IP
3
, which, in turn, mediates the release of stored calcium within the cell (17). The timescales of IP
3
synthesis and degradation are controlled by the forward (rf
) and backward (µ1
) rates in Eq. 3. Figure S3 exhibitsthe sensitivity of the biphasic behavior of NO concentrations to a tenfold increase and a corresponding decrease in r
f
and µ1
respectively, in response to a step-increase in WSS, such that the dynamics might change but not the steady-state response.The ten-fold reduction in r
f
modulates the early-time increase in NO concentrations, because a reduced rate of IP3
synthesisdecreases the magnitude of the early-time calcium transients. The effects of the ten-fold increase in r
f
are less pronounced. At
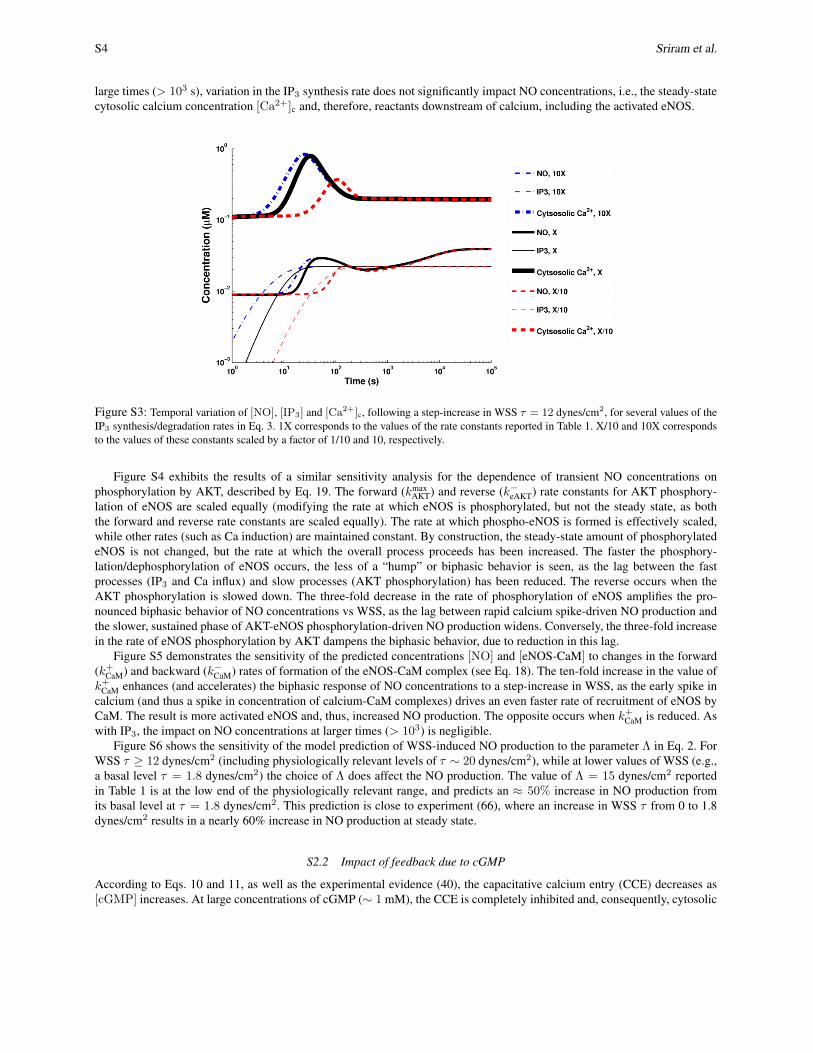
S4 Sriram et al.
large times (> 103 s), variation in the IP3
synthesis rate does not significantly impact NO concentrations, i.e., the steady-statecytosolic calcium concentration [Ca2+]c and, therefore, reactants downstream of calcium, including the activated eNOS.
Figure S3: Temporal variation of [NO], [IP3] and [Ca2+]c, following a step-increase in WSS ⌧ = 12 dynes/cm2, for several values of theIP3 synthesis/degradation rates in Eq. 3. 1X corresponds to the values of the rate constants reported in Table 1. X/10 and 10X correspondsto the values of these constants scaled by a factor of 1/10 and 10, respectively.
Figure S4 exhibits the results of a similar sensitivity analysis for the dependence of transient NO concentrations onphosphorylation by AKT, described by Eq. 19. The forward (kmax
AKT) and reverse (k�eAKT) rate constants for AKT phosphory-lation of eNOS are scaled equally (modifying the rate at which eNOS is phosphorylated, but not the steady state, as boththe forward and reverse rate constants are scaled equally). The rate at which phospho-eNOS is formed is effectively scaled,while other rates (such as Ca induction) are maintained constant. By construction, the steady-state amount of phosphorylatedeNOS is not changed, but the rate at which the overall process proceeds has been increased. The faster the phosphory-lation/dephosphorylation of eNOS occurs, the less of a “hump” or biphasic behavior is seen, as the lag between the fastprocesses (IP
3
and Ca influx) and slow processes (AKT phosphorylation) has been reduced. The reverse occurs when theAKT phosphorylation is slowed down. The three-fold decrease in the rate of phosphorylation of eNOS amplifies the pro-nounced biphasic behavior of NO concentrations vs WSS, as the lag between rapid calcium spike-driven NO production andthe slower, sustained phase of AKT-eNOS phosphorylation-driven NO production widens. Conversely, the three-fold increasein the rate of eNOS phosphorylation by AKT dampens the biphasic behavior, due to reduction in this lag.
Figure S5 demonstrates the sensitivity of the predicted concentrations [NO] and [eNOS-CaM] to changes in the forward(k+CaM) and backward (k�CaM) rates of formation of the eNOS-CaM complex (see Eq. 18). The ten-fold increase in the value ofk+CaM enhances (and accelerates) the biphasic response of NO concentrations to a step-increase in WSS, as the early spike incalcium (and thus a spike in concentration of calcium-CaM complexes) drives an even faster rate of recruitment of eNOS byCaM. The result is more activated eNOS and, thus, increased NO production. The opposite occurs when k+CaM is reduced. Aswith IP
3
, the impact on NO concentrations at larger times (> 103) is negligible.Figure S6 shows the sensitivity of the model prediction of WSS-induced NO production to the parameter ⇤ in Eq. 2. For
WSS ⌧ � 12 dynes/cm2 (including physiologically relevant levels of ⌧ ⇠ 20 dynes/cm2), while at lower values of WSS (e.g.,a basal level ⌧ = 1.8 dynes/cm2) the choice of ⇤ does affect the NO production. The value of ⇤ = 15 dynes/cm2 reportedin Table 1 is at the low end of the physiologically relevant range, and predicts an ⇡ 50% increase in NO production fromits basal level at ⌧ = 1.8 dynes/cm2. This prediction is close to experiment (66), where an increase in WSS ⌧ from 0 to 1.8dynes/cm2 results in a nearly 60% increase in NO production at steady state.
S2.2 Impact of feedback due to cGMP
According to Eqs. 10 and 11, as well as the experimental evidence (40), the capacitative calcium entry (CCE) decreases as[cGMP] increases. At large concentrations of cGMP (⇠ 1 mM), the CCE is completely inhibited and, consequently, cytosolic
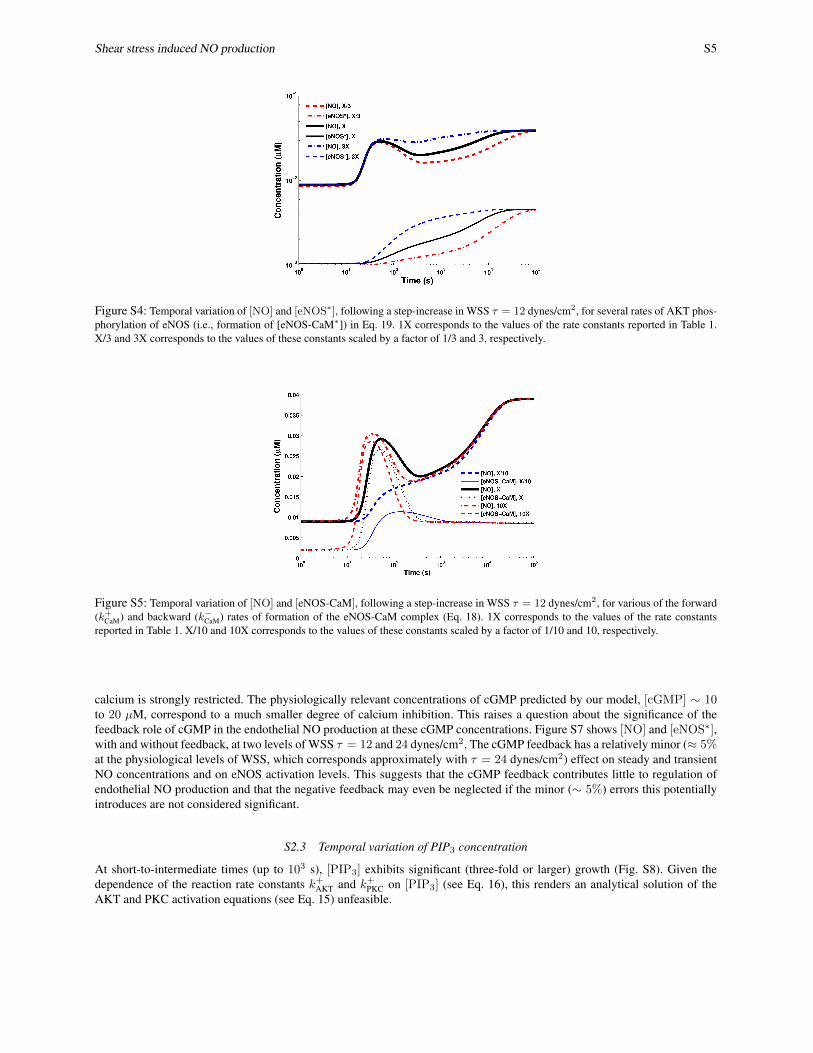
Shear stress induced NO production S5
Figure S4: Temporal variation of [NO] and [eNOS⇤], following a step-increase in WSS ⌧ = 12 dynes/cm2, for several rates of AKT phos-phorylation of eNOS (i.e., formation of [eNOS-CaM⇤]) in Eq. 19. 1X corresponds to the values of the rate constants reported in Table 1.X/3 and 3X corresponds to the values of these constants scaled by a factor of 1/3 and 3, respectively.
Figure S5: Temporal variation of [NO] and [eNOS-CaM], following a step-increase in WSS ⌧ = 12 dynes/cm2, for various of the forward(k+
CaM) and backward (k�CaM) rates of formation of the eNOS-CaM complex (Eq. 18). 1X corresponds to the values of the rate constants
reported in Table 1. X/10 and 10X corresponds to the values of these constants scaled by a factor of 1/10 and 10, respectively.
calcium is strongly restricted. The physiologically relevant concentrations of cGMP predicted by our model, [cGMP] ⇠ 10to 20 µM, correspond to a much smaller degree of calcium inhibition. This raises a question about the significance of thefeedback role of cGMP in the endothelial NO production at these cGMP concentrations. Figure S7 shows [NO] and [eNOS⇤],with and without feedback, at two levels of WSS ⌧ = 12 and 24 dynes/cm2. The cGMP feedback has a relatively minor (⇡ 5%at the physiological levels of WSS, which corresponds approximately with ⌧ = 24 dynes/cm2) effect on steady and transientNO concentrations and on eNOS activation levels. This suggests that the cGMP feedback contributes little to regulation ofendothelial NO production and that the negative feedback may even be neglected if the minor (⇠ 5%) errors this potentiallyintroduces are not considered significant.
S2.3 Temporal variation of PIP3
concentration
At short-to-intermediate times (up to 103 s), [PIP3
] exhibits significant (three-fold or larger) growth (Fig. S8). Given thedependence of the reaction rate constants k+AKT and k+PKC on [PIP
3
] (see Eq. 16), this renders an analytical solution of theAKT and PKC activation equations (see Eq. 15) unfeasible.

S6 Sriram et al.
(A) (B)
Figure S6: Temporal variation of NO production rates, normalized with its steady-state value, at several values of WSS ⌧ (in dynes/cm2),for ⇤ = 15 and 25 dynes/cm2, plotted on both log (left) and linear (right) scales.
(A) (B)
Figure S7: Temporal variation of [NO] and [eNOS⇤], with and without the cGMP feedback, at WSS ⌧ = 12 and 24 dynes/cm2.
Figure S8: Temporal variation of [PIP3] at different values of WSS ⌧ (in dynes/cm2).

Shear stress induced NO production S7
S2.4 Basal (initial) conditions
The basal (resting) condition for an endothelial cell is defined by steady-state concentrations of all the reactants at WSS⌧ = 0. The initial concentrations of reactants were thus computed by solving the steady-state version of Eqs. 1–27 with⌧ = 0. This gives (in units of µM) [IP
3
] = 0.0, [Ca2+]c = 0.10, [Ca2+]s = 2824, [PIP2
] = 10, [Ca4
CaM] = 0.00026,[eNOScav] = 0.029, [eNOS0cav] = 0.0078, [PIP
3
] = 0.116, [eNOS-CaM] = 0.0019, [eNOS⇤] = 0.001, [cGMP] = 3.8624,[NO] = 0.0089.
The basal value of [IP3
] = 0.0 µM reflects the lack of activation of the GPCR-PIP2
-IP3
cycle in the absence of mechanicalstimulus. In this steady state, the the smooth endoplasmic reticulum (ER) maintains a large reserve of stored calcium (with abasal value of [Ca2+]s). For the basal state to be viable, a small perturbation of the system from this state must dissipate in afinite amount of time; in other words, the stored calcium concentration [Ca2+]s must return to its basal value. This conditionis enforced by the presence of “leak current” kleak[Ca
2+]2s in Eq. 6, which governs the calcium balance within the EC. Severalstudies, e.g., (18, 19, 22), neglected this leak current, which is present in the original calcium balance equation (17, 20). Thisomission results in an unstable initial condition to which the system never returns, even after the removal of stimulus. Hence,we argue that the leak current for stored calcium must be present in the equations for calcium dynamics.
Our calculated initial conditions imply that a little over 90% of eNOS is initially bound to caveolin (with ⇠20% phos-phorylated at Thr-495 by PKC). This is consistent with the proportion of inactive eNOS reported in (48). Though small, thereexist detectable levels of both NO production and AKT phosphorylated eNOS at basal conditions. This finding is in agreementwith the experiments (65) that found a measurable degree of eNOS activity at basal conditions i.e., in the absence of WSS.
S3 Methods
The system of equations presented in this study was analyzed as a coupled system of ordinary differential equations (ODEs)in MATLAB. This system was solved using the ODE15s MATLAB solver, optimized to handle stiffness that stems from thepresence of a wide range of time scales. The solver’s relative tolerance was set to 10�9 or lower. The code was checked fornumerical/logical errors by verifying whether quantities supposed to be conserved (such as total amount of eNOS in all forms)were in fact conserved at all time points. The MATLAB code utilized is included as a separate supplement.
When experimental values were not explicitly stated in the text, tables, or figures of the cited articles, the data were esti-mated from the corresponding data plots. Estimation of graphically presented data was done using the Getdata Graph Digitizersoftware. These experimental data reported in Fig. 4 are reported in Tables S1–S4.
Table S1: Data from (26), where the raw data was presented in (nmol/mg protein/hr). These data are shown as squares in Fig. 4A.Shear stress Raw value Normalized value0 0.7 1.001.8 1.7 2.436 2.2 3.1412 2.7 3.8625 5.2 7.43
Table S2: Data from (55), where the raw data was presented in (pmoles/105 cells/hr). These data are shown as circles in Fig. 4A.Shear stress Raw value Normalized value0.00 732.00 1.004.00 1957.00 2.67
S4 Additional Discussion
Model limitations. Following the standard practice in modeling biochemistry of ECs (17–22), we assumed that all the reac-tions occur in a well mixed cytosolic medium, i.e., ignored the effects of spatial heterogeneity. The homogeneity assumptionis justified since the diffusion time scales of proteins within a cell’s cytosol are usually fractions of a second (75), whereaseven the rapid calcium transients considered in our model occur at the time scale of 100 s.

S8 Sriram et al.
Table S3: Data from (56), where the raw data was presented in (pmol/s). These data are shown as triangles in Fig. 4A.Shear stress Raw value Normalized value0.20 0.45 1.001.00 0.48 1.073.00 0.86 1.915.00 1.31 2.9110.00 2.44 5.42
Table S4: Experimental data from (57) used to generate Fig. 4B. We used reduced Values (subtracting “baseline” NOx
, sincethere is some non-zero NO present at zero shear, presumably due to some nitrate or nitrite already in culture media; the lowestmeasurement of NO
x
was at 2 hrs with no shear, which was defined as the baseline)Time (s) NO
x
Nox
NOx
(- baseline) Nox
(- baseline) Nox
normalized Nox
, normalizedNo shear Shear No shear Shear No shear Shear
12 dynes/cm2 12 dynes/cm2 12 dynes/cm2
6264.00 1.74 3.10 0.57 1.93 0.04 0.144212.00 1.17 2.79 0 1.62 0.00 0.116444.00 1.79 3.61 0.62 2.44 0.04 0.17
10980.00 3.05 5.29 1.88 4.12 0.13 0.2912672.00 3.52 8.85 2.35 7.68 0.17 0.5420520.00 5.70 15.31 4.53 14.14 0.32 1.00
Our model does not account for protein kinases other than AKT and PKC. While the latter are generally regarded as themost important kinases that phosphorylate eNOS, other kinases such as PKA and MAPK also interact with eNOS (4, 47). Asmore information about the extent to which PKA impacts eNOS activity becomes available, this kinases can be added to ourmodel to account for, e.g., up-regulation of eNOS due to phosphorylation at Ser-633.
Our model does not include protein phosphatases, such as PP2A and calcineurin. The model assumes a constant rate ofdephosphorylation of eNOS with respect to both AKT and PKC, since there is relatively little information about how WSSmodulates phosphatase activity. Changing levels of PP2A and calcineurin is expected to alter the rates of dephosphorylationof eNOS. The reaction cascade presented in our model can be further extended by incorporating vasoactive molecules, suchas bradykinin and insulin, to represent the activation of receptors by these signaling molecules.
Finally, our model ignores possible effects of WSS on transcription of various proteins central to the reactions involved,especially mRNA for eNOS, AKT, PKC and CaM. The modeling assumption of a constant supply of necessary substrates andproteins implies that RNA transcription and protein production respond to keep total protein concentrations approximatelyconstant. Future work will expand the system of reactions to account for activation of various transcription factors. Amongother elements, this would necessitate incorporating a model of WSS-induced cAMP production and PKA activation, followedby activation of transcription factors such as CREB, leading to calculations for the rate of production of important proteinsthat participate in the eNOS reaction cascade.
Need for experimental evidence. While we conclude that the broad conceptual framework of how eNOS is activated by WSSis largely complete, various elements of this framework are still not wholly understood. Areas where more experimental dataare needed include:
1. The extent to which inhibition of AKT and PKC impacts NO production and eNOS activation at different levels ofWSS. Dose response curves relating the extent of kinase inhibition to both eNOS activation and NO production wouldhelp to clarify the kinetics of eNOS phosphorylation.
2. The relative roles of Ca3
CaM and Ca4
CaM in the recruitment of eNOS into an eNOS-CaM complex. We assumed thatCa
4
CaM plays the primary role in recruitment of eNOS into eNOS-CaM complex, however more experimental data areneeded to clarify this issue.
3. The extent to which PI3K and FAK are activated by mechanical stimulation, in both transient and at steady-stateregimes. There is at present a paucity of data on this topic, particularly with regards to the transient behavior of PI3Kactivation.

Shear stress induced NO production S9
4. The inhibitory effect of cGMP on calcium influx. We are aware of only one study (40) that records the variation ofCCE rates over a broad range of cGMP concentrations. The data presented suggest that a negative feedback providedby cGMP is likely unimportant at normal physiological conditions in ECs. The lack of such feedback would greatlysimplify the task of modeling NO transport and coupling this model to upscaled transport models in order to simulatevascular mechanics (59).
5. The impact of varying cytosolic ATP concentrations on the rates of phosphorylation of eNOS by AKT and PKC. This isespecially a concern since WSS is known to increase endothelial ATP levels (76); however, very little data are availableon the relationship between WSS-induced ATP production and eNOS activation.
6. The role and kinetics of various protein phosphatases in the dephosphorylation of eNOS. Very little information isavailable about the extent to which WSS impacts activity of phosphatases, especially PP2A and calcineurin.