shear measurement of board crushing effects · 2019-12-20 · 1 shear measurement of board crushing...
TRANSCRIPT
1
Shear measurement of board crushing effects
Roman E. Popil
Georgia Institute of Technology
Institute of Paper Science and Technology
500 10th
St. NW.,
Atlanta, GA 30332
Abstract
Corrugated board in production endures varying degrees of crushing from stacking, transfer, die
cutting, printing, and other corrugating and converting operations. Thus production corrugated
board has a measurable loss of shear stiffness from converting operations which reduces its
potential buckling load resulting in loss of box performance and lifetime. Yet the level of the
impact of crush on board properties and ultimately box performance cannot be accurately
detected by the usual measurement of caliper loss which is disproportionately small compared to
the loss of shear stiffness. Instead, measurements of flat crush hardness or transverse shear
stiffness have been shown to be greatly affected by board crushing. A newly available and
convenient non-destructive method using sonically induced shear (Board Quality Measurement or
BQM) is compared to a known torsion pendulum technique for validation. The results indicate
that the effect of board crushing can be sensitively detected using these methods. Shear
measurement can provide clear information regarding the effects of converting operations on
board mechanical quality and provide an opportunity to minimize the impact of these operations
Background:
Transverse shear stiffness is the resistance to relative sliding motion of the inner and
outside linerboard facings. When a box is loaded vertically, the side panels of the box
bulge outwardly in response to the load causing a relative motion of the inside and
outside liners principally in the MD or perpendicularly to the flutes. The amount of panel
bulging is governed in part the MD transverse shear stiffness. A greater amount of panel
bulging for a given load increases the stress concentrations at the corners of a loaded box
such that failure will occur sooner in time at a lighter load. Shear stiffness is governed by
the strength properties of the medium which is determined partly by material properties
and partly by geometry. The material properties of influence are basis weight, fiber
strength and fiber bonding. Geometry properties of influence here are flute shape, flute
size. Should any measurable amount of board crushing occur, the caliper is usually
observed to recover however, the flutings will suffer the formation of a kink at their
flanks. These kinks compromise the rigidity of the corrugated medium structure to
transverse shear.
Application of transverse shear measurement
Converting operations apply various out of plane loads to the boards in scoring, folding,
printing, all of which crush the corrugated board to some degree. To maximize the
strength potential of corrugated board it is useful to monitor the impact of the converting
operations which is realized through the measurement of transverse shear rigidity.
2
The simplest method to measure this property is through an adaptation of the tensile
strength test where opposite faces of the corrugated board are pulled in opposite direction
[1]. However, an out-of plane displacement complicates this measurement. Other
researchers have realized the component of transverse shear in three point bending
measurements or have adopted a torsion pendulum measurement to infer the transverse
shear rigidity from measurements of the twisting stiffness [2, 3]. All of these mechanical
measurements require the preparation and mounting of samples in destructive tests and
are thereby inconvenient to implement in a production environment.
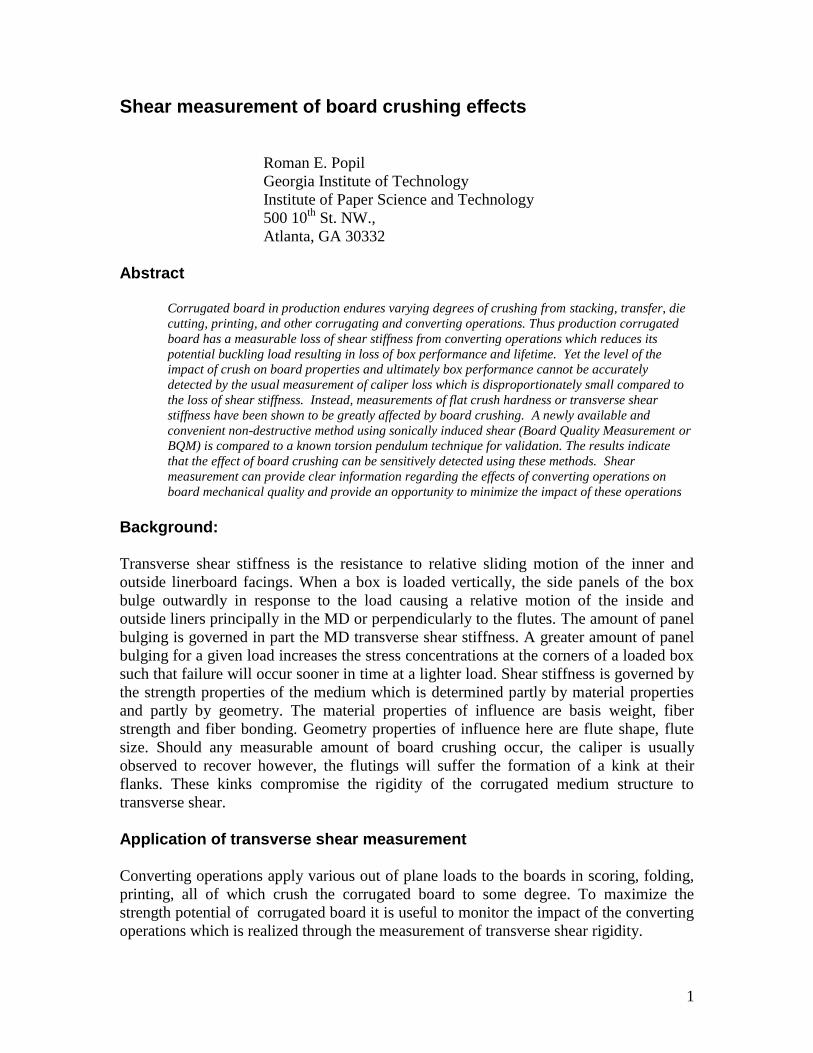
XQ Innovations [4] have recently devised a sonic based method which requires only that
the sample under test be placed between supports. The brick sized device placed on the
supported sample vibrates along its length through a range of sonic low frequencies. A
transducer on the underside of the BQM is in contact with the board and detects the
amplitude and frequency of the detected board vibration. The amplitude and frequency of
the MD induced board vibration is then computed to an equivalent transverse shear
stiffness.
Figure 1. Improvised foam sample support and BQM used in the measurements.
Boards are placed with flutes perpendicular to the length of the BQM, the BQM is
placed on top of the samples suspended by the foam blocks. Test boards are
vibrated along their MD by the BQM, the frequency and amplitude of the test
board’s sympathetic vibration is converted to a shear stiffness numeric output.
Description of the experiments
IPST has developed a torsion pendulum method [5] for determining the transverse shear
rigidity of board specimens. The system is calibrated using a steel bar which is subjected
to known torques using a system of weights and a pulley to twist the steel beam to
various angular deflections. Computerized analysis of the detected oscillating twisting
frequency of 2.5 x 12” test specimens is converted to a torsional stiffness. Coupled with
measurements of the 4 point bending stiffness of corrugated board the transverse shear
rigidity of boards is determined. More details of the technique are available in the May
2007 Appita paper physics conference.

3
Figure 2. IPST torsion pendulum with specimen mounted between clamping jaws.
A series of boards were prepared using facilities at IPST using the pilot corrugator and
manually double-backing as described if reference [6]. One set consisted of a series of
lab made A flute corrugated boards where the medium basis weight was varied from 14#
to 42#.
Table 1. List of relevant properties of the A flute set. Linerboards are all 42#,
medium basis weight varied from 14# to 42#.
sample
ECT
(lbf/in)
MD - 4 pt
Bending
(Nm)
CD - 4 pt
Bending
(Nm)
Torsion
constant
N/m
Average
BCT lbs
Shear
stiffness
R55
(metric)
BQM
stiffness
kN/m
14A 20.6 18.5 9.2 0.89 614.7 2866 1.2
16A 30.1 20.8 9.4 1.34 679.2 4672 1.7
18A 723D 26.5 19.3 8.7 0.96 670.1 3120 1.4
18A 726E 38.3 17.2 8.8 1.18 720.1 4115 1.5
20A 52.4 17.7 11.3 1.46 931.0 5186 1.9
26A 50.4 19.5 12.2 1.81 1013.8 6742 2.8
33A 61.7 19.8 13.1 2.18 1022.6 8569 3.7
42A 53.6 19.4 9.9 1.24 933.3 4237 2.9
Another set of boards used for transverse shear analysis were made by crushing the
commercially made or IPST made boards through a rolling nip set at various fraction of
the nominal caliper ranging from 90 to 60%. Boards were sent through twice the
rubber/chrome roll nip, with the second pass having the board flipped over and rotated
180 degrees from its original direction through the nip.

4
Figure 3. Corrugated board blank being sent through a double backing glue
applicator nip to crush the board to a preset fraction of the original caliper.
Table 2 . Relevant properties of the crushed board set for comparative transverse
shear measurements.
caliper Torsion Pend. ECT Flat Crush BQM shear
mm (N/m) lb/in MD CD N kN/m R55
C-flute
Control 4.15 1.90 41.0 15.5 6.45 15.34 3.65 9219
90% 4.11 1.78 42.1 14.9 6.34 14.55 2.9 8369
80% 4.04 1.28 38.4 14.4 6.08 6.90 2.05 5110
70% 3.93 0.98 38.8 13.4 6.01 5.29 1.5 3545
60% 3.65 0.56 32.3 10.7 5.17 4.25 1.05 1837
Waxed C
Control 4.28 1.84 49.5 16.5 8.97 15.71 3.5 7676
90% 4.09 1.64 52.0 16.2 8.79 11.05 2.95 6545
80% 4.09 0.95 50.9 14.6 8.12 3.87 1.8 3231
70% 4.02 0.84 46.1 13.5 7.82 2.33 1.4 2787
60% 3.83 0.57 48.3 11.4 7.25 0.09 1.15 1814
A-Flute
Control 5.13 2.06 49.9 23.7 13.96 18.14 4.05 7565
90% 5.12 1.88 47.5 23.7 13.21 12.53 3.45 6736
80% 4.98 1.13 44.6 20.5 12.88 6.00 1.9 3658
70% 4.92 0.89 47.0 19.6 12.43 4.96 1.85 2784
60% 4.86 0.79 44.1 17.9 12.11 3.01 1.4 2437
B-Flute
Control 3.02 1.50 52.9 8.0 4.29 40.06 5.5 10079
90% 2.99 1.44 50.7 7.5 4.29 27.69 4.65 9530
80% 2.95 1.25 49.4 7.5 4.14 20.99 4.1 7113
70% 2.85 0.89 45.8 6.9 3.82 11.95 2.7 4045
60% 2.73 0.63 46.7 6.1 3.48 6.72 2 2525
Flexural Stiffness (N-m)Sample

5
Figure 4. Magnified cross section of C flute boards: bottom board uncrushed,
Middle: sent through nip gap set at 70% of original caliper, top board: board sent
through nip set at 60% or original caliper. Note that despite the large amount of
crushing, the permanent caliper reduction is 10% or less in these extreme
circumstances.
Results The first comparison was made using the A flute series of laboratory made boards were
the basis weight of the medium ranged from 14 to 42 lb/msf. Comparison of the
transverse shear rigidity obtained from the torsion pendulum and the results of transverse
shear stiffness from the BQM are shown in Figure 5. The BQM is not calibrated to read
A-flute so readings were taken using its C flute setting. The one outlying point is the A -
flute board using 42# linerboard as the medium. In this case, the flutes were observed to
be fractured since the corrugating labyrinth is set to accept small range of fluting calipers.
Damaged flutes will lead to an anomalously low shear resistance measurement. In Figure
6, if we remove the fractured flute specimen the correlation between instruments and
methods become unambiguous. Thus we have an indication from this data that medium
quality or damage can be detected through transverse shear measurement.

6
R55 vs BQM for A flute series
R55(N-m) = 1794.7(BQM) + 1113.4
R2 = 0.7296
2000
3000
4000
5000
6000
7000
8000
9000
10000
1 1.5 2 2.5 3 3.5 4 4.5
BQM stiffness (kN/m)
Tra
ns
ve
rse
sh
ea
r R
55
N-m
Series1
Linear (Series1)
Figure 5. Torsion pendulum determined transverse shear rigidity versus the BQM
measurements of stiffness. The BQM was set on its "C" flute setting. The one
outlying point is 42A which is a fractured flute caused by the corrugator gap not
accommodating this thickness of medium.

7
R55 vs BQM for A flute series
R55(N-m) = 2186.8x + 628.41
R2 = 0.9659
2000
3000
4000
5000
6000
7000
8000
9000
10000
1 1.5 2 2.5 3 3.5 4 4.5
BQM stiffness (kN/m)
Tra
ns
ve
rse
sh
ea
r R
55
N-m
Series1
Linear (Series1)
Figure 6. Same as Figure 4 but with the 42A outlier point removed.
Crushed boards
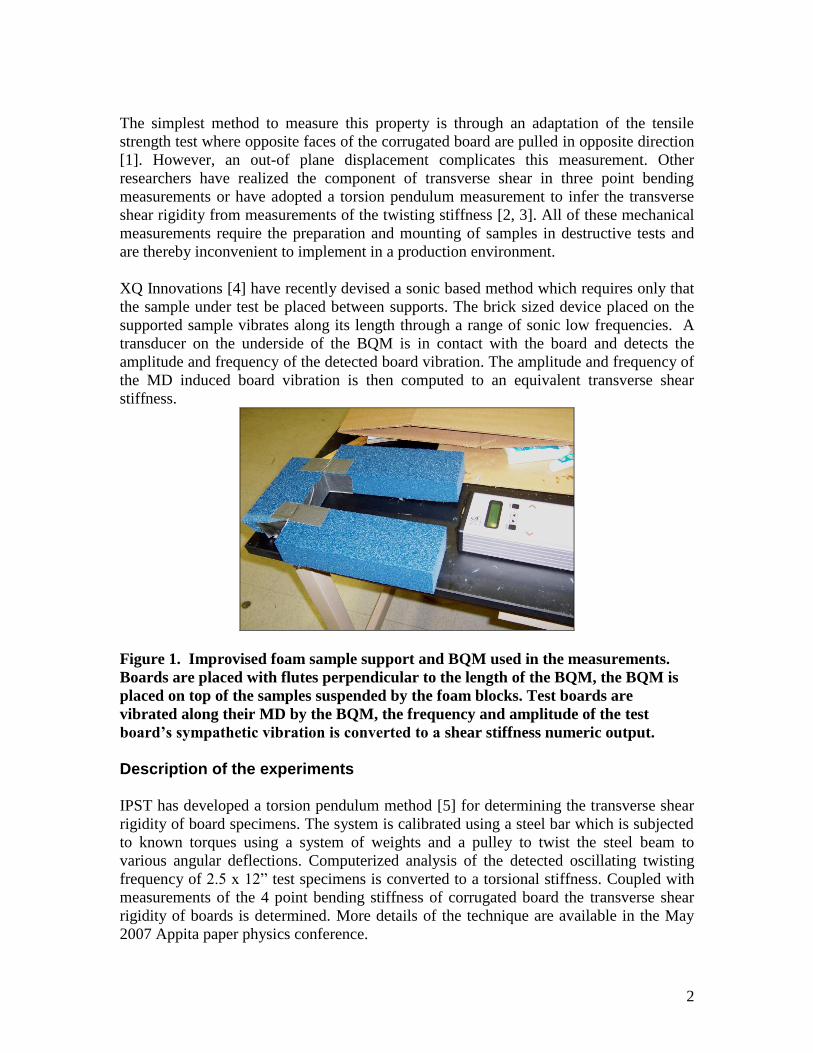
Crisp et al described how changes in the load displacement curve for flat crush occur
once a board is crushed. They dubbed the first load peak in the curve as the medium
“hardness” and noted that it was the most sensitive measured property that responded to
board crushing. Other investigators found that many physical properties are insensitive
to board crushing. Recently the studies by Batelka [7] and Kroeschell [8] show that board
caliper recovers within minutes of crushing to 90% or more of its original caliper.
However, there is a loss of performance properties (vertical stacking strength and
lifetime) when crushed board is converted into a box which goes largely undetected
through routine caliper measurements in box plants.
Flat crush test instruments are usually set to set to record maximum peak load value and
thus do not detect the drop in the first peak in the load displacement curve. Recording the
hardness through a recording compression tester is possible but tedious. Shown in
Figures 7 and 8 below are load displacement curves of uncrushed A flute board and A
flute board crushed to 70% of its original caliper. Figure 8 graphically shows the
dramatic decrease in the first peak of the load displacement curve. The alternative to

8
measure the effects of crushing on board by measurement of transverse shear is suggested
as a means to conveniently monitor and control crushing effects on board.
Results of the hardness versus permanent caliper reduction are shown for a variety of
laboratory crushed boards in Figure 9. The permanent loss in caliper for all cases is less
than 10% of the original caliper however the corresponding change in the hardness values
in some cases as much as 800%! The caveat is however, that the selection of the hardness
value if based on load alone involves a subjective evaluation of the load displacement
curve and is therefore subject to operator variability. A combination of the curve
inspection alongside with a comparison of the displacement value where the first peak
was known to occur as found to be the best method to reduce error. However, the care
that must be taken to ensure the starting point of the compression cycle for each series of
specimens is appropriate to minimize offset is another barrier for making this a routine
quality test measurement.
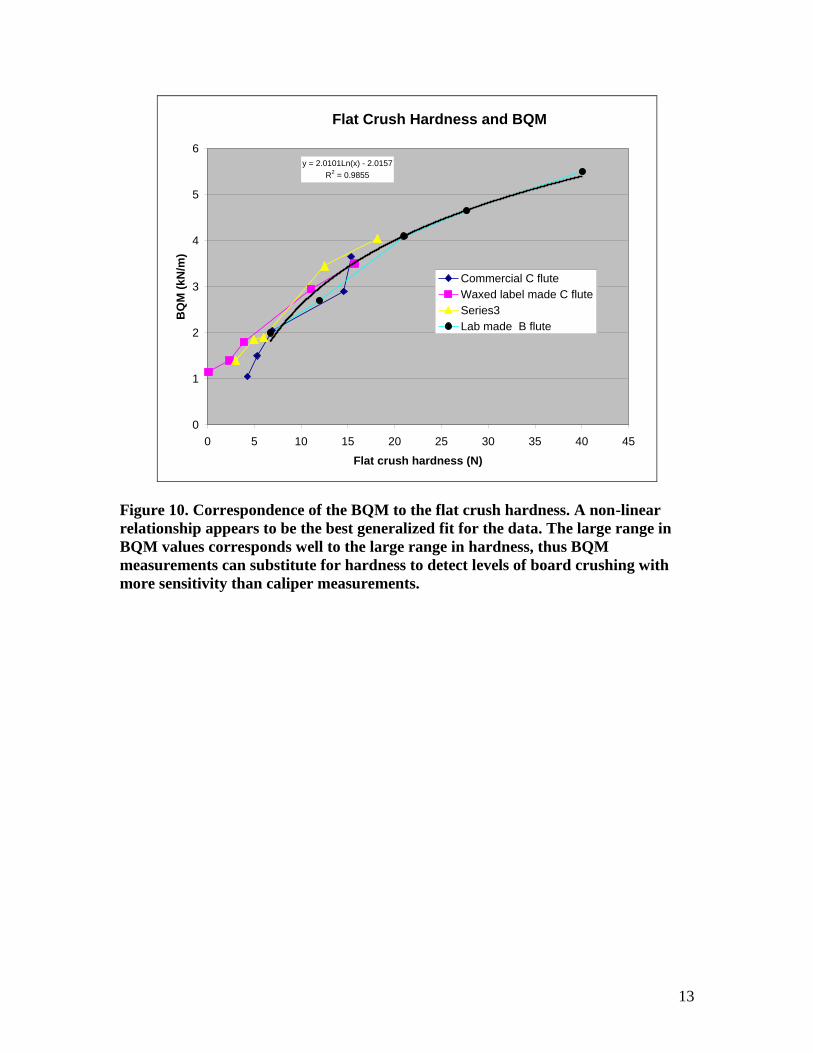
Measurements of transverse shear stiffness or rigidity offer a similar sensitivity to board
crush level with a much higher level of convenience and ease of use. Shown in Figure 9
are the results using the BQM device on the series of crushed boards which indicates a
good range and correspondence with flat crush hardness. Thus a measurement of the
transverse shear of the medium with the BQM is much more convenient and is
comparably sensitive as flat crush hardness to detect and damage to the medium from
crushing.
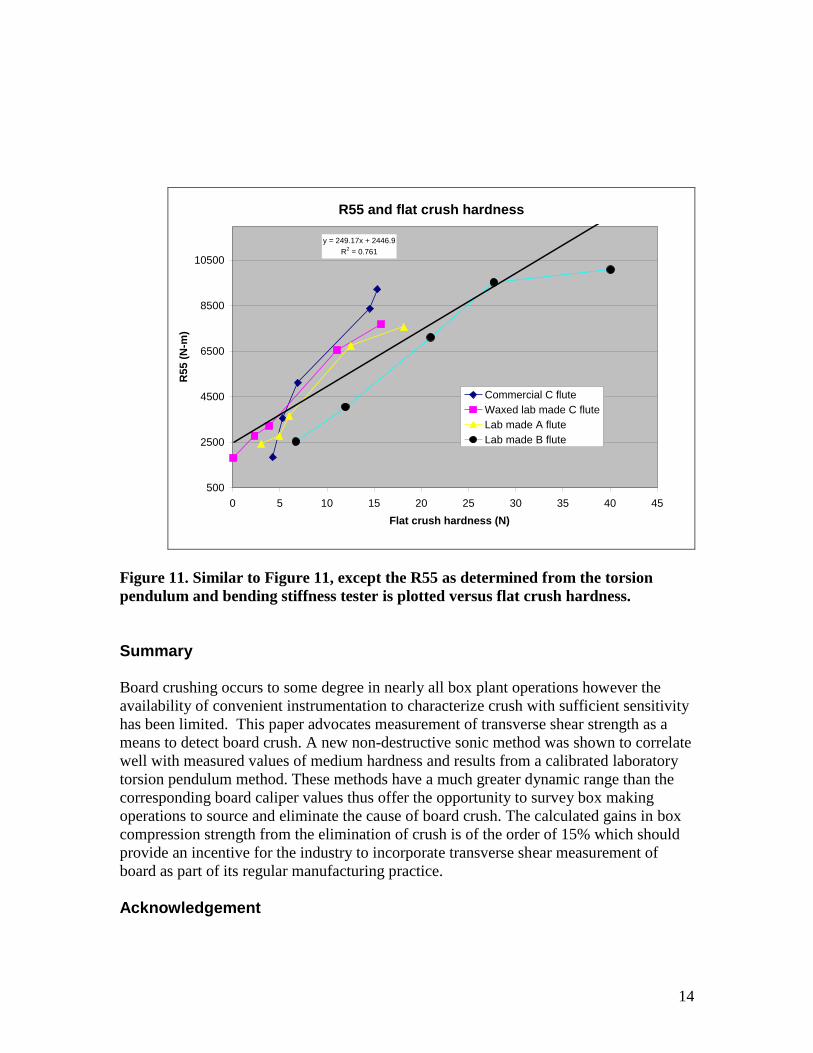
Comparison of the same crushed board hardness results with the torsion pendulum are
indicated in Figure 11. Here, the transverse shear rigidity R55 is the shear stiffness
multiplied by the board thickness. Moreover, the measurement here is influenced by the
twisting stiffness of the board which is governed by the tensile stiffness of the
linerboards. Hence, in Figure 11 we see a larger separation between the points of
different types of board. However, the ranges of transverse shear rigidities are similar to
those for shear stiffness as measured by the BQM which confirms the measurements of
transverse shear strength to be a sensitive measure of board crush.
Effect of transverse shear strength of board
The question arises that if crush were to be eliminated in a box plant what would be the
potential increase in box performance. Chalmers [9] recently has shown preliminary
evidence of the influence of reduced transverse shear on box lifetime. The effects of
crushing on BCT are expected to be smaller than that on lifetime which can be gleaned
from the following considerations.
Recall that the McKee equation [10] for the BCT of the board takes the form:
5.025.0
2211
75.0 WDDECTBCT
with ECT being the edge compression strength, 2211DD is the geometric mean of the
flexural rigidity of the corrugated board commonly approximated by a 4 point bending
stiffness measurement and W is the perimeter of the box. Since for a sandwich panel the

9
flexural rigidity is proportional to the caliper of the board squared, the McKee equation is
further approximated by this substitution resulting in the more familiar form of the
McKee equation which is proportional to the square root of the board caliper.
However, it should be noted that the flexural rigidity term arises for the derived analytical
expression for the buckling of a vertically loaded orthotropic plate and as approximated,
is neglecting the effect of transverse shear rigidity. Estimates for the decrease in panel
critical buckling load can be made from several available analytical and numerical
models [11, 1, and 6]. A typical calculation is shown in reference [6] where for the case
of 70% caliper crush reductions in ECT are 10% and reductions in bending stiffness are
20% so that the predicted loss in BCT is 12%. But with the inclusion of the loss of
transverse shear at this level of crushing, the panel critical buckling load is actually
reduced by 32% leading to a predicted BCT loss of 16%. Therefore the neglect of
transverse shear will lead to an overestimate in BCT by a few percent by this calculation.
Ultimately, if crush were to be eliminated a gain in BCT of 15% can be expected.
Measurement of transverse shear strength is a sensitive method to determine what stages
in operations cause the crush.
10
Load displacement for A flute
0
20
40
60
80
100
120
140
160
0 0.02 0.04 0.06 0.08 0.1 0.12 0.14
Displacement (inches)
Lo
ad
(lb
s)
78
84.5
88.1
95.5
95.5
Figure 7. Flat crush load displacement curves for 2 x 2” Uncrushed A flute
specimens.

11
Load displacement curves for crushed A flute boards
0
5
10
15
20
25
30
35
40
45
50
0 0.02 0.04 0.06 0.08 0.1 0.12 0.14
Displacement (inches)
Lo
ad
(lb
s)
16.6
17
18.7
18
18.
4
Figure 8. Load displacement curves for A flute boards crushed though nip passage
gap set at 70% of the original caliper.

12
Flat crush hardness and % change in caliper
0
5
10
15
20
25
30
35
40
45
0 2 4 6 8 10 12 14
% change in caliper by crushing
Fla
t cru
sh
hard
ness
(N
)
Commercial C flute
Waxed lab made C flute
Lab made A flute
Lab made B flute
Figure 9. Hardness is the value of the first peak in the load displacement curve in
the flat crush test. Although the % change in caliper is about 10% or less, the
change in hardness is a factor of 4 to 6 times. The hardness was measured through
examination of the load displacement curves using an Instron universal tester and a
compression load cell. Thus a measure of hardness is a sensitive detector of board
crushing.
13
Flat Crush Hardness and BQM
y = 2.0101Ln(x) - 2.0157
R2 = 0.9855
0
1
2
3
4
5
6
0 5 10 15 20 25 30 35 40 45
Flat crush hardness (N)
BQ
M (
kN
/m)
Commercial C flute
Waxed label made C flute
Series3
Lab made B flute
Figure 10. Correspondence of the BQM to the flat crush hardness. A non-linear
relationship appears to be the best generalized fit for the data. The large range in
BQM values corresponds well to the large range in hardness, thus BQM
measurements can substitute for hardness to detect levels of board crushing with
more sensitivity than caliper measurements.
14
R55 and flat crush hardness
y = 249.17x + 2446.9
R2 = 0.761
500
2500
4500
6500
8500
10500
0 5 10 15 20 25 30 35 40 45
Flat crush hardness (N)
R5
5 (
N-m
)
Commercial C flute
Waxed lab made C flute
Lab made A flute
Lab made B flute
Figure 11. Similar to Figure 11, except the R55 as determined from the torsion
pendulum and bending stiffness tester is plotted versus flat crush hardness.
Summary
Board crushing occurs to some degree in nearly all box plant operations however the
availability of convenient instrumentation to characterize crush with sufficient sensitivity
has been limited. This paper advocates measurement of transverse shear strength as a
means to detect board crush. A new non-destructive sonic method was shown to correlate
well with measured values of medium hardness and results from a calibrated laboratory
torsion pendulum method. These methods have a much greater dynamic range than the
corresponding board caliper values thus offer the opportunity to survey box making
operations to source and eliminate the cause of board crush. The calculated gains in box
compression strength from the elimination of crush is of the order of 15% which should
provide an incentive for the industry to incorporate transverse shear measurement of
board as part of its regular manufacturing practice.
Acknowledgement
15
Much of the work was performed in the IPST Pilot Plant facilities under the supervision
of Michael Schaepe with the technical assistance of Robert Hall. Funding for this
endeavor comes from the IPST Supporting Industrial Member Companies.
References
1. Nordstrand, T., Carlsson, L., “Evaluation of transverse shear stiffness of structural
core sandwich plates”, Composite Structures vol 37, pg 145 (1997).
2. McKinlay, P.R., Shear Stiffness tester, US Patent 4,958,522.
Analysis of the strain field in a twisted sandwich panel with application to
determining the shear stiffness of corrugated board. Proceedings of the 10th
Fundamental research symposium of the Oxford and Cambridge series, Oxford,
575 (1993).
3. Chalmers, I.R. “A new method for determining the shear stiffness of corrugated
board”, Appita Journal, vol 59, no.5, pg 357 (2006).
4. XQ Innovations, “BQM” Box Quality Monitor, 10A The Highway, Mt. Waverly,
Victoria, Australia.
5. Popil, R.E.,Coffin, D.W., Habeger, C.C., “ Transverse shear measurement for
corrugated board and its significance” 61st Appita Annual Conference and
Exhibition, Proceedings vol 2 International Paper Physics Conference Papers,
Gold Coast Australia 6 -10 May 2007.
6. Popil, R.E., Schaepe, M. “Comparative evaluationof the potential for wax-
alternative packaging coatings”, Tappi Journal, vol 4, no. 8 25-32 (2005).
7. Batelka, J.J. “The effect of boxplant operations on corrugated board edge crush
test” Tappi Journal, vol 77, no 4:193 (1994)
8. Kroeschell, W.O. “Edge Crush Test” Tappi Journal, vol 75, no. 1., 79-82 (1992).
9. Chalmers, I.R., “The use of MD shear stiffness by the torsional stiffness technique
to predict corrugated board properties and box performance” 61st Appita Annual
Conference and Exhibition, Proceedings vol. 1 Appita Conference Papers, Gold
Coast Australia 6 -10 May 2007.
10. McKee, R.C., Gander,J.W.,Wachuta, J.R., “Edgewise compression strength of
corrugated board”, Paperboard Packaging vol 48, no. 8, pg 149 (1963).