shedding some light on medical diagnosis david...
TRANSCRIPT

Shedding some light on medical diagnosisDavid DelpyEngineeringand Physical Sciences Research Counci l, UK
WednesdaY,4 May- 9:45 a.m.
Optical diagnosis isone oftheoldesttechniques in medicine, andeven today isstill theway inwhichadoctor (consciously orunconsciously) obtains hisfirstinformationabouta patient(Le. whatisthepatient's colour,whatistheskin texture like? - all oftheseare optica l measures) . Over the lasthalfcentury, scientists andengineers have developed ever more sophisticated instruments in order toquantifythisrather subjective optical measurement made bytheclinician,andit is now possible, justbyusinglightto monitor anenormous (andgrowing)range ofparameters. Amajoradvantage of lightinthese applications isthat it issafe, andcan often beapplied at thebedside ina non-invasive manner,using simple and lightweight optical fibres. Thetalkwill illustratethewide range ofoptical monitoringtechniques thatare now becoming ava ilable, showinghow thisblossoming of new techniques hasoften resulted from thecoming togetherofnew developments inareas asdifferent asgenetics, missileguidance andoptical telecommunications.

Shedding some light on medical diagnosis
D.T. Delpy
Engineering & Physical Sciences Research Council, UK

0. 001nm 0.1nm 1nm 100nm 1000nm 10000nm
|||||||||||||||||||||||||||||||||||||||||||||||||||||||||||||||||||||||||||||||||||X-rays Ultraviolet Visible Infrared
The Electromagnetic spectrum

True Colour Image Visible/Near InfraRed (NIR) ratio
Looking at the body surface: Imaging of a mole with a hyperspectral camera

Looking inside the body : the endoscope and the endoscopy “pill”

Images obtained when passing through the bowel (Given
Imaging System)

The electrically driven
endoscopy pill

Looking inside the body from the outside: the transparency of tissue
fetus hydrocephalus‘ If a candle was held behind his head, or the sun happened to be behind
it, the cranium appeared semi-transparent and this was more or less evident until he attained his fourteenth year’
Richard Bright, Guy’s Hospital, on a patient with hydrocephalus, 1831.

Georges de La Tour 1593-1652 Christ with St. Joseph in the Carpenter's Shop c. 1640
Early Optical imaging?
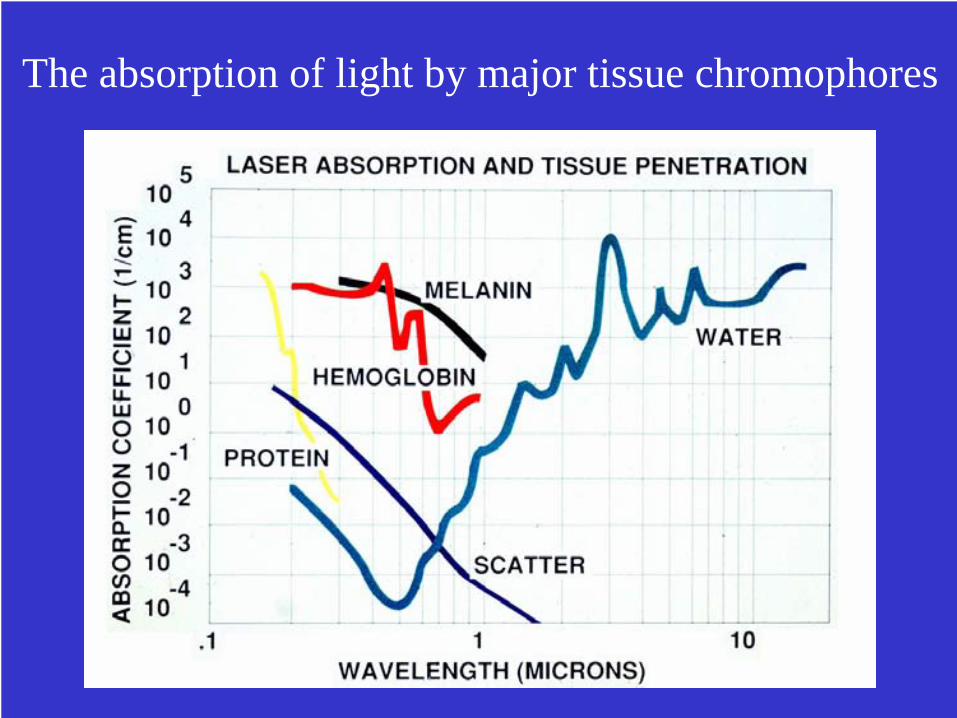
The absorption of light by major tissue chromophores
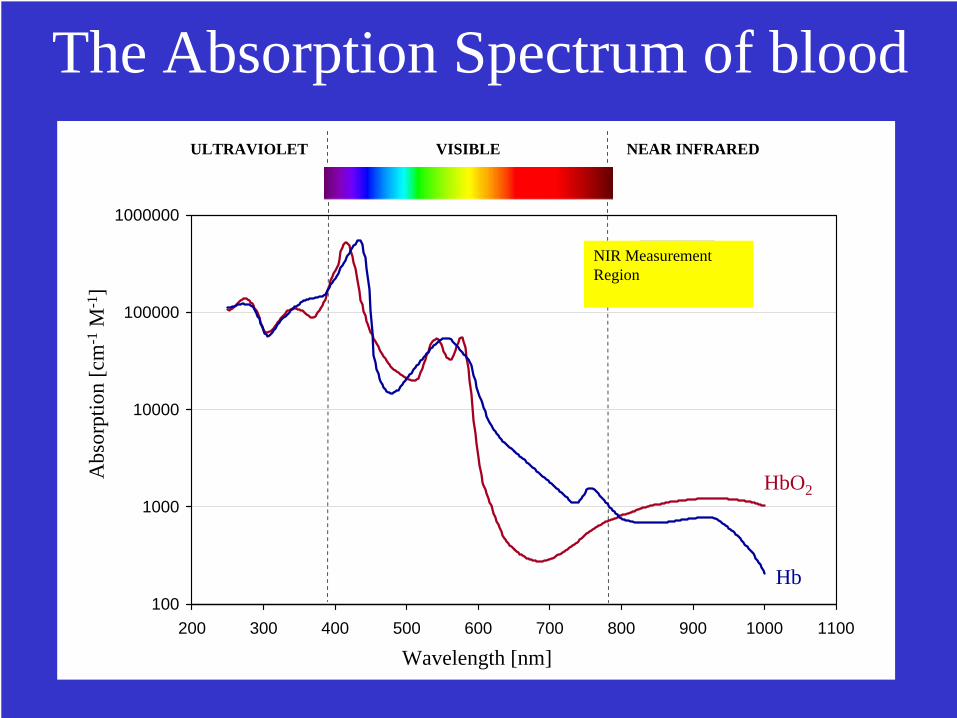
The Absorption Spectrum of blood
Wavelength [nm]
Abs
orpt
ion
[cm
-1M
-1]
100
1000
10000
100000
1000000
200 300 400 500 600 700 800 900 1000 1100
Hb02Hb
VISIBLE NEAR INFRAREDULTRAVIOLET
Hb
HbO2
NIR MeasurementRegion

The effect of wavelength on the distance light will penetrate into the skin

Multispectral imaging: 700 - 900 nm range
700nm 800nm 900nm

Blood vessel visualisation with the “Veinviewer”
Luminetx Inc, USA

Monitoring the movement of red blood cells in the surface vessels: the principles of laser
Doppler blood flow detection
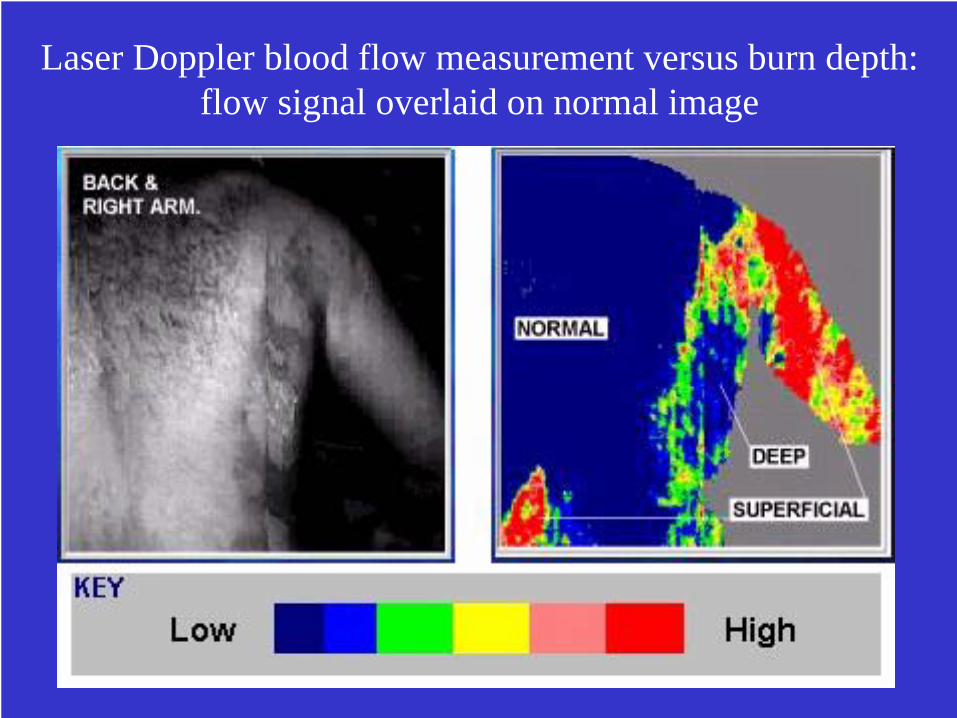
Laser Doppler blood flow measurement versus burn depth: flow signal overlaid on normal image

Laser Doppler blood flow image of the lower legs in a subject with claudication (i.e. blockage
of a supplying artery)
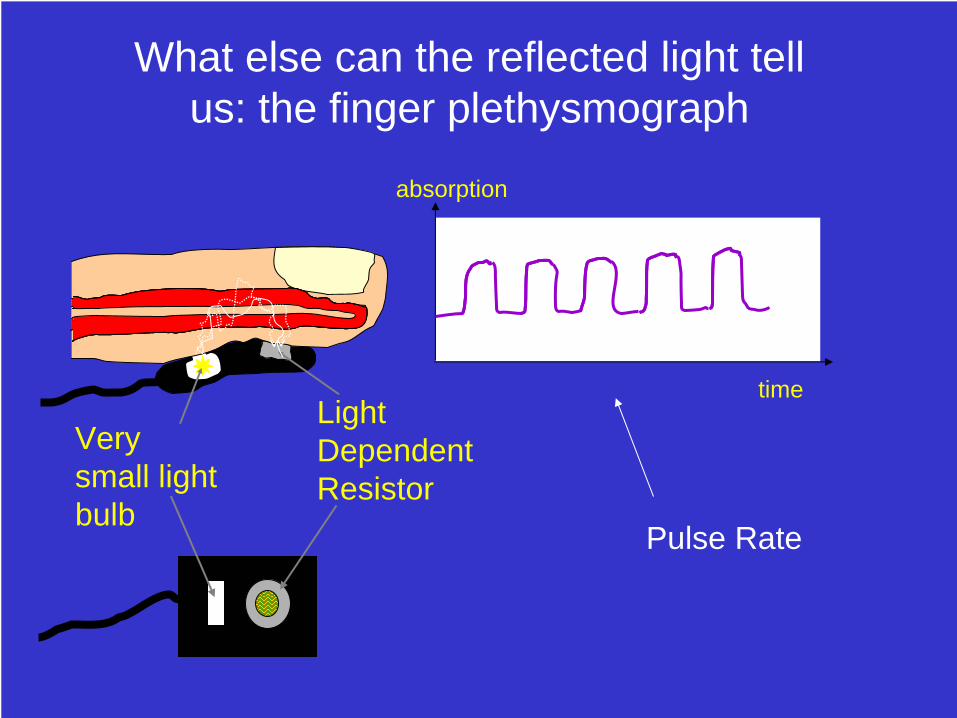
Very small light bulb
Light Dependent Resistor
absorption
time
What else can the reflected light tell us: the finger plethysmograph
Pulse Rate

Blood oxygenation monitoring – the Pulse Oximeterabsorption
time
2 LED’s:
red + blue
Photodiode
Red light
Blue Light
Measuring the amount of light absorbed by each colour, will tell
us the colour of the arterial blood and therefore, the amount of oxygen it contains. – usually expressed as a “% Saturation”

Modern Pulse Oximeters

Looking deeper into tissue: Near Infrared Spectroscopy (NIRS) - Note: Any tissue can be studied. e.g. muscle, brain, the breast
LaserDiodes
LightDetector
Computer
HbO2
Hb
Time
Note: we need to know how far the light has travelled – see later!!

Light levels in Near Infrared Spectroscopy

Original NIRS
system: Baby Tilt Study
(1984)
Third generation Near Infrared Spectrometer

Long term Cerebral NIR Oscillations
Time (minutes)20 40 60 80 100 120 140 160
Δ co
nc (μ
mol
ar.c
m)
0
50
100
150
200
250
HbO2
Hbvol Hb
T im e (secon ds )0 1 0 2 0 3 0 4 0 5 0 6 0
H
bO2
( m
olar
.cm
)
-4 0
-3 0
-2 0
-1 0
0
1 0
2 0
3 0
4 0
5 0
6 0
7 0
Arb
. Uni
ts
1
2
3
4
N a sa l A irflo w
H b O 2
P u lse W a ve fo rm
Cerebral NIR Respiratory and Cardiac Oscillations
What does NIRS show? What are its advantages?

Near Infrared muscle exercise studies
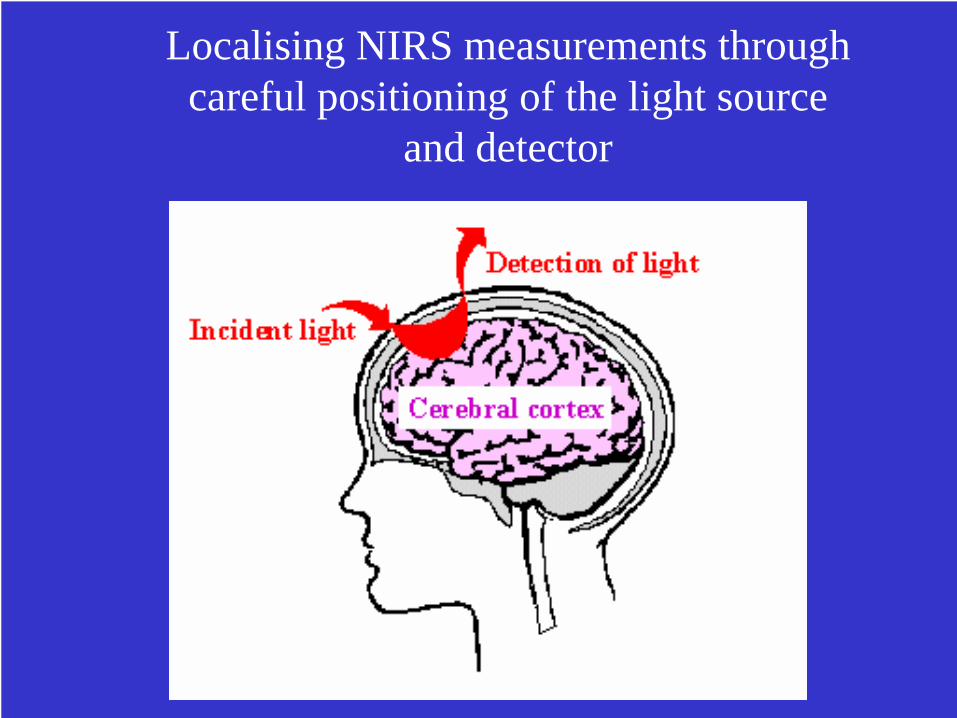
Localising NIRS measurements through careful positioning of the light source
and detector

Ordinary MR image of the brainfMRI images of the brain showing activation changes during 40 minutes of motor learning (red areas show where Hb has changed as a
result of the motor learning task)
An aside: Watching the brain think with functional Magnetic Resonance Imaging (fMRI)
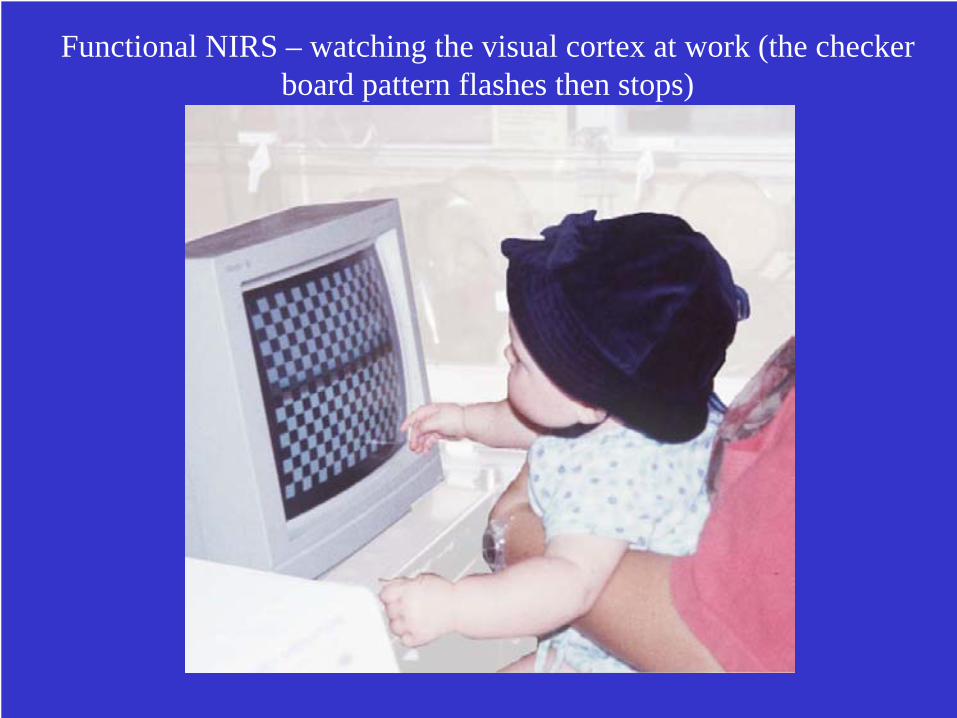
Functional NIRS – watching the visual cortex at work (the checker board pattern flashes then stops)
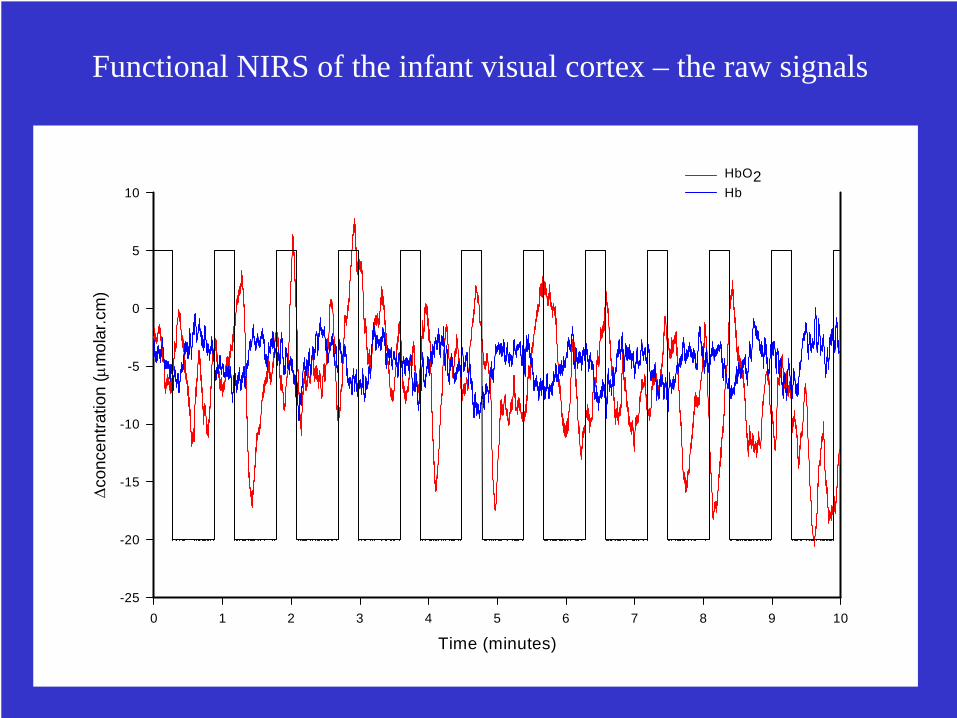
Time (minutes)0 1 2 3 4 5 6 7 8 9 10
Δ con
cent
ratio
n (μ
mol
ar.c
m)
-25
-20
-15
-10
-5
0
5
10HbO2Hb
Functional NIRS of the infant visual cortex – the raw signals

T im e (s e c o n d s )
-1 0 0 1 0 2 0 3 0 4 0 5 0
co
ncen
tratio
n (
mol
ar.c
m)
- 4
-2
0
2
4
6
8
H b O 2H b v o lH b
Functional NIRS of the infant visual cortex – the averaged signal

Mapping the activity on the whole surface of the brain:
The principles of NIRS Topographic Brain Imaging
UCL System
Hitachi Medical System

The patient interface

Cortical pain responses to a heel prick in infants (blood volume signal)
Slater et al (2006)
Optical Topography signals in the infant

Cortical pain responses to a heel prick in infants (2):Right heel
Optical Topography signals in the infant
Blood volume signal
QuickTime™ and aYUV420 codec decompressor
are needed to see this picture.

Time resolved measurements to separate the effects of absorption from scatter
t
tt
t
The (temporal) Impulse Response Function of tissue to a pulse of laser light can be used to distinguish between the effects of scatter and absorption.
It also allows us to know the optical pathlength from the mean time of flight
Finally it allows us a better estimate on where the light has travelled and hence permit tomographic (i.e. full 3D) imaging
~ ns
~ ps

Pulsed Laser
Time of flight
No.
of p
h ot o
n s
Time Resolved Measurement Principles
Clock
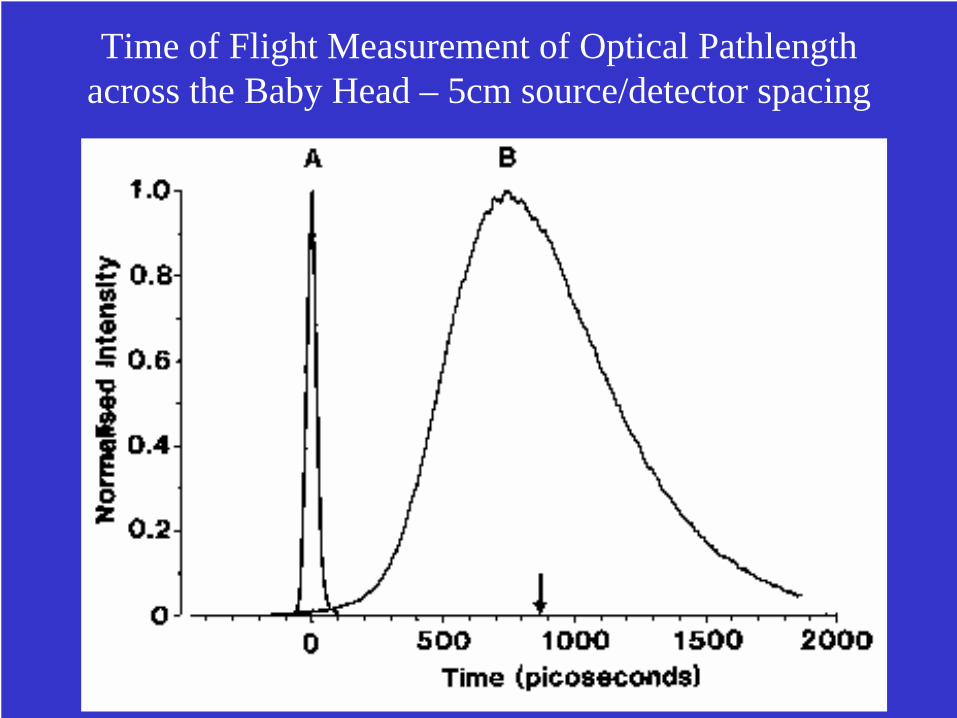
Time of Flight Measurement of Optical Pathlength across the Baby Head – 5cm source/detector spacing

Input pulseDetected TPSF
Sourcefibres
Detectorfibres
The principles of time resolved measurements for optical tomography
NB. All measurements are made at two different wavelengths

The MONSTIR imaging systemBACK SIDE FRONT
Multi-channel Opto-electronic Near-infrared System for Time-resolved Image Reconstruction
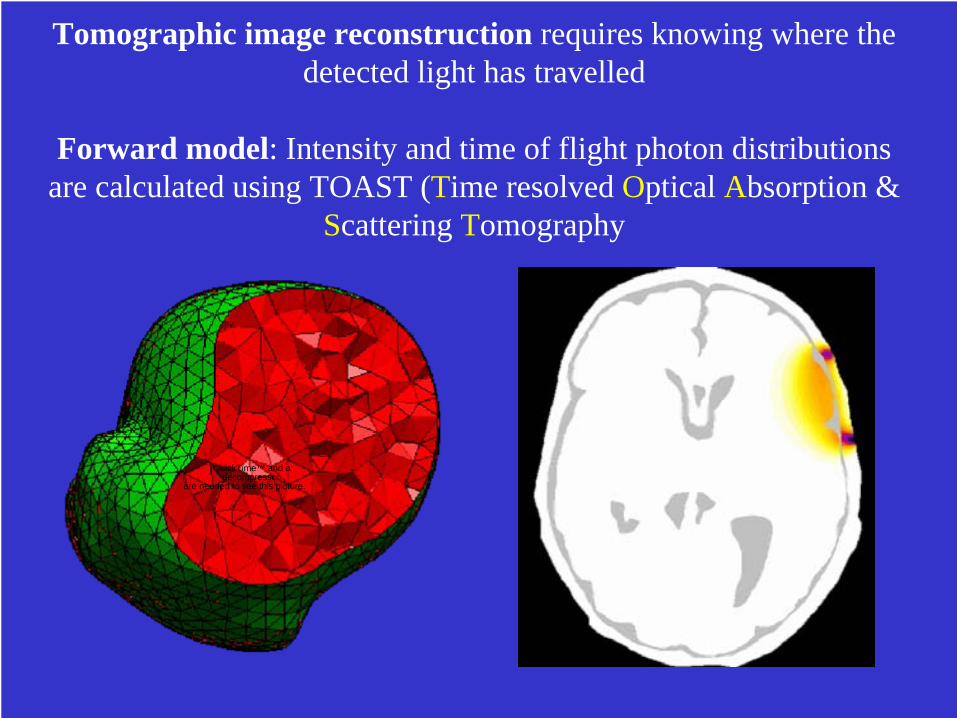
Tomographic image reconstruction requires knowing where the detected light has travelled
Forward model: Intensity and time of flight photon distributions are calculated using TOAST (Time resolved Optical Absorption &
Scattering Tomography
QuickTime™ and a decompressor
are needed to see this picture.

NIRS tomography applied to the breast: Imaging the extra blood volume and different blood
oxygenation in tumours
The optical mammography scanning
table (note no breast compression)
Optical tomography images
Magnavist enhancedMRI image

1 week beforesurgery
1 week aftersurgery
fibroadenoma
3 months aftersurgery
6 months aftersurgery
9 months after surgery, straight after FNA of cyst.
cyst double cyst
Interstitial laser photocoagulation treatment of fibroadenoma26-year-old subject
superficial injury due to FNA
inflammation due to laser surgery
12 months aftersurgery
residualfibroadenoma

NIRS Optical tomography of the infant brain - the “Creche Helmet”

A baby undergoing an optical tomography study
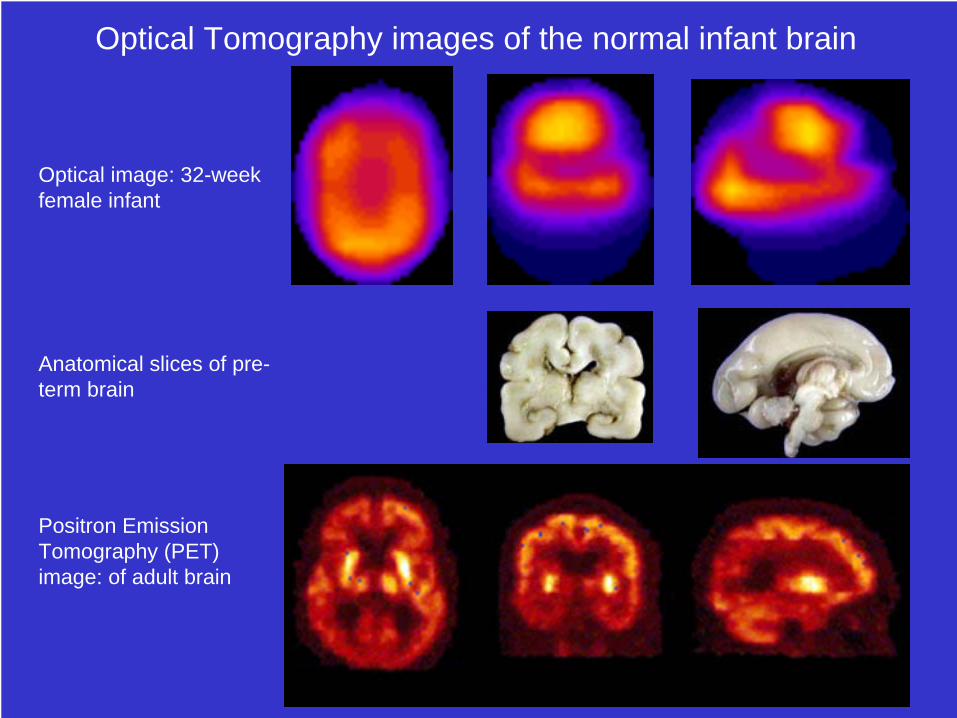
Optical image: 32-week female infant
Anatomical slices of pre- term brain
Positron Emission Tomography (PET) image: of adult brain
Optical Tomography images of the normal infant brain

Positron Emission Tomography (PET) images of neonate brain
Upper – normalLower – post asphyxia

Static imaging of haemorrhage
Optical Tomography images of the abnormal infant brain
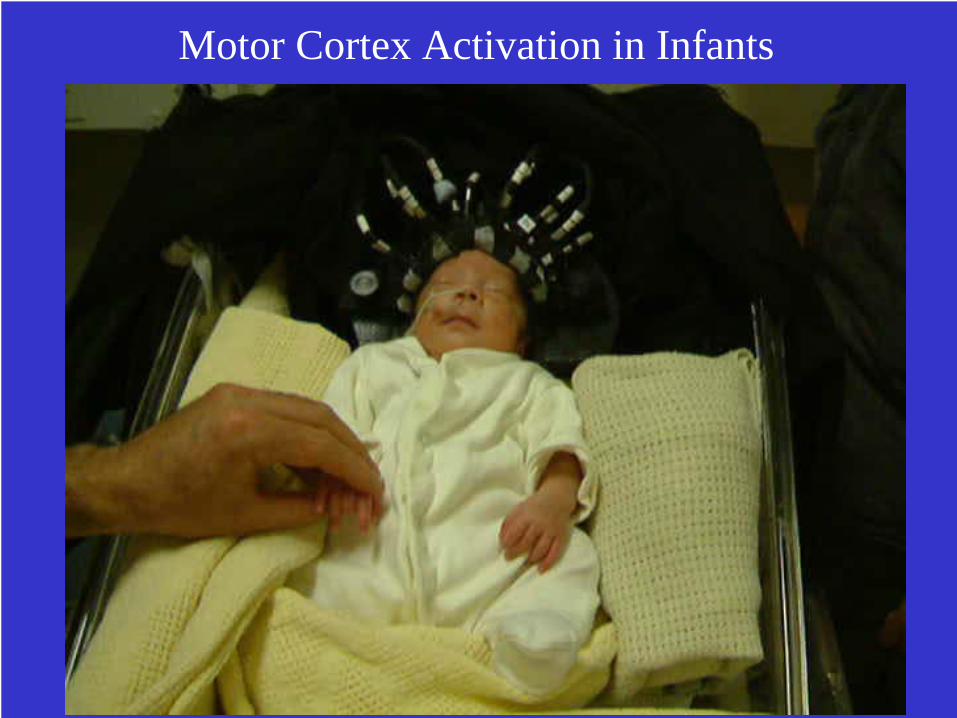
Motor Cortex Activation in Infants

Passive movement ofLeft Arm
Passive movement ofRight Arm
Tomographic mapping of functional activation of the motor cortex in the neonate(Sequential sagittal slices displayed from a full 3D image)
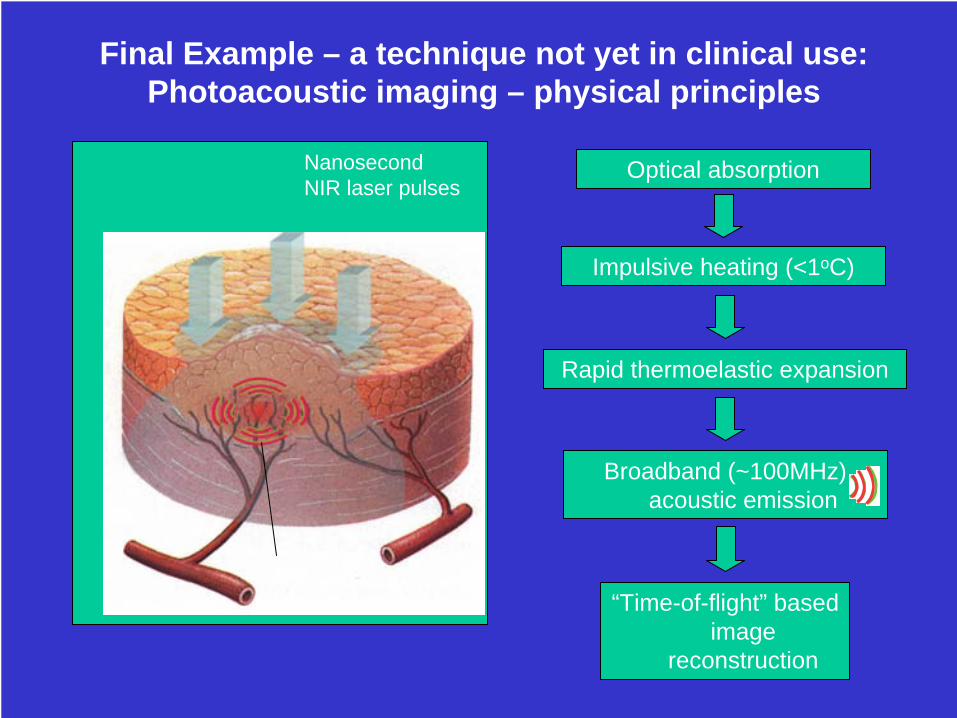
Final Example – a technique not yet in clinical use:Photoacoustic imaging – physical principles
Optical absorption
Impulsive heating (<1oC)
Rapid thermoelastic expansion
Broadband (~100MHz) acoustic emission
“Time-of-flight” based image
reconstruction
Nanosecond NIR laser pulses
tumour blood vessels

Incident NIR high peak power pulse causes rapid expansion of the absorber. The acoustic wave can be picked up using ultrasound transducers
Photo-acoustic imagingPhoto-acoustic imaging is able to examine features with NIR contrast but with resolution similar to ultrasound:
Perfused tumour

Photoacoustic imaging of the rat brain
(Image obtained through intact skull and skin)
In vivo photoacoustic image of rat brainX. Wang et al., Nature Biotechnology 21(7), pp. 803–806, 2003
The futures bright:
The futures:
OPTICAL SENSING & IMAGING

Thanks
Contributors:
Clive AldridgeSimon ArridgeTopun AustinTiziano BinzoniTony BishopTara BlandGilberto BrancoDavid BrownGuy BrownTim CheatleChris CooperMark CopeKate CosteloeTony CostelloGergely CsibraBrian DavidsonMauren de SouzaRoberto de BlasiGeofrey De VisscherEnrico De VitaHamid DehghaniMichael DouekArlene DuncanDavid EdwardsHamid El-DesokyLouise EnfieldMatthias EssenpriesNick EverdellMarco FerrariMike FirbankLaure Gendron
…and many many others!
Funders:
Action Medical ResearchBBSRCEPSRCEuropean UnionHamamatsu Photonics KKHitachi Medical LtdMRCRoyal SocietySwiss National Science FoundationWellcome TrustWolfson Foundation
Adam GibsonFelix GoraCornelia HagmanDavid HallPat HamiltonSally HarkinsJem HebdenJulian HentyElizabeth HillmanMutsu HiraokaVeronica HollisPeter HopeIan HutchinsonMark JohnsonDavid JennionsPeck KohJan LauferTing LeeTerence LeungTim LovellDave KirkbyMatthias KohlIvo KweeSteve MatcherJudith MeekAladangady NarendraEiji OkadaHuw Owen-ReeceChristos PanagiotouDonald PeeblesCaroline Reid
Os ReynoldsClare RichardsonGed RidgewayFlorian SchmidtMartin SchweigerAlex SeifalianRebecca SimpsonMartin SmithRoger SpringettIlias TachtsidisMartin TisdallIan TullisTharshan VaithianathanPiet van der ZeeKoen van RossemRussell WatsonKevin WellsSusan WrayJohn WyattRoza YusofGiovanni Zaccanti

Hopefully not!!
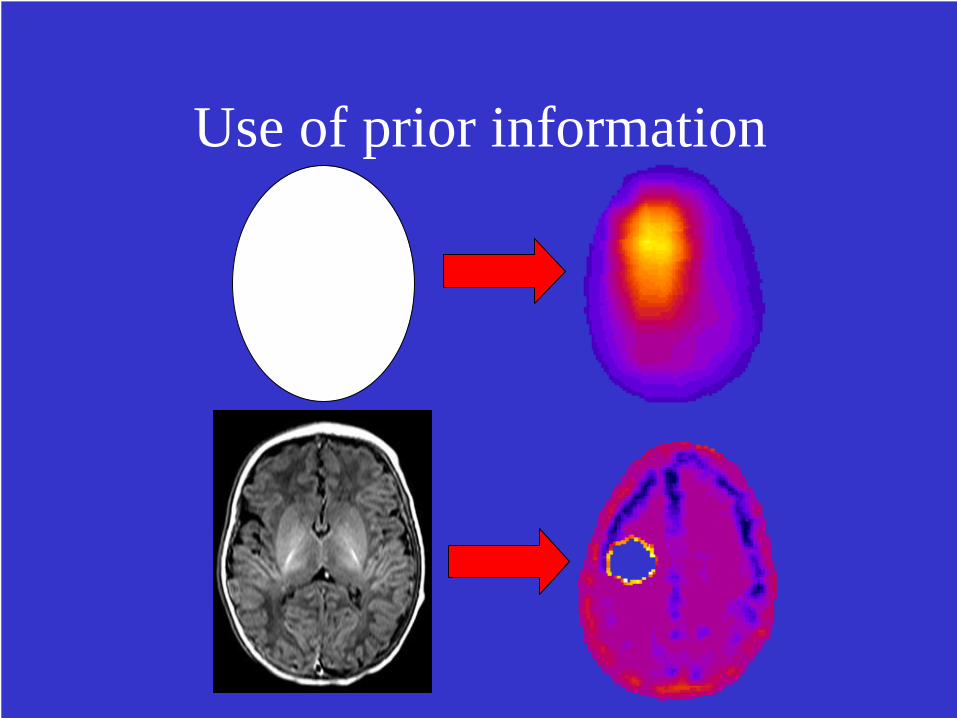
Use of prior information
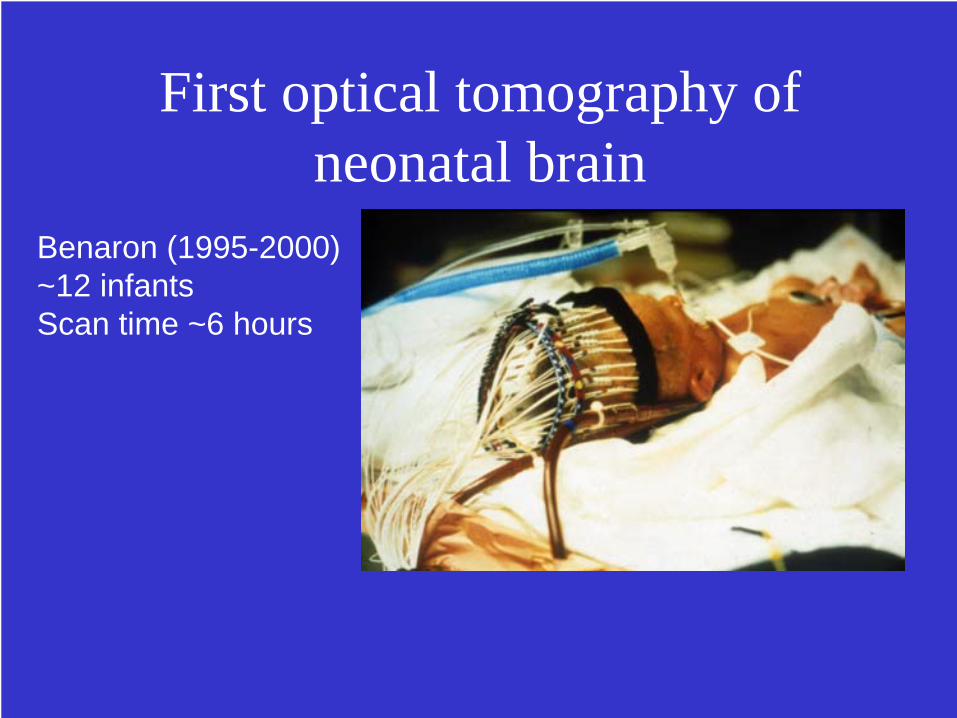
First optical tomography of neonatal brain
Benaron (1995-2000)~12 infantsScan time ~6 hours
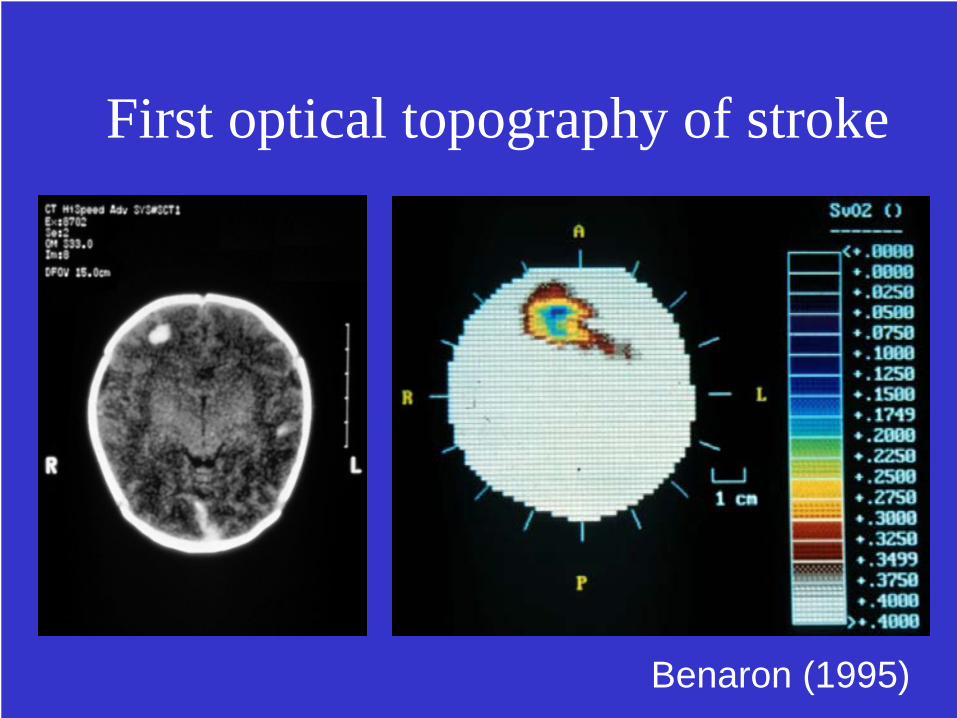
Benaron (1995)
First optical topography of stroke

Non-scattering regions
Diffusion equation:low scattering region
Void model