sheetal sekhri university of virginia bread igc … · lecture 5: applications to environmental and...
TRANSCRIPT

Lecture 5: Applications to Environmental and Resource Economics
Sheetal SekhriUniversity of Virginia
BREAD IGC Summer School, India 2012
July 22, 2012

Trade-off between Environment and Development
• Resources Vital for rural population
* Source of Livelihood* Consumption good* Insurance against shocks* Forests, groundwater,fish,land etc
• Tragedy of Commons more pervasive
* Less Incentives to conserve* High discount rates* Environmental degradation or resource depletion

Gender and Equity Issues
• Women bear more burdens and pay more in cost
• Inequality in access to resources
• Spatial Impacts: hotspots
Gender and Equity Issues
• Women bear more burdens and pay more in cost
• Inequality in access to resources
• Spatial Impacts: hotspots

Gender and Equity Issues
• Women bear more burdens and pay more in cost
• Inequality in access to resources
• Spatial Impacts: hotspots

Decentralization and Pollution
• Spatial Externalities
• What is the right level of control?
• Benefits and drawbacks
• Subnational governments more local information and targetedresources
• Incentives to increase pollution spills into neighboringjurisdictions

Decentralization and Pollution
• Spatial Externalities
• What is the right level of control?
• Benefits and drawbacks
• Subnational governments more local information and targetedresources
• Incentives to increase pollution spills into neighboringjurisdictions

Decentralization and Pollution
• Spatial Externalities
• What is the right level of control?
• Benefits and drawbacks
• Subnational governments more local information and targetedresources
• Incentives to increase pollution spills into neighboringjurisdictions

Decentralization and Pollution
• Spatial Externalities
• What is the right level of control?
• Benefits and drawbacks
• Subnational governments more local information and targetedresources
• Incentives to increase pollution spills into neighboringjurisdictions

Decentralization and Pollution
• Spatial Externalities
• What is the right level of control?
• Benefits and drawbacks
• Subnational governments more local information and targetedresources
• Incentives to increase pollution spills into neighboringjurisdictions

Water and Development
• Water and sanitation Millennium development goals
• Clean water and health
• Water as a resource for input in agriculture

Water and Development
• Water and sanitation Millennium development goals
• Clean water and health
• Water as a resource for input in agriculture

Water and Development
• Water and sanitation Millennium development goals
• Clean water and health
• Water as a resource for input in agriculture

Challenges in Measurement
• Hedonic Price Theory
• Travel Cost Approach
• Contingent valuation
• Household Production and averted expenditure
Challenges in Measurement
• Hedonic Price Theory
• Travel Cost Approach
• Contingent valuation
• Household Production and averted expenditure

Challenges in Measurement
• Hedonic Price Theory
• Travel Cost Approach
• Contingent valuation
• Household Production and averted expenditure

Challenges in Measurement
• Hedonic Price Theory
• Travel Cost Approach
• Contingent valuation
• Household Production and averted expenditure

Water for Life:The Impact of the Privatization ofWater Services on Child Mortality
(Galiani, Gertler and Schargrodshy)
• 3 million children die from preventable water-related diseaseseach year(World Bank, 2002)
• Goal:* Reduce child mortality by two-thirds* Cutting in half of the number of households that do not have
access to water by 2015
• Studies found that access to safe water is associated withbetter health
• How to provide safe water?

Privatization
• In the world with incomplete contracts, public serviceproviders may shirk effort compromising quality
• Privatization ⇒ Increase Access and Improve Quality ⇒Improve health outcomes
• Private firms may not internalize positive health externalitiesresulting in suboptimal quality of provision
• Private firms may raise prices and target the rich for serviceprovision
• Empirical investigation as theory is ambiguous
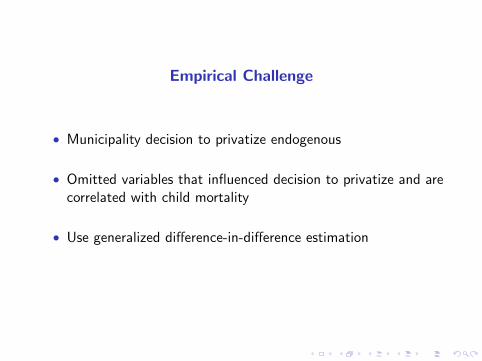
Empirical Challenge
• Municipality decision to privatize endogenous
• Omitted variables that influenced decision to privatize and arecorrelated with child mortality
• Use generalized difference-in-difference estimation
• DID with matching using pre treatment characteristics

Empirical Challenge
• Municipality decision to privatize endogenous
• Omitted variables that influenced decision to privatize and arecorrelated with child mortality
• Use generalized difference-in-difference estimation
• DID with matching using pre treatment characteristics
Empirical Challenge
• Municipality decision to privatize endogenous
• Omitted variables that influenced decision to privatize and arecorrelated with child mortality
• Use generalized difference-in-difference estimation
• DID with matching using pre treatment characteristics

Empirical Challenge
• Municipality decision to privatize endogenous
• Omitted variables that influenced decision to privatize and arecorrelated with child mortality
• Use generalized difference-in-difference estimation
• DID with matching using pre treatment characteristics

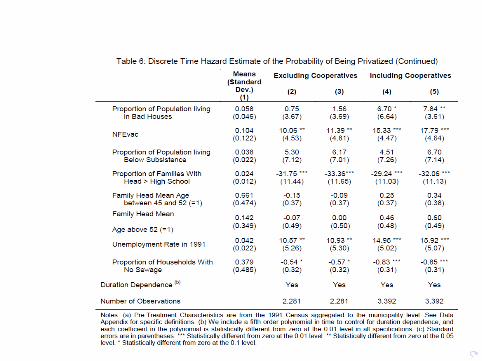
Empirical Investigation
• Hazard model- probability that a municipality privatizes inperiod t given it did not in period t − 1
• Privatization driven by fixed characteristics not time varyingcharacteristics of municipalities
• The coefficient of the lag of the change in municipal childmortality rate not significant


Generalized Difference-in-Difference
• Addressing common support
• Estimate the probability of treatment as a function of pretreatment characteristics using a logit model
• Exclude control observations with propensity score < 1stpercentile of the treatment propensity score distribution
• Exclude treatment observations with propensity score > 99thpercentile of the control propensity score distribution

Generalized Difference-in-Difference
• Concern - differences in distributions of X across the twogroups
• Matching will eliminate any bias by matching treatmentmunicipalities to the controls that have similarpre-privatization observed characteristics
• Kernel based matching- For each treated observation, eachcontrol observation weighted by distance in terms ofpropensity weights in each time period
• Bootstrap standard errors


Difference in Difference: Example
Water for Life: The Impact of the Privatization of Water Services on Child Mortality Sebastián Galiani, Paul Gertler, Ernesto Schargrodsky. Journal of Political Economy (2005)
Figure1: Percentage of Municipalities with Privatized Water Systems
0
5
10
15
20
25
30
1990 1991 1992 1993 1994 1995 1996 1997 1998 1999
Year
% A
ccum
ulat
ed

Difference in Difference: Example
3.5
4
4.5
5
5.5
6
6.5
1990 1991 1992 1993 1994 1995 1996 1997 1998 1999
Mor
talit
y R
ates
Year
Figure 4: Evolution of Mortality Rates for Municipalities with Privatized vs. Non-Privatized Water Services
Mortality Rates, Non-privatized Municipalities Mortality Rates, Privatized Municipalities

Public Provision and Protection of Natural Resources:Groundwater Irrigation in Rural India
(Sheetal Sekhri)
• Trade-off between resource intensive development andpreservation of natural resources
• Is it possible to design public policies that result indevelopment but also sustainable use of natural resources?
• Look at Groundwater

Why Study Groundwater ?
• Primary source of drinking water for about one third ofworld’s population
• Main source of irrigation
• More than half of the world’s population lives in countrieswhere groundwater is depleting at alarming rates

Why Study Groundwater ?
• Primary source of drinking water for about one third ofworld’s population
• Main source of irrigation
• More than half of the world’s population lives in countrieswhere groundwater is depleting at alarming rates

Why Study Groundwater ?
• Primary source of drinking water for about one third ofworld’s population
• Main source of irrigation
• More than half of the world’s population lives in countrieswhere groundwater is depleting at alarming rates

Vital Resource
• Food Security
• Drinking Waterneeds

Vital Resource
• Food Security
• Drinking Waterneeds

Dwindling Reserves: More water is being extractedthan is being replenished
• 15 percent of administrative blocks overexploited, 4% critical
• If these trends continue, 15 states in India could dry up by2025
• Food production could fall by 25 percent

Dwindling Reserves: More water is being extractedthan is being replenished
• 15 percent of administrative blocks overexploited, 4% critical
• If these trends continue, 15 states in India could dry up by2025
• Food production could fall by 25 percent

Dwindling Reserves: More water is being extractedthan is being replenished
• 15 percent of administrative blocks overexploited, 4% critical
• If these trends continue, 15 states in India could dry up by2025
• Food production could fall by 25 percent

Specific Question
How does public provision of groundwater for irrigationaffect local water tables?
• Provide a theoretical and empirical analysis

Public Provision targeted towards mitigating poverty
• High fixed costs :Public provision via large capacity wells
• Most of the schemes in very poor regions of India
Conflicting policy goal: sustaining reserves of groundwater

Public Provision targeted towards mitigating poverty
• High fixed costs :Public provision via large capacity wells
• Most of the schemes in very poor regions of India
Conflicting policy goal: sustaining reserves of groundwater

Public Provision targeted towards mitigating poverty
• High fixed costs :Public provision via large capacity wells
• Most of the schemes in very poor regions of India
Conflicting policy goal: sustaining reserves of groundwater

Effect of increasing access on water tables
At first cut, expanded access would seem to result inincreased depletion
However, this paper shows:
When fixed costs are high (but not prohibitive), theseschemes can in fact benefit the aquifers!

Effect of increasing access on water tables
At first cut, expanded access would seem to result inincreased depletion
However, this paper shows:
When fixed costs are high (but not prohibitive), theseschemes can in fact benefit the aquifers!
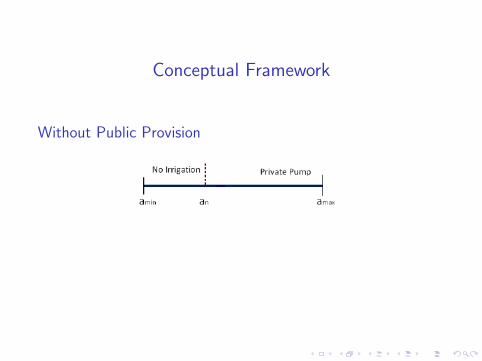
Conceptual Framework
Without Public Provision
Under Public Provision

Conceptual Framework
Without Public Provision
Under Public Provision

Conceptual Framework

Conceptual Framework

Conceptual Framework

Conceptual Framework

Conceptual Framework

Conceptual Framework

Conceptual Framework
Key Predictions
• As a result of public provision , water savingscan accrue when fixed costs are high (but notprohibitive)
• Under Public Provision , number of wells shouldincrease less rapidly when fixed costs are high

Key Predictions
• As a result of public provision , water savingscan accrue when fixed costs are high (but notprohibitive)
• Under Public Provision , number of wells shouldincrease less rapidly when fixed costs are high
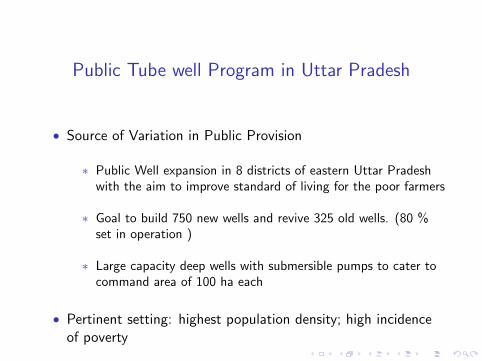
Public Tube well Program in Uttar Pradesh
• Source of Variation in Public Provision
∗ Public Well expansion in 8 districts of eastern Uttar Pradeshwith the aim to improve standard of living for the poor farmers
∗ Goal to build 750 new wells and revive 325 old wells. (80 %set in operation )
∗ Large capacity deep wells with submersible pumps to cater tocommand area of 100 ha each
• Pertinent setting: highest population density; high incidenceof poverty

Estimation Strategy
• Selection into Treatment
? Villages not randomly selected
? Determinants of selection might also affect water table deptheg: soil permeability
• Heterogenous Treatment Effect
Each village can be characterized as either high or low costdepending on depth in period 1

Estimation Strategy
• Selection into Treatment
? Villages not randomly selected
? Determinants of selection might also affect water table deptheg: soil permeability
• Heterogenous Treatment Effect
Each village can be characterized as either high or low costdepending on depth in period 1

Estimation Strategy
• Selection into Treatment
? Villages not randomly selected
? Determinants of selection might also affect water table deptheg: soil permeability
• Heterogenous Treatment Effect
Each village can be characterized as either high or low costdepending on depth in period 1

Use the Differencing Approach
• For each cost category, compare water table depth
? before and after (difference across time)
? across treated and comparison villages (difference acrosstreatment groups)
• Third difference across categories of cost

Use the Differencing Approach
• For each cost category, compare water table depth
? before and after (difference across time)
? across treated and comparison villages (difference acrosstreatment groups)
• Third difference across categories of cost
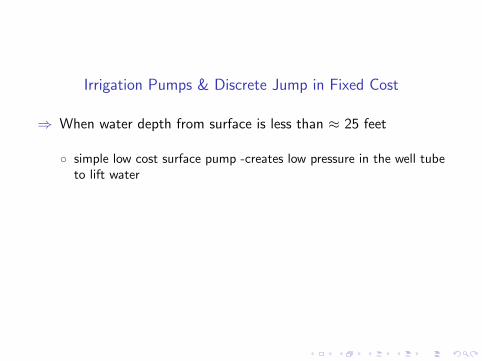
Irrigation Pumps & Discrete Jump in Fixed Cost
⇒ When water depth from surface is less than ≈ 25 feet
◦ simple low cost surface pump -creates low pressure in the well tubeto lift water
⇒ When depth > 25 feet
◦ More sophiticated pump that can be submersed in water is required◦ Submersible pumps cost 3-5 times more than the surface pumps

Lifting Water with the aid of Nature has Limits
• Vertical lift supported by atmospheric pressure in case ofSurface Pumps
• Theoretical Limit (under perfect vacuum) 34 feet
• Perfect vacuum cannot be created and there is a friction loss,so the practical limit is 25 feet

Estimation Strategy
• Each village can be characterized as either high or low costdepending on depth in period 1
• Villages not randomly selected. Determinants of selectionmight also affect water table depth eg: soil permeability

Estimation Strategy
• Each village can be characterized as either high or low costdepending on depth in period 1
• Villages not randomly selected. Determinants of selectionmight also affect water table depth eg: soil permeability

Use a DID approach
• Estimate ATET by category of fixed cost: For each costcategory, compare water table depth
? before and after
? across treated and comparison villages
• Third difference across categories of cost

Use a DID approach
• Estimate ATET by category of fixed cost: For each costcategory, compare water table depth
? before and after
? across treated and comparison villages
• Third difference across categories of cost

Estimation
Outcome Y in period t for village i in Low and High cost categories (conditional on
time varying observable variables)
yLit = αL + βL ∗ post + γL ∗ Ti + δ ∗ Ti ∗ Post + εit
yHit = αH + βH ∗ post + γH ∗ Ti + (δ + η) ∗ Ti ∗ Post + εit
Parameter of interest : η
Specifically, indexing category of fixed cost as b ∈ [H, L],
yitb =∑b
αb ∗ Ib +∑b
βb ∗ (Ib ∗ post) +∑b
γb ∗ (Ib ∗ Ti )
+∑b
δb ∗ (Ib ∗ Ti ∗ Post) + εit
In this formulation, η = δH − δL

Estimation
Outcome Y in period t for village i in Low and High cost categories (conditional on
time varying observable variables)
yLit = αL + βL ∗ post + γL ∗ Ti + δ ∗ Ti ∗ Post + εit
yHit = αH + βH ∗ post + γH ∗ Ti + (δ + η) ∗ Ti ∗ Post + εit
Parameter of interest : ηSpecifically, indexing category of fixed cost as b ∈ [H, L],
yitb =∑b
αb ∗ Ib +∑b
βb ∗ (Ib ∗ post) +∑b
γb ∗ (Ib ∗ Ti )
+∑b
δb ∗ (Ib ∗ Ti ∗ Post) + εit
In this formulation, η = δH − δL

Identification
Identifying assumption: No differential time varying unobservableshocks among treated and control villages that also systematicallydiffer across cost categories
• Will control for demographic, socio-economic, andgeographical time varying co-variates
• Address potentially differential selection across cost categories

Baseline (1993) Water Table Depth Distribution
(Non Parametric Kernel density of Water below Ground Level in Meters)

Differences-in-Differences Estimates of Deep Public Tubewell on Local Water Table Depth by Categories of Fixed CostsPanel A Dependent Variable :Depth of Water Table Below Ground Level
(i) (ii) (iii)Deep Public Tube Well * Post ‐0.15 ‐0.23 ‐0.17*Low Cost Category (1.2) (1.20) (1.19)
Deep Public Tube Well * Post ‐5.15 ‐5.17 ‐5.27*High Cost Category (2.25) (2.25) (2.28)
Demographic and Economic time varying conrtols No Yes Yes
Geological time varying controls No No YesObservations 14204 14202 14202R‐Squared 0.16 0.16 0.17
Panel B Heterogeneity in Impact of Deep Public Tube Well Program between High and Low Cost Categories
(i) (ii) (iii)
Difference Between Point estimates ‐5 ‐4.94 ‐5.1from Panel AF statistic (testing if the difference is 0) 3.85 3.7 3.91Significance level 0.049 0.054 0.048
std errors are clustered at village level

A. Investment in Private wells in Period 1 (number of private wells)
B. Investment in Private Wells in Period 2 (number of private wells)
Figure : Average Number of Private Wells per Village by Depth of Groundwater
5
10
15
20
25
30
4 8 12 16 24 32 50
Depth Below Ground Level
treated comparison
25
30
35
40
45
50
4 8 12 16 24 32 50
treated comparison

Figure 1: Falsification Test Using a Synthetic Depth for Classification of High and Low Cost Villages
Fixed cost changes at approximately 8 meters (25 feet) as low cost surface pumps become infeasible at this depth. Each point corresponds to a different regression in which the cut-off used to classify villages as low or high is synthetically changed such that a different value other than 8 meters is used. The figure plots the regression coefficients of difference between the impacts of public tube well on depth of groundwater across high cost and low categories assuming a different cutoff depth at which fixed cost changes. The dotted lines plot the 95% confidence band around the difference. For each cutoff X, all villages with groundwater depth < = X in period 1 are classified as low cost.

Probit Estimates of Probability of Selection across two Categories of Fixed cost
Dependent Variable : Dummy variable Indicating whether or not village is a part of the Deep Tube Well ProgramEquivalence Significance
Low cost High Cost of coeff.(i) (ii) (chow test)
coeff std err coeff std errEconomic & Demographic VariablesPercentage of Village PopulationWorkers 0.07191 0.3213 ‐0.75185 0.7683 1.1 0.297Schedule Caste 0.21873 0.15769 ‐0.0846 0.35489 0.68 0.408Literate 0.01753 0.25042 1.90825 0.53412 11.68 0.0006Density of Population ‐0.00312 0.00304 ‐0.01302 0.00743 1.6 0.206Number of Households 0.00082 0.00013 0.00036 0.00024 2.84 0.09
Infrastructure Power (=1 if electrified) 0.46907 0.08353 0.31902 0.19159 0.51 0.47Community Health Workers (=1 if engaged) ‐0.09523 0.05339 ‐0.25319 0.11426 1.47 0.224Primary School (=1 if has one) 0.2475 0.0589 0.54764 0.13113 4.42 0.035
Irrigation(variable =1 if any land irrigated by source)Tubewell ‐0.10635 0.05346 ‐0.19748 0.1156 0.53 0.465Government Canals ‐0.51185 0.06207 ‐0.53247 0.15375 0.02 0.897Tanks 0.07477 0.09883 0.16423 0.2938 0.09 0.769Rivers ‐0.07617 0.27464 0.84097 0.73759 2.2 0.137
Geology & GeographyRainfall ‐0.01961 0.00256 ‐0.02698 0.00705 1.35 0.245Lag 1 of rainfall 0.01139 0.00259 0.02022 0.00674 1.93 0.164temperature ‐0.46898 0.16332 ‐0.73281 0.42866 0.41 0.524elevation 0.002 0.00394 0.01261 0.01036 1.09 0.297slope 0.00083 0.00202 0.00287 0.00664 0.14 0.711

Differences‐in‐Differences Estimates of Deep Public Tubewell on Local Water Table Depth by Categories Of Fixed Cost
Panel A Dependent Variable :Depth of Water Table Below Ground Levelexcluding % Literacy > Median% literacy
(i) (ii) (iii) (iv) (v) (vi)Deep Public Tube Well * Post ‐0.15 ‐0.23 ‐0.17 ‐0.15 ‐0.58 ‐0.72*Low Cost Category (1.2) (1.20) (1.19) (1.18) (1.15) (1.12)
Deep Public Tube Well * Post ‐5.15 ‐5.17 ‐5.27 ‐5.28 ‐6.43 ‐6.65*High Cost Category (2.25) (2.25) (2.28) (2.28) (2.58) (2.65)
Demographic and Economic time varying controls No Yes Yes Yes Yes Yes
Geological time varying controls No No Yes Yes No YesObservations 14204 14202 14202 14204 7206 7206R‐Squared 0.16 0.16 0.17 0.17 0.19 0.19
Panel B: Heterogeneity in Impact of Deep Public Tube Well Program between High and Low Fixed Cost Categories(i) (ii) (iii) (iv) (v) (vi)
Difference Between Point estimates ‐5 ‐4.94 ‐5.1 ‐5.13 ‐5.85 ‐5.93from Panel AF statistic (testing if the difference is 0) 3.85 3.7 3.91 4 4.26 4.3Significance level 0.049 0.054 0.048 0.045 0.039 0.038

Conclusion
• Public provision can benefit aquifers when fixed cost is high(but not prohibitive)
• Consistent evidence supports crowding out of private wellsaccompanied with water reduction by Larger farmers
• Policy perspective: Increasing access in a sustainable mannerpossible using these schemes
• Normative - Optimal Price can be determined withexperimentation