shell games: are chinese reverse merger firms inherently...
TRANSCRIPT

Shell Games: Are
Chinese Reverse Merger
Firms Inherently Toxic?
Charles M. C. Lee
Kevin Li
Rania Zhang
January 2013

Plenty of Bad Press Recently
Disappointment in a
shell – Dec 26, 2011
August 2011

Reverse Merger
A private company merges with a public company and the private
company’s management team takes over the combined publicly
traded company (aka: “Backdoor Listing”)
Private
Company
“OPCO”
Publicly
traded
“OPCO”
Public
Company
“PUBCO”
“Shell
Company” At time of merger, PUBCO is
typically a “shell” – i.e. a non-
operating entity that has gone
through bankruptcy and is
now dormant.

The China Factor
1. Recent surge in Chinese RMs
Between Jan 2001 and Dec 2010, about 85% of foreign
RMs were from China
PCAOB: from 2007 to 2011, over 150 Chinese RMs
($12.8bn) entered U.S. markets (vs. 50 Chinese IPOs
over the same time period).
2. High-profile fraud cases In 2011, the SEC issued a general warning against
investing in Chinese firms listing via Reverse Mergers.
According to a list prepared by the China Ministry of
Finance, on June 20, 2011, the SEC was investigating
34 U.S. listed Chinese companies for potential security
fraud (4 IPOs; 30 RMs).

Role of Short-sellers Many high profiled reports were first put out by short-
sellers. Some are genuine frauds; others, less clear.
Muddy Waters Research (June 2, 2011 Report on Sino-Forest)
(Nov 21, 2011 Report on Focus Media)
J. Capital Research (Jan 3, 2011 short on China Green Agriculture)
Citron Research (Have issued negative reports on 20 Chinese companies since
2006. According to their website, 16 have suffered
“catastrophic losses” of 66% or more since their report)
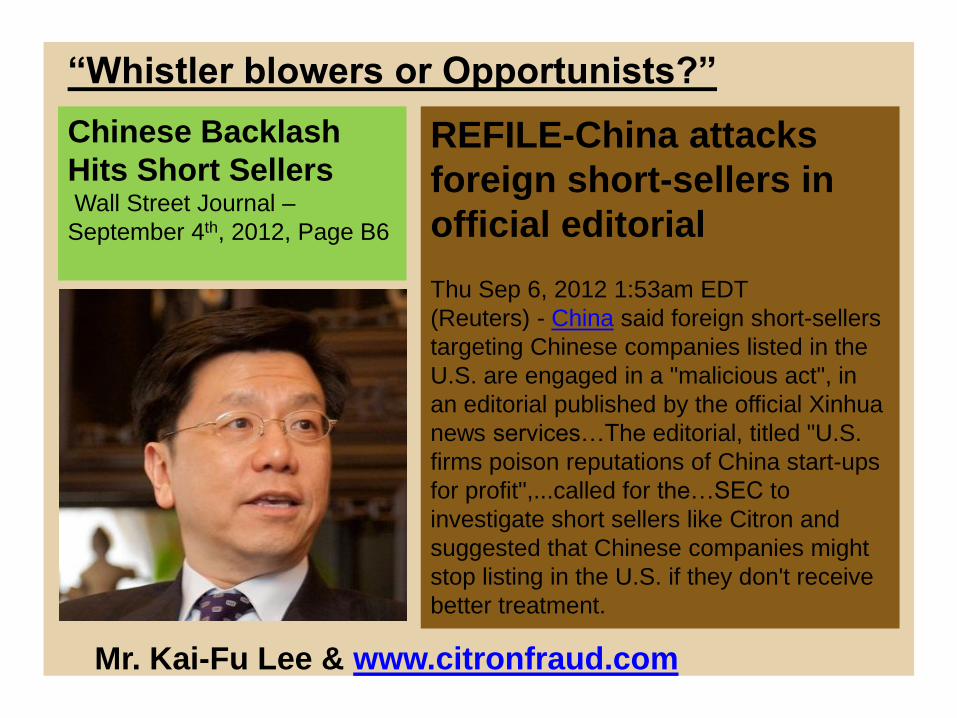
“Whistler blowers or Opportunists?”
Chinese Backlash
Hits Short Sellers Wall Street Journal –
September 4th, 2012, Page B6
REFILE-China attacks
foreign short-sellers in
official editorial
Thu Sep 6, 2012 1:53am EDT
(Reuters) - China said foreign short-sellers
targeting Chinese companies listed in the
U.S. are engaged in a "malicious act", in
an editorial published by the official Xinhua
news services…The editorial, titled "U.S.
firms poison reputations of China start-ups
for profit",...called for the…SEC to
investigate short sellers like Citron and
suggested that Chinese companies might
stop listing in the U.S. if they don't receive
better treatment.
Mr. Kai-Fu Lee & www.citronfraud.com

“Whistler blowers or Opportunists?”
Mr. Kai-Fu Lee & www.citronfraud.com
“write reports that boldly tell lies, knowing that their
American readers have no way of verifying them… (these)
baseless allegations by Citron and others will make it harder
and harder for Chinese companies to go public in the U.S.,
which is neither good for China nor the U.S."

A Central Unresolved Question
(for both regulators and investors)
“Is the integrity of U.S. capital
markets being harmed by Chinese
firms using reverse mergers to go
public?”
(i.e., exactly how bad are these
Chinese reverse merger firms?)

How Bad are Chinese Reverse Mergers?
1. They are clearly awful
- China has well-known corporate governance problems
- These are “backdoor listings” (obviously weaker firms)
- They seem to have much worse returns
- We’ve got lots of high-profiled cases
An open-
and-shut
case!
2. On the other hand…
- Virtually no systematic evidence on their collective
performance (just vivid anecdotes)
- Not fair to compare Chinese RMs to: (1) Chinese IPOs, or to
(2) R2000 firms (RMs are by nature earlier-stage
developmental firms with tight financing constraints; most
RMs start on the OTCBB or Pink Sheets; that is true whether
or not they are Chinese).
- China has a deep pool of IPO-eligible firms and tight capital
access for start-ups. Also, RMs in the U.S. face many on-
going costs and constraints (short-sellers; SOX requirements).
Maybe
not…

What we do
Research Design
- Examine all RMs that became active in the U.S. between 2001
and 2010 (both U.S. and Foreign). Involves some hand-collection.
- Compare them to a set of control firms matched on Date-Industry-
Size from the same exchange (NMS, OTCBB, Pink Sheet).
- Examine:
• Initial financial health (on date of each RM’s first 10-K filing)
• Subsequent performance (for each of the next three years)
(1) RMs vs. Controls: How do RMs fare collectively?
Are the existing laws governing RMs “too loose”?
(2) The China Factor: Are Chinese governance
problems being imported to U.S. markets through
these “backdoor listings”?
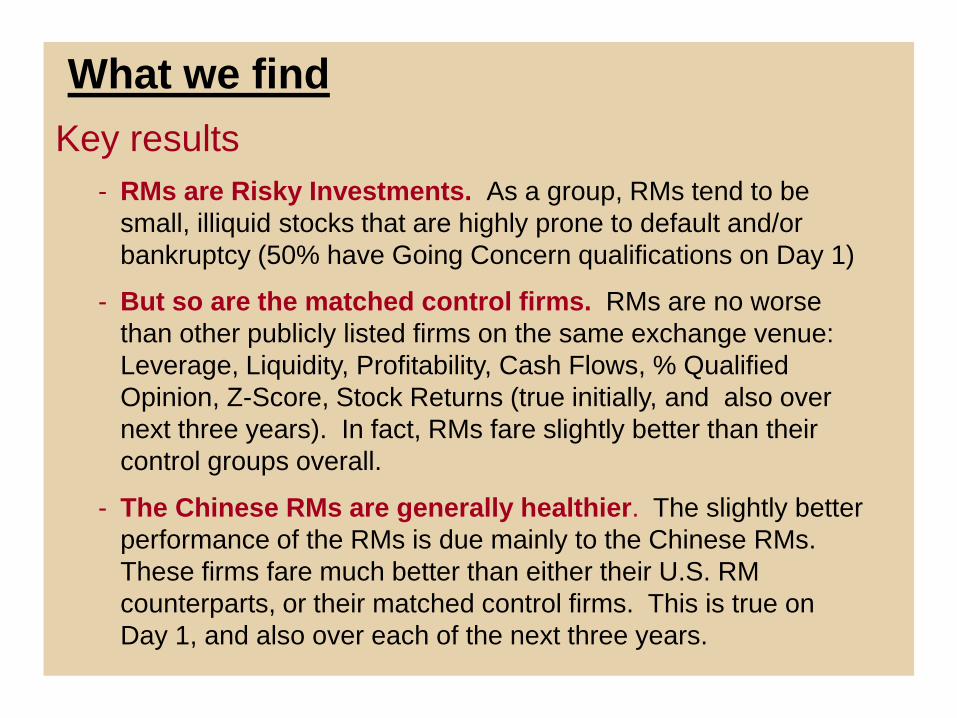
What we find
Key results
- RMs are Risky Investments. As a group, RMs tend to be
small, illiquid stocks that are highly prone to default and/or
bankruptcy (50% have Going Concern qualifications on Day 1)
- But so are the matched control firms. RMs are no worse
than other publicly listed firms on the same exchange venue:
Leverage, Liquidity, Profitability, Cash Flows, % Qualified
Opinion, Z-Score, Stock Returns (true initially, and also over
next three years). In fact, RMs fare slightly better than their
control groups overall.
- The Chinese RMs are generally healthier. The slightly better
performance of the RMs is due mainly to the Chinese RMs.
These firms fare much better than either their U.S. RM
counterparts, or their matched control firms. This is true on
Day 1, and also over each of the next three years.

Empirical Results

Stanford Graduate School of Business
Sample Collection
Few RMs actually become active entities. In our sample, only 489 observations have post-RM data on the COMPUSTAT Fundamentals Annual database.
Filing of the First 10-K Form
A RM occurs when a shell firm is acquired by another corporate entity. DealFlow Media reports 1,608 such acquisitions between January 2001 and December 2010.
Completion of a Reverse Merger
A shell company is a registered but dormant entity. As of July 2012, there are 1,268 reporting shells in the DealFlow Media database, of which 625 are publicly traded on OTCBB or pink sheets.
Formation of a Shell Company
RM Sample:
Identified as an RM in the
DealFlow Media database
+
Filed a subsequent 10K
+
Fundamental information
in Compustat
CL Sample:
For each RM, select a firm
from the same listing venue
+
Same industry & 10K date
+
Closest match based on
market capitalization

Stanford Graduate School of Business
Table 1. Data Description
Inception Sample (Prior to 2012) Long-run Sample (Prior to 2009)
From U.S. 251 59.2% 213 60.5%
From China 146 34.4% 118 33.5%
From other countries 27 6.4% 21 6.0%
Total 424 100% 352 100%
Year of RMs
Original
Sample
from DFM
Inception Sample (Prior to
2012)
Long-run Sample (Prior to
2009)
No. of RMs Days2Filing No. of RMs Days2Filing
2001 9 4 421 4 421
2002 25 13 319 13 319
2003 58 22 323 22 323
2004 199 67 463 63 372
2005 210 68 323 67 303
2006 210 72 277 69 230
2007 229 66 236 65 226
2008 211 59 192 49 166
2009 200 29 187 -- --
2010 257 24 171 -- --
Total 1,608 424 289 352 271
Panel A: Distribution of reverse merger firms by country
Panel B: Distribution of reverse merger firms by year of merger

Stanford Graduate School of Business
Table 2A. Firm Characteristics in Year T (RM vs. CL)
RMs CLs Diff.
Mean Median Mean Median Mean Median
Size MCAP 90.04 45.65 83.33 30.55 6.72 15.09***
($million) (0.41) (3.07)
Capital
Structure
LEV 1.68 0.49 1.43 0.50 0.26 -0.02
(1.04) (-0.12)
CR 3.13 1.43 3.78 1.43 -0.64 0.00
(-1.34) (0.52)
Liquidity SPREAD 25.09 21.58 15.36 7.37 9.73*** 14.21***
(%) (5.45) (6.50)
Operation
ROA -1.71 -0.24 -1.34 -0.17 -0.36 -0.07
(-1.53) (-0.08)
CFO -0.60 -0.15 -0.57 -0.08 -0.03 -0.08
(-0.35) (-1.16)
Audit Opinion AUQ 0.49 0.00 0.50 0.50 -0.01 -0.50
(-0.38) (-0.38)
Financial
Distress ZSCORE -40.07 0.22 -57.66 -5.18 17.59* 5.40***
(1.71) (4.12)
Panel A: Summary statistics for RMs and CLs in the year of the RM’s first 10-K filing

Stanford Graduate School of Business
Table 2B. Firm Characteristics in Year T (CN RM vs. US RM)
CN RMs U.S. RMs Diff.
Mean Median Mean Median Mean Median
Size MCAP 108.98 74.48 76.47 28.38 32.51** 46.10***
($million) (2.37) (4.93)
Capital
Structure
LEV 0.51 0.34 2.31 0.66 -1.80*** -0.32***
(-5.72) (-6.77)
CR 3.87 2.06 2.52 1.07 1.35** 0.99***
(2.38) (5.27)
Liquidity SPREAD 31.77 29.54 20.33 13.95 11.44*** 15.59***
(%) (4.72) (4.54)
Operation
ROA -0.08 0.12 -2.57 -0.73 2.49*** 0.85***
(8.52) (13.38)
CFO -0.01 0.05 -0.95 -0.38 0.94*** 0.43***
(9.56) (11.72)
Audit Opinion AUQ 0.23 0.00 0.60 1.00 -0.37*** -1.00***
(-7.92) (-7.11)
Financial
Distress
ZSCORE 6.44 6.15 -65.22 -9.76 71.66*** 15.91***
(6.89) (11.35)
Panel B: Summary statistics for CN RMs and U.S. RMs in the year of the first 10-K filing

Stanford Graduate School of Business
Table 3A. Survival Rate & Changes in Exchange Venue
Venue Year T Year T+1 Year T+2 Year T+3
RMs or CLs RMs CLs Diff. RMs CLs Diff. RMs CLs Diff.
NMS 6.3% 21.0% 15.6% 5.4%* 36.9% 19.0%
17.9%**
* 35.8% 20.2%
15.6%**
*
(1.86) (5.40) (4.68)
OTCBB 88.1% 72.7% 70.5% 2.2% 47.4% 53.1% -5.7% 34.4% 42.9% -8.5%**
(0.65) (-1.52) (-2.33)
PINK 5.7% 6.0% 10.5% -4.5%** 13.6% 19.0% -5.4%* 25.6% 24.4% 1.1%
(-2.18) (-1.95) (0.37)
ACQ 0.0% 1.1% -1.1%** 0.0% 2.8% -2.8%*** 0.3% 4.0% -3.7%***
(-1.98) (-3.18) (-3.41)
DEAD 0.3% 2.3% -2.0%** 2.0% 6.0% -4.0%*** 4.0% 8.5% -4.5%**
(-2.35) (-2.72) (-2.48)
Total 100% 100% 100% 100% 100% 100% 100%
Panel A: Distribution by exchange venue for RMs and CLs

Stanford Graduate School of Business
Table 3C. Survival Rate & Changes in Exchange Venue
Venue Year T Year T+1 Year T+2 Year T+3
CN US Diff. CN US Diff. CN US Diff. CN US Diff.
NMS 0.8% 8.9% -8.1%*** 23.7% 20.7% 3.0% 55.1% 29.6% 25.5%*** 55.9% 26.3% 29.6%***
(-3.83) (0.63) (4.60) (5.41)
OTCBB 95.8% 84.0% 11.8%*** 73.7% 71.8% 1.9% 37.3% 52.1% -14.8%*** 24.6% 39.0% -14.4%***
(3.79) (0.37) (-2.64) (-2.78)
PINK 3.4% 7.0% -3.6% 2.5% 7.0% -4.5%** 6.8% 16.0% -9.2%*** 18.6% 28.6% -10.0%**
(-1.49) (-1.99) (-2.69) (-2.11)
ACQ 0.0% 0.0% - 0.0% 0.0% - 0.0% 0.5% -0.5%
(-1.04)
DEAD 0.0% 0.5% -0.5% 0.8% 2.3% -1.5% 0.8% 5.6% -4.8%***
(-1.04) (-1.14) (-2.70)
Total 100% 100% 100% 100% 100% 100% 100% 100%
Panel C: Distribution by exchange venue for CN RMs and U.S. RMs

Stanford Graduate School of Business
Figure 2. Survival Rates & Exchange Venue Mobility
(RM vs. CL)
Panel A:
Proportion of
firms that
moved up or
were
acquired
Panel B:
Proportion of
firms that
moved down or
were delisted
UP:
PINK-> OTCBB
OTCBB-> NMS
DOWN:
OTCBB-> PINK
NMS -> OTCBB
17.9%
32.7% 31.3%
10.8%
17.0% 19.6%
0
0.05
0.1
0.15
0.2
0.25
0.3
0.35
T T+1 T+2 T+3
Cu
mu
lati
ve
Per
cen
tag
e
Year
RMs
CLs
4.3%
12.8%
25.3%
8.8%
21.9%
30.1%
0
0.05
0.1
0.15
0.2
0.25
0.3
0.35
T T+1 T+2 T+3
Cu
mu
lati
ve
Per
cen
tag
e
Year
RMs
CLs

Stanford Graduate School of Business
Figure 3. Survival Rates & Exchange Venue Mobility
(CN RM vs. US RM)
23.7%
55.1% 55.1%
16.0%
23.0% 19.7%
0
0.1
0.2
0.3
0.4
0.5
0.6
T T+1 T+2 T+3
Cu
mu
lati
ve
Per
cen
tag
e
Year
CN
US
1.7%
6.8%
16.9%
4.7%
14.6%
29.1%
0
0.05
0.1
0.15
0.2
0.25
0.3
0.35
T T+1 T+2 T+3
Cu
mu
lati
ve
Per
cen
tag
e
Year
CN
US
Panel A:
Proportion of
firms that
moved up or
were
acquired
Panel B:
Proportion of
firms that
moved down or
were delisted
UP:
PINK-> OTCBB
OTCBB-> NMS
DOWN:
OTCBB-> PINK
NMS -> OTCBB

Stanford Graduate School of Business
Variable Year T+1 Year T+2 Year T+3
CN US Diff. CN US Diff. CN US Diff.
ROA Mean 0.01 -1.70 1.71*** 0.02 -1.61 1.63*** -0.02 -1.90 1.88***
(5.91) (5.62) (4.81)
Median 0.12 -0.64 0.76*** 0.11 -0.51 0.62*** 0.07 -0.57 0.64***
(8.83) (8.20) (7.73)
CFO Mean 0.04 -0.81 0.85*** 0.07 -0.71 0.78*** 0.02 -0.60 0.62***
(6.38) (6.39) (5.45)
Median 0.06 -0.38 0.44*** 0.06 -0.30 0.36*** 0.04 -0.25 0.29***
(8.39) (6.96) (5.98)
AUQ Mean 0.26 0.49 -0.23*** 0.25 0.51 -0.26*** 0.34 0.52 -0.18**
(-3.02) (-3.46) (-2.36)
Median 0.00 0.00 0.00*** 0.00 1.00 -1.00*** 0.00 1.00 -1.00**
(-2.89) (-3.27) (-2.30)
SPREAD Mean 15.80 10.46 5.34* 12.28 13.81 -1.53 11.99 18.50 -6.51*
(1.97) (-0.56) (-1.79)
Median 10.22 5.00 5.22*** 5.76 7.01 -1.25 2.00 7.52 -5.52***
(2.67) (-0.55) (-3.18)
Table 4B. Future Performance (CN RM vs. US RM)
Panel B: Future performance of CN RMs and U.S. RMs over the three years after the first 10-K filing

Stanford Graduate School of Business
Variable Year T+1 Year T+2 Year T+3
CN-CL US-CL DID CN-CL US-CL DID CN-CL US-CL DID
ROA Mean 0.80*** -0.47 1.27** 0.68*** -0.59* 1.27*** 1.00*** -0.84* 1.84***
(2.57) (2.99) (3.49)
Median 0.22*** -0.42** 0.64*** 0.17*** -0.19** 0.36*** 0.20*** -0.11 0.31***
(4.37) (4.33) (3.45)
CFO Mean 0.42*** -0.26 0.68*** 0.36*** -0.23 0.59*** 0.45*** -0.13 0.58***
(3.06) (3.36) (3.03)
Median 0.11*** -0.16*** 0.27*** 0.15*** -0.11** 0.26*** 0.15*** -0.04 0.19***
(4.84) (4.16) (3.18)
AUQ Mean -0.25*** 0.00 -0.25** -0.15* 0.04 -0.19* -0.12 0.01 -0.13
(-2.22) (-1.71) (-1.27)
Median 0.00 0.00 0.00** 0.00 0.00 0.00* 0.00 0.00 0.00
(-2.11) (-1.66) (-1.30)
SPREAD Mean 2.08 3.74** -1.66 -5.39 4.45** -9.84** -14.21** 0.76 -14.97**
(-0.45) (-2.10) (-2.41)
Median 1.19 0.44 0.76 0.24 0.31 -0.06 -2.35** 0.30 -2.65***
(0.45) (-0.78) (-2.69)
Table 5. Diff-in-Diff Future Performance (CN RM vs. US RM)

Stanford Graduate School of Business
Table 6A. Future Stock Returns (CN RM vs. US RM)
Mean 95th 90th 75th Median 25th 10th 5th
Year T+1
CN 0.38 3.49 1.77 0.76 -0.09 -0.62 -0.86 -0.93
US 0.12 2.59 1.36 0.00 -0.42 -0.76 -0.89 -0.95
Diff. 0.26 0.33***
(1.14) (2.94)
Year T+2
CN 0.21 2.43 1.14 0.37 -0.18 -0.66 -0.84 -0.88
US -0.07 2.50 0.83 0.00 -0.50 -0.77 -0.87 -0.90
Diff. 0.28 0.32***
(1.39) (3.06)
Year T+3
CN -0.02 2.57 1.01 0.00 -0.42 -0.62 -0.84 -0.91
US -0.17 1.26 0.50 0.13 -0.43 -0.67 -0.86 -0.94
Diff. 0.15 0.01
(1.01) (0.40)
Panel A: Annual buy-hold returns of CN RMs and U.S. RMs over the three years after the first 10-K filing
Results continue to hold after adjusting for RM’s domicile country market index return

Stanford Graduate School of Business
Mean 95th 90th 75th Median 25th 10th 5th
Year T+1
RM-CL 0.18 3.29 1.77 0.60 -0.08 -0.54 -1.23 -1.83
CN-CL (a) 0.04 2.89 1.88 0.92 0.16 -0.53 -1.23 -2.67
US-CL (b) 0.25 3.24 1.70 0.41 -0.18** -0.59 -1.17 -1.50
DID (a-b) -0.21 0.34*
Year T+2
RM-CL 0.17* 2.32 1.44 0.52 -0.03 -0.57 -0.87 -1.15
CN-CL (a) 0.23* 2.25 1.73 0.65 0.00 -0.58 -1.07 -1.31
US-CL (b) 0.17 2.93 1.44 0.45 -0.05 -0.53 -0.83 -0.93
DID (a-b) 0.06 0.05
Year T+3
RM-CL -0.06 1.62 0.91 0.29 -0.18*** -0.51 -0.88 -1.38
CN-CL (a) -0.02 1.90 1.15 0.25 -0.21*** -0.56 -0.90 -1.50
US-CL (b) -0.11 1.35 0.75 0.32 -0.15** -0.51 -0.88 -1.33
DID (a-b) 0.09 -0.06
Three-year
Cumulative
RM-CL 0.07 2.80 1.42 0.50 -0.05 -0.54 -1.02 -1.59
CN-CL (a) 0.07 2.80 1.67 0.58 0.03 -0.54 -1.12 -2.02
US-CL (b) 0.06 3.08 1.22 0.25 -0.10** -0.53 -1.00 -1.49
DID (a-b) 0.01 0.13*
Table 7. Diff-in-Diff Future Returns (CN RM vs. US RM)

Stanford Graduate School of Business
Appendix A. 32 Chinese RMs accused of fraud by the Media,
short-sellers, or SEC (from 1/1/2010 – 12/31/2012)
Name
Date of
reverse
merger
Last exchange
prior to
citation/report
Date of
trading halt
Added to
Pink Sheet
Delisted
(Form 25)
Registration
revoked by the
SEC
In sample?
Advanced Battery Technologies, Inc. 2004/04/21 NASDAQ 2011/11/15 2011/11/30 2011/12/16 - Yes
A-Power Energy Generation Systems, Ltd. 2007/02/09 NASDAQ 2011/06/27 2011/09/26 2012/04/13 - Noa
China Agritech, Inc. 2005/02/03 NASDAQ 2011/03/14 2011/05/20 2011/07/13 2012/10/17 Yes
China Integrated Energy, Inc. 2007/10/23 NASDAQ 2011/04/20 2011/06/15 2011/11/10 - Yes
China Century Dragon Media, Inc. 2010/04/30 AMEX 2011/03/21 2011/06/17 2011/10/07 - Yes
China Changjiang Mining & New Energy Company,
Ltd. 2008/02/04 OTCBB - 2011/04/07 - - Yes
China Education Alliance, Inc. 2004/12/13 NYSE 2011/12/21 2011/12/29 2012/01/11 - Yes
China Electric Motor, Inc. 2009/05/06 NASDAQ 2011/03/31 2011/06/14 2011/10/06 - Yes
China Green Agriculture, Inc. 2007/12/26 NYSE -d - - - Yes
China Intelligent Lighting and Electronics, Inc. 2010/01/15 AMEX 2011/03/24 2011/06/17 2011/07/19 - Yes
China Marine Food Group 2007/11/23 AMEX -e - - - Yes
China MediaExpress Holdings, Inc. 2009/10/15 NASDAQ 2011/03/11 2011/05/19 2011/12/16 2012/08/28 Noa
China North East Petroleum Holdings Limited 2004/03/29 AMEX 2012/03/01 2012/06/21 2012/07/06 - Noa
China Ritar Power Corp. 2007/02/16 NASDAQ 2011/04/18 2011/06/23 2011/07/05 - Yes
China Valves Technology, Inc. 2007/12/18 NASDAQ 2012/07/13 2012/09/21 2012/09/21 - Yes
China-Biotics, Inc. 2006/03/23 NASDAQ 2011/06/15 2011/07/01 2011/07/11 - Yes
CleanTech Innovations, Inc. 2010/07/02 NASDAQ 2011/03/02 2011/03/02 2011/12/16 - Yes
Duoyuan Printing, Inc. 2006/10/06 NYSE 2011/04/01 2011/04/04 2011/10/06 - Yes
Fuqi International, Inc. 2006/11/20 NASDAQ 2011/03/29 2011/03/29 2011/06/03 - Noa
Heli Electronics Corp. 2010/06/15 OTCBB - 2011/03/25 - 2012/03/02 Nob
Jiangbo Pharmaceuticals, Inc. 2007/10/01 NASDAQ 2011/05/31 2011/08/04 2011/10/06 - Yes
Keyuan Petrochemicals, Inc. 2010/04/22 NASDAQ 2011/04/01 2011/10/07 2012/04/13 - Yes
Maybe three years is not long enough for the effect of frauds to be
exposed… let’s extend our test to end of 2011

Stanford Graduate School of Business
Appendix A. 32 Chinese RMs accused of fraud in short-seller
report or a SEC citation (from 1/1/2010 – 12/31/2012)
Name
Date of
reverse
merger
Last exchange
prior to
citation/report
Date of
trading halt
Added to
Pink Sheet
Delisted
(Form 25)
Registration
revoked by the
SEC
In sample?
Nivs Intellimedia Technology Group, Inc. 2008/07/25 AMEX 2011/03/24 2011/06/23 2011/07/19 - Yes
Orient Paper, Inc. 2007/10/30 AMEX -f - - - Yes
Puda Coal, Inc. 2005/07/15 AMEX 2011/04/11 2011/08/18 2011/09/12 - Yes
RINO International Corp. 2007/10/05 NASDAQ 2010/11/17 2010/12/08 2010/12/20 - Yes
ShengdaTech, Inc. 2006/03/31 NASDAQ 2011/03/15 2011/06/10 2011/12/16 - Yes
Sino Clean Energy Inc. 2006/10/18 NASDAQ 2012/05/21 2012/09/25 - - Yes
Subaye, Inc. 12/21/2000 NASDAQ 2011/04/07 2011/06/24 2011/11/10 - Noc
Universal Travel Group 2006/07/12 NYSE 2011/04/11 2012/05/07 2012/04/26 - Yes
Wonder Auto Technology, Inc 2006/06/22 NASDAQ 2011/05/06 2011/09/12 2012/01/06 - Yes
Yuhe International, Inc. 2008/03/12 NASDAQ 2011/06/17 2011/07/21 2011/12/16 - Yes
• 26 firms (81.25%) were in our sample [6 firms (19%) had incomplete
data or the RM occurred prior to 2001].
• Most had their trading suspended were demoted to Pink Sheet.
• 3 firms accused by short-sellers never stopped trading and appear so
far to be “clean” (despite dramatic price drops on date of report).
• At least one delisted firm is counter-suing the SEC for wrongful
suspension.

Stanford Graduate School of Business
Table 8A. From Inception Date (Year T) to end of 2011
Venue Chinese RMs (146 RMs/CLs) U.S. RMs (251 RMs/CLs)
Year T 2011 Year T 2011
RMs or
CLs RMs CLs Diff.
RMs or
CLs RMs CLs Diff.
NMS 4.1% 42.5% 15.8% 26.7%*** 8.4% 15.9% 16.3% -0.4%
(5.25) (-0.12)
OTCBB 93.2% 18.5% 35.6% -17.1%*** 84.9% 27.1% 23.9% 3.2%
(-3.35) (0.82)
PINK 2.7% 34.2% 36.3% -2.1% 6.8% 41.8% 39.4% 2.4%
(-0.38) (0.55)
ACQ 3.4% 5.5% -2.1% 3.2% 7.2% -4.0%**
(-0.87) (-2.03)
DEAD 1.4% 6.8% -5.4%** 12.0% 13.1% -1.1%
(-2.35) (-0.37)
Total 100% 100% 100% 100% 100% 100%
Panel A: Distribution by exchange venue for RMs and CLs as of the end of 2011

Stanford Graduate School of Business
Table 8B. From Inception Date (Year T) to end of 2011
Mean 95th 90th 75th Median 25th 10th 5th
RM-CL 0.26 1.96 0.96 0.17 -0.02** -0.48 -1.03 -1.80
CN-CL 0.61 1.77 1.00 0.23 -0.01 -0.38 -1.00 -1.81
US-CL 0.12 2.20 0.95 0.16 -0.01** -0.50 -1.03 -1.72
Panel B: Cumulative stock return from inception to 2011

Summary
Key results
- RMs are Risky Investments. As a group, RMs tend to be
small, illiquid stocks that are highly prone to default and/or
bankruptcy (50% have Going Concern qualifications on Day 1)
- But so are the matched control firms. RMs are no worse
than other publicly listed firms on the same exchange:
Leverage, Liquidity, Profitability, Cash Flows, % Qualified
Opinion, Z-Score, Stock Returns (true initially, and also over
next three years). In fact, RMs fare slightly better than their
control groups overall.
- The Chinese RMs are generally healthier. The slightly better
performance of the RMs is due mainly to the Chinese RMs.
These firms fare much better than either their U.S. RM
counterparts, or their matched control firms. This is true on
Day 1, and also over each of the next three years.

Q & A?

Appendices

Stanford Graduate School of Business
Performance of Sample US RM Firms in Years T+1 to T+3
Some remarkably large negative ROAs… how does this happen?

Stanford Graduate School of Business
A Typical 10-K Form (Tree Top Industries, Inc., 31/12/2009)

Stanford Graduate School of Business
A Typical Qualified Audit Opinion (Appendix B)

Stanford Graduate School of Business
Stock Prices for Tree Top during 2008 and 2009 (from 10K)
Incredibly volatile stock prices (generating fat-tailed returns)

Stanford Graduate School of Business
Tree Top Inc.

Stanford Graduate School of Business
Tree Top Inc.
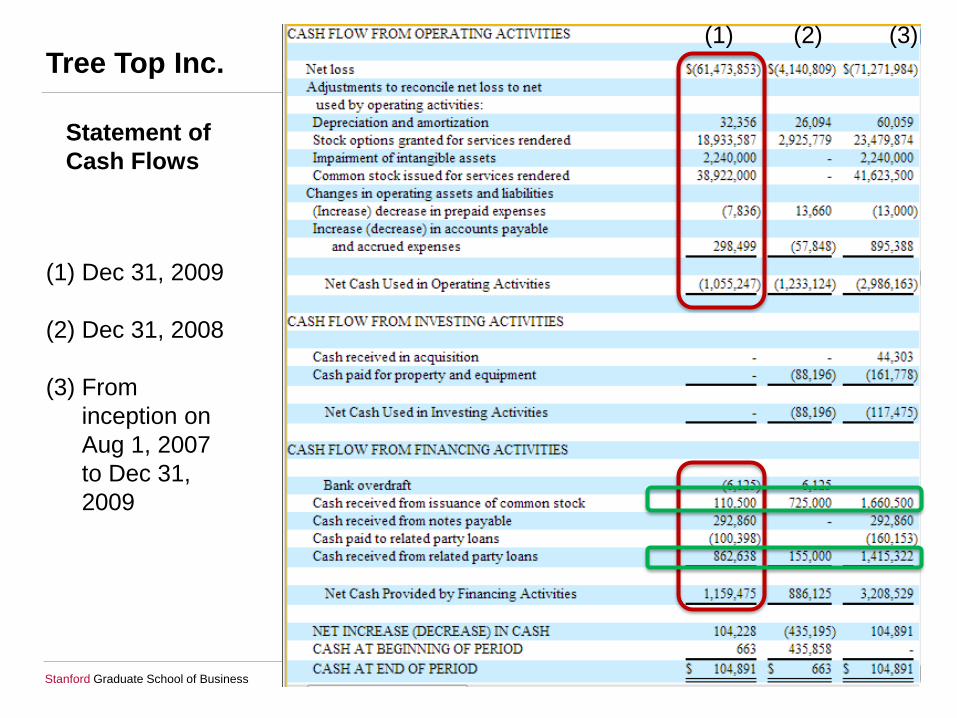
Stanford Graduate School of Business
Tree Top Inc.
Statement of
Cash Flows
(1) Dec 31, 2009
(2) Dec 31, 2008
(3) From
inception on
Aug 1, 2007
to Dec 31,
2009
(1) (2) (3)

Stanford Graduate School of Business
Tree Top Inc. (Income Statement)

Stanford Graduate School of Business
Sirricomm, Inc. 31/12/2005

Stanford Graduate School of Business
Sirricomm, Inc. 31/12/2005


Prior Studies
1. Literature on Reverse Mergers
2. The China Factor

Stanford Graduate School of Business
Literature on Reverse Mergers
Supply Side
• Studies on the business of investing in shell companies
• Floros and Sapp (2011), Gleason et al. (2005)
• Shell stocks experience high returns when a takeover
agreement is consummated
Demand Side
• Typically study the motivation for using RM vs. IPO
• Poulsen & Stegemoller (2005), Brau et al. (2003), Brown et
al. (2010), Adjei et al (2008)
• Find RM firms are smaller, younger, and a lot riskier
NOTE: Not clear RMs and IPOs are a fair comparison. RMs are earlier-
stage and more cash-strapped. An RM transaction does not have
guaranteed financing, and is typically much smaller. Aftermarket
liquidity is more problematic. In short, owners of private firm in a RM
have weak bargaining power (Chaplinsky & Haushlter (2011)

Stanford Graduate School of Business
The China Factor
Weak Corporate Governance
• Generally weak legal and financial infrastructure (Allen, Qian,
and Qian (2005), Piotroski and Wong (2012)
• Tunneling by majority blockholder (Jiang, Lee, and Yue (2010)
• Related Party Transactions (Jian and Wong (2010)
• Mix politics and markets (Piotroski and Zhang (2012)
• Moreover, the stronger Chinese firms will use an IPO, not RM
On the Other Hand…
• Extremely deep pool of IPO-eligible firms (Piotroski & Zhang
(2012))
• Limited access to VC and private equity financing
• Although RM is quicker and cheaper, it still has an assortment of
costs (SAFE-registration; SOX etc.; short-sellers)
BOTTOMLINE: Whether the Chinese RMs are inherently
worse is an open empirical question.