shelter from the storm: weather-induced patterns in …
TRANSCRIPT

www.policyschool.ca
Volume 8 • Issue 6 • February 2015
SHELTER FROM THE STORM: WEATHER-INDUCED PATTERNS IN THE USE OF EMERGENCY SHELTERS†
Ali Jadidzadeh and Ron Kneebone
SUMMARYIn Calgary, where winters are almost always long and temperatures can plummet below -30 C, it seems logical to assume that the highest rate of emergency-shelter use would occur on the coldest of days. On very cold days one might expect rough sleepers – those who for a variety of reasons sleep outdoors – to sleep in shelters. And yet, if social agencies were to operate on that assumption, and were to focus on significantly augmenting capacity on only bitterly cold days, the result could well be that not enough beds are made available when they are in fact needed.
The number of people using emergency shelters follows a more or less regular pattern over the course of a week, a month and a year. Weekends, for example, find fewer people using emergency shelters. Seasonal influences are also important as are major holidays and the timing of income support cheques.
An analysis of weather effects on emergency-shelter stays in the city of Calgary finds that the conditions that are most likely to move rough sleepers into shelter do not only occur during the depths of winter, but also during the so-called “shoulder seasons” of early spring and late fall. Weather related changes in the demand for shelter spaces is greatest when temperatures hover between 0 and -10 C, and when these temperatures are accompanied by wet snow or sleet. Those conditions can produce a temporary increase of 10 to 15 per cent over the average number of emergency-shelter users.
The importance of realistically estimating shelter use should not be understated. Emergency shelters are so named for a reason: When an extraordinary number of homeless people face an urgent need for shelter, it is critical that shelter operators not find themselves caught unawares, and left either scrambling to secure additional capacity or, worse, forced to turn away those in need. Being adequately prepared for significant spikes in shelter usage requires an understanding of what causes shelter use to vary and this requires an appreciation of the role of weather conditions.
Understanding that inclement weather in the spring and fall, when temperatures are only moderately below zero and wet snow or sleet is falling, drives large numbers of rough sleepers into shelters gives shelter operators the ability to better prepare for spikes in demand. Given the scarce resources available for shelter provisions, this improved preparation ensures enough beds are available at the times when they are most needed, and decreases the likelihood of potentially catastrophic outcomes.
† We thank the Alberta Ministry of Human Services for providing us access to data on homeless shelter stays. We also thank Meaghan Bell of the Calgary Homeless Foundation and representatives of shelter operators in Calgary for comments and the advice we received from them after presenting them an earlier draft. Finally, we are thankful for the helpful comments received from two anonymous reviewers. We of course remain entirely responsible for errors or omissions. Kneebone acknowledges the support of the Social Sciences and Humanities Research Council.

1
1. INTRODUCTION
The city of Calgary is a rapidly growing metropolitan area of over one million people with a very low unemployment rate and an average household income that is considerably higher than the Canadian average. It is also a city with a large population of people without homes; people typically referred to as the homeless. The size and the variability of the population of homeless persons in Calgary is considerably greater than that in Edmonton, a nearby city of similar size with similar unemployment rates and average income levels. Data on stays in government-funded homeless shelters show that in 2014 there were more than twice as many people using homeless shelters in Calgary than in Edmonton. As reported recently, Calgary is truly the epicentre of urban homelessness in Alberta making it an important focus of study.1
In this study we examine patterns in daily data describing the number of overnight stays in Calgary’s government-funded homeless emergency shelters from the period of January 1, 2008 to May 31, 2014. Our analysis is largely statistical in that we identify patterns of shelter use that vary by year, by month and by day of the week without attempting a detailed explanation for these patterns. After identifying these patterns, we turn our attention to what is our main focus namely, the role of weather conditions in determining the number of shelter stays. Here our focus is on measuring the flow of rough sleepers into and out of homeless shelters as weather conditions change.
Weather conditions have been examined for their influence on a wide variety of human behaviours including determining rates of crime,2 voting behaviour,3 and broad measures of health.4 In a study more directly related to ours, Brown et al.5 investigate the extent to which homeless persons visit hospital emergency departments as a means of escaping cold weather, and report no strong evidence to support this hypothesis.6 In a study relying on cross-section data from a large sample of U.S. metropolitan areas, Quigley and Raphael7 find that areas with milder winters experience higher levels of homelessness. We know of no studies that examine how variation in weather conditions over time in a particular metropolitan area influences the flow of rough sleepers into homeless shelters, and so we understand our examination to be unique.
Our analysis will inform shelter providers and government funders of the sensitivity of shelter use to weather conditions. Our results highlight how severe weather conditions can have a dramatic effect on shelter use. An implication is that, to avoid potentially catastrophic outcomes, shelter providers need to maintain a significant excess capacity, and government funding needs to be flexible enough to accommodate sometimes large but temporary increases in shelter use. We also show how our analysis can be used to supplement point-in-time counts and provide a more accurate measure of the total number of rough sleepers within a metropolitan area.
1 Jason Van Rassel, “Homeless numbers in Calgary remain steady despite city’s relentless growth,” Calgary Herald, November 20, 2014.
2 See, for example, an early study by Ellen Cohn (“Weather and Crime,” British Journal of Criminology 30, 1 (Winter, 1990)), who reports that incidents of assault, burglary, domestic violence and rape tend to rise with ambient temperature. In a more recent paper, Matthew Ranson (“Crime, Weather, and Climate Change,” Journal of Environmental Economics and Management 67 (2014)) links criminal behaviour to climate change.
3 See, for example, Brad Gomez, Thomas Hansford and George Krause, “The Republicans Should Pray for Rain: Weather, Turnout, and Voting in U.S. Presidential Elections,” The Journal of Politics 69, 3 (2007).
4 See, for example, Jonathan Patz, David Engelberg and John Last, “The Effects of Changing Weather on Public Health,” Annual Review of Public Health 21 (2000).
5 Alexander Brown, Steve Goodacre and Sue Cross, “Do Emergency Department Attendances by Homeless People increase in Cold Weather?”, Emergency Medicine Journal 27, 7 (2010).
6 That study examined data from Sheffield, U.K. for a period during which minimum temperatures never fell below -7 degrees Celsius. In Calgary, where, as we show later, temperatures often fall well below that level, point-in-time counts routinely include a survey of hospital emergency waiting rooms seeking to identify persons with no fixed address.
7 “The Economics of Homelessness: The Evidence from North America,” European Journal of Housing Policy 1, 3 (2001).

2
2. THE DATA ON EMERGENCY-SHELTER USE IN CALGARY
Our data set describes the number of overnight stays, per day, in homeless shelters in Calgary over the period January 1, 2008 to May 31, 2014 (a total of 2,343 daily observations). Our focus is on shelter stays defined as emergency stays in seven agencies. We do not include shelter stays defined as transitional, permanent supportive housing, or the stays in shelters prioritized for women fleeing domestic violence. The determinants of shelter use for those purposes differ from those determining the use of emergency shelter stays.8 Table 1 shows summary statistics on total stays in Calgary over our sample period.
TABLE 1 TOTAL STAYS, SUMMARY STATISTICS (2008–2014)
Minimum Median Mean Maximum
1095 1595 1633 2265
Figure 1 plots our data on nightly shelter stays. The lightly shaded and unshaded areas identify the calendar years 2008 to 2014, inclusive. The smooth red line is a fourth-order polynomial trend line.
FIGURE 1 DAILY SHELTER STAYS IN CALGARY, JANUARY 2008 TO MAY 2014
8 The seven agencies are the Calgary Drop-In Centre (899), Salvation Army (221), Alpha House (112), Mustard Seed (299), YWCA (4), Inn from the Cold (58) and Brenda’s House (38). The average number of daily emergency stays in each shelter over our sample period is reported in brackets. Not included in our study are stays defined as transitional or permanent supportive housing provided by the Calgary Drop-In Centre (an average of 169 stays per night over our sample), in the Calgary Dream Centre (116) and Peter Coyle Place (69). We also exclude those beds at the YWCA (76) that are typically prioritized for women fleeing domestic violence.

3
Immediately obvious is the variability in shelter use. Shelter use is by no means constant either over long periods, over the course of a year or, digging deeper, over the course of a month or a week. Our goal is to identify how shelter use varies over each of these time dimensions and to examine the role of weather conditions in determining shelter use.
3. DETERMINANTS OF EMERGENCY-SHELTER USE IN CALGARY
3.1 Long-Term Trends
The long-run pattern observed in Figure 1 shows shelter stays increasing in 2009 relative to 2008, falling in 2010 and 2011, and moving more or less slowly upward since. Kneebone, Emery and Grynishak9 note this long-term pattern in shelter use and show how it is closely correlated with movements in Calgary’s share of provincial and national employment. Those employment shares, calculated using monthly data, similarly increased during 2009, fell to a low in 2011, and have increased slowly since then.10
In the absence of daily data on employment shares, our analysis relies upon a fourth-order polynomial of time trends to capture the influence of slowly changing conditions affecting shelter use. As suggested by the study of Kneebone, Emery and Grynishak, these changing conditions are likely due to changes in local employment conditions relative to elsewhere, combined with a very tight market for rental accommodations. Thus, a rapidly growing local economy attracts in-migrants who find Calgary to have a shortage of affordable housing. The result is an increase in shelter use. The 2009 recession and its aftermath temporarily halted the in-migration and so lessened the pressure on shelters during 2010 and 2011. Shelter use began to trend back upward with the return of stronger employment growth in Calgary relative to elsewhere.
3.2 Seasonal and Daily Trends
The effect of de-trending our data on total shelter stays using the fourth-order polynomial of time trends is shown in Figure 2. The pattern of shelter stays that result after removing the variation due to influences felt over the long term suggests a stationary process. Formal tests for stationarity confirm this is the case.11 This is important for deriving reliable measures of the influence of other determinants of shelter stays.
9 “Homelessness in Alberta: The Demand for Spaces in Alberta’s Homeless Shelters,” University of Calgary School of Public Policy Research Paper 4, 13 (September 2011), http://policyschool.ucalgary.ca/sites/default/files/research/homelessness-alberta_0.pdf.
10 Employment shares are calculated using Statistics Canada’s CANSIM series v2054718 (Calgary), v2054740 (Alberta) and v2054731 (Canada). These data are monthly and seasonally unadjusted.
11 Test results are reported in the Appendix.

4
FIGURE 2 DE-TRENDED TOTAL STAYS
The variation in shelter use that occurs over the course of a year and even over the course of a month suggests the possibility of more rapidly changing conditions that affect shelter use. We investigate the possible existence of seasonal influences and influences that vary by day of the week with the use of dummy variables. Seasonal influences may reflect the movement of transient workers moving into and out of the Calgary labour market in response to seasonal employment opportunities. Seasonal influences may also arise due to weather conditions causing those who are homeless and prefer to sleep outdoors (rough sleepers) to enter and leave shelters. We will identify the separate influence of weather conditions from other seasonal influences in a way described below. In discussions with us, shelter providers emphasized the significant number of shelter users who are employed, raising the possibility of lower shelter use on weekends following the receipt of paycheques.

5
3.3 Weather-Induced Shelter Use
For privacy, security or other reasons, a person without a residence may sleep outdoors and so will avoid staying in a homeless shelter. The preference for sleeping outdoors is, we assume, influenced by weather conditions. In particular, we assume that sufficiently cold nighttime temperatures and sufficient amounts of rain or snow will, all else being equal, cause a person without a home to choose to sleep in a shelter as opposed to sleeping outdoors.12,13
Point-in-time counts are infrequent counts of the number of persons experiencing homelessness.14 They typically involve a large number of volunteers who scour the city, at a time late at night when shelters have closed their doors, looking for rough sleepers. It is hoped that adding the number of rough sleepers found in this way to the number of people without fixed address reported as occupying shelters, jails and hospitals, will provide a reasonably accurate snapshot of the total number of persons living without a home in the metropolitan area.
As this description suggests, the information gained from a point-in-time count, over simply canvassing among shelter operators, hospitals and the justice system for the number of people in their care having no fixed address, is limited to identifying the number of rough sleepers. What this description also makes clear is that the information so gained on the number of rough sleepers is only a snapshot and only relevant for the night of the count.
To gain a better picture of the number of rough sleepers and how their number might vary over the course of a year, we test the sensitivity of shelter stays to weather conditions. Our expectation is that, as weather conditions deteriorate — whether in the form of colder temperatures, precipitation and/or both — those without permanent shelter whose preference is to sleep outdoors will instead stay in homeless shelters. By identifying the sensitivity of shelter stays to weather conditions, we can establish movements of rough sleepers into and out of shelters as weather conditions change.
3.3.1 Weather Data
Daily data on weather conditions are available from Environment Canada.15 Two weather stations provide relevant data. The “Calgary Int’l A” station provides a full set of the weather variables we employ from January 1, 2008 to July 11, 2012. The “Calgary Int’l CS” station provides data for the remainder of our estimation period. Unfortunately, we do not have a complete series reporting the amount of rain and snow and must rely only on a measure of total precipitation. As we discuss below, the different influences of snow versus rain on the decision of rough sleepers is something we can infer from our estimation.
12 Evidence provided by Isobel Anderson, Peter Kemp, and Deborah Quilgars (Single homeless people (London: HM Stationery Office1993)) indicates that only a “hard core” of people sleep rough for long periods; many more homeless people will sleep rough at some times but move into shelter at other times. We assume weather conditions contribute to this adjustment. The idea of a “hard core” of rough sleepers finds support in the work of Larissa Larsen, Ernie Pootinga and Donna Hurdle (“Sleeping Rough: Exploring the Differences between Shelter-Using and Non-Shelter-Using Homeless Individuals,” Environment and Behavior 36, 4 (2004)) who provide evidence that rough sleepers have characteristics that are significantly different from those of shelter users.
13 Other factors influencing this decision might include bylaw enforcement of the type that makes sleeping rough more difficult. The stringency of bylaw enforcement might change by year (with changes in enforcement policies), month (enforcement might increase as weather conditions deteriorate) and possibly by day of the week. We assume such considerations are captured by our month and day dummy variables.
14 In Calgary, point-in-time counts have been held biannually since 1992.15 http://climate.weather.gc.ca/.

6
Our temperature variable measures the minimum daily temperature, measured in degrees Celsius, observed at a weather station that day. Our precipitation variable measures, in millimetres, the total precipitation that fell that day (whether rain or snow). Figure 3 plots our data on daily precipitation, while in Figure 4 we plot our data on minimum daily temperature.
3.3.2 Temperature Dummies
Although our data on temperatures are continuous, we elect to measure the influence of the daily minimum temperature on the decisions of rough sleepers through the use of dummy variables defining ranges of temperatures. We define five dummy variables identifying temperature ranges relevant to the decision of whether to sleep outdoors or not. Our choice of definition of “extreme” cold is broadly based on calculations made by Environment Canada showing combinations of temperature and wind speed resulting in a heightened risk of frostbite for most people.16 Assuming a low wind speed (10 km/h), these calculations show that for most people there is high risk of frostbite after two to five minutes when the temperature is -30 C or less. Assuming the same low wind speed, a high risk of frostbite requires twice the time of exposure (five to 10 minutes) when the temperature is lower than -20 C. Higher wind speeds at the same temperature increase wind chill and lower the time to frostbite. It is important to recognize that Environment Canada’s measures identify the risk for people dressed more or less appropriately for the weather and who we assume are healthy and in good physical condition. Our definitions can therefore only offer a rough calculation of when sleeping outdoors becomes particularly dangerous to rough sleepers. Our temperature dummy variables are defined as;
TEMP1 = “fair” temperature threshold, 0 C < overnight low temperature ≤ +10 C.
TEMP2 = “low” temperature threshold, -10 C < overnight low temperature ≤ 0 C.
TEMP3 = “moderate” temperature threshold, -20 C < overnight low temperature ≤ -10 C.
TEMP4 = “cold” temperature threshold, -30 C < overnight low temperature ≤ -20 C.
TEMP5 = “extreme” temperature threshold, overnight low temperature ≤ -30 C.
Our choice of temperature ranges is also influenced by information from shelter providers, who indicate that it is only when the overnight temperature falls to lower than -10 C that they allow entry to clients previously banned from the shelter for disruptive behaviour. Anecdotal evidence suggests that police and bylaw-enforcement officers similarly adjust their decision about whether to incarcerate homeless violators of so-called public-nuisance bylaws when temperatures fall below -15 C.
16 See http://www.candac.ca/candac/Outreach/Teacher_Resources_Index/tri/31.pdf. The wind-chill index is based on the loss of heat from the face of volunteers dressed in winter clothing. Although Environment Canada has recently begun to report wind-chill measures, these measures are not available historically.

7
FIGURE 3 DAILY PRECIPITATION
FIGURE 4 DAILY MINIMUM TEMPERATURE

8
3.4 Other Determinants of Shelter Stays
Other potential explanations for the variation in shelter stays are included in our analysis. Thus we include a dummy variable (Cheque) taking a value of one on the date when social assistance cheques are made available and for each of the five days following.17 We also test for the statistical significance of a dummy variable (Stampede) that identifies a period of time during which low-skilled jobs become available during the major 10-day Calgary Stampede summer fair.18 The dummy variable Christmas identifies December 24–26 inclusive and is included on the possibility that the holidays influence shelter stays. Finally, we define Flood as a dummy variable identifying the period from June 23 to July 7, 2013, when a significant amount of rain combined with unusual conditions associated with the snow melt in the nearby Rocky Mountains caused a flood of much of downtown Calgary and required the closing of five homeless shelters.19 The influence of those closures on shelter use is evident in Figure 1 by the noticeable downward spike observed in July 2013.
4. ESTIMATION
Table 2 presents parameter estimates of our model for a variety of specifications. The dependent variable in all specifications is the number of stays in Calgary emergency shelters. The dependent variable and the Precipitation variable are continuous variables; all other variables are dummies as described above. In all regression specifications, the omitted monthly dummy variable is June, while the omitted daily dummy variable is Tuesday. Prior testing showed June to be associated with the smallest number of shelter users and Tuesday to be associated with the largest number of shelter users. The decision to omit the June and Tuesday dummy variables was to facilitate an easy interpretation of the estimated coefficients. The omitted temperature dummy variable is one defining overnight temperatures above 10 C.
Our preferred model is (4) and it is the implications of the coefficients from that model that we discuss below. Except for excluding the Stampede dummy, which proved to not significantly statistically differ from zero, this is also our most general model. With the exception of the Christmas dummy, adding and deleting variables had no noticeable influence on other coefficients.
We observe in these coefficients a strong pattern of variation in shelter use both by day of the week and by month of the year. In particular, there is no significant difference in shelter stays on Monday, Tuesday and Wednesday, but on other days of the week, shelter use is lower by a statistically significant amount. This is particularly true on Fridays and Saturdays when shelter stays are lower than they are on Tuesday (the omitted variable) by 93 and 78 clients, respectively. This variation between Tuesday and Friday is equal to about five per cent of average shelter stays over our sample period.
17 Two programs are relevant: Alberta Works provides income support to Albertans who do not have the resources to meet their basic needs. The Assured Income for the Severely Handicapped (AISH) program provides financial and health-related assistance to eligible adults with a disability. Alberta Works and AISH cheques are made available on the 27th or 28th of the month.
18 The Calgary Stampede is a major fair that employs approximately 3,500 temporary workers for a 10- to 14-day period in early July. Our dummy variable identifies dates spanning the period three days before the opening of the fair to three days following the close of the fair.
19 The Drop-In Centre, Salvation Army, Alpha House, Inn from the Cold and YWCA.

9
TABLE 2 OLS PARAMETER ESTIMATES (JANUARY 2008-MAY 2014)
(1) (2) (3) (4)
Intercept 1347.067(0.000)
1332.253(0.000)
1337.404(0.000)
1340.911(0.000)
Saturday -79.802(0.000)
-78.928(0.000)
-77.163(0.000)
-77.870(0.000)
Sunday -13.267(0.029)
-11.861(0.047)
-13.628(0.018)
-14.148(0.014)
Monday -1.375(0.821)
-0.550(0.927)
-0.653(0.910)
-0.186(0.974)
Wednesday -1.711(0.778)
-1.094(0.855)
-0.798(0.890)
-1.186(0.837)
Thursday -16.753(0.006)
-17.558(0.003)
-18.463(0.001)
-18.931(0.001)
Friday -95.079(0.000)
-94.638(0.000)
-92.932(0.000)
-93.000(0.000)
January 113.703(0.000)
125.180(0.000)
125.578(0.000)
125.690(0.000)
February 113.703(0.000)
124.696(0.000)
122.523(0.000)
123.220(0.000)
March 110.867(0.000)
121.055(0.000)
126.011(0.000)
125.669(0.000)
April 92.938(0.000)
100.639(0.000)
100.642(0.000)
98.525(0.000)
May 42.765(0.000)
46.195(0.000)
48.882(0.000)
47.857(0.000)
July 4.088(0.641)
7.938(0.358)
11.316(0.176)
10.707(0.199)
August 9.487(0.273)
15.306(0.073)
17.500(0.034)
16.385(0.047)
September 30.378(0.000)
39.878(0.000)
39.649(0.000)
38.861(0.000)
October 76.078(0.000)
85.933(0.000)
88.458(0.000)
87.887(0.000)
November 87.007(0.000)
97.583(0.000)
97.592(0.000)
97.575(0.000)
December 43.558(0.000)
53.501(0.000)
68.813(0.000)
68.228(0.000)
TEMP1 (“fair”) 0.485(0.938)
0.335(0.957)
1.952(0.744)
-0.765(0.903)
TEMP2 (“low”) 34.255(0.000)
34.975(0.000)
36.116(0.000)
31.140(0.000)
TEMP3 (“moderate”) 53.390(0.000)
53.515(0.000)
54.496(0.000)
48.481(0.000)
TEMP4 (“cold”) 69.493(0.000)
69.659(0.000)
74.396(0.000)
72.872(0.000)
TEMP5 (“extreme”) 142.295(0.000)
143.025(0.000)
138.523(0.000)
133.619(0.000)
Precipitation 3.908(0.000)
3.758(0.000)
2.399(0.001)
TEMP1*Precip 1.377(0.139)
TEMP2*Precip 4.677(0.001)
TEMP3*Precip 6.351(0.084)
TEMP4*Precip -3.040(0.640)
TEMP5*Precip 7.231(0.903)
Flood -269.651(0.000)
-264.946(0.000)
-252.210(0.000)
-254.687(0.000)
Christmas -132.724(0.000)
-131.726(0.000)
Cheque -42.722(0.000)
-43.067(0.000)
R2
adj-R2
F-stat.
0.8180.816
386.403(0.000)
0.8250.822
388.439(0.000)
0.8360.834
393.349(0.000)
0.8370.835
338.604(0.000)
All specifications include trend, trend2, trend3 and trend4 terms. p-values are reported in brackets. N = 2,343.

10
There is also noticeable variation in shelter stays by month of the year. Except for July, average monthly shelter stays are significantly greater in every month of the year relative to June (the omitted variable). During January, February and March there are an additional 123 to 126 nightly stays in shelters relative to June.
In specifications (1) and (2) we note a significantly smaller number of stays in December relative to surrounding months. This suggests an influence from the Christmas holiday. This influence is confirmed by the statistical significance of the Christmas dummy and the change in the dummy variable for December that results from its addition. Our estimates suggest that 132 clients — about eight per cent of the average emergency-shelter population — leave the shelter system for the three days surrounding the holiday.
The influence of the receipt of social assistance cheques (Cheque) on emergency-shelter stays is also statistically significant. Our results show that during the week after receiving income assistance cheques, 43 persons (about three per cent of the average number of shelter stays) who would otherwise use shelters leave them, presumably in favour of paid accommodations.
Our model shows that as the minimum daily temperature falls, the number of people using shelters increases. The fact that the coefficient on our TEMP1 dummy has a value that is insignificantly different from zero indicates that the low overnight temperature must fall below 0 C before rough sleepers are observed to move into shelters. The relationship of shelter stays with weather is non-linear in the sense that, after the low overnight temperature falls below zero, every additional 10 degree Celsius fall in temperature has a larger impact on shelter stays than the previous 10 degree Celsius fall in temperature. Thus, when the minimum overnight temperature falls from what we call the “fair” range of temperatures to the “low” range of temperatures, 31 persons we presume are sleeping on the street now move into shelters. When temperatures fall again (from the “low” to the “moderate” range), 48 rough sleepers move into shelters. A further drop of 10 degrees causes 73 rough sleepers indoors, and should temperatures fall still further into the “extreme” range, 134 rough sleepers will have moved indoors. When temperatures fall to the “extreme” range then, the number of shelter users increases by about eight per cent.
Precipitation proves to be a highly statistically significant explanatory variable in all specifications suggesting that rough sleepers are sensitive to rain and snow as well as to cold. The estimated coefficient on Precipitation suggests that, assuming an overnight low temperature in excess of 10 C, every millimetre of precipitation prompts 2.4 rough sleepers to move into shelters. During a night of heavy rain, when 25 mm of rain falls, we might expect over 60 rough sleepers (about four per cent of average stays) to move into shelters.20 A rainstorm of 30 to 40 mm of rain on a warm night can therefore have an important impact on the number of stays in emergency shelters.
Our preferred model allows for the possibility of an interaction of temperature and precipitation on shelter stays. For low overnight temperatures between 0 C and -10 C, the addition of precipitation — which at these temperatures would fall in the form of wet snow or sleet — to these low temperatures causes an additional movement of rough sleepers into shelters. The statistical insignificance of the interaction variables when the minimum overnight temperature is below -10 C suggests that, when it is very cold, adding precipitation — which at these temperatures will be in the form of snow — does not additionally affect the decision of rough sleepers to move indoors.
20 Twenty-five millimetres is equivalent to one inch of rain. During our sample period, this much precipitation fell in a single day 37 times. Half of these times occurred during the period from June 21 to July 3, 2013, when much of downtown Calgary was flooded. We account for this period with a separate dummy variable, Flood.
11
5. IMPLICATIONS FOR SHELTER USE
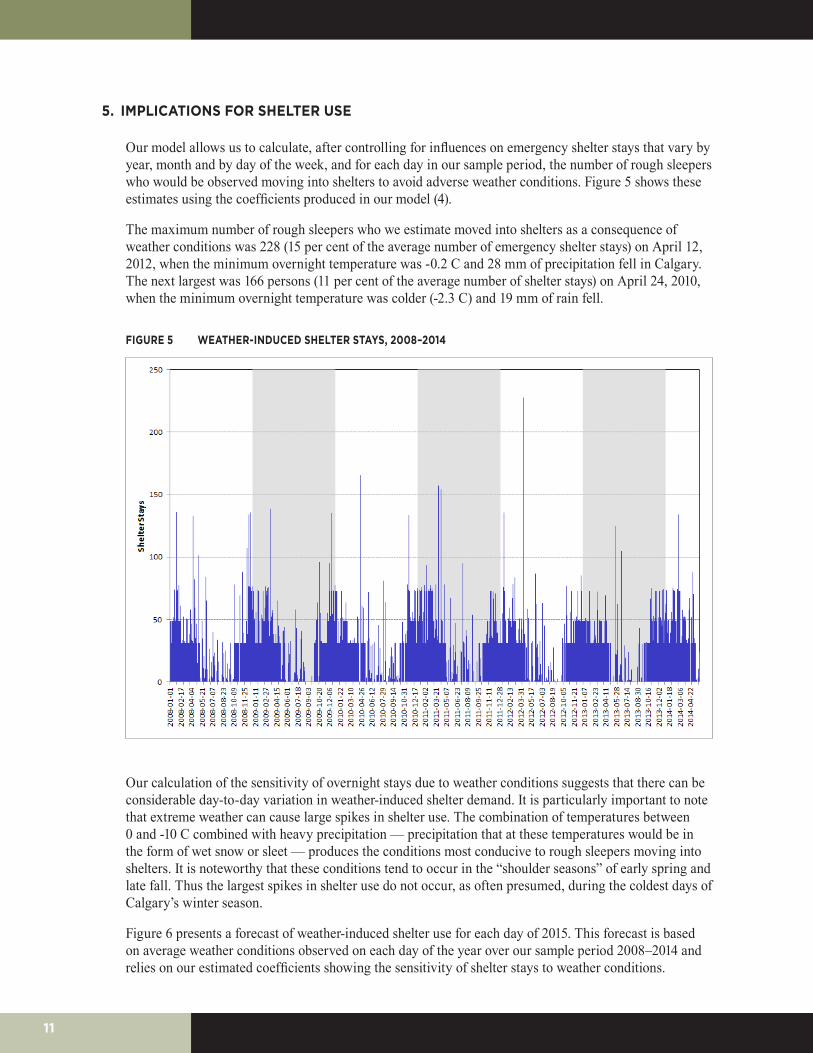
Our model allows us to calculate, after controlling for influences on emergency shelter stays that vary by year, month and by day of the week, and for each day in our sample period, the number of rough sleepers who would be observed moving into shelters to avoid adverse weather conditions. Figure 5 shows these estimates using the coefficients produced in our model (4).
The maximum number of rough sleepers who we estimate moved into shelters as a consequence of weather conditions was 228 (15 per cent of the average number of emergency shelter stays) on April 12, 2012, when the minimum overnight temperature was -0.2 C and 28 mm of precipitation fell in Calgary. The next largest was 166 persons (11 per cent of the average number of shelter stays) on April 24, 2010, when the minimum overnight temperature was colder (-2.3 C) and 19 mm of rain fell.
FIGURE 5 WEATHER-INDUCED SHELTER STAYS, 2008–2014
Our calculation of the sensitivity of overnight stays due to weather conditions suggests that there can be considerable day-to-day variation in weather-induced shelter demand. It is particularly important to note that extreme weather can cause large spikes in shelter use. The combination of temperatures between 0 and -10 C combined with heavy precipitation — precipitation that at these temperatures would be in the form of wet snow or sleet — produces the conditions most conducive to rough sleepers moving into shelters. It is noteworthy that these conditions tend to occur in the “shoulder seasons” of early spring and late fall. Thus the largest spikes in shelter use do not occur, as often presumed, during the coldest days of Calgary’s winter season.
Figure 6 presents a forecast of weather-induced shelter use for each day of 2015. This forecast is based on average weather conditions observed on each day of the year over our sample period 2008–2014 and relies on our estimated coefficients showing the sensitivity of shelter stays to weather conditions.

12
FIGURE 6 FORECAST OF WEATHER-INDUCED SHELTER STAYS IN 2015
The difference in the vertical scale of figures 5 and 6 shows the importance of unusual weather conditions — that is, days that are unusually cold or wet relative to the average conditions for that day — for weather-induced shelter stays.
FIGURE 7 FORECAST OF SHELTER STAYS IN 2015

13
Finally, our model can also be used to forecast total shelter stays for each day of the year. Figure 7 presents these calculations.21 Here, variation reflects the influence of predicted weather conditions, the seasonality in shelter use, and the variation in shelter by day of the week, as a consequence of receiving social assistance cheques and the effects of the Christmas holiday.
6. POINT-IN-TIME COUNTS
As noted earlier, point-in-time counts can only identify the number of rough sleepers who have chosen to remain on the street on the night of the count. Our model suggests that, depending on weather conditions, some of those who would otherwise choose to sleep rough may have moved into shelters. An interesting use of our model then, is to supplement the reports of point-in-time counts with calculations reporting the number of rough sleepers who, on that night, have chosen instead to leave the street.
The first row of Table 3 reports the number of rough sleepers counted by volunteers on the nights of point-in-time counts over the period 2008 to 2014. On the night of the point-in-time count of January 18, 2012, the minimum overnight temperature was -32.4 C with a negligible 0.2 mm of precipitation. Volunteers counted 64 rough sleepers that night. Thus, by our model (4), on that night there were 64 rough sleepers who, despite the cold, remained on the street and were found by count volunteers, and 134 others whose preference is normally to sleep outdoors rather than in shelters but on that night had moved into shelters. In early 2012 then, our model suggests there were a total of 198 persons in Calgary without homes and with a preference for sleeping outdoors, weather permitting.
TABLE 3 POINT-IN-TIME COUNTS OF ROUGH SLEEPERS IN CALGARY
May 14/08 Jan. 18/12 Aug. 15/12 Jan. 15/14 Oct. 16/14
Point-in-Time Count of Rough Sleepers 569 64 333 215 158
Minimum Temperature (C) 7.6 -32.4 8.5 -0.3 3.4
Precipitation (mm) 0 0.2 0 0 0
Rough Sleepers Predicted to Have Been in Shelters 0 134 0 0 0
Predicted Total Number of Rough Sleepers 569 198 333 215 158
Source: The number of rough sleepers counted in point-in-time counts is from the Calgary Homeless Foundation website (http://calgaryhomeless.com/).
On the other dates when point-in-time counts were held, the minimum overnight temperature was warmer than levels that our model predicts will cause rough sleepers to move into shelters and there was no precipitation. Our best guess as to the number of rough sleepers is then the number counted in the point-in-time counts.
The results in Table 3 are suggestive that the number of rough sleepers who stay in Calgary may change during the year. The results suggest that in the winter months there are a total number of about 200 rough sleepers staying in the city. During the summer months there may be an influx into the city of homeless persons who prefer to sleep outdoors.
21 To produce this forecast, we set the intercept in our model to be the average number of shelter stays observed in 2013. We also delete the influence of our time trends and so assume no influence from slowly changing determinants of shelter use, such as changes in labour-market and rental-market conditions.

14
7. CONCLUDING COMMENTS
The number of overnight stays in homeless shelters varies over time and does so for a number of reasons. In this study, we identify the influence on emergency-shelter use of determinants that vary by year, by month, by day of the week, due to the timing of holidays and payments of income supports, and due to changes in weather conditions. We note that annual variations in shelter stays in Calgary conform to the results of previous studies. In particular, long-term variation in shelter use appears to be closely associated with conditions in the labour market and the availability of rental accommodations.22 We also note that the variations in shelter use we identify as occurring by month, by day of the week and by holidays and the timing of income support payments conforms to the anecdotal evidence provided by shelter operators.
Our focus has been on the role that weather conditions play in causing rough sleepers to move temporarily into shelters who would, weather permitting, prefer to sleep outdoors. We have estimated the number of rough sleepers who move into shelters by temperature ranges. When overnight temperatures fall to extreme levels, the number of rough sleepers who have moved into shelters is equal to about seven per cent of the average number of overnight shelter stays. Precipitation is also found to play an important role in causing rough sleepers to escape the weather. An important result from our analysis is that the combination of mild winter temperatures (between 0 C and -10 C) and precipitation — which, at this temperature, falls in the form of wet snow or sleet — has a particularly strong effect on moving rough sleepers indoors. Those conditions have, in the past, caused very large movements of rough sleepers into shelters; a temporary but unexpected inflow equal to 10 to 15 per cent of the average number of shelter users. Interestingly, the largest weather-induced spikes in shelter use come during the so-called “shoulder seasons” of early spring and late fall and not, as one might presume, during the coldest days of winter.
We show how our model can be used to forecast weather-induced shelter use in the future. Since it relies on the average weather conditions by day of the year, our forecast cannot predict unusual weather conditions. Its usefulness is therefore limited to illustrating during what part of the year availability of excess capacity in government-funded shelters is most important for avoiding potentially catastrophic outcomes.
Finally, we show how our model can be used to supplement the information collected during point-in-time counts. In particular we show how, when counts take place during cold or wet periods, our model can be used to provide a more accurate count of the number of rough sleepers.
22 Examining the influence of these considerations more closely is a separate project that would benefit from having data spanning a period of time longer than the period examined here (2008–14).

15
APPENDIX
We conduct unit root tests of different types including the “Pt” unit root test suggested by Ng and Perron.23 All tests show that the time series of total shelter stays is integrated of order one, I(1). De-trended total shelter stays using the fourth-order polynomial of time trends are I(0). The result of the ADF tests is summarized in Table A.1
TABLE A.1. ADF UNIT ROOT TEST
Variable Lags Test value Critical values
1% 5% 10%
TSSt
𝑇𝑇𝑇𝑇𝑇𝑇𝑇𝑇𝑇𝑇t
14 -2.929 -3.96 -3.41 -3.13
TSSt
𝑇𝑇𝑇𝑇𝑇𝑇𝑇𝑇𝑇𝑇t 14 -4.972 -3.96 -3.41 -3.13
Note: Null Hypothesis: there is a unit root.
23 Serena Ng and Pierre Perron, “Lag Length Selection and the construction of Unit Root Tests with Good Size and Power,” Econometrica 69, 6 (November 2001).

16
About the Authors
Dr. Ron Kneebone is a Professor of Economics and Director of Economic & Social Policy in The School of Public Policy, both at the University of Calgary. His published research has dealt with issues pertaining to the political economy of government deficit and debt reduction, the history of government fiscal and monetary relations in Canada and the characteristics of Canadian federal, provincial and municipal fiscal policy choices. More recently, his research has examined issues pertaining to the problem of homelessness and income support for persons with disabilities.
Ali Jadidzadeh is a PhD candidate in the Department of Economics at the University of Calgary. His research in applied econometrics along with his interest in public policies have resulted in applying his statistical skills to aid the homeless.

17
ABOUT THE SCHOOL OF PUBLIC POLICY
The School of Public Policy will become the flagship school of its kind in Canada by providing a practical, global and focused perspective on public policy analysis and practice in areas of energy and environmental policy, international policy and economic and social policy that is unique in Canada.
The mission of The School of Public Policy is to strengthen Canada’s public service, institutions and economic performance for the betterment of our families, communities and country. We do this by:
• Building capacity in Government through the formal training of public servants in degree and non-degree programs, giving the people charged with making public policy work for Canada the hands-on expertise to represent our vital interests both here and abroad;
• Improving Public Policy Discourse outside Government through executive and strategic assessment programs, building a stronger understanding of what makes public policy work for those outside of the public sector and helps everyday Canadians make informed decisions on the politics that will shape their futures;
• Providing a Global Perspective on Public Policy Research through international collaborations, education, and community outreach programs, bringing global best practices to bear on Canadian public policy, resulting in decisions that benefit all people for the long term, not a few people for the short term.
Our research is conducted to the highest standards of scholarship and objectivity. The decision to pursue research is made by a Research Committee chaired by the Research Director and made up of Area and Program Directors. All research is subject to blind peer-review and the final decision whether or not to publish is made by an independent Director.
The School of Public PolicyUniversity of Calgary, Downtown Campus906 8th Avenue S.W., 5th FloorCalgary, Alberta T2P 1H9Phone: 403 210 7100
DISTRIBUTIONOur publications are available online at www.policyschool.ca.
DISCLAIMERThe opinions expressed in these publications are the authors' alone and therefore do not necessarily reflect the opinions of the supporters, staff, or boards of The School of Public Policy.
COPYRIGHTCopyright © 2015 by The School of Public Policy. All rights reserved. No part of this publication may be reproduced in any manner whatsoever without written permission except in the case of brief passages quoted in critical articles and reviews.
ISSN1919-112x SPP Research Papers (Print) 1919-1138 SPP Research Papers (Online)
DATE OF ISSUEFebruary 2015
MEDIA INQUIRIES AND INFORMATIONFor media inquiries, please contact Morten Paulsen at 403-453-0062. Our web site, www.policyschool.ca, contains more information about The School's events, publications, and staff.
DEVELOPMENTFor information about contributing to The School of Public Policy, please contact Courtney Murphy by telephone at 403-210-7201 or by e-mail at [email protected].

18
RECENT PUBLICATIONS BY THE SCHOOL OF PUBLIC POLICY
THE DISTRIBUTION OF INCOME AND TAXES/TRANSFERS IN CANADA: A COHORT ANALYSIShttp://policyschool.ucalgary.ca/?q=content/distribution-income-and-taxestransfers-canada-cohort-analysisDaria Crisan, Kenneth McKenzie and Jack Mintz | February 2015
THE 2014 GLOBAL TAX COMPETITIVENESS REPORT: A PROPOSED BUSINESS TAX REFORM AGENDAhttp://policyschool.ucalgary.ca/?q=content/2014-global-tax-competitiveness-report-proposed-business-tax-reform-agendaDuanjie Chen and Jack Mintz | February 2015
WHAT DEPENDENCY ISSUES? RE-EXAMINING ASSUMPTIONS ABOUT CANADA'S RELIANCE ON THE U.S. EXPORT MARKEThttp://policyschool.ucalgary.ca/?q=content/what-dependency-issues-re-examining-assumptions-about-canadas-reliance-us-export-marketEugene Beaulieu and Yang Song | January 2015
BENDING THE MEDICARE COST CURVE IN 12 MONTHS OR LESS: HOW PREVENTATIVE HEALTH CARE CAN YIELD SIGNIFICANT NEAR-TERM SAVINGS FOR ACUTE CARE IN ALBERTAhttp://policyschool.ucalgary.ca/?q=content/bending-medicare-cost-curve-12-months-or-less-how-preventative-health-care-can-yield-signifiDaniel Dutton, J.C. Herbert Emery, Thomas Mullie, and Jennifer Zwicker | January 2015
POTASH TAXATION: HOW CANADA'S REGIME IS NEITHER EFFICIENT NOR COMPETITIVE FROM AN INTERNATIONAL PERSPECTIVEhttp://policyschool.ucalgary.ca/?q=content/potash-taxation-how-canadas-regime-neither-efficient-nor-competitive-international-perspectiDuanjie Chen and Jack Mintz
ON UNCERTAIN ICE: THE FUTURE OF ARCTIC SHIPPING AND THE NORTHWEST PASSAGEhttp://policyschool.ucalgary.ca/?q=content/uncertain-ice-future-arctic-shipping-and-northwest-passageAdam Lajeunesse and Whitney Lackenbauer | December 2014
AN INTERNATIONAL COMPARISON OF ASSISTANCE FOR RESEARCH AND DEVELOPMENThttp://policyschool.ucalgary.ca/?q=content/international-comparison-assistance-research-and-developmentJohn Lester and Jacek Warda | November 2014
EXEMPT MARKET REGULATIONS MAY DO MORE HARM THAN GOODhttp://policyschool.ucalgary.ca/?q=content/exempt-market-regulations-may-do-more-harm-goodJack Mintz | November 2014
THE CANADIAN UNEMPLOYMENT RATE - WITH AND WITHOUT ALBERTA'S BOOMhttp://policyschool.ucalgary.ca/?q=content/canadian-unemployment-rate-and-without-albertas-boomRon Kneebone | November 2014
NOT JUST FOR AMERICANS: THE CASE FOR EXPANDING RECIPROCAL TAX EXEMPTIONS FOR FOREIGN INVESTMENTS BY PENSION FUNDShttp://policyschool.ucalgary.ca/?q=content/not-just-americans-case-expanding-reciprocal-tax-exemptions-foreign-investments-pension-fundJack Mintz and Stephen Richardson | November 2014
DO MUNICIPAL GOVERNMENTS NEED MORE TAX POWERS? A BACKGROUND PAPER ON MUNICIPAL FINANCE IN ALBERTAhttp://policyschool.ucalgary.ca/?q=content/do-municipal-governments-need-more-tax-powers-background-paper-municipal-finance-albertaBev Dahlby and Melville McMillan | November 2014
DIGGING DEEP FOR THE HERITAGE FUND: WHY THE RIGHT FUND FOR ALBERTA PAYS DIVIDENDS LONG AFTER OIL IS GONEhttp://policyschool.ucalgary.ca/?q=content/digging-deep-heritage-fund-why-right-fund-alberta-pays-dividends-long-after-oil-goneTon van den Bremer and Rick van der Ploeg | October 2014