shepway district council commercial information audit statistical ... · business intelligence,...
TRANSCRIPT
[ Business Intelligence Report
Business Intelligence, Research & Evaluation, Kent County Council
www.kent.gov.uk/research
Shepway District Council
Commercial Information Audit
Statistical report 2013/2014
Published December 2014

Page 1 Business Intelligence, Research & Evaluation, Kent County Council
www.kent.gov.uk/research
Commercial Information Audit 2013/14 Kent County Council
Commercial Land Use Monitoring Summary Report 2013/14
Contents
Contact list 1 Introduction 2 Commercial land use methodology 3 Definitions and glossary 4 Land Use Class Orders 5 Table 1A: Allocated Sites 6 Table 1B: Summary of Floorspace Allocated 7 Table 2A: Summary of Floorspace Permitted 8 Table 2B: Summary of Floorspace Permitted (complete, under construction, not started) 9-10 Table 3: Land Supply Summary 11 Table 4A: Timeseries of Floorspace Completed (gains) 12 Table 4B: Timeseries of Floorspace Completed (losses) 13 Table 4C: Timeseries of Floorspace Completed (net) 14 Timeseries Chart: A2/B1-B8 floorspace completed 2002-2014 15
Contacts:
Kent County Council Chris Judd +443000416329 [email protected] Graham Herbert +443000416236 [email protected] Shepway District Council Jeremy Whittaker 01303 853318 [email protected]

Page 2 Business Intelligence, Research & Evaluation, Kent County Council
www.kent.gov.uk/research
Introduction to Commercial Land Use Monitoring
This document gives a brief summary of the main data and components of the Commercial monitoring survey. Additional information is
available. If you require supplementary in depth information please contact Kent County Council or the local District Council.
The annual survey is undertaken jointly by County and Local Authority officers. All commercial sites with a planning permission valid until 31st
March are visited and an assessment is then made of the stage of development; complete, under-construction or unimplemented, and this is
recorded into a database for commercial land monitoring.
Commercial Land Use monitoring in Kent (KCC area) is part of the Commercial Information Audit (CIA). Note Medway Unitary Authority was
established on 1st April 1998 from Rochester upon Medway and Gillingham Local Authorities and now conducts its own monitoring survey and
publishes an annual report. The Kent (KCC area) CIA grew out of what was the County’s Employment Land System (ELS).
Originally land use monitoring was to monitor the effectiveness of Structure Plan policies and to assist town planners and researchers when considering planning applications. Monitoring also helped consultants and developers identify sites for investment and opportunity. The Kent and Medway Structure Plan was superseded in July 2009 by the South East Plan when monitoring results were sent annually to the Region. In May 2010 the government abolished the Regional Partnership Board, although parts of the South East Plan remain valid until local authorities develop their own strategy, based upon the National Planning Policy Framework (NPPF).
The results are used by local authorities in Annual Monitoring Reports, Local Development Frameworks, establishing type of employment
need, as well as forming the basis for formal employment land surveys.
In future years allocated sites will gradually be replaced by Strategic Employment Land Availability Assessments (SELAA) In May 2013 amendments were made to the Town and Country Planning (General Permitted Development) Order. See: Statutory instruments http://www.legislation.gov.uk/uksi/2013/1101/pdfs/uksi_20131101_en.pdf To capture the relevant permitted change of use data, prior approval and prior notification applications are now being recorded for commercial monitoring purposes.
Page 3 Business Intelligence, Research & Evaluation, Kent County Council
www.kent.gov.uk/research
This document is not an Employment Land Review (ELR). Annual Monitoring Reports (AMRs) produced by individual Local Authorities assess
progress in implementing Local Development Documents and how successfully policies are being implemented. Users should contact
individual Local Authorities to obtain the latest position regarding progress and content of individual ELR’s.
It is important to note that some district councils may also maintain their own monitoring systems and prepare monitoring reports covering
aspects of commercial land supply. Definitions applied and land supply sources included in the district reports may vary from those applied in
this study.
Commercial Land Use Survey - Methodology
Originally monitoring covered employment sites permitted for B1-B8 land uses. These uses were surveyed in order to monitor whether levels
of development were meeting development plan targets. In 2007/08 monitoring procedures were expanded to include commercial sites as
well as employment sites. This means that instead of only monitoring land uses B1, B2 and B8 (Offices and light industry, general industry and
storage/distribution), gains and losses of commercial units such as shops (A1), financial and professional services (A2), hotels (C1) , Residential
Institutions (C2), Non Residential Institutions (D1) and Assembly and leisure (D2) are now included in the annual survey. In 2011/12 floorspace
recorded as sui generis was recorded for the first time. See page 5 for definitions of all the Land Use Classes.
Methodology and data capture in Kent has changed several times over the years. The methodology underlying the capture of data underwent
a major change after 1990/91 and earlier records are limited in content and should be treated with caution, especially if building a time series.
Another major change was when records were computerised and more recently when the Regional Assembly required land use monitoring for
the South East Plan. A more sophisticated methodology was established in 2007/08 when the requirement for the additional land use classes
was included. In 2009/10 following a review of resources and requirements, the monitoring procedures and outputs were revised and
restructured using different software.
Documentation of the very early surveys is no longer available. The earliest paper copies that are still available give a limited amount of
information from 1986/87

Page 4 Business Intelligence, Research & Evaluation, Kent County Council
www.kent.gov.uk/research
Planning Permission types definitions and glossary
Full permission – development can take place at anytime within 3 years from the date the permission was granted. If development does not begin within 3 years the permission will expire.
Outline permission – a general proposal for development with no or incomplete details. Development cannot take place until the full details are submitted and approved. Detailed applications must be submitted within 3 years from the date of the outline permission. If details are not approved within 3 years the permission will normally expire.
Reserved Matters – full details further to an outline permission, which can be submitted in stages and remain valid for 2 years after the expiry date of the outline, or grant of the last reserved matters, whichever is the longer. Details may be required for building materials, design, siting, landscaping or access.
Renewal – if a planning permission is about to expire it can be renewed to allow a further period of time for the development to take place. This involves submission of a further full or outline permission.
Variation of Condition – planning permission is often given with conditions and it is possible to apply for a variation of any of these. A variation of condition application can also be made to extend the time period for development to commence.
Allocation – Land identified by the Local Authority as being suitable for future development but does not currently have a planning permission.
Extant – A site that has a current planning permission which is either not started or under construction.
Pending Losses – A planning permission with an element of floorspace that will be lost. The floorspace can be lost by a change of use to another use class, redeveloped as housing/retail/leisure or a demolition of a building or part of a building. It is possible the loss may only form part of the planning permission.
Permitted Development Rights – A type of planning permission which allows certain building works and changes of use to be carried out without having to make a planning application. Permitted development rights are subject to conditions and limitations to control impact and to protect local amenity.
For further information follow the web link on page 2 of this report.

Page 5 Business Intelligence, Research & Evaluation, Kent County Council
www.kent.gov.uk/research
Use Classes Order (Brief general definitions) Source: Planning Portal (http://www.planningportal.gov.uk) Land Use Classes for England are set out in the Town and Country Planning (Use Classes) Order 1987 and its subsequent amendments.
A1 Shops - Shops, retail warehouses, hairdressers, undertakers, travel and ticket agencies, post offices, pet shops, sandwich bars, showrooms, domestic
hire shops, dry cleaners and funeral directors.
A2 Financial and professional services - Banks, building societies, estate and employment agencies, professional and financial services and betting offices.
A3 Restaurants and cafés - For the sale of food and drink for consumption on the premises - restaurants, snack bars and cafes.
A4 Drinking establishments - Public houses, wine bars or other drinking establishments (but not night clubs).
A5 Hot food takeaways - For the sale of hot food for consumption off the premises.
B1, B1a, B1b and B1c Business - Offices, research and development, light industry appropriate in a residential area.
B2 General industrial
B3-B7 Special Industrial Groups
B8 Storage or distribution - This class includes open air storage.
C1 Hotels - Hotels, boarding and guest houses where no significant element of care is provided.
C2 Residential institutions - Residential care homes, hospitals, nursing homes, boarding schools, residential colleges and training centres.
C2A Secure Residential Institution - Use for a provision of secure residential accommodation, including use as a prison, young offenders institution, detention centre, secure training centre, custody centre, short term holding centre, secure hospital, secure local authority accommodation or use as a military barracks.
C3 Dwelling houses - Family houses, or houses occupied by up to six residents living together as a single household, including a household where care is provided for residents.
D1 Non-residential institutions - Clinics, health centres, crèches, day nurseries, day centres, schools, art galleries, museums, libraries, halls, places of worship, church halls, law court. Non residential education and training centres.
D2 Assembly and leisure - Cinemas, music and concert halls, bingo and dance halls (but not night clubs), swimming baths, skating rinks, gymnasiums or sports arenas (except for motor sports, or where firearms are used).
Sui Generis - Petrol filling stations and shops selling and/or displaying motor vehicles. Retail warehouse clubs, nightclubs, launderettes, taxi businesses, amusement centres. Casinos. Theatres, scrap yards.

Page 6 Business Intelligence, Research & Evaluation, Kent County Council
www.kent.gov.uk/research
Table 1A: Allocated Sites (net residual) 2013/14
Amount of floorspace still available for development (m2)
Development Plan Allocations
Shepway District Local Development Framework Core Strategy Preferred Options (2010) Shepway
Site
Reference
Policy
Reference Site Name Settlement A1 A2 A3 A4 A5 B1a B1b B1c
Mixed
B1 B2 B8
Mixed
B1-B8 C1 C2 D1 D2
SH_00005 SH.E1(e) Ingles Manor/Jointon Road FOLKESTONE 0 0 0 0 0 0 0 0 2,000 0 0 0 0 0 0 0
SH_00006 SH.E1(f) East Station Goods Yard FOLKESTONE 0 0 0 0 0 0 0 0 2,250 0 2,250 0 0 0 0 0
SH_00013 SH.E1(m) Harden Road LYDD 0 0 0 0 0 389 0 0 450 0 0 0 0 0 0 0
SH_00014 SH.E1(n) Dengemarsh Road, Lydd ROMNEY MARSH 0 0 0 0 0 0 0 0 11,725 0 0 0 0 0 0 0
SH_00016 SH.E2A Shearway Business Park FOLKESTONE 0 0 0 0 0 0 0 0 0 0 0 14,700 0 0 0 0
SH_00017 SH.E2B Cheriton Parc FOLKESTONE 0 0 0 0 0 15,000 0 0 0 0 0 0 0 0 0 0
SH_00018 SH.E2C Link Park (Areas A & C) Lympne, HYTHE 0 0 0 0 0 0 0 2,130 23,690 12,585 34,770 0 0 0 0 0
SH_00019 SH.E2D Mountfield Road Phase 3 & 4 NEW ROMNEY 0 0 0 0 0 0 0 1,500 2,963 3,050 1,500 0 0 0 0 0
SH_00020 SH.E2E Hawkinge West FOLKESTONE 0 0 0 0 0 0 0 0 10,200 0 19,800 0 0 0 0 0
SH_00021 SH.E2F Nickolls Quarry HYTHE 0 0 0 0 0 0 0 0 21,000 0 0 0 0 0 0 0
Net Residual 0 0 0 0 0 15,389 0 3,630 74,278 15,635 58,320 14,700 0 0 0 0
Page 7 Business Intelligence, Research & Evaluation, Kent County Council
www.kent.gov.uk/research
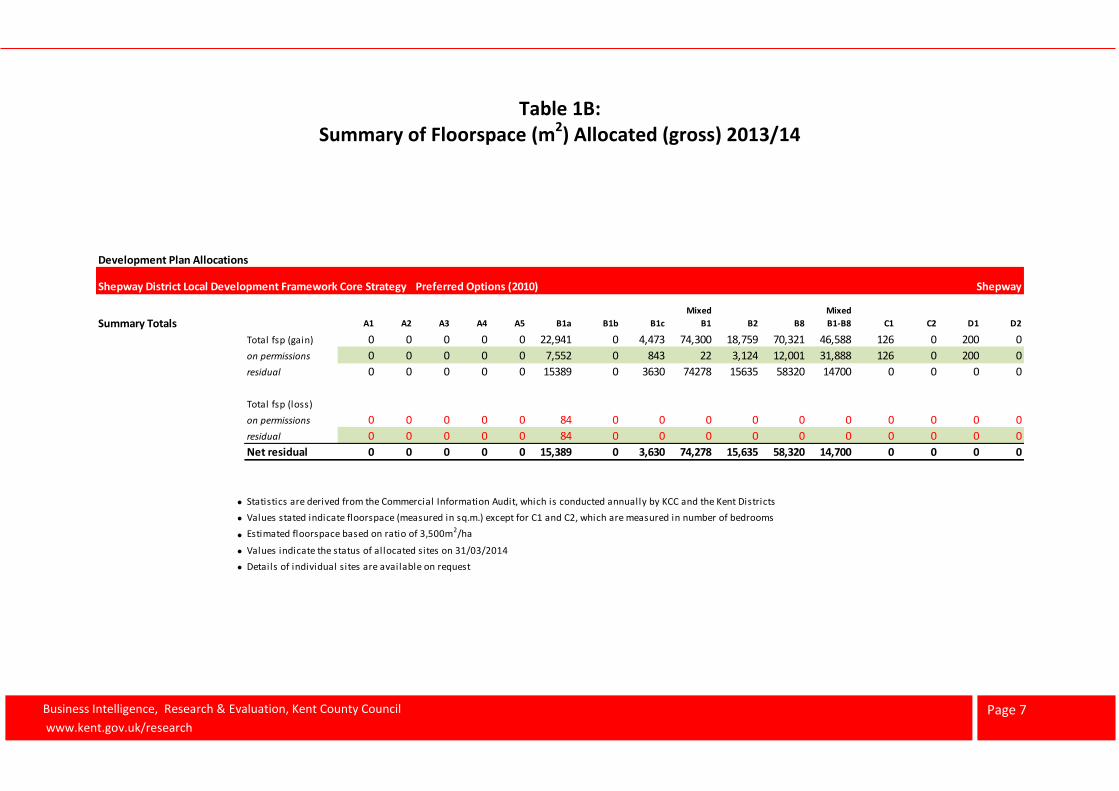
Table 1B: Summary of Floorspace (m2) Allocated (gross) 2013/14
Development Plan Allocations
Shepway District Local Development Framework Core Strategy Preferred Options (2010) Shepway
Summary Totals A1 A2 A3 A4 A5 B1a B1b B1c
Mixed
B1 B2 B8
Mixed
B1-B8 C1 C2 D1 D2
Total fsp (gain) 0 0 0 0 0 22,941 0 4,473 74,300 18,759 70,321 46,588 126 0 200 0
on permissions 0 0 0 0 0 7,552 0 843 22 3,124 12,001 31,888 126 0 200 0
residual 0 0 0 0 0 15389 0 3630 74278 15635 58320 14700 0 0 0 0
Total fsp (loss)
on permissions 0 0 0 0 0 84 0 0 0 0 0 0 0 0 0 0
residual 0 0 0 0 0 84 0 0 0 0 0 0 0 0 0 0
Net residual 0 0 0 0 0 15,389 0 3,630 74,278 15,635 58,320 14,700 0 0 0 0
l Statistics are derived from the Commercial Information Audit, which is conducted annually by KCC and the Kent Districts
l Values stated indicate floorspace (measured in sq.m.) except for C1 and C2, which are measured in number of bedrooms
l Estimated floorspace based on ratio of 3,500m2/ha
l Values indicate the status of allocated sites on 31/03/2014
l Details of individual sites are available on request
Page 8 Business Intelligence, Research & Evaluation, Kent County Council
www.kent.gov.uk/research
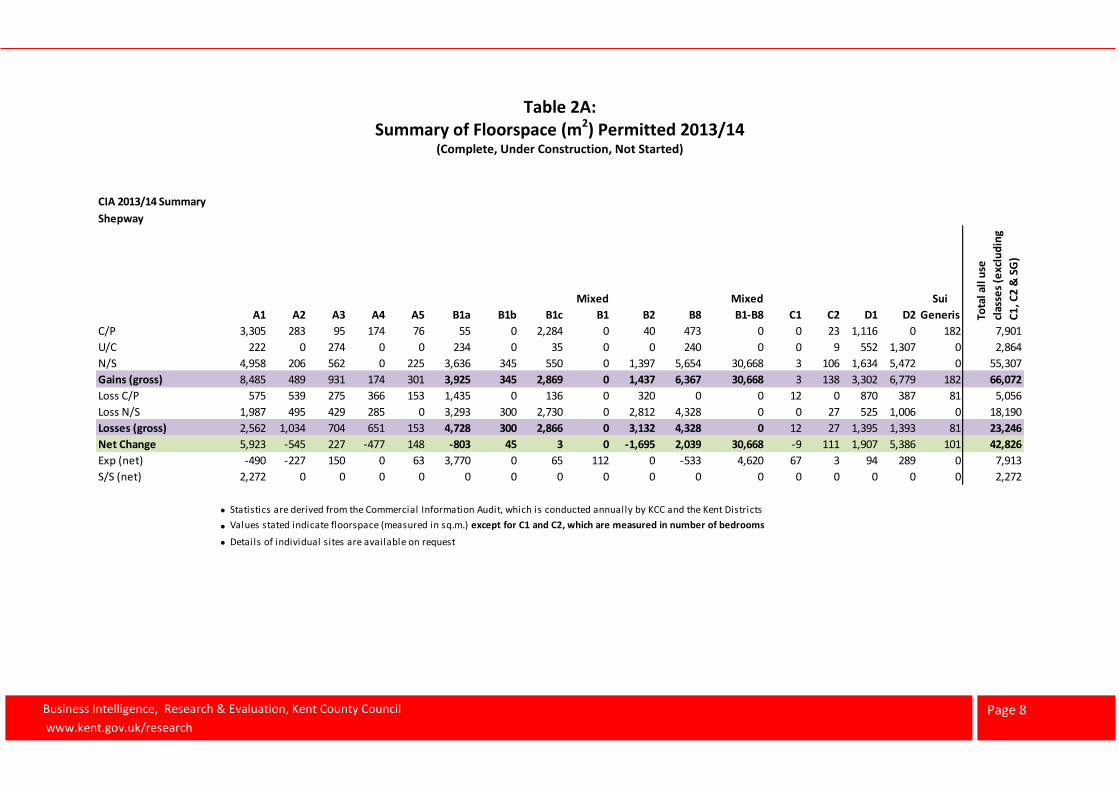
Table 2A: Summary of Floorspace (m2) Permitted 2013/14
(Complete, Under Construction, Not Started)
CIA 2013/14 Summary
Shepway
A1 A2 A3 A4 A5 B1a B1b B1c
Mixed
B1 B2 B8
Mixed
B1-B8 C1 C2 D1 D2
Sui
Generis Tota
l all
use
clas
ses
(exc
lud
ing
C1
, C2
& S
G)
C/P 3,305 283 95 174 76 55 0 2,284 0 40 473 0 0 23 1,116 0 182 7,901
U/C 222 0 274 0 0 234 0 35 0 0 240 0 0 9 552 1,307 0 2,864
N/S 4,958 206 562 0 225 3,636 345 550 0 1,397 5,654 30,668 3 106 1,634 5,472 0 55,307
Gains (gross) 8,485 489 931 174 301 3,925 345 2,869 0 1,437 6,367 30,668 3 138 3,302 6,779 182 66,072
Loss C/P 575 539 275 366 153 1,435 0 136 0 320 0 0 12 0 870 387 81 5,056
Loss N/S 1,987 495 429 285 0 3,293 300 2,730 0 2,812 4,328 0 0 27 525 1,006 0 18,190
Losses (gross) 2,562 1,034 704 651 153 4,728 300 2,866 0 3,132 4,328 0 12 27 1,395 1,393 81 23,246
Net Change 5,923 -545 227 -477 148 -803 45 3 0 -1,695 2,039 30,668 -9 111 1,907 5,386 101 42,826
Exp (net) -490 -227 150 0 63 3,770 0 65 112 0 -533 4,620 67 3 94 289 0 7,913
S/S (net) 2,272 0 0 0 0 0 0 0 0 0 0 0 0 0 0 0 0 2,272
l Statistics are derived from the Commercial Information Audit, which is conducted annually by KCC and the Kent Districts
l Values stated indicate floorspace (measured in sq.m.) except for C1 and C2, which are measured in number of bedrooms
l Details of individual sites are available on request
Page 9 Business Intelligence, Research & Evaluation, Kent County Council
www.kent.gov.uk/research
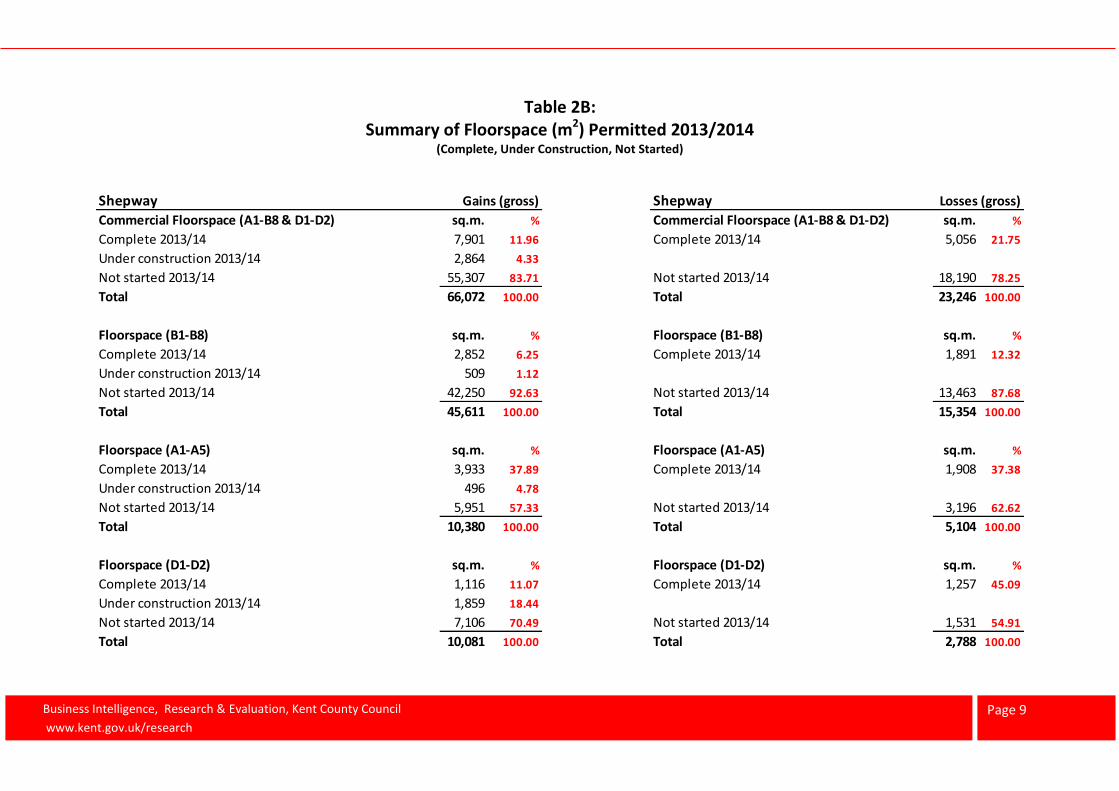
Table 2B: Summary of Floorspace (m2) Permitted 2013/2014
(Complete, Under Construction, Not Started)
Shepway Gains (gross) Shepway Losses (gross)
Commercial Floorspace (A1-B8 & D1-D2) sq.m. % Commercial Floorspace (A1-B8 & D1-D2) sq.m. %
Complete 2013/14 7,901 11.96 Complete 2013/14 5,056 21.75
Under construction 2013/14 2,864 4.33
Not started 2013/14 55,307 83.71 Not started 2013/14 18,190 78.25
Total 66,072 100.00 Total 23,246 100.00
Floorspace (B1-B8) sq.m. % Floorspace (B1-B8) sq.m. %
Complete 2013/14 2,852 6.25 Complete 2013/14 1,891 12.32
Under construction 2013/14 509 1.12
Not started 2013/14 42,250 92.63 Not started 2013/14 13,463 87.68
Total 45,611 100.00 Total 15,354 100.00
Floorspace (A1-A5) sq.m. % Floorspace (A1-A5) sq.m. %
Complete 2013/14 3,933 37.89 Complete 2013/14 1,908 37.38
Under construction 2013/14 496 4.78
Not started 2013/14 5,951 57.33 Not started 2013/14 3,196 62.62
Total 10,380 100.00 Total 5,104 100.00
Floorspace (D1-D2) sq.m. % Floorspace (D1-D2) sq.m. %
Complete 2013/14 1,116 11.07 Complete 2013/14 1,257 45.09
Under construction 2013/14 1,859 18.44
Not started 2013/14 7,106 70.49 Not started 2013/14 1,531 54.91
Total 10,081 100.00 Total 2,788 100.00
Page 10 Business Intelligence, Research & Evaluation, Kent County Council
www.kent.gov.uk/research

Page 11 Business Intelligence, Research & Evaluation, Kent County Council
www.kent.gov.uk/research
Table 3: Land Supply Summary (m2) 2013/14
SHEPWAY DISTRICT CIA Monitoring Statistics 2013/14
Land Supply Are
a (
ha)
A2 m
2
B1a m
2
B1b
m2
B1c m
2
B1 U
nab
le t
o S
pli
t
B2 m
2
B8 m
2
B1-B
8 u
nab
le t
o S
pli
t
To
tal
A2/B
1-8
m2
Source
Local Plan Allocations 51.99 0 15,389 0 3,630 74,278 15,635 58,320 14,700 181,952
0.00 0 0 0 0 0 0 0 0 0
51.99 0 15,389 0 3,630 74,278 15,635 58,320 14,700 181,952 KCC Allocations Table
Planning Permissions Completed Completed 2001-2013 (net) 58.35 2,275 -8,417 0 -645 11,454 11,577 12,841 1,071 30,156 C/F from 2012/13 Summary
Completed 2013-2014 (Gains) 0.90 283 55 0 2,284 0 40 473 0 3,135 KCC Bottom Line Figures
Completed 2013-2014 (Losses) -0.69 -539 -1,435 0 -136 0 -320 0 0 -2,430 KCC Bottom Line Figures
Completed 2013-2014 (Net) 0.20 -256 -1,380 0 2,148 0 -280 473 0 705
Net Completed 2001-2014 58.55 2,019 -9,797 0 1,503 11,454 11,297 13,314 1,071 30,861
Committed Not Started 12.13 206 3,636 345 550 0 1,397 5,654 30,668 42,456 KCC Bottom Line Figures
Under Construction 0.15 0 234 0 35 0 0 240 0 509 KCC Bottom Line Figures
Pending losses -3.99 -495 -3,293 -300 -2,730 0 -2,812 -4,328 0 -13,958 KCC Bottom Line Figures
Net committed 8.29 -289 577 45 -2,145 0 -1,415 1,566 30,668 29,007
Total Land Supply Net Allocated + Net Committed 60.27 -289 15,966 45 1,485 74,278 14,220 59,886 45,368 210,959
Note 1: Net completions from 2001 -2008 were not split into A2/B1a/B1b/B1c so the amount previously under A2/B1 has been entered as B1 unable to split
Note 2: Completed losses include sites which are under construction ie. the site is lost.
Note 3: Site areas are estimated totals for the site and should be treated with caution. It is not possible to split it between use classes
The areas have been calculated using a ratio of 3,500m2/ha. The net completed 2001-2013 figure was carried forward from the 2012-2013 table but the ratio had not
been applied. The net figure for 2013-2014 has been added to it to give the 2001-2014 net site area so this should also be treated with caution.
Proposed Gains
Proposed Losses
Net Allocated
Page 12 Business Intelligence, Research & Evaluation, Kent County Council
www.kent.gov.uk/research
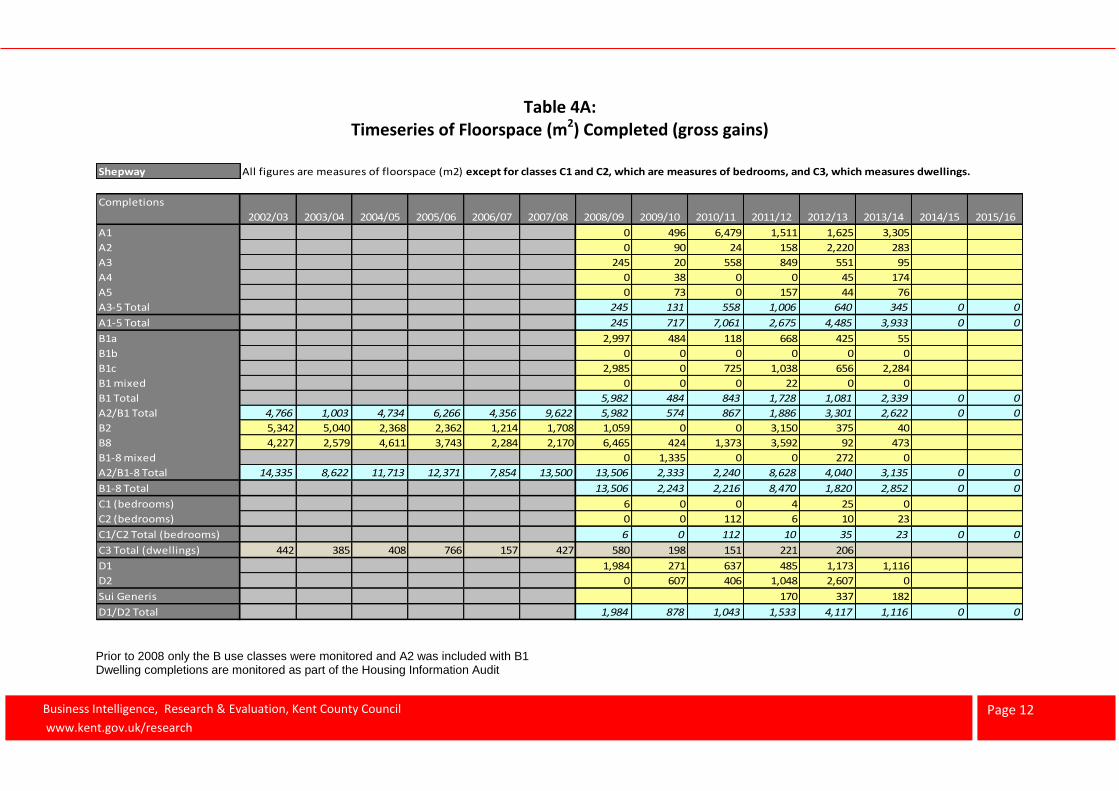
Table 4A: Timeseries of Floorspace (m2) Completed (gross gains)
Prior to 2008 only the B use classes were monitored and A2 was included with B1 Dwelling completions are monitored as part of the Housing Information Audit
Shepway All figures are measures of floorspace (m2) except for classes C1 and C2, which are measures of bedrooms, and C3, which measures dwellings.
Completions
2002/03 2003/04 2004/05 2005/06 2006/07 2007/08 2008/09 2009/10 2010/11 2011/12 2012/13 2013/14 2014/15 2015/16
A1 0 496 6,479 1,511 1,625 3,305
A2 0 90 24 158 2,220 283
A3 245 20 558 849 551 95
A4 0 38 0 0 45 174
A5 0 73 0 157 44 76
A3-5 Total 245 131 558 1,006 640 345 0 0
A1-5 Total 245 717 7,061 2,675 4,485 3,933 0 0
B1a 2,997 484 118 668 425 55
B1b 0 0 0 0 0 0
B1c 2,985 0 725 1,038 656 2,284
B1 mixed 0 0 0 22 0 0
B1 Total 5,982 484 843 1,728 1,081 2,339 0 0
A2/B1 Total 4,766 1,003 4,734 6,266 4,356 9,622 5,982 574 867 1,886 3,301 2,622 0 0
B2 5,342 5,040 2,368 2,362 1,214 1,708 1,059 0 0 3,150 375 40
B8 4,227 2,579 4,611 3,743 2,284 2,170 6,465 424 1,373 3,592 92 473
B1-8 mixed 0 1,335 0 0 272 0
A2/B1-8 Total 14,335 8,622 11,713 12,371 7,854 13,500 13,506 2,333 2,240 8,628 4,040 3,135 0 0
B1-8 Total 13,506 2,243 2,216 8,470 1,820 2,852 0 0
C1 (bedrooms) 6 0 0 4 25 0
C2 (bedrooms) 0 0 112 6 10 23
C1/C2 Total (bedrooms) 6 0 112 10 35 23 0 0
C3 Total (dwellings) 442 385 408 766 157 427 580 198 151 221 206
D1 1,984 271 637 485 1,173 1,116
D2 0 607 406 1,048 2,607 0
Sui Generis 170 337 182
D1/D2 Total 1,984 878 1,043 1,533 4,117 1,116 0 0
Page 13 Business Intelligence, Research & Evaluation, Kent County Council
www.kent.gov.uk/research
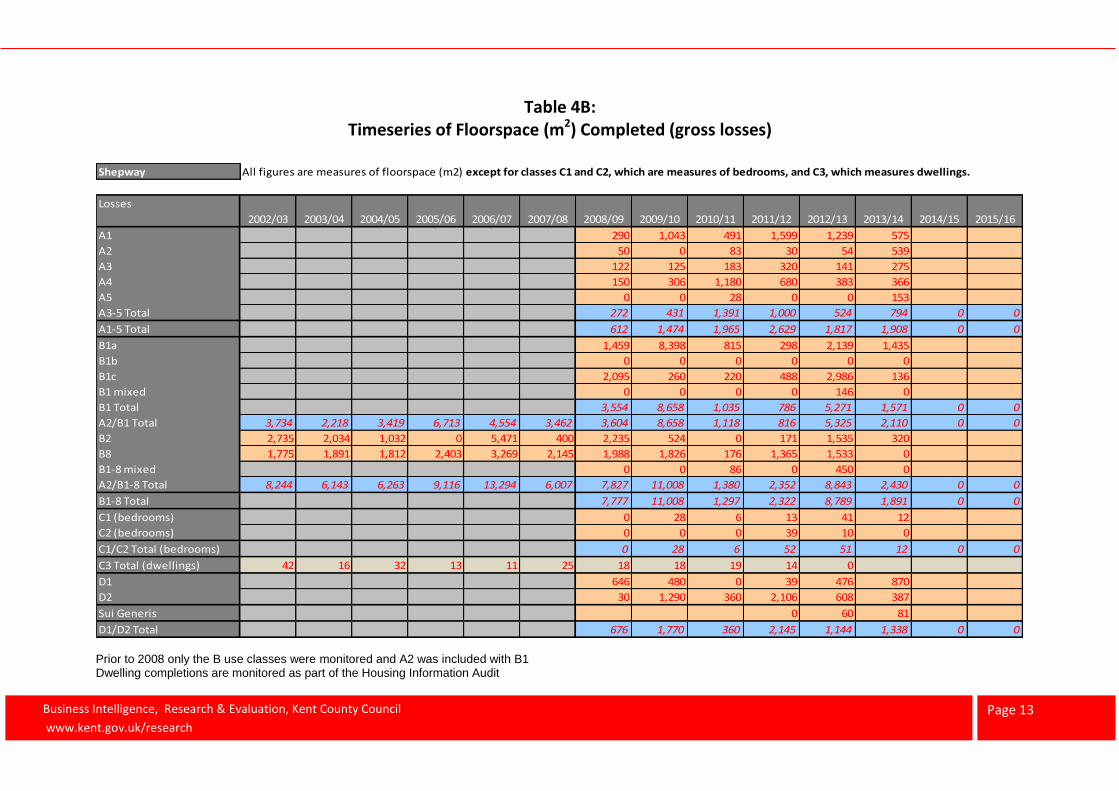
Table 4B: Timeseries of Floorspace (m2) Completed (gross losses)
Prior to 2008 only the B use classes were monitored and A2 was included with B1 Dwelling completions are monitored as part of the Housing Information Audit
Shepway All figures are measures of floorspace (m2) except for classes C1 and C2, which are measures of bedrooms, and C3, which measures dwellings.
Losses
2002/03 2003/04 2004/05 2005/06 2006/07 2007/08 2008/09 2009/10 2010/11 2011/12 2012/13 2013/14 2014/15 2015/16
A1 290 1,043 491 1,599 1,239 575
A2 50 0 83 30 54 539
A3 122 125 183 320 141 275
A4 150 306 1,180 680 383 366
A5 0 0 28 0 0 153
A3-5 Total 272 431 1,391 1,000 524 794 0 0
A1-5 Total 612 1,474 1,965 2,629 1,817 1,908 0 0
B1a 1,459 8,398 815 298 2,139 1,435
B1b 0 0 0 0 0 0
B1c 2,095 260 220 488 2,986 136
B1 mixed 0 0 0 0 146 0
B1 Total 3,554 8,658 1,035 786 5,271 1,571 0 0
A2/B1 Total 3,734 2,218 3,419 6,713 4,554 3,462 3,604 8,658 1,118 816 5,325 2,110 0 0
B2 2,735 2,034 1,032 0 5,471 400 2,235 524 0 171 1,535 320
B8 1,775 1,891 1,812 2,403 3,269 2,145 1,988 1,826 176 1,365 1,533 0
B1-8 mixed 0 0 86 0 450 0
A2/B1-8 Total 8,244 6,143 6,263 9,116 13,294 6,007 7,827 11,008 1,380 2,352 8,843 2,430 0 0
B1-8 Total 7,777 11,008 1,297 2,322 8,789 1,891 0 0
C1 (bedrooms) 0 28 6 13 41 12
C2 (bedrooms) 0 0 0 39 10 0
C1/C2 Total (bedrooms) 0 28 6 52 51 12 0 0
C3 Total (dwellings) 42 16 32 13 11 25 18 18 19 14 0
D1 646 480 0 39 476 870
D2 30 1,290 360 2,106 608 387
Sui Generis 0 60 81
D1/D2 Total 676 1,770 360 2,145 1,144 1,338 0 0
Page 14 Business Intelligence, Research & Evaluation, Kent County Council
www.kent.gov.uk/research
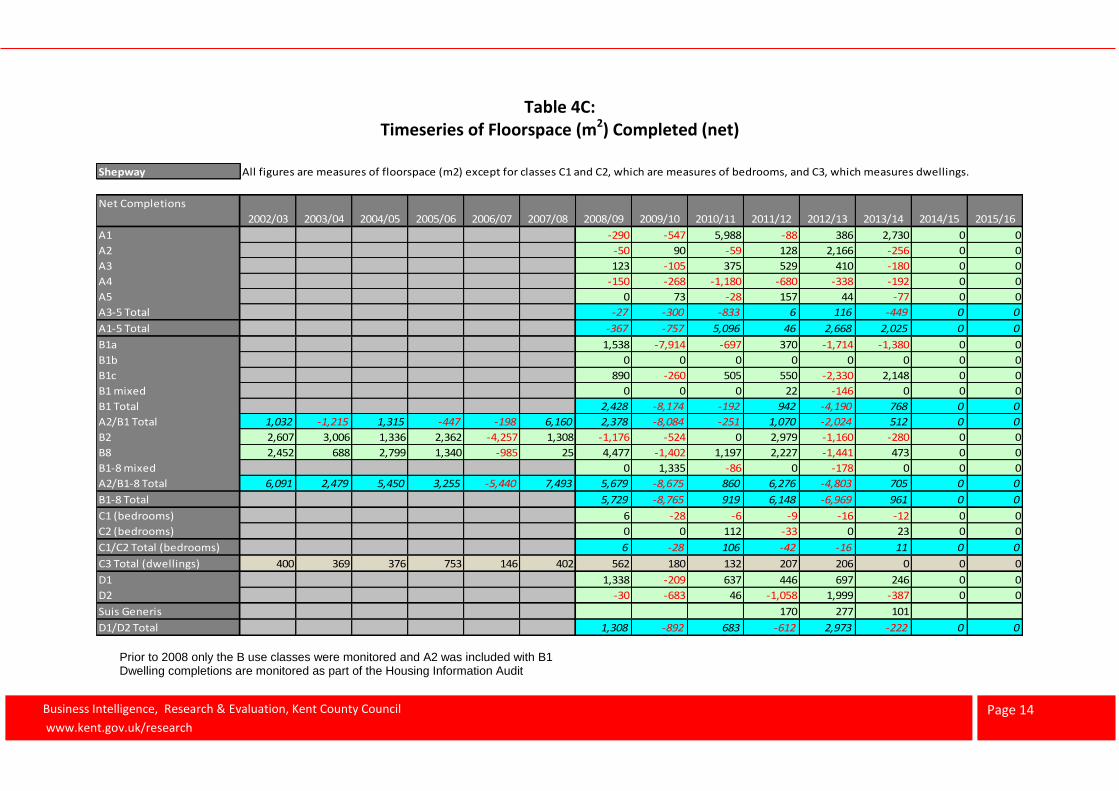
Table 4C: Timeseries of Floorspace (m2) Completed (net)
Prior to 2008 only the B use classes were monitored and A2 was included with B1 Dwelling completions are monitored as part of the Housing Information Audit
Shepway All figures are measures of floorspace (m2) except for classes C1 and C2, which are measures of bedrooms, and C3, which measures dwellings.
Net Completions
2002/03 2003/04 2004/05 2005/06 2006/07 2007/08 2008/09 2009/10 2010/11 2011/12 2012/13 2013/14 2014/15 2015/16
A1 -290 -547 5,988 -88 386 2,730 0 0
A2 -50 90 -59 128 2,166 -256 0 0
A3 123 -105 375 529 410 -180 0 0
A4 -150 -268 -1,180 -680 -338 -192 0 0
A5 0 73 -28 157 44 -77 0 0
A3-5 Total -27 -300 -833 6 116 -449 0 0
A1-5 Total -367 -757 5,096 46 2,668 2,025 0 0
B1a 1,538 -7,914 -697 370 -1,714 -1,380 0 0
B1b 0 0 0 0 0 0 0 0
B1c 890 -260 505 550 -2,330 2,148 0 0
B1 mixed 0 0 0 22 -146 0 0 0
B1 Total 2,428 -8,174 -192 942 -4,190 768 0 0
A2/B1 Total 1,032 -1,215 1,315 -447 -198 6,160 2,378 -8,084 -251 1,070 -2,024 512 0 0
B2 2,607 3,006 1,336 2,362 -4,257 1,308 -1,176 -524 0 2,979 -1,160 -280 0 0
B8 2,452 688 2,799 1,340 -985 25 4,477 -1,402 1,197 2,227 -1,441 473 0 0
B1-8 mixed 0 1,335 -86 0 -178 0 0 0
A2/B1-8 Total 6,091 2,479 5,450 3,255 -5,440 7,493 5,679 -8,675 860 6,276 -4,803 705 0 0
B1-8 Total 5,729 -8,765 919 6,148 -6,969 961 0 0
C1 (bedrooms) 6 -28 -6 -9 -16 -12 0 0
C2 (bedrooms) 0 0 112 -33 0 23 0 0
C1/C2 Total (bedrooms) 6 -28 106 -42 -16 11 0 0
C3 Total (dwellings) 400 369 376 753 146 402 562 180 132 207 206 0 0 0
D1 1,338 -209 637 446 697 246 0 0
D2 -30 -683 46 -1,058 1,999 -387 0 0
Suis Generis 170 277 101
D1/D2 Total 1,308 -892 683 -612 2,973 -222 0 0

Page 15 Business Intelligence, Research & Evaluation, Kent County Council
www.kent.gov.uk/research
Timeseries Chart: A2/B1-B8 floorspace completed 2002-2014
Based on Tables 4a, 4b &4c