shimon sarraf, research analyst center for postsecondary research, indiana university bloomington...
TRANSCRIPT

Shimon Sarraf, Research Analyst
Center for Postsecondary Research, Indiana University
Bloomington
Session for NSSE “Veterans”
Regional NSSE User’s WorkshopOctober 2005
Overview
A Quick Survey
Reports Reviewed
Benchmarks Explained
2005 NSSE Dataset Details
Future NSSE Developments
Discussion & Questions
“NESSIE”
Goals
Two-way conversation
Share your experiences
Good preparation for Shimon’s second and third session

A Quick Survey to Get Things Started….
Years of Participation in NSSE
Background of attendees

The NSSE Reports:Respondent Characteristics
A quick snapshot of your institution
Data quality: Confirming if sample is representative
Response Rate and Sample Error

2005 NSSE Response Rates by Carnegie Classification
33 32
3639
49
17 16
7
3
14
58
53
77
72
79
0
10
20
30
40
50
60
70
80
90
100
Doc-Extensive Doc-Intensive Masters Bac-Gen Bac-LA
Res
pon
se R
ate
(%)
Mean Min Max

The NSSE Reports:Respondent Characteristics
What is Sampling Error?
Assumes random sampling
An estimate of the margin likely to contain your "true" score, for example:
If 60% of your students reply "very often" and the sampling error is ± 5%, it is likely that the true value is between 55% and 65%.
More respondents --> smaller sampling error
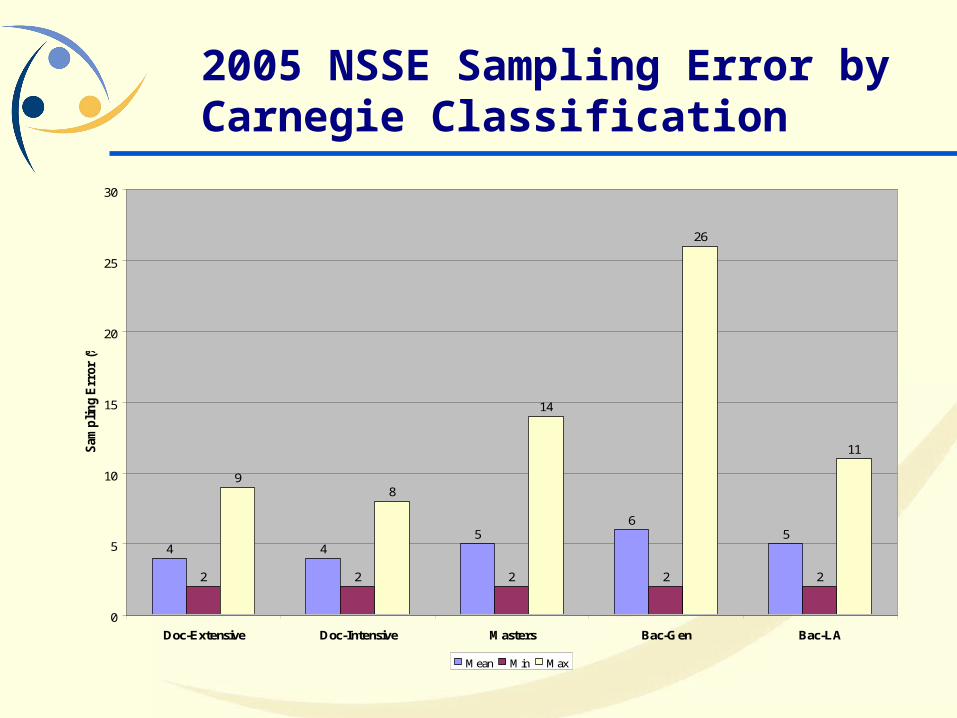
2005 NSSE Sampling Error by Carnegie Classification
4 45
65
2 2 2 2 2
98
14
26
11
0
5
10
15
20
25
30
Doc-Extensive Doc-Intensive Masters Bac-Gen Bac-LA
Sam
pli
ng
Err
or (
%)
Mean Min Max

Variable
Bench-mark Class Mean Mean Sig a
Effect
Size b Mean Sig a
Effect
Size b Mean Sig a
Effect
Size b
1. Academic and Intellectual Experiences
FY 2.71 2.55 *** .19 2.84 *** -.15 2.86 *** -.18
SR 3.02 2.82 *** .22 3.15 *** -.16 3.16 *** -.18
FY 2.24 1.95 *** .40 2.30 ** -.07 2.28
SR 2.66 2.57 * .11 2.93 *** -.32 2.88 *** -.26
FY 2.45 2.48 2.69 *** -.25 2.65 *** -.21
SR 2.32 2.32 2.55 *** -.24 2.51 *** -.20
FY 2.98 2.86 *** .15 3.08 *** -.13 3.08 *** -.12
SR 3.31 3.19 *** .15 3.36 3.37 * -.08
FY 2.75 2.65 *** .11 2.76 2.77
SR 2.74 2.64 * .11 2.83 ** -.11 2.83 ** -.11
FY 2.14 2.19 2.01 *** .17 2.03 *** .15
SR 2.31 2.28 2.05 *** .35 2.08 *** .31
FY 2.36 2.30 * .07 2.42 ** -.08 2.40
SR 2.43 2.37 2.58 *** -.16 2.52 * -.09
FY 2.41 2.34 * .08 2.39 2.43
SR 2.82 2.80 2.76 2.77
FY 2.60 2.49 *** .14 2.54 * .08 2.57
SR 2.89 2.88 2.91 2.93
FY 1.72 1.72 1.68 1.72
SR 1.86 1.87 1.90 1.94 * -.08
FY 1.39 1.40 1.56 *** -.21 1.54 *** -.19
SR 1.63 1.54 * .11 1.80 *** -.19 1.77 *** -.15
Master's
ACL
ACL
ACL
ACL
ACL
ACLWorked with classmates outside of class to prepare class assignments
OCCGRP
Put together ideas or concepts from different courses when completing assignments or during class discussions
INTIDEAS
Come to class without completing readings or assignments
CLUNPREP
Worked with other students on projects during class
CLASSGRP
Worked on a paper or project that required integrating ideas or information from various sources
INTEGRAT
Included diverse perspectives (different races, religions, genders, political beliefs, etc.) in class discussions or writing assignments
DIVCLASS
Made a class presentation CLPRESEN
Prepared two or more drafts of a paper or assignment before turning it in
REWROPAP
NSSEville State UniversityNSSE 2005 Means Comparison Report
Asked questions in class or contributed to class discussions
CLQUEST
In your experience at your institution during the current school year, about how often have you done each of the following? 1=never, 2=sometimes, 3=often, 4=very often
NSSE 2005NSSEville
NSSEville compared with:
Selected Peers
a.
b.
c.
d.
e.
f.
g.
h.
Tutored or taught other students (paid or voluntary)
TUTOR
Participated in a community-based project (e.g. service learning) as part of a regular course
COMMPROJ
i.
j.
k.
The NSSE Reports:Means Comparison
Means, statistical significanc
e and effect sizes
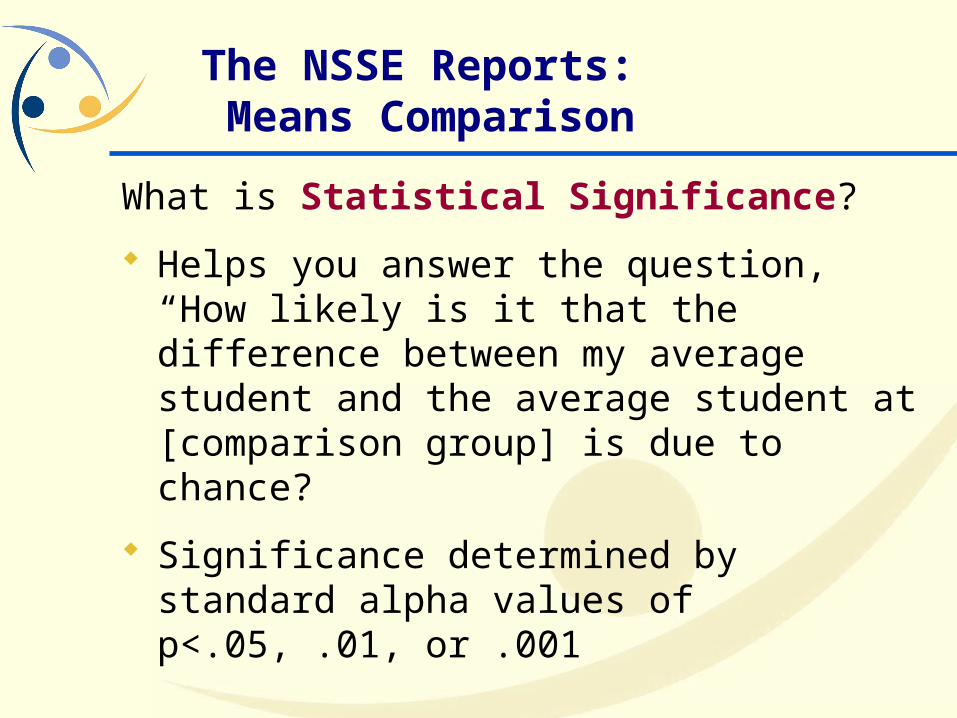
The NSSE Reports: Means Comparison
What is Statistical Significance?
Helps you answer the question, “How likely is it that the difference between my average student and the average student at [comparison group] is due to chance?
Significance determined by standard alpha values of p<.05, .01, or .001
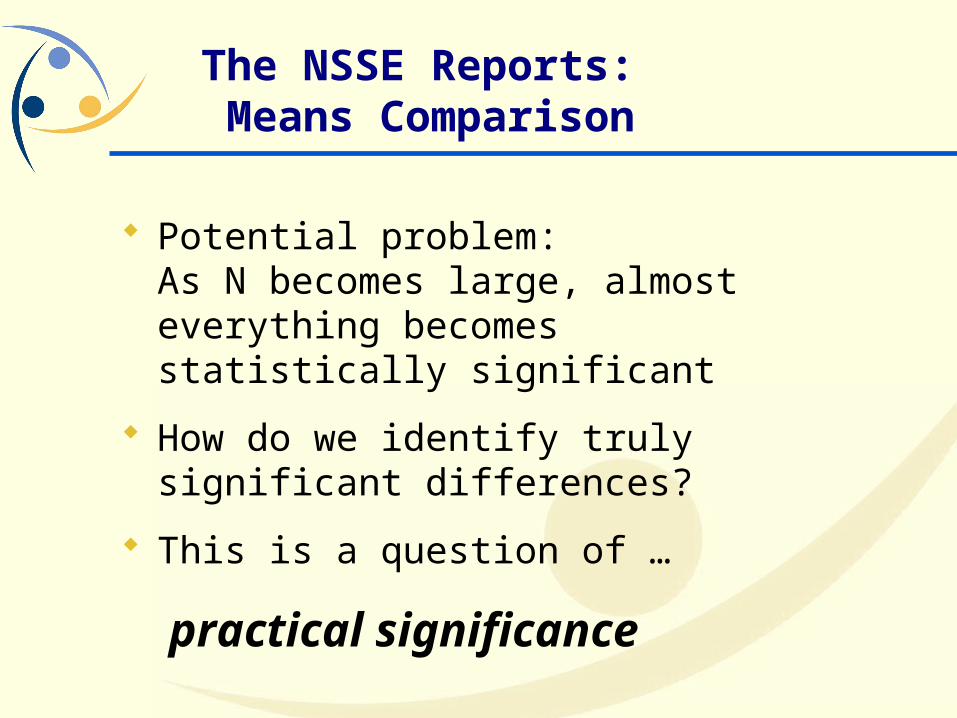
Potential problem:As N becomes large, almost everything becomes statistically significant
How do we identify truly significant differences?
This is a question of …
practical significance
The NSSE Reports: Means Comparison

The NSSE Reports: Means Comparison
What is Effect Size?
Practical significance of the mean difference
ES=mean difference/standard deviation
.2 is often considered small, .5 moderate, and .8 large (but rare!)
For example, while the difference in the means is statistically significant, the difference is so nominal that it doesn’t warrant further attention
Sele
cted
Pe
ers
Mas
ter's
NSS
E 20
05
Sele
cted
Pe
ers
Mas
ter's
NSS
E 20
05
2.71 2.55 2.84 2.86 .02 .02 .01 .00 .82 .82 .84 .84 1,329 3,004 19,955 47,746 .000 .000 .000 .19 -.15 -.18
2.24 1.95 2.30 2.28 .02 .01 .01 .00 .77 .74 .78 .78 1,327 3,001 19,949 47,729 .000 .009 .133 .40 -.07 -.04
2.45 2.48 2.69 2.65 .03 .02 .01 .00 .97 1.01 .97 .98 1,324 2,999 19,939 47,688 .371 .000 .000 -.03 -.25 -.21
2.98 2.86 3.08 3.08 .02 .02 .01 .00 .79 .84 .77 .78 1,324 2,999 19,933 47,691 .000 .000 .000 .15 -.13 -.12
2.75 2.65 2.76 2.77 .02 .02 .01 .00 .85 .89 .86 .87 1,326 2,998 19,932 47,678 .001 .841 .324 .11 -.01 -.03
2.14 2.19 2.01 2.03 .02 .01 .01 .00 .76 .79 .74 .74 1,324 2,994 19,911 47,644 .053 .000 .000 -.06 .17 .15
2.36 2.30 2.42 2.40 .02 .02 .01 .00 .81 .84 .81 .82 1,327 3,001 19,948 47,705 .031 .006 .071 .07 -.08 -.05
2.41 2.34 2.39 2.43 .02 .02 .01 .00 .81 .86 .85 .85 1,327 3,002 19,948 47,718 .012 .304 .428 .08 .03 -.02
2.60 2.49 2.54 2.57 .02 .01 .01 .00 .79 .79 .79 .80 1,232 2,835 19,150 45,820 .000 .010 .191 .14 .08 .04
1.72 1.72 1.68 1.72 .02 .02 .01 .00 .82 .84 .83 .84 1,232 2,835 19,160 45,844 .991 .067 .787 .00 .05 .01
1.39 1.40 1.56 1.54 .02 .01 .01 .00 .73 .72 .82 .81 1,232 2,832 19,156 45,828 .573 .000 .000 -.02 -.21 -.19
2.73 2.72 2.57 2.61 .03 .02 .01 .00 1.01 1.01 1.05 1.05 1,233 2,834 19,160 45,850 .846 .000 .000 .01 .15 .12
3.16 2.99 3.01 3.06 .02 .02 .01 .00 .80 .84 .85 .85 1,230 2,833 19,155 45,839 .000 .000 .000 .19 .17 .12
2.54 2.43 2.62 2.62 .02 .02 .01 .00 .88 .87 .86 .86 1,232 2,835 19,158 45,834 .000 .004 .001 .13 -.09 -.09
2.25 1.99 2.18 2.16 .02 .02 .01 .00 .85 .86 .89 .89 1,232 2,836 19,159 45,841 .000 .009 .001 .31 .08 .10
1.78 1.70 1.82 1.86 .02 .02 .01 .00 .82 .81 .85 .86 1,233 2,833 19,159 45,829 .004 .114 .003 .10 -.05 -.09
2.69 2.60 2.73 2.76 .02 .01 .01 .00 .75 .78 .80 .80 1,212 2,792 18,968 45,387 .000 .047 .001 .12 -.05 -.09
2.55 2.46 2.64 2.63 .02 .02 .01 .00 .83 .86 .83 .84 1,210 2,795 18,964 45,391 .005 .000 .000 .10 -.11 -.10
1.48 1.44 1.62 1.63 .02 .01 .01 .00 .76 .73 .84 .84 1,209 2,789 18,965 45,381 .150 .000 .000 .05 -.16 -.18
2.62 2.68 2.69 2.73 .02 .02 .01 .00 .85 .87 .86 .86 1,211 2,792 18,960 45,380 .034 .006 .000 -.07 -.08 -.13
2.52 2.71 2.52 2.60 .03 .02 .01 .00 1.03 1.00 1.01 1.02 1,212 2,790 18,956 45,366 .000 .969 .008 -.19 .00 -.08
2.76 2.85 2.70 2.77 .03 .02 .01 .00 .96 .94 .97 .97 1,212 2,790 18,959 45,375 .009 .035 .726 -.09 .06 -.01
2.96 2.88 2.90 2.85 .02 .02 .01 .00 .83 .86 .87 .88 1,207 2,781 18,859 45,096 .013 .016 .000 .08 .07 .12
3.12 3.05 3.04 3.09 .02 .01 .01 .00 .74 .76 .79 .78 1,207 2,781 18,849 45,068 .004 .000 .113 .10 .11 .05
2.82 2.81 2.81 2.87 .02 .02 .01 .00 .80 .84 .84 .84 1,206 2,779 18,835 45,049 .714 .628 .065 .01 .01 -.05
2.78 2.74 2.82 2.84 .02 .02 .01 .00 .83 .86 .85 .85 1,207 2,783 18,838 45,064 .136 .100 .020 .05 -.05 -.07
2.99 2.95 2.96 2.99 .02 .02 .01 .00 .81 .86 .85 .85 1,206 2,783 18,847 45,074 .198 .172 .873 .04 .04 .00
3.47 3.32 3.23 3.31 .03 .02 .01 .00 .97 .89 .96 .97 1,197 2,771 18,754 44,895 .000 .000 .000 .16 .25 .16
Sele
cted
Pee
rs
Sele
cted
Pee
rs
Sele
cted
Pee
rs
NSS
Evill
e
NSS
E 20
05
Mas
ter's
Mas
ter's
APPLYING
READASGN
MEMORIZE
ANALYZE
SYNTHESZ
EVALUATE
FACOTHER
DIVRSTUD
OOCIDEAS
DIFFSTU2
FACPLANS
FACIDEAS
FACFEED
WORKHARD
COMMPROJ
ITACADEM
FACGRADE
CLASSGRP
INTIDEAS
OCCGRP
TUTOR
REWROPAP
INTEGRAT
DIVCLASS
CLUNPREP
CLPRESEN
NSS
Evill
e
NSS
E 20
05
NSS
Evill
e
Mas
ter's
CLQUESTSe
lect
ed P
eers
Mas
ter's
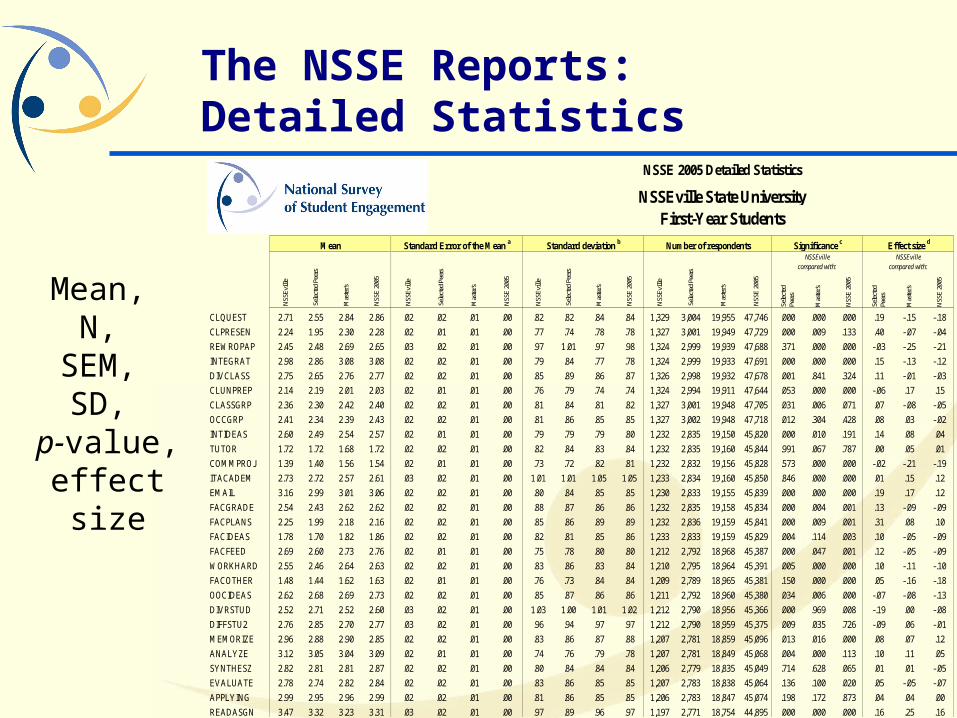
NSSE 2005 Detailed Statistics
First-Year Students
Significance c Effect size d
NSS
Evill
e
NSS
E 20
05
NSSEvillecompared with:
NSSEvillecompared with:
NSS
E 20
05
NSSEville State University
Mean Standard Error of the Mean a Standard deviation b Number of respondents
The NSSE Reports:Detailed Statistics
Mean, N,
SEM, SD,
p-value, effect size
The NSSE Reports:Detailed Statistics
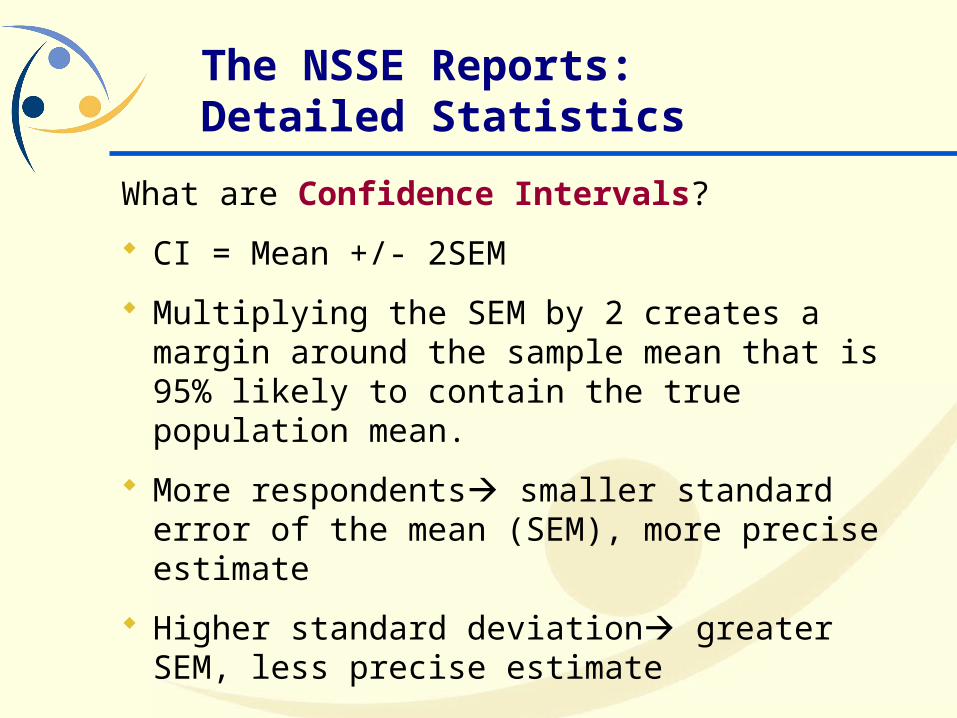
What are Confidence Intervals?
CI = Mean +/- 2SEM
Multiplying the SEM by 2 creates a margin around the sample mean that is 95% likely to contain the true population mean.
More respondents smaller standard error of the mean (SEM), more precise estimate
Higher standard deviation greater SEM, less precise estimate
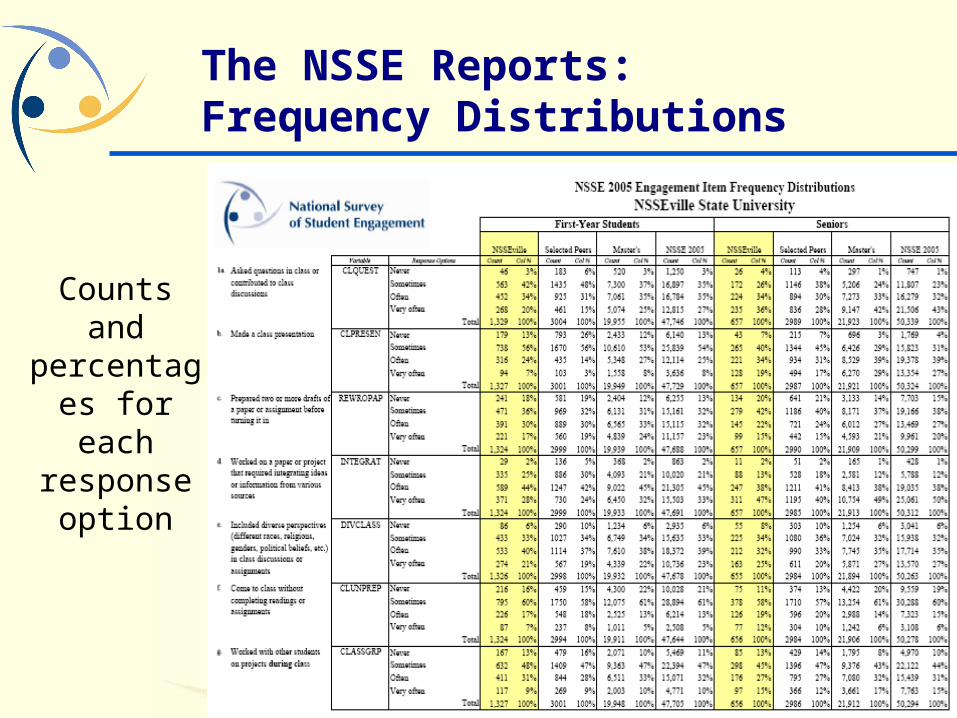
The NSSE Reports:Frequency Distributions
Counts and
percentages for each response
option
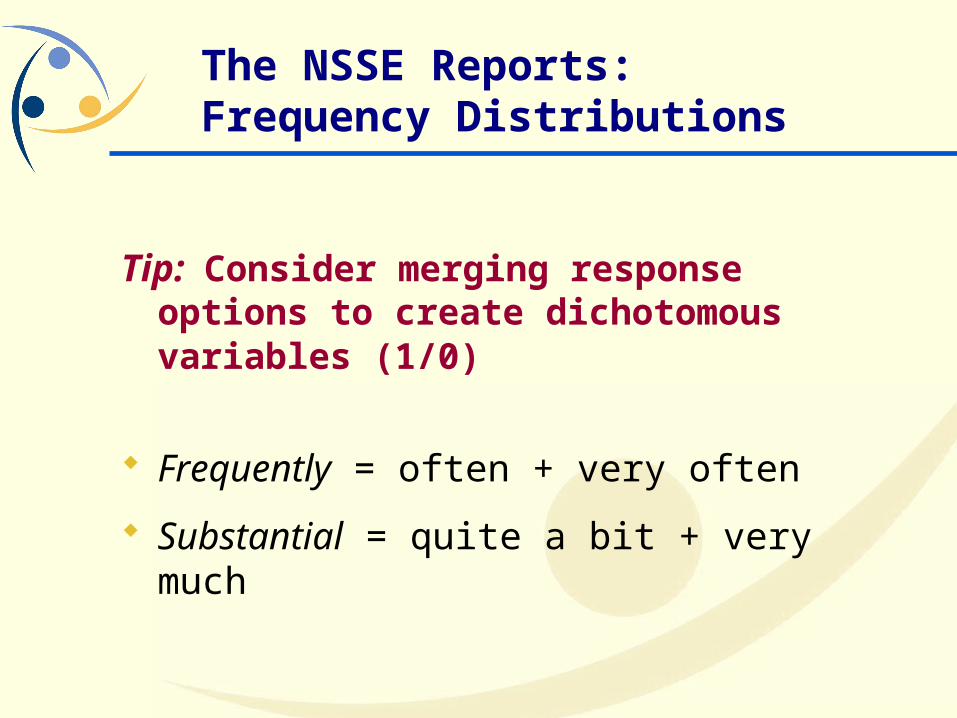
Tip: Consider merging response options to create dichotomous variables (1/0)
Frequently = often + very often
Substantial = quite a bit + very much
The NSSE Reports:Frequency Distributions
The NSSE Reports: New Features
Selected Peer Group
Including or Excluding your targeted oversample

5 Benchmarks of Effective Educational Practice
Level of Academic Challenge
Active and Collaborative Learning
Student Faculty Interaction
Enriching Educational Experiences
Supportive Campus Environment

Level of Academic Challenge
Challenging intellectual and creative work is central to student learning and collegiate quality.
Institutions promote high levels of achievement by setting high expectations for student performance.
11 items include:
Preparing for class
Reading and writing
Using higher-order thinking skills
Institutional environment emphasizes academic work

Active and Collaborative Learning
Students learn more when they are more intensely involved in their education.
Collaborating with others prepares students to handle practical, real-world problems.
7 items include:
Asking questions in class
Making presentations
Working with other students on projects
Discussing ideas from readings or classes with others
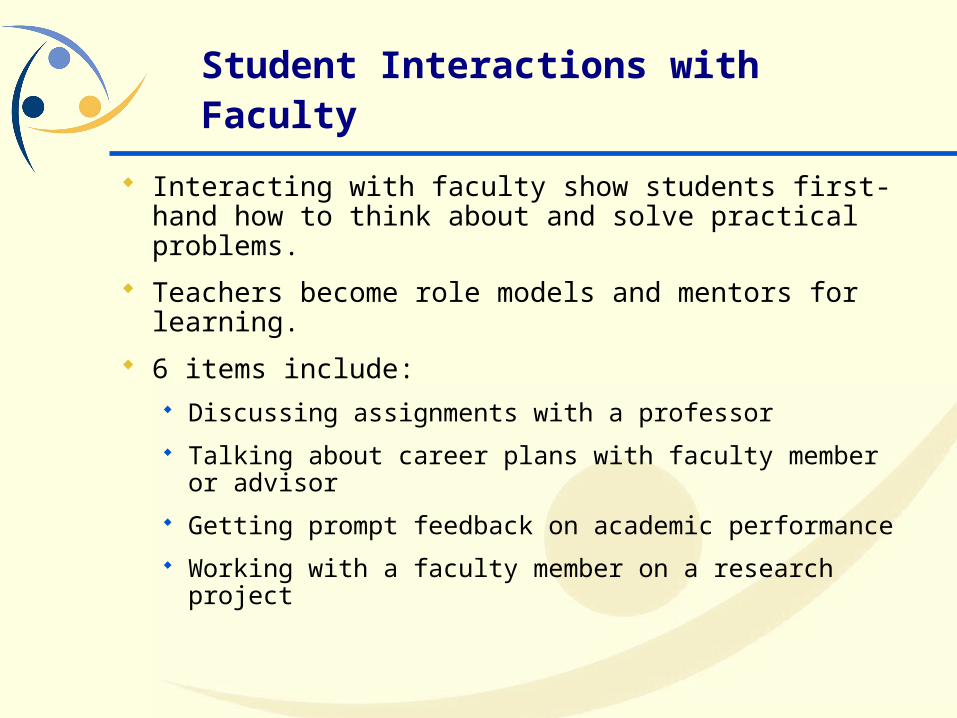
Student Interactions with Faculty
Interacting with faculty show students first-hand how to think about and solve practical problems.
Teachers become role models and mentors for learning.
6 items include: Discussing assignments with a professor
Talking about career plans with faculty member or advisor
Getting prompt feedback on academic performance
Working with a faculty member on a research project
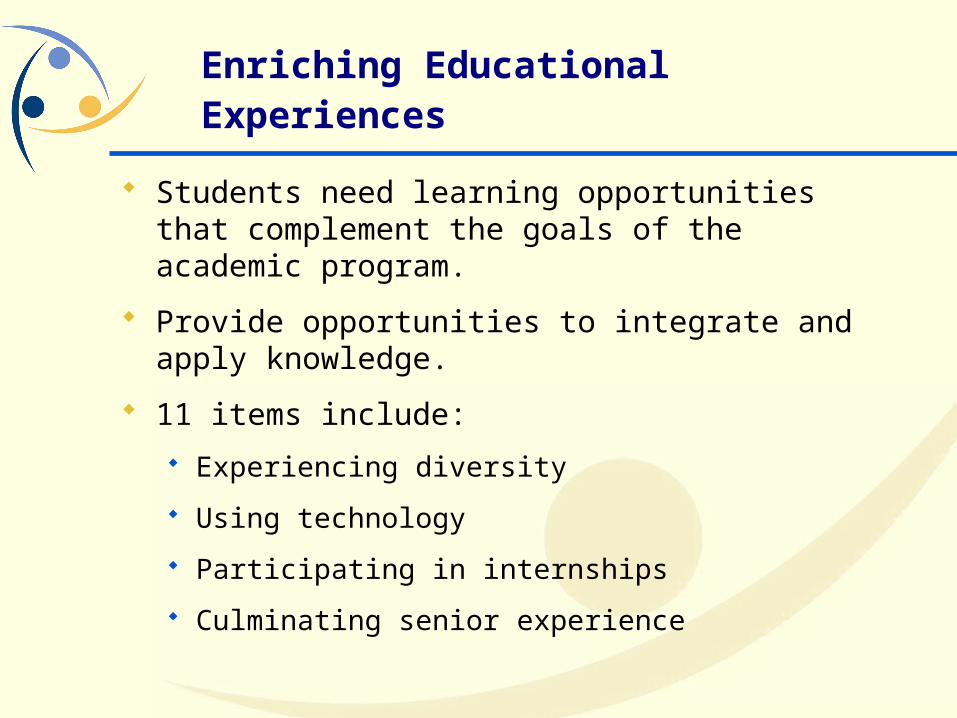
Enriching Educational Experiences
Students need learning opportunities that complement the goals of the academic program.
Provide opportunities to integrate and apply knowledge.
11 items include:
Experiencing diversity
Using technology
Participating in internships
Culminating senior experience
Supportive Campus Environment
Students perform better and are more satisfied at colleges that are committed to their success.
Does institution cultivate positive working and social relationships among different groups on campus?
6 items include:
Helping students achieve academically
Helping students cope with non-academic responsibilities
Quality of relationship between student and peers, faculty, and administrative personnel
How are benchmark scores calculated?
1. Items are converted to a 100-point scale: [(response value – 1)/(total # of response values – 1)]*100
2. Part-time students' scores are adjusted on four Academic Challenge items.
3. Student-level scores are created for each group of items by taking the mean, as long as 3/5ths of the items were answered.
4. Institutional benchmarks are the weighted averages of the student-level scores.
Benchmarks of Effective Educational Practice

Benchmark Report
Level of Academic Challenge
Nesseville ConsortiumCarnegie National
First-Year 52.5 52.4 51.8 53.4
Senior 56.3 55.6 54.9 57.0
Challenging intellectual and creative work is central to student learning and collegiate quality. Colleges and universities promote high levels of student achievement by emphasizing the importance of academic effort and setting high expectations for student performance
25
35
45
55
65
75B
ench
mar
k S
core
s
Nesseville 52.5 56.3
Consortium 52.4 55.6
Carnegie 51.8 54.9
National 53.4 57.0
First-Year Senior
Level of Academic Challenge Items:
Preparing for class (studying, reading, writing, rehearsing, etc. related to academic program)
Number of assigned textbooks, books, or book-length packs of course readings
Number of written papers or reports of 20 pages or more; number of written papers or reports of between 5 and 19 pages; and number of written papers or reports of fewer than 5 pages
Coursework emphasizing analysis of the basic elements of an idea, experience or theory
Coursework emphasizing synthesis and organizing of ideas, information, or experiences into new, more complex interpretations and relationships
Coursework emphasizing the making of judgments about the value of information, arguments, or methods
Coursework emphasizing application of theories or concepts to practical problems or in new situations
Working harder than you thought you could to meet an instructor's standards or expectations
Campus environment emphasizing time studying and on academic work
Benchmark recalculation reports (04 &
05):
Driven by new calculation process that began for the 04 administration
Multi-year Comparisons EEE: not comparable because of response
set change
SFI: comparable by removing “research” item
Benchmarks of Effective Educational Practice

Institutions can use the student-level scores to:
Investigate what groups are more engaged than others on your campus.
Institutional subgroups (i.e., programs, departments)
Student sub-groups (i.e., gender, race)
Incorporate scale scores into predictive models of student outcomes (retention, g.p.a., satisfaction)
Benchmarks of Effective Educational Practice

SatisfactionGeneral SatisfactionSatisfaction plus Quality of Campus Relationships
Campus EnvironmentEnvironmental EmphasesQuality of Campus Relationships
Gains FactorsPersonal/SocialGeneral EducationPractical Competence
Measurement Scales

Deep Learning Activities
Higher-Order Learning activities that require students to utilize higher levels of mental activity than those required for rote memorization (2b,c,d,e)
Integrative Learning activities that require integrating acquired knowledge, skills, and competencies into a meaningful whole (1d,e,i,p,t)
Reflective Learning activities that ask students to explore their experiences of learning to better understand how they learn
NSSE Scalelets
Course Challenge
Writing
Active Learning
Collaborative Learning
Course Interaction
Out-of-Class Interaction
Gains (academic, personal, vocational)
Varied Experiences
Information Technology
Diversity
Support for Student Success
Interpersonal Environment

2005 NSSE Dataset Details
What do you need to know to match your Institutional Report numbers?
“smpl05” (sampling type) use 1 (base sample), 2 (standard oversample),
3 (requested oversample) values… and 4 (targeted oversample) if “targetos” equals 1
“inelig” exclude all ineligible respondents
use those with values of 1 for “inelig”

Future Developments
Customized Report Engine
Archiving of reports and datasets online
Integrating new Carnegie classification
NSSE Knowledge Base

Discussion and Comments
Shimon SarrafResearch Analyst
Indiana University Center for Postsecondary Research1900 East 10th Street
Eigenmann Hall, Suite 419Bloomington, IN 47406
Ph: 812-856-2169
www.nsse.iub.edu