shipweight presentation bollinger - shipyards services · shipweight presentation ... 2008 –...
TRANSCRIPT

ShipWeight Presentation
23.01.2014 1
ShipWeight
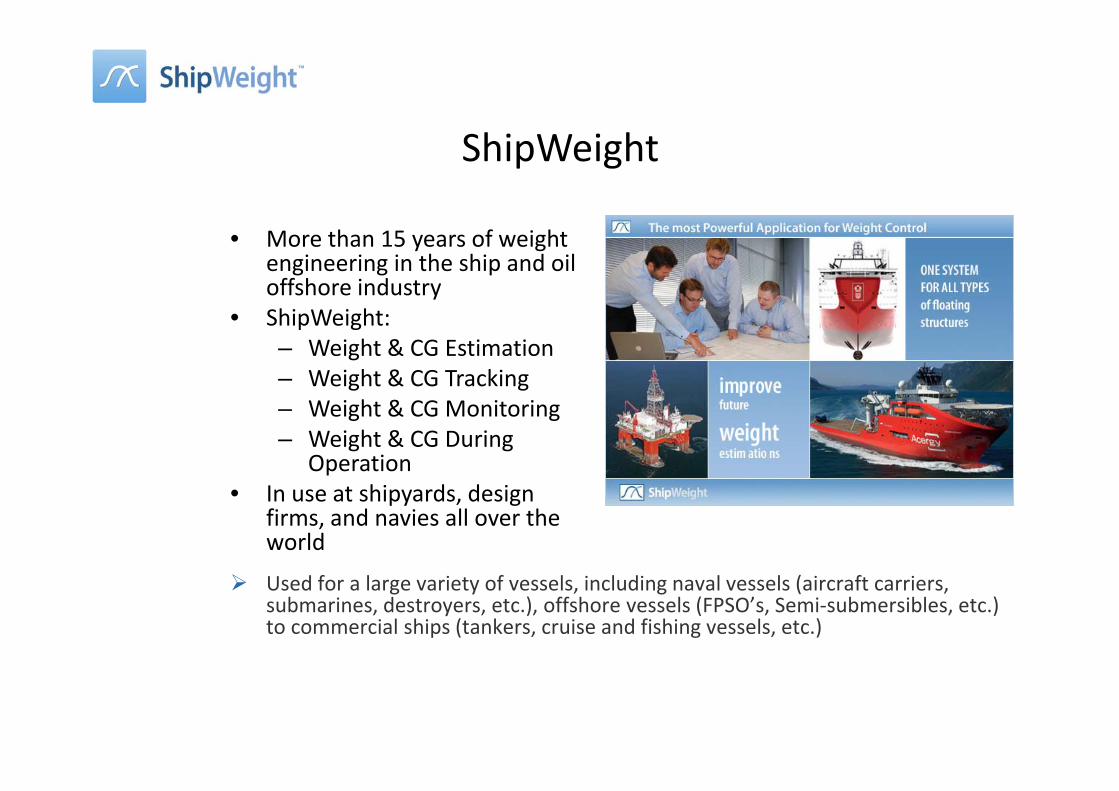
• More than 15 years of weight engineering in the ship and oil offshore industry
• ShipWeight:– Weight & CG Estimation – Weight & CG Tracking– Weight & CG Monitoring– Weight & CG During
OperationI hi d d i• In use at shipyards, design firms, and navies all over the world
d f l f l l d l l ( fUsed for a large variety of vessels, including naval vessels (aircraft carriers, submarines, destroyers, etc.), offshore vessels (FPSO’s, Semi‐submersibles, etc.) to commercial ships (tankers, cruise and fishing vessels, etc.)
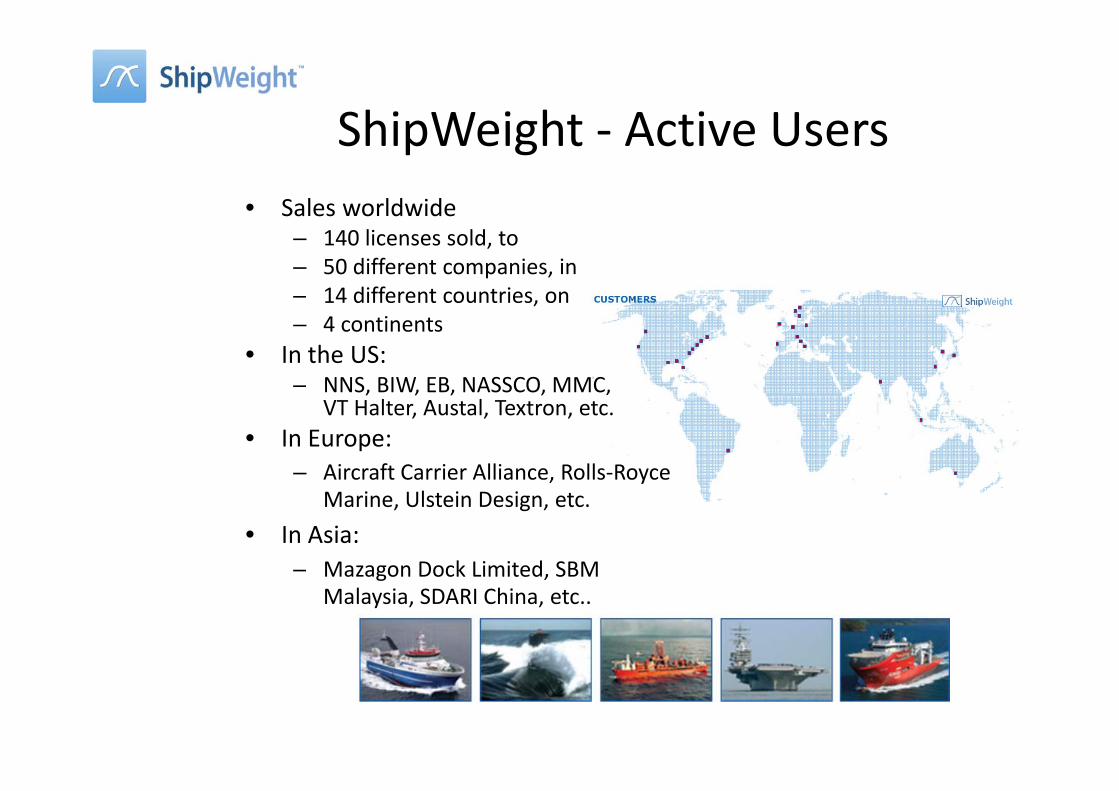
ShipWeight Active UsersShipWeight ‐ Active Users• Sales worldwideSa es o d de
– 140 licenses sold, to– 50 different companies, in– 14 different countries, on,– 4 continents
• In the US: – NNS, BIW, EB, NASSCO, MMC,
VT Halter, Austal, Textron, etc.• In Europe:
– Aircraft Carrier Alliance, Rolls‐Royce Marine, Ulstein Design, etc.
• In Asia:– Mazagon Dock Limited, SBMMazagon Dock Limited, SBM
Malaysia, SDARI China, etc..

One Tool for All Weight EngineeringOne Tool for All Weight Engineering
Reuse and Utilize Your As built Data !!
Contract Delivery
Reuse and Utilize Your As‐built Data !!
Development/Detailed design
Design/Concept Production
Estimation based on past
ShipWeight
Administration of weight data
ShipWeight
Tracking and monitoring
ShipWeight
Estimation based on past weight data using parametric ratio formulas
Administration of weight data available from other systems (import)
Tracking and monitoring reported weights
Data from the complete vessel is reused in new estimations

Building Blocks of a Weight Engineering toolBuilding Blocks of a Weight Engineering tool
OutputOutput
Reports Data dumps Tailored exports
CalculationsCalculations
Estimation Tracking Monitoring Related Estimation Tracking Monitoring Functions
InputInput
Manual input Generic import Tailored import
Database StorageDatabase Storage
WBS Historical Project data Log data SecurityWBS data Project data Log data Security
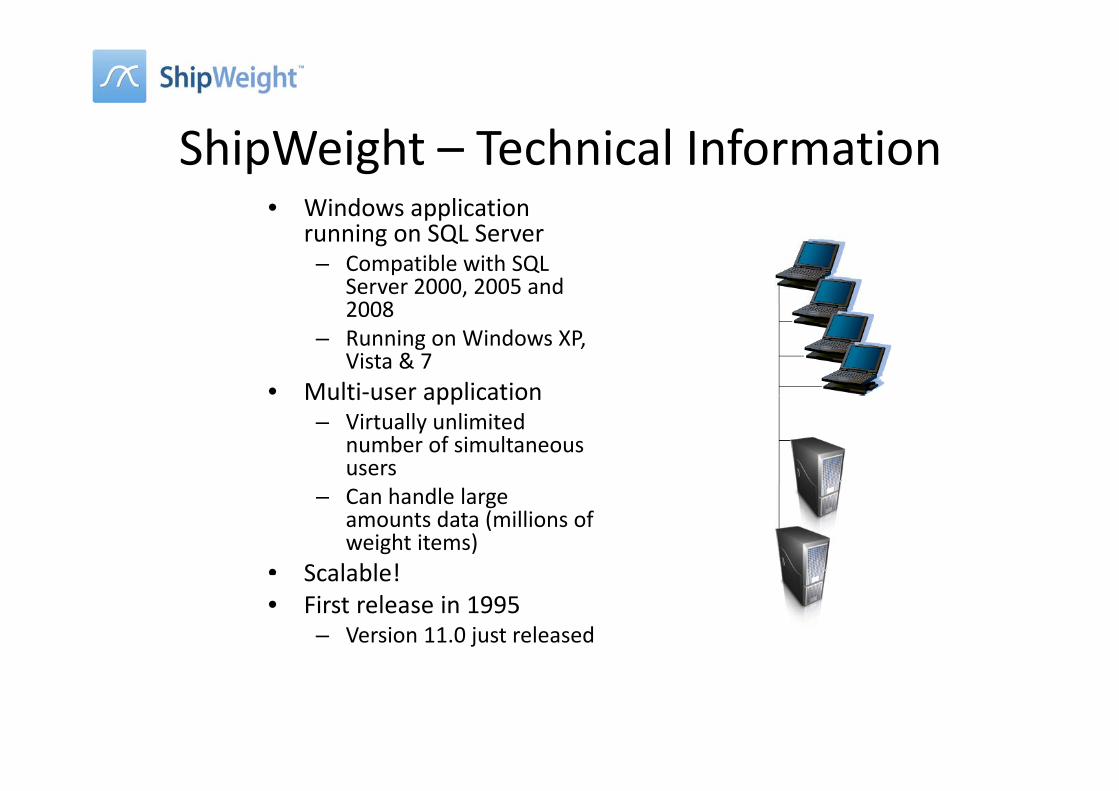
ShipWeight – Technical Information• Windows application do s app cat o
running on SQL Server– Compatible with SQL
Server 2000, 2005 and 20082008
– Running on Windows XP, Vista & 7
• Multi‐user applicationMulti user application– Virtually unlimited
number of simultaneous users
– Can handle large amounts data (millions of weight items)
• Scalable!Scalable!• First release in 1995
– Version 11.0 just released

Administration & SecurityAdministration & Security• Backup utility
• Internal permission system similar to Windows
security, but independent from OS and server.y, p
• User‐defined password policy.
• Permission assigned to user groups. Users
assigned to group.
• Ability to control ShipWeight access in detail.
• Different access settings on different projects• Different access settings on different projects.
• All actions are logged

ShipWeight• Preserves knowledge in Company• Preserves knowledge in Company• Is a Database Tool
– Excel – widely used but…y• Prone to errors• Often related to the inventor and difficult to implement across the organizationL k f it f t d t l• Lack of security features and user control
• Not very suitable to produce good reports• Single user system
– Advantages over Access• Multi‐user• Continued development, with input from industryContinued development, with input from industry• Updated to latest operating system and database versions• Feature rich

Work Breakdown StructureWork Breakdown Structure• The construction isThe construction is
divided into a work breakdown structure (WBS) suitable for thesuitable for the user organization, forming a hierarchy of weight groups
• The standard WBS suits most types of
t ticonstructions
• Can be edited and t i dcustomized

ShipWeight InputShipWeight ‐ Input• Combined single record and table• Combined single record‐ and table
view
• User‐customized setup of input iview
• Up to 100 user‐defined fields– Maturity & ContingencyMaturity & Contingency– Modules & Sections– Allowance– Fluids– Department & Disciplinesepa t e t & sc p es
• Sorting and filtering capability
• Multiple modification of items
• Windows Cut, Copy and Paste
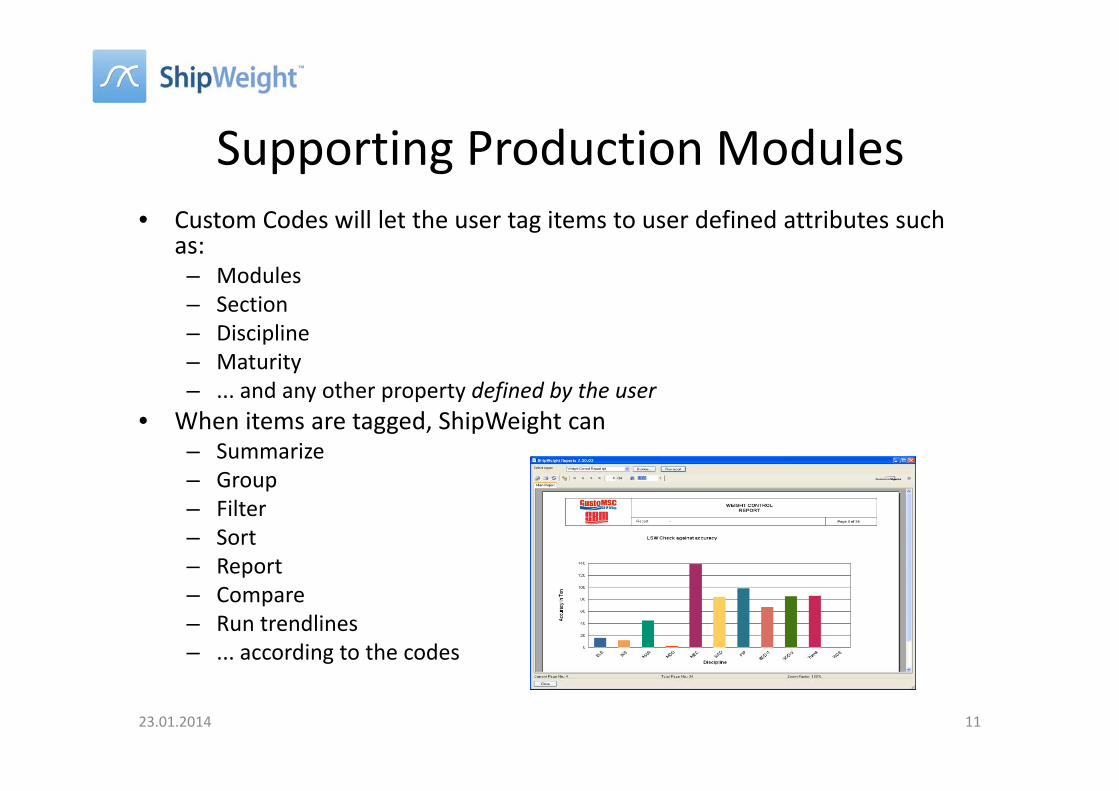
Supporting Production Modules• Custom Codes will let the user tag items to user defined attributes such• Custom Codes will let the user tag items to user defined attributes such
as:– Modules– Section– Section– Discipline– Maturity– ... and any other property defined by the user... and any other property defined by the user
• When items are tagged, ShipWeight can– Summarize– GroupGroup– Filter– Sort– Reportp– Compare– Run trendlines– ... according to the codes
23.01.2014 11

Data File ImportData File ImportTh f ll i f t• The following formats can be imported in a generic way defined by the user:
Flat text files– Flat text files– Delimited text files
• Tab‐delimited• Comma delimitedComma delimited• Etc…
– MS Excel files– MS Access filesMS Access files

Fulcrum 3DFulcrum 3DF l 3D i f• Fulcrum 3D– Special tool to transfer
weight and CG data from h
• Requirements for successful application:
ShipConstructor to ShipWeight
– Produces an XML file that
– Tagging of SWBS numbers to ShipConstructor itemscan be consumed by
ShipWeight– ”Intelligent” import
ShipConstructor items
Fulcrum3D• Deletes items from ShipWeight that have been removed from the model”R b ” l t i t
Fulcrum3DDetailDesignModel Weight
Engineering• ”Remembers” last import and can handle special cases related to block changes, etc.
EngineeringModel
g ,
13/25

Parametric EstimationE i i h b d hi i l d• Estimate weight groups based upon historical data
23.01.2014 14

Weight & CoG Parametric EstimationSmall sample of weight groups with parametric formulas. The
Let us look at an example for the estimation of one
sum of groups gives the total weight estimate for the vessel.
for the estimation of one single weight group: Propulsion LightShip
W=k*LBD*sqrt(Cb)
200
W=k*Power^0.65
300W=k*L*B
100
W=k*WatsonE
210 220 310 320 110
W=k*... W=k*.... W=k*... W=k*.... W=k*...

Regression on Historical DataEstimation method: W = k*P^0.65 Historical Data Weight [t] Power [kW] k (Weight/Pwr.)
Vessel 1 4100 26000 0.16V l 2 3500 20000 0 18Vessel 2 3500 20000 0.18Vessel 3 3000 16000 0.19Vessel 4 2600 14000 0.19Vessel 5 2300 11000 0.21Vessel 6 2200 9800 0.22Vessel 7 2000 8500 0.240.25
0.21
0.22
0.24
0.21
0.22
0.23
0.24
Examples of parametric formulas:W = k * P^0.65W = k * L*B __W = k * L*B*D*√Cb
0.18
0.190.19
0.17
0.18
0.19
0.20k W = k * Watson‐E
0.16
0.15
0.16
5000 10000 15000 20000 25000 30000
Propulsion Power

Leveraging an existing database• A new design can leverage from one or more existing projects in the
following ways:following ways:– All or some of the SWBS groups can be scaled parametrically based on ratio‐
coefficients that are extracted from a single past vessel or through regression on several vessels
– All or some of the SWBS groups can be populated from importing detailed items or total weight from one or more existing vessels
– Items can be added, deleted and/or changed after import or scaling
23.01.2014 17
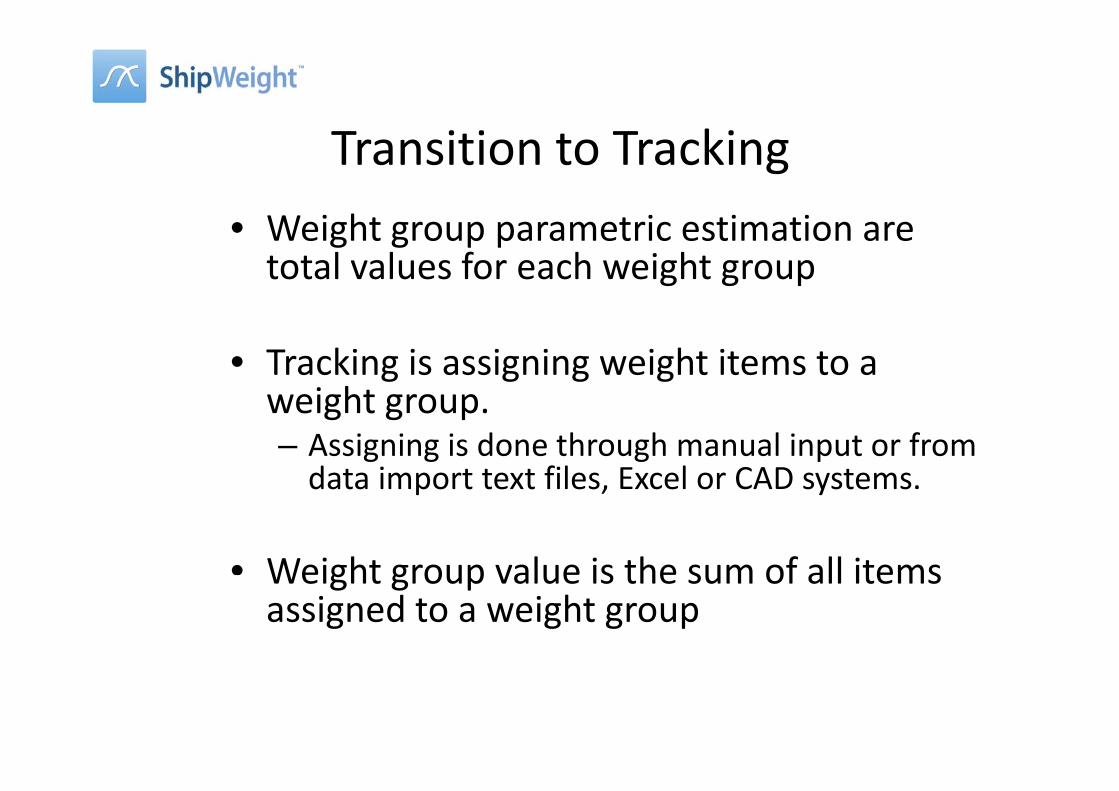
Transition to TrackingW i h i i i• Weight group parametric estimation are total values for each weight group
• Tracking is assigning weight items to a weight groupweight group.– Assigning is done through manual input or from data import text files, Excel or CAD systems.data import text files, Excel or CAD systems.
• Weight group value is the sum of all itemsWeight group value is the sum of all items assigned to a weight group

ShipWeight Main WindowShipWeight Main Window
• Runtime summation of all key values for all levels of the work breakdown structure (weight groups)breakdown structure (weight groups)

Playground AreaPlayground Area
ShipWeight ”Playground Area” is a workspace where you can enter and edit weight data outside the main project d tdata
Weight data is checked in and out of the ”Playground Area” and this operation is logged along with change summaries
The purpose of the ”Playground Area” isTo be able to check changes to the database before it goes ”live”To track changes to the database betterTo handle margins better
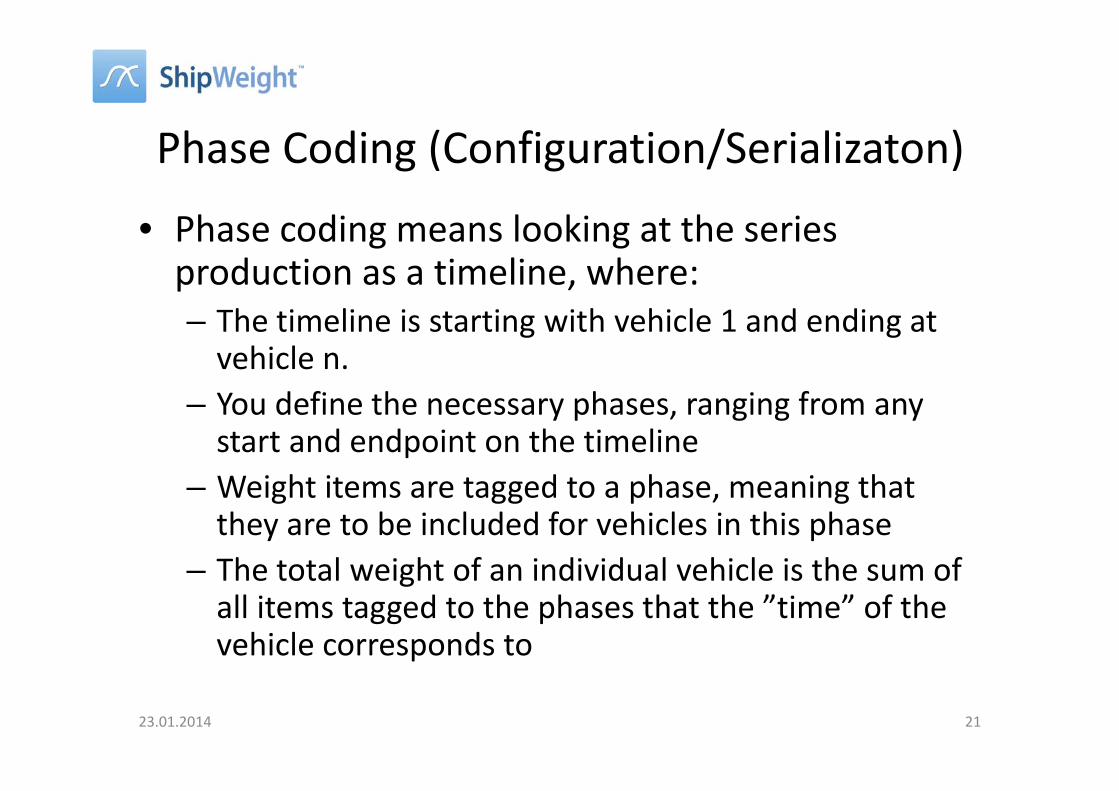
Phase Coding (Configuration/Serializaton)
h di l ki h i• Phase coding means looking at the series production as a timeline, where:– The timeline is starting with vehicle 1 and ending at vehicle n.Y d fi th h i f– You define the necessary phases, ranging from any start and endpoint on the timelineWeight items are tagged to a phase meaning that– Weight items are tagged to a phase, meaning that they are to be included for vehicles in this phase
– The total weight of an individual vehicle is the sum ofThe total weight of an individual vehicle is the sum of all items tagged to the phases that the ”time” of the vehicle corresponds to
23.01.2014 21

General Example• Allowing to set ”Time In” and ”Time• Allowing to set Time In and Time
Out”– Defining the ”time” an item is to be
includedT b d h ”Fl ”
Code Time In Time Out
Phase AC 0 30
Phase AZ 20 80
Ph CX 10 50• To be used when ”Flags” are not sufficient
• To be combined with Global Filter
Phase CX 10 50
Phase CG 30 100
Phase AZ 0 100
Phase SZ 70 100Phase SZ 70 100
Timeline
0 10 20 30 40 50 60 70 80 90 100
Phase AC
Phase AZ
Phase CX
Phase CGase CG
Phase AZ
Phase SZ
23.01.2014 22
Filter: Weight at time 55

Example: Vessels
• Series of 10 hulls with modifications
Hull no.
1 2 3 4 5 6 7 8 9 10
BaselineBaseline
Mod. 1
Mod. 2
Mod 3Mod. 3
Mod. 4
Mod. 5
Filter: Hull no 7Filter: Hull no 7
Baseline + Mod. 2 & 4
23.01.2014 23

Weight Distribution CurveWeight Distribution Curve
• To obtain the weight distribution curve, fore d f land aft values must
have been entered for the weight items
• Default Extension can be given
• The curve can be exported to severalexported to several different file formats readable for stability programsp g

Moment of Inertia & GyradiusMoment of Inertia & Gyradius• Moments of Inertia are• Moments of Inertia are
calculated using Steiner’s theorem
• Inertia around a single weight item is calculated approximating the item to a boxbox
• Gyradius values for input to seakeeping analysis p g ycalculated for
– Roll– Pitch– YawYaw– Pitch/Yaw– Roll/Yaw
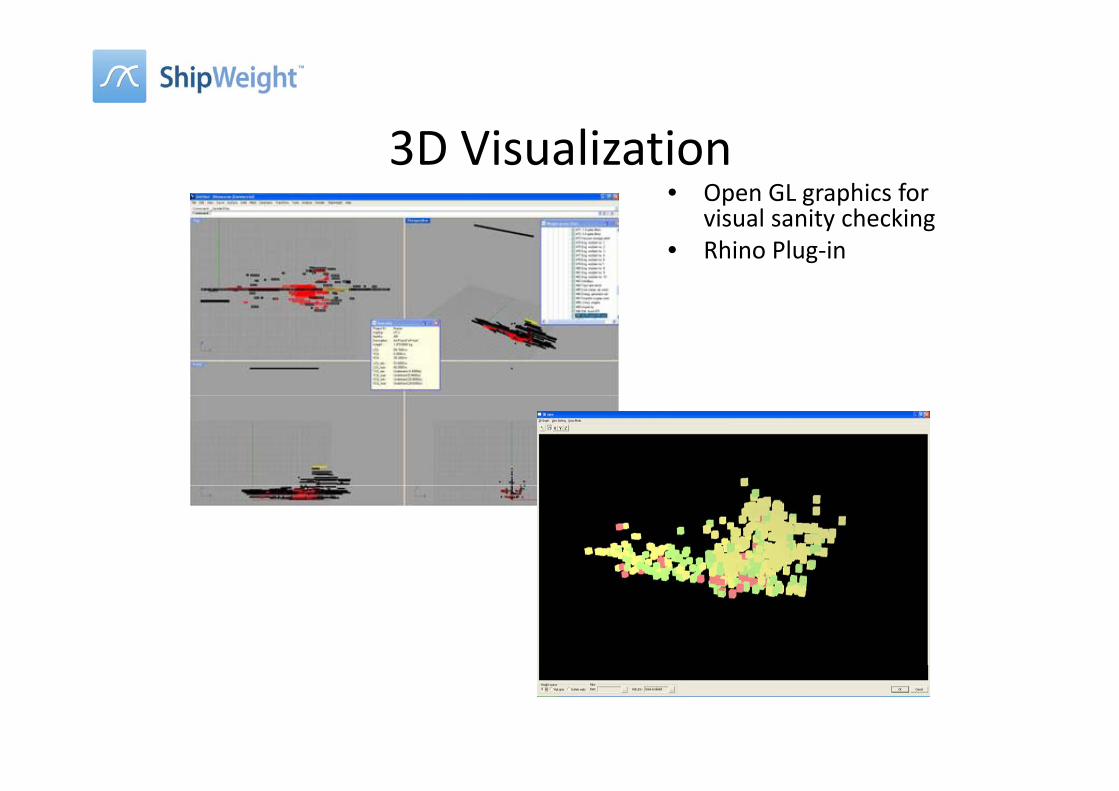
3D Visualization• Open GL graphics for
visual sanity checkingvisual sanity checking• Rhino Plug‐in

Reporting• Crystal Reports combined with ShipWeight custom codes makes it
easy to report at various levels of coordinates and coded subgrouping
• Export to text file Excel Word & PDF formatExport to text file, Excel, Word & PDF format• Group, summarize and display graphs for the quantities you want• SAWE RP12 Report templates are included
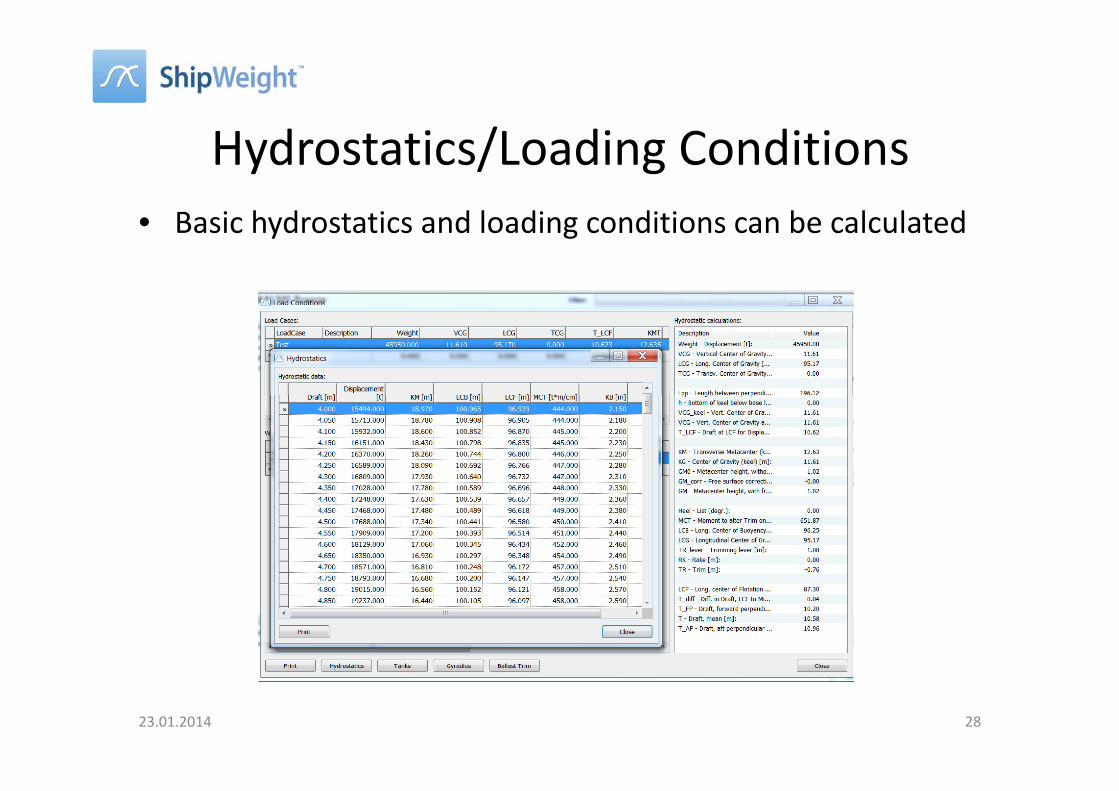
Hydrostatics/Loading ConditionsB i h d t ti d l di diti b l l t d• Basic hydrostatics and loading conditions can be calculated
23.01.2014 28
Vetting databasesD t b b h d f t th• Databases can be exchanged from one server to another through:– Text file import/export of complete databasesp p p– Backup/Restore– Separate export/import
• Excel/Txt for items• Excel/Txt for items• Excel/Txt for parameters• Excel/Txt for custom codes/item settings
• Compare Dialog• Compare Dialog• Custom Crystal Report• RequirementsRequirements
– SWBS Compare: always possible– Custom Codes: Needs to be aligned
23.01.2014 29

Overview
• What is Crystal Reports and how does it connect with ShipWeight?p g
23.01.2014 30

ShipWeight Fullfills all ”Building blocks”ShipWeight – Fullfills all Building blocks
OutputOutput
Reports Data dumps Tailored exports
CalculationsCalculations
Estimation Tracking Monitoring Related Estimation Tracking Monitoring Functions
InputInput
Manual input Generic import Tailored import
Database StorageDatabase Storage
WBS Historical Project data Log data SecurityWBS data Project data Log data Security