shire of capel profilecapel.wa.gov.au/.../sites/167/2015/04/shire-of-capel-profile-2017.pdf ·...
TRANSCRIPT
District Profile
Shire of Capel Profile ii
This district profile was prepared by the Engineering & Development Services Division of the Shire of Capel - first published in 2010.
© Shire of Capel 2017
For more information:
Shire of Capel 31 Forrest Road PO Box 369 CAPEL WA 6271 (08) 9727 0222 [email protected] www.capel.wa.gov.au version 12
Shire of Capel Profile iii
demography economy community
Shire of Capel
District Profile 2017
Capel change… 1
1 Description 3
2 Regional Overview 10
3 Some History 13
4 Demography 15
5 Community and Culture 27
6 The Economy 32
7 Planning Issues 43
References 49 Notes on ABS data 50 Western Australia Rainfall 51 Acknowledgements 52
Shire of Capel Profile iv
The information included in this district profile is gathered from a variety of sources including Shire records, the Australian Bureau of Statistics and various State Government agencies. While some of the information included is derived from sources other than the Shire or the ABS, the Shire has attempted to ensure that the data is correct at the time of publication. However, the Shire does not accept responsibility for any errors that may arise from the use of this information. Where estimates are included, discretion should be used in their application. The sources of information should be noted along with any assumptions used in determining estimates.

Shire of Capel Profile 1
Shire of Capel
District Profile 2017
District Profile This district profile is published by the Shire of Capel to provide data to ratepayers, residents, visitors, investors, consultants and the business community requiring information about demographic change, strategic planning and related issues in the municipality. The Profile includes information about the South West region as well as some relevant background and demography in relation to the Shire. A brief history of the Shire is provided along with some demographic data from the 2011 Census of Population and Housing. Issues related to population, local recreation/cultural activities, events, community resources, agriculture, industry, housing, the economy, urban growth and other planning issues are also addressed briefly. It is anticipated that the information provided in the Profile will assist the community to better understand the issues that are shaping growth in the Shire as well as the impacts of change as urban development continues.
Capel Change Urban development in the Shire of Capel has increased markedly over the past fifteen years and this will continue to drive substantial population growth. The population of the Shire in June 2015 was estimated at 17,316 by the Australian Bureau of Statistics (ABS), a 243% increase on the 2001 population of 7,136. The Shire is one of the fastest growing local government areas in Western Australia, with an average annual growth rate of 4.4% between 2001 and 2015. Industries active in the Shire include dairy and beef farming, horticulture, viticulture, forestry and mineral sands mining. Urban development, particularly in Dalyellup, is influencing the demographic and cultural profile of the Shire’s population. As the towns of Boyanup and Capel begin to experience residential growth also, the Shire will be required to address challenges related to managing demographic change in a ‘growth’ community and the increasing demand for community infrastructure, facilities and services.
Pultenaea skinneri (Skinner's Pea) - Shire floral emblem
Shire of Capel Profile 2
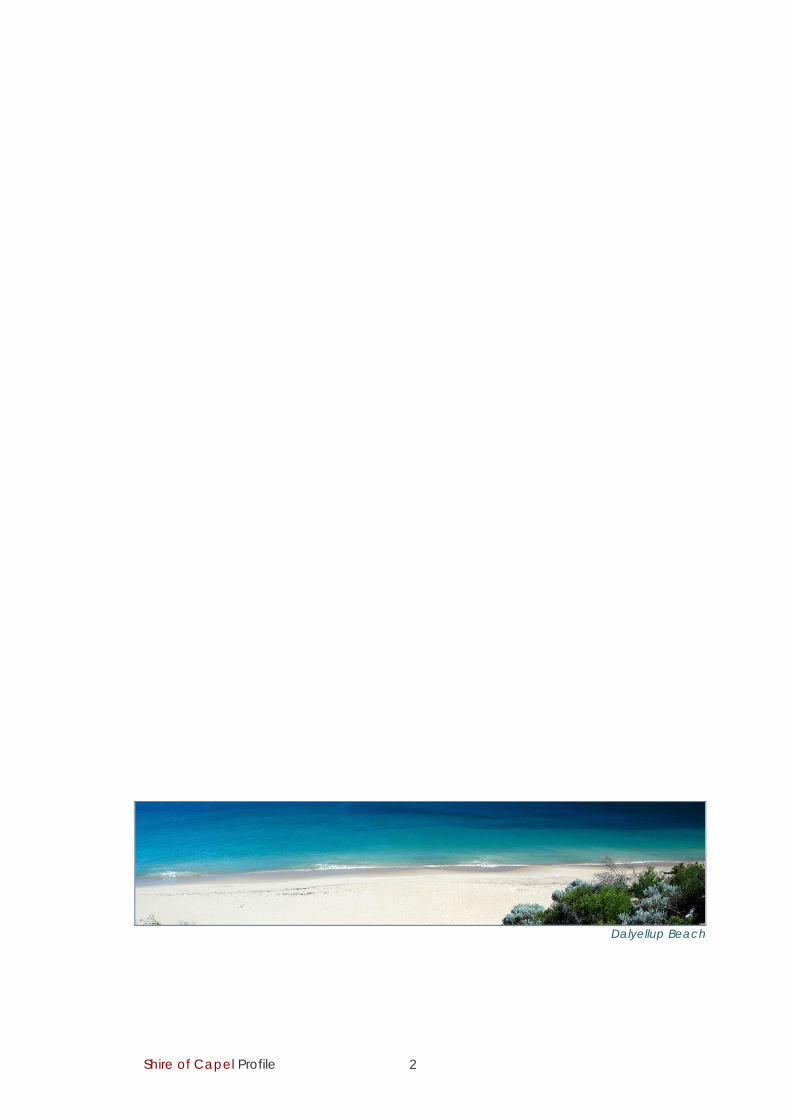
Dalyellup Beach
Shire of Capel Profile 3
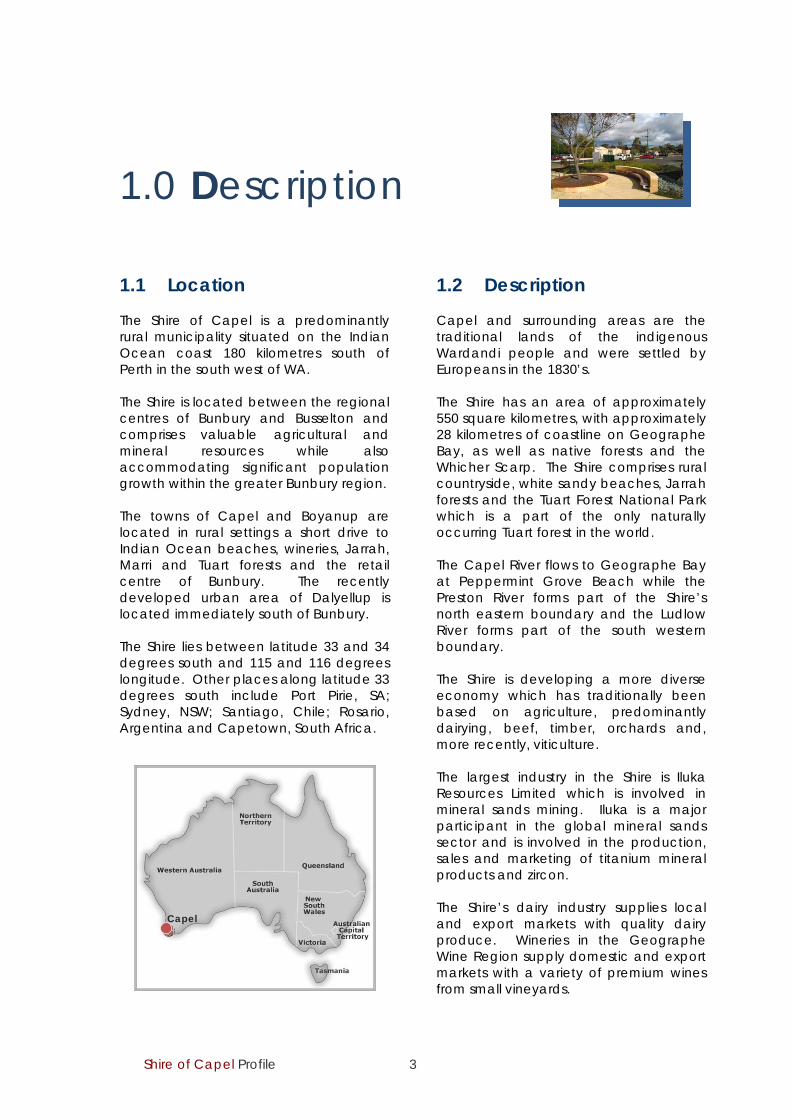
1.0 Description 1.1 Location The Shire of Capel is a predominantly rural municipality situated on the Indian Ocean coast 180 kilometres south of Perth in the south west of WA. The Shire is located between the regional centres of Bunbury and Busselton and comprises valuable agricultural and mineral resources while also accommodating significant population growth within the greater Bunbury region. The towns of Capel and Boyanup are located in rural settings a short drive to Indian Ocean beaches, wineries, Jarrah, Marri and Tuart forests and the retail centre of Bunbury. The recently developed urban area of Dalyellup is located immediately south of Bunbury. The Shire lies between latitude 33 and 34 degrees south and 115 and 116 degrees longitude. Other places along latitude 33 degrees south include Port Pirie, SA; Sydney, NSW; Santiago, Chile; Rosario, Argentina and Capetown, South Africa.
1.2 Description Capel and surrounding areas are the traditional lands of the indigenous Wardandi people and were settled by Europeans in the 1830’s. The Shire has an area of approximately 550 square kilometres, with approximately 28 kilometres of coastline on Geographe Bay, as well as native forests and the Whicher Scarp. The Shire comprises rural countryside, white sandy beaches, Jarrah forests and the Tuart Forest National Park which is a part of the only naturally occurring Tuart forest in the world. The Capel River flows to Geographe Bay at Peppermint Grove Beach while the Preston River forms part of the Shire’s north eastern boundary and the Ludlow River forms part of the south western boundary. The Shire is developing a more diverse economy which has traditionally been based on agriculture, predominantly dairying, beef, timber, orchards and, more recently, viticulture. The largest industry in the Shire is Iluka Resources Limited which is involved in mineral sands mining. Iluka is a major participant in the global mineral sands sector and is involved in the production, sales and marketing of titanium mineral products and zircon. The Shire’s dairy industry supplies local and export markets with quality dairy produce. Wineries in the Geographe Wine Region supply domestic and export markets with a variety of premium wines from small vineyards.
Capel

Shire of Capel Profile 4
The growth occurring in the urban areas of Dalyellup, Peppermint Grove Beach, Capel and Boyanup is a response to the area’s rural and coastal attractiveness, as well as the proximity to employment and natural recreation opportunities. The Shire is also popular for hobby farms and is favoured by those seeking an alternative lifestyle.
As the Shire becomes increasingly urbanised, changes in the population, age structure and cultural diversity of residents will create challenges in maintaining quality lifestyles for residents and ensuring that adequate infrastructure, facilities and services are available over strategic time frames.
Figure 1 Location Map
© 2012 Google
Indian
Ocean
Shire of Capel
Shire of Capel Profile 5
1.3 Climate The Capel area is characterised by a Mediterranean climate with hot, dry summers and wet, mild winters. Average annual rainfall is around 800mm with 90% of rainfall occurring during winter – refer 2013/14 rainfall map on page 52. Summers average three wet days a month from December to February while June to August record eighteen wet days each month on average. Winter temperatures vary from 5-26 degrees C and from 14-40 degrees in summer. 1.4 Geography The Shire is situated within the Swan Coastal Plain and the Blackwood Plateau geographic areas. The Swan Coastal Plain is a low lying, level to gently undulating formation of marine, alluvial and aeolian sediments. It generally comprises relatively infertile, deep sandy soils along with coastal sand dunes, river estuaries, and a number of wetlands separated from the sea by dunes. A number of rivers cross the Plain from east to west from the Whicher Scarp to the Indian Ocean including the Capel, Preston and Ludlow Rivers. Many of the creek systems and lower reaches of the rivers have been modified as part of artificial drainage systems to drain the very low lying and now cleared plain in order to enable its use for agriculture. The Vasse-Wonnerup Wetlands are located within the Shire of Busselton and extend into the Shire of Capel. The wetlands are included on the List of Wetlands of International Importance (Ramsar convention) and provide a significant habitat for waterbirds. The Blackwood Plateau is a moderately elevated formation of laterised rocks in the south east of the Shire. The Whicher Scarp forms the boundary between the Blackwood Plateau and the Swan Coastal Plain, with elevations of up to 180 metres in the south east of the Shire.
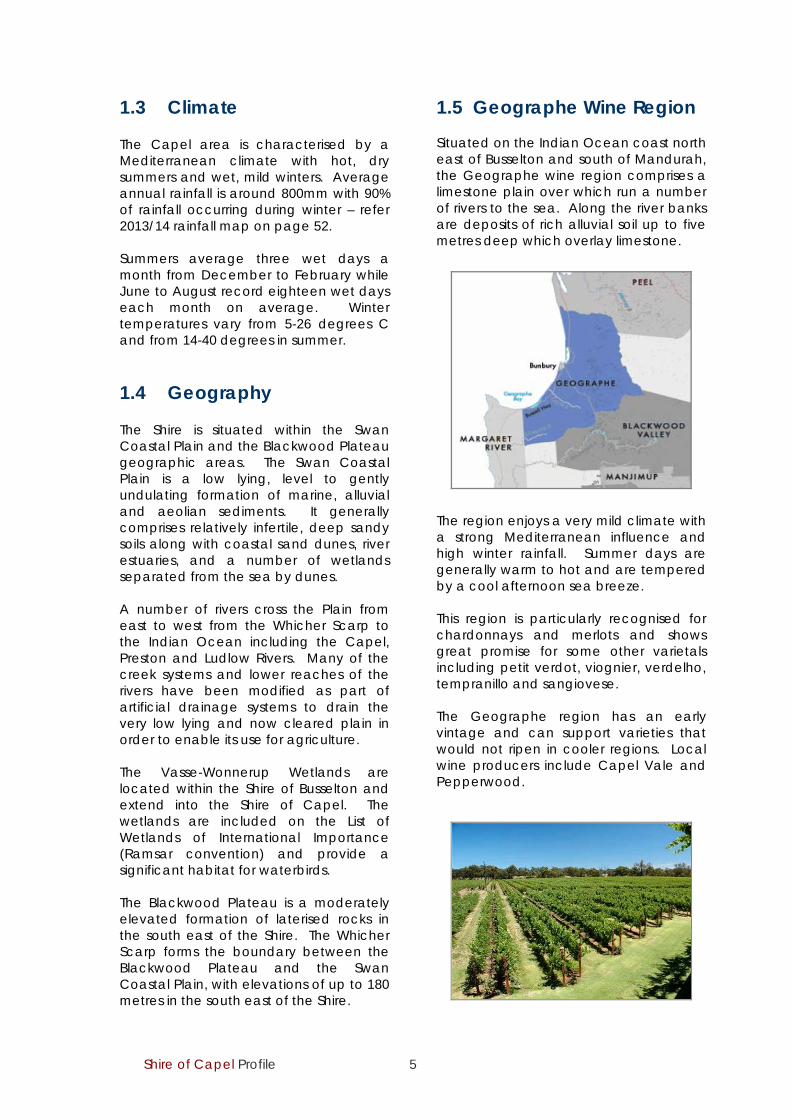
1.5 Geographe Wine Region Situated on the Indian Ocean coast north east of Busselton and south of Mandurah, the Geographe wine region comprises a limestone plain over which run a number of rivers to the sea. Along the river banks are deposits of rich alluvial soil up to five metres deep which overlay limestone.
The region enjoys a very mild climate with a strong Mediterranean influence and high winter rainfall. Summer days are generally warm to hot and are tempered by a cool afternoon sea breeze. This region is particularly recognised for chardonnays and merlots and shows great promise for some other varietals including petit verdot, viognier, verdelho, tempranillo and sangiovese. The Geographe region has an early vintage and can support varieties that would not ripen in cooler regions. Local wine producers include Capel Vale and Pepperwood.
Shire of Capel Profile 6
1.6 Tuart Forest National Park The narrow strip of tuart (Eucalyptus gomphocephala) forest that links Capel and Busselton is one of the more unique places in the south west of the State. The 2,050 hectare Tuart Forest National Park protects the largest remaining tuart forest in the world. It also has the tallest and largest specimens of tuart on the Swan Coastal Plain (over 35 metres in height). The Park is a day-use area, with a number of scenic drives. In the open glades of the forest there are attractive picnic sites, roadside stops and scenic drives to enjoy. Timber cutting was carried out in the area throughout the 1800s. Wood-railed, horse-drawn trams ran the length of the forest, hauling logs to the mill. Sleepers and other timber cutting relicts can still be seen in the park. After World War II, wood was again in strong demand. A new mill was built at Ludlow in 1955 and it worked on and off until 1974.
The Park's vegetation includes a number of isolated and remnant populations of several plant species, normally associated with WA's South Coast. The Park provides an abundance of nesting hollows, used by many species of birds and small mammals. The Park protects the largest remaining wild population of the endangered western ringtail possum. The forest is also home to brush-tail possums, phascogales, bush rats, kangaroos and the quenda (southern brown bandicoot).
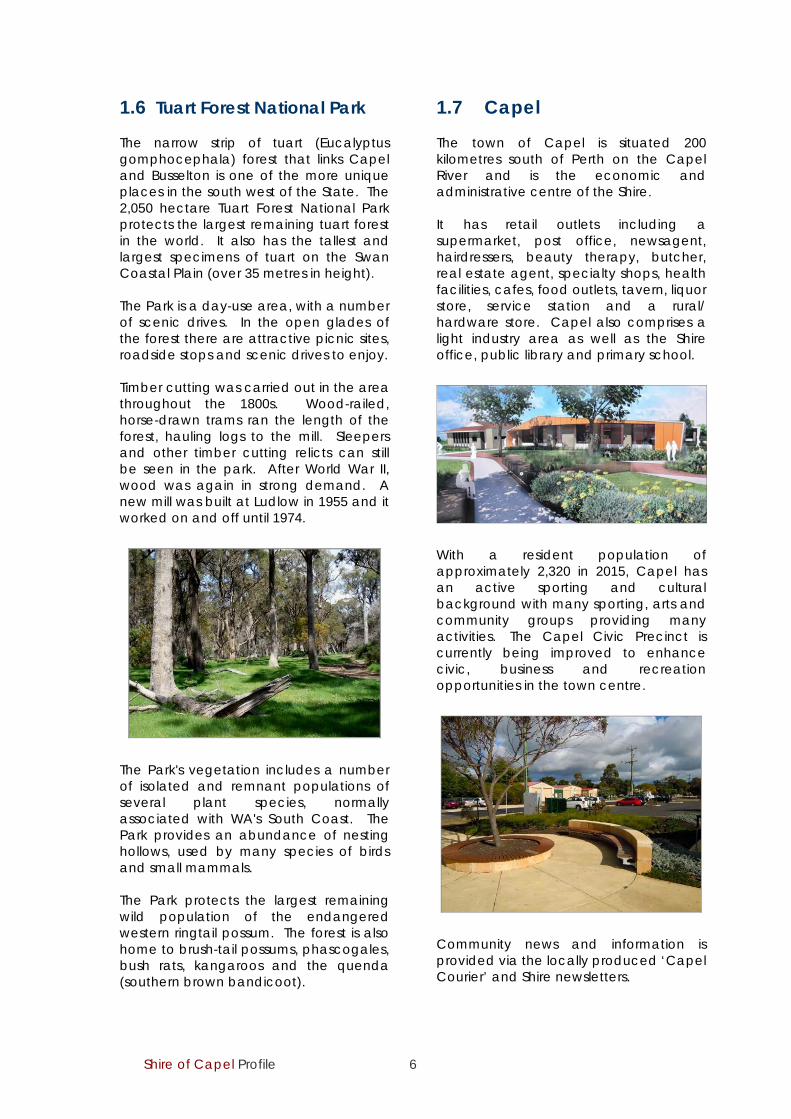
1.7 Capel The town of Capel is situated 200 kilometres south of Perth on the Capel River and is the economic and administrative centre of the Shire. It has retail outlets including a supermarket, post office, newsagent, hairdressers, beauty therapy, butcher, real estate agent, specialty shops, health facilities, cafes, food outlets, tavern, liquor store, service station and a rural/ hardware store. Capel also comprises a light industry area as well as the Shire office, public library and primary school.
With a resident population of approximately 2,320 in 2015, Capel has an active sporting and cultural background with many sporting, arts and community groups providing many activities. The Capel Civic Precinct is currently being improved to enhance civic, business and recreation opportunities in the town centre.
Community news and information is provided via the locally produced ‘Capel Courier’ and Shire newsletters.
Shire of Capel Profile 7
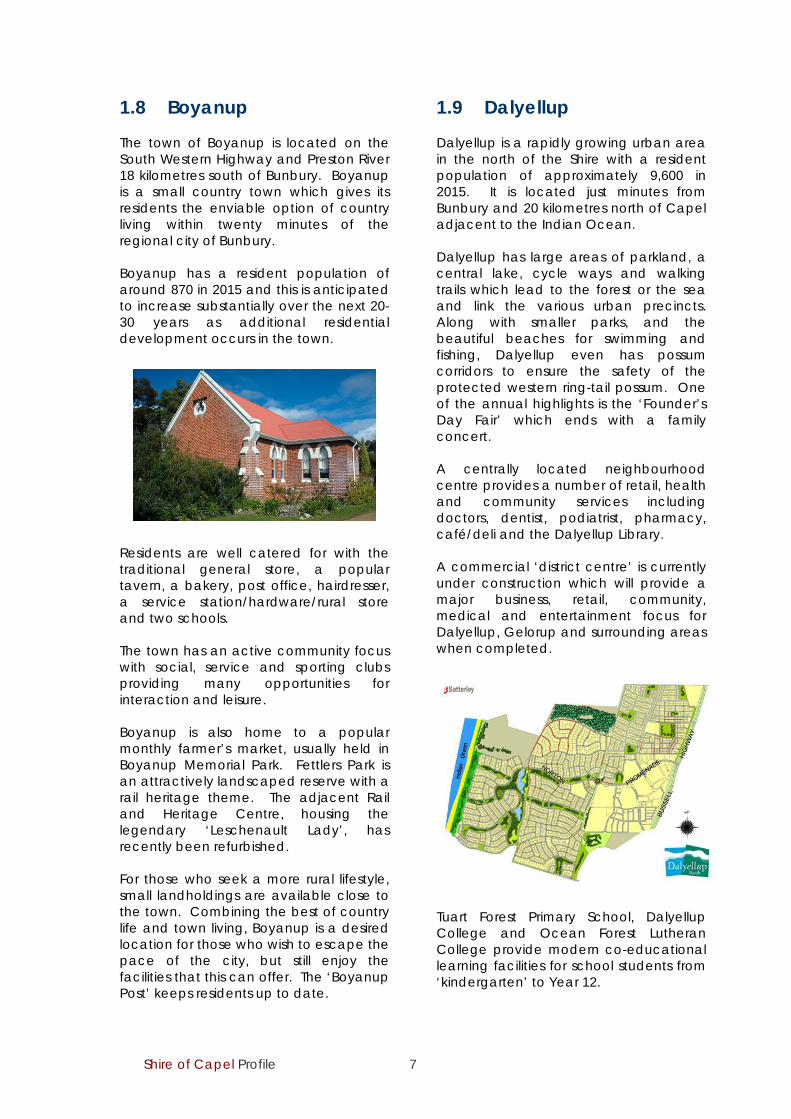
1.8 Boyanup The town of Boyanup is located on the South Western Highway and Preston River 18 kilometres south of Bunbury. Boyanup is a small country town which gives its residents the enviable option of country living within twenty minutes of the regional city of Bunbury. Boyanup has a resident population of around 870 in 2015 and this is anticipated to increase substantially over the next 20-30 years as additional residential development occurs in the town.
Residents are well catered for with the traditional general store, a popular tavern, a bakery, post office, hairdresser, a service station/hardware/rural store and two schools. The town has an active community focus with social, service and sporting clubs providing many opportunities for interaction and leisure. Boyanup is also home to a popular monthly farmer’s market, usually held in Boyanup Memorial Park. Fettlers Park is an attractively landscaped reserve with a rail heritage theme. The adjacent Rail and Heritage Centre, housing the legendary ‘Leschenault Lady’, has recently been refurbished. For those who seek a more rural lifestyle, small landholdings are available close to the town. Combining the best of country life and town living, Boyanup is a desired location for those who wish to escape the pace of the city, but still enjoy the facilities that this can offer. The ‘Boyanup Post’ keeps residents up to date.
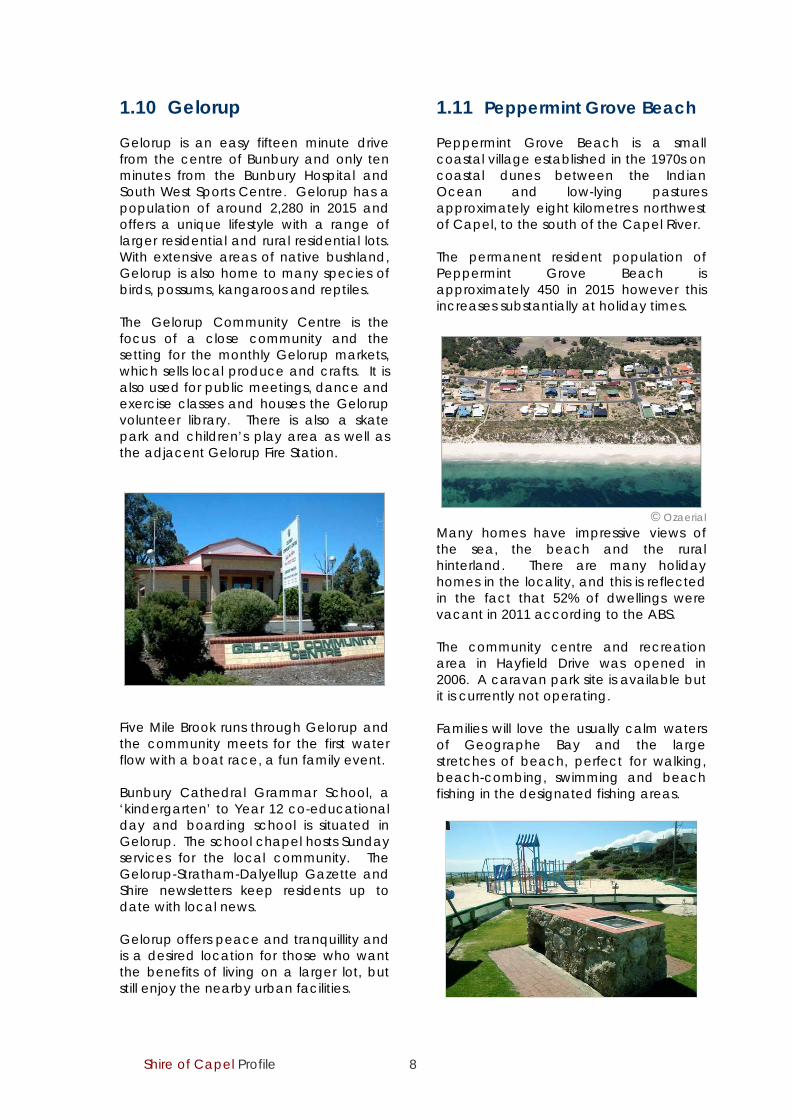
1.9 Dalyellup Dalyellup is a rapidly growing urban area in the north of the Shire with a resident population of approximately 9,600 in 2015. It is located just minutes from Bunbury and 20 kilometres north of Capel adjacent to the Indian Ocean. Dalyellup has large areas of parkland, a central lake, cycle ways and walking trails which lead to the forest or the sea and link the various urban precincts. Along with smaller parks, and the beautiful beaches for swimming and fishing, Dalyellup even has possum corridors to ensure the safety of the protected western ring-tail possum. One of the annual highlights is the ‘Founder’s Day Fair’ which ends with a family concert. A centrally located neighbourhood centre provides a number of retail, health and community services including doctors, dentist, podiatrist, pharmacy, café/deli and the Dalyellup Library. A commercial ‘district centre’ is currently under construction which will provide a major business, retail, community, medical and entertainment focus for Dalyellup, Gelorup and surrounding areas when completed.
Tuart Forest Primary School, Dalyellup College and Ocean Forest Lutheran College provide modern co-educational learning facilities for school students from ‘kindergarten’ to Year 12.
Shire of Capel Profile 8
1.10 Gelorup Gelorup is an easy fifteen minute drive from the centre of Bunbury and only ten minutes from the Bunbury Hospital and South West Sports Centre. Gelorup has a population of around 2,280 in 2015 and offers a unique lifestyle with a range of larger residential and rural residential lots. With extensive areas of native bushland, Gelorup is also home to many species of birds, possums, kangaroos and reptiles. The Gelorup Community Centre is the focus of a close community and the setting for the monthly Gelorup markets, which sells local produce and crafts. It is also used for public meetings, dance and exercise classes and houses the Gelorup volunteer library. There is also a skate park and children’s play area as well as the adjacent Gelorup Fire Station.
Five Mile Brook runs through Gelorup and the community meets for the first water flow with a boat race, a fun family event. Bunbury Cathedral Grammar School, a ‘kindergarten’ to Year 12 co-educational day and boarding school is situated in Gelorup. The school chapel hosts Sunday services for the local community. The Gelorup-Stratham-Dalyellup Gazette and Shire newsletters keep residents up to date with local news. Gelorup offers peace and tranquillity and is a desired location for those who want the benefits of living on a larger lot, but still enjoy the nearby urban facilities.
1.11 Peppermint Grove Beach Peppermint Grove Beach is a small coastal village established in the 1970s on coastal dunes between the Indian Ocean and low-lying pastures approximately eight kilometres northwest of Capel, to the south of the Capel River. The permanent resident population of Peppermint Grove Beach is approximately 450 in 2015 however this increases substantially at holiday times.
© Ozaerial
Many homes have impressive views of the sea, the beach and the rural hinterland. There are many holiday homes in the locality, and this is reflected in the fact that 52% of dwellings were vacant in 2011 according to the ABS. The community centre and recreation area in Hayfield Drive was opened in 2006. A caravan park site is available but it is currently not operating. Families will love the usually calm waters of Geographe Bay and the large stretches of beach, perfect for walking, beach-combing, swimming and beach fishing in the designated fishing areas.
Shire of Capel Profile 9
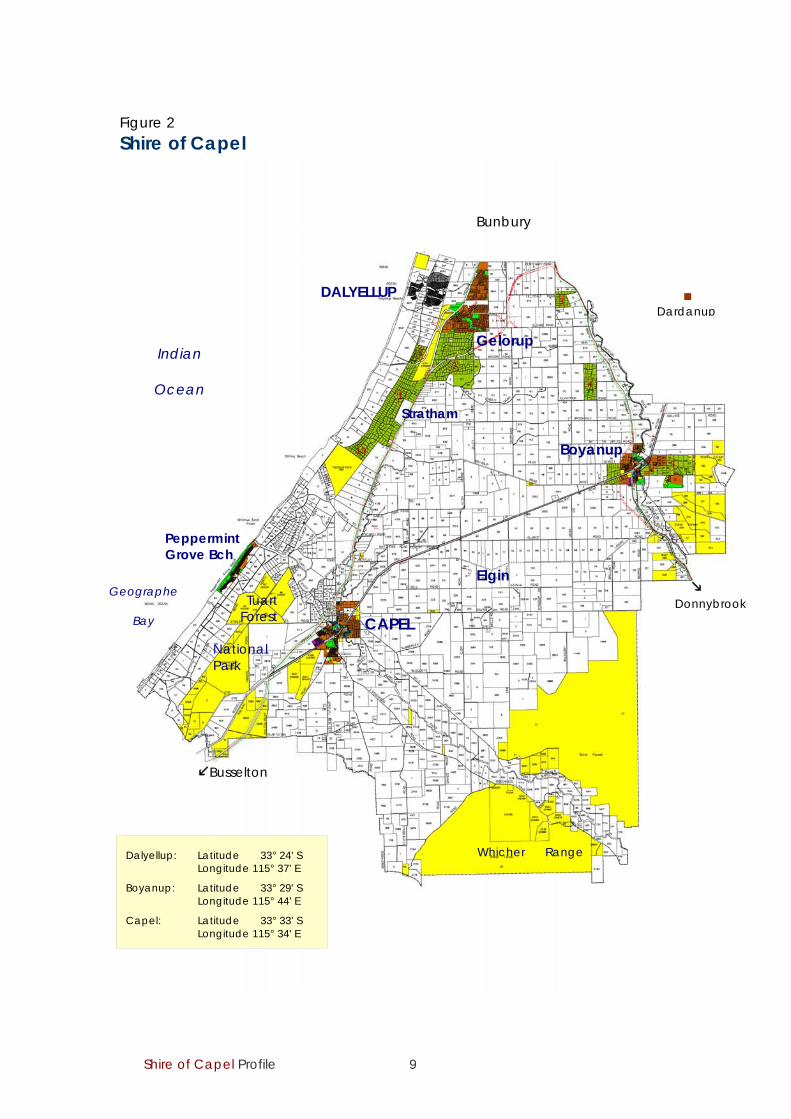
Figure 2 Shire of Capel
DALYELLUP
CAPEL
Boyanup
Gelorup
Peppermint Grove Bch
Stratham
Dalyellup: Latitude 33° 24' S Longitude 115° 37' E
Boyanup: Latitude 33° 29' S Longitude 115° 44' E
Capel: Latitude 33° 33' S Longitude 115° 34' E
Tuart Forest
National Park
Indian
Ocean
Whicher Range
Elgin Geographe
Bay
Bunbury
Busselton
Dardanup
Donnybrook

Shire of Capel Profile 10
2.0 Regional Overview
The South West of Western Australia comprises an area of approximately 24,000 square kilometres. In 2015 the region had a resident population of approximately 175,949 in twelve local government areas. The South West is expected to grow to over 216,000 people by 2027 according to projections published by the Commonwealth Department of Health and Ageing. Most of this growth is forecast to occur along the coastal strip between Australind and Busselton. The City of Bunbury and the adjacent Shires of Capel, Dardanup and Harvey (known as the Greater Bunbury Region)
had a population of approximately 93,304 in 2015. Inland areas in the South West have remained generally stable in terms of population with generally modest growth rates. The indigenous (Nyungar) people of the South West represent approximately 2.2 per cent of the regional population. Table 1 indicates the population of the South West along with average annual growth rates between 2001 and 2015. The South West had an average annual growth rate of 2% between 2001 and 2015 while the Shire of Capel had the highest average annual growth rate in the region.
Table 1 Estimated Resident Population – South West WA
LGA 2001 2006 2011 2015 p Av. annual growth rate
2001-15
Augusta-Marg. River 10,228 11,052 12,228 13,807 2%
Boyup Brook 1,648 1,563 1,617 1,625 0.3% Bridgetown-Greenbushes 4,205 4,134 4,421 4,662 1.1%
Bunbury 30,616 31,450 32,580 34,467 1%
Busselton 23,192 26,711 31,523 36,335 2.8%
Capel 7,136 10,666 15,060 17,316 4.4%
Collie 9,109 9,012 9,343 9,656 0.6%
Dardanup 8,991 10,837 12,852 14,233 2.8% Donnybrook-Balingup 4,701 4,951 5,462 5,849 1.9%
Harvey 18,526 20,450 23,878 27,288 2.8%
Manjimup 10,350 9,718 9,463 9,404 -0.5%
Nannup 1,223 1,282 1,304 1,307 0.3%
South West Region 129,925 141,826 159,730 175,949 2%
Source: ABS, 3218.0 - Regional Population Growth
p: preliminary data
Shire of Capel Profile 11
The South West is known for its biodiversity, attractive beaches, rugged coastlines, native forests and rural landscapes. The South West comprises over 7,000 different plant species and is one of only thirty-four international Biodiversity Hotspots in Australia, as recognised by ‘Conservation International’. While supporting a vibrant tourism industry, the South West also supports a diverse agricultural sector including meat production, dairy, fruit, vegetables,
timber and viticulture. The mineral sand mining industry also contributes significantly to the regional economy. Urban development is being driven by natural growth, migration and ‘long distance commuting’ workers who are now choosing to live in the region. The housing construction industry is tasked with accommodating significant population growth across the region including average annual growth of 4.4% between 2001 and 2015 in the Shire of Capel.
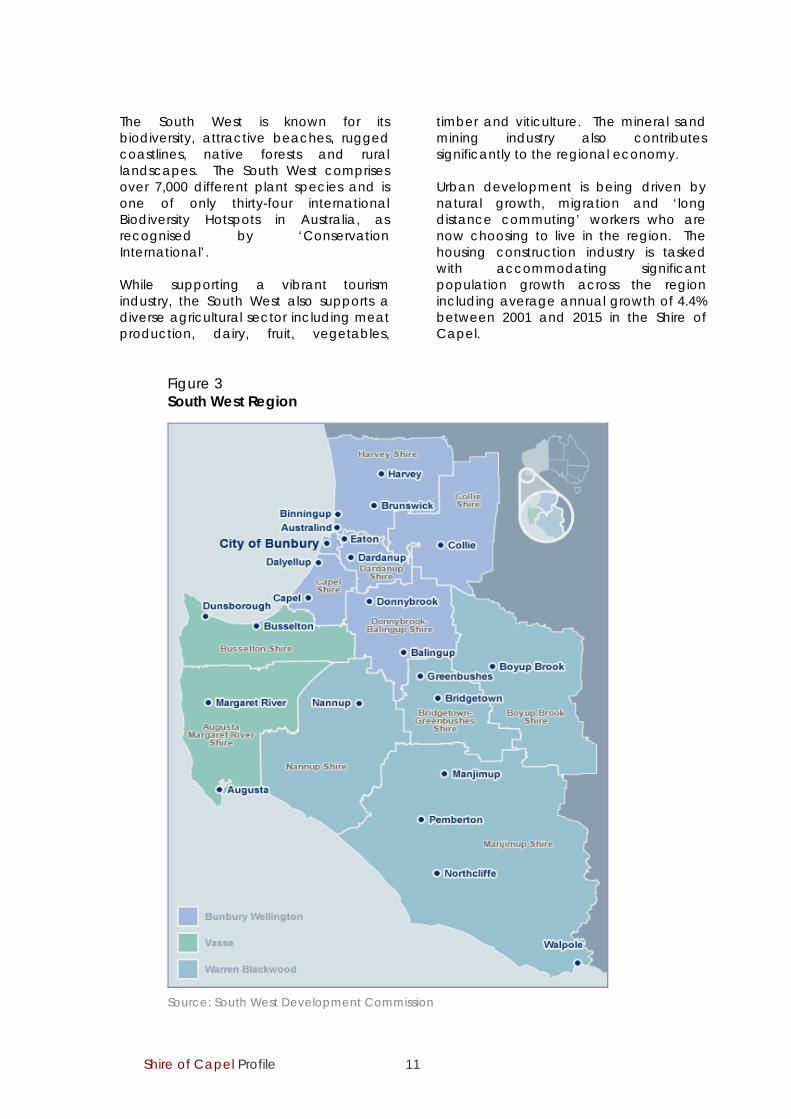
Figure 3 South West Region
Source: South West Development Commission
Shire of Capel Profile 12
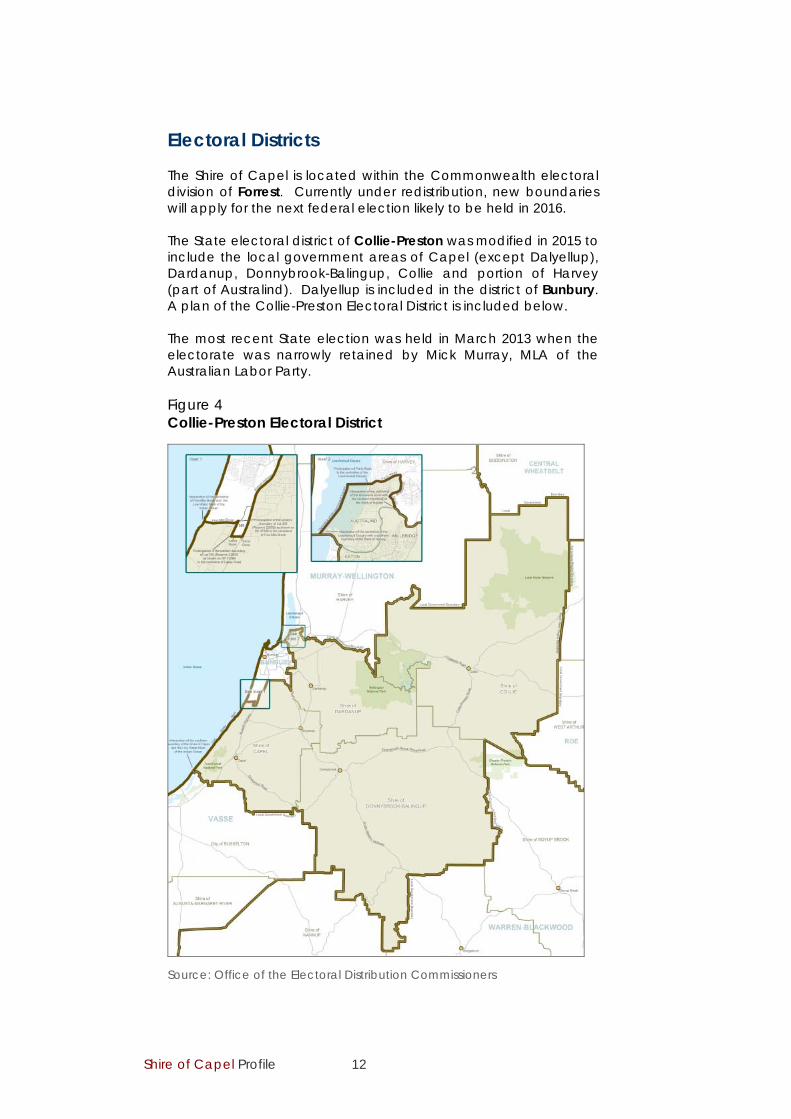
Electoral Districts The Shire of Capel is located within the Commonwealth electoral division of Forrest. Currently under redistribution, new boundaries will apply for the next federal election likely to be held in 2016.
The State electoral district of Collie-Preston was modified in 2015 to include the local government areas of Capel (except Dalyellup), Dardanup, Donnybrook-Balingup, Collie and portion of Harvey (part of Australind). Dalyellup is included in the district of Bunbury. A plan of the Collie-Preston Electoral District is included below. The most recent State election was held in March 2013 when the electorate was narrowly retained by Mick Murray, MLA of the Australian Labor Party.
Figure 4 Collie-Preston Electoral District
Source: Office of the Electoral Distribution Commissioners
Shire of Capel Profile 13
3.0 Some History Capel and surrounding areas are the traditional lands of the Nyungar people known as “Wardandi”, ‘the people who live by the ocean and follow the forest paths’. The Wardandi used the Shire’s waterways extensively during summer for fish and other food and moved inland during winter to hunt. Each community had a traditional camp site (‘kaleep’) and an agreed territory, often marked by scarred trees where each group had hunting rights and sacred sites. A portion of a dead tree with a large scar is kept at the Shire office and this has been interpreted as a tribal boundary marker by a Wardandi elder. In 1801 Captain Nicholas Baudin anchored in a wide bay which he named for his ship, the Geographe. A party of French sailors landed near the Capel River but had little contact with the Wardandi. In 1829 the English landed at Fremantle and began the permanent European settlement of Western Australia. The Shire was settled by Europeans very soon after the Swan River was colonised. In the 1830's the first Governor, Captain James Stirling, took up land in the region along the coast and the Capel River (the Stirling Estate). Early prosperity came from the timber industry when Tuart was used for railway sleepers and wagons but later broad acre farming, including dairying, was established. The Capel River was discovered by F. Ludlow in 1834 and in December 1836 Lt H Bunbury crossed a considerable river with steep banks which he says was subsequently named the “Capel” by J Bussell, after a cousin, Miss Capel Carter.
The first settler in the area, Mr Child, arrived in 1843 and settled at ‘Minninup’. The establishment of a town on the Capel River was first considered in 1844, and the place was given its Nyungar name “Coolingup”, which means ‘watering place/a swamp where spearwood grows’ (although it was written as ‘Coolingnup’ on some plans). In the early 1850s George Payne built a water mill on the Capel River near the town site to mill grain for his neighbours. The town was surveyed in the 1870's, but lots were not sold until 1897. The town’s name was changed to Capel in 1899. In the mid-nineteenth century convicts brought labour and skills to assist in the development of the land but it was difficult work. The later ‘group settlers’ were often ill-equipped to clear and farm the land, and many were forced to walk off their blocks.

Shire of Capel Profile 14
The locality of Boyanup was settled in the late 1840s by James Bessonnet, who named his farm “Boyanup” meaning 'place of quartz' in the Nyungar language (boya is said to mean rock or stone). However Bessonnet soon left the land and returned to Ireland. In 1863 Thomas and Charlotte Simmons settled on land near the bridge over the Preston River and their son James was the first settler’s child to be born in Boyanup. By 1877 a school had been established at Gwindinup, attended by around 18 children and taught by Miss Moriarty.
Boyanup War Memorial
In 1888 a railway was built between Boyanup and Bunbury and the South West Railway arrived in Capel in 1896. In 1891 the government opened up land in the area by declaring the ‘Boyanup Agricultural Area’. Town lots were surveyed in 1893 and the Boyanup town site was gazetted in 1894.
English Oak planted at the Boyanup railway station in 1904 by former station master TE (Ned) Reilly.
The Capel Roads District was gazetted in 1907 and the Shire of Capel was proclaimed in 1961. New Shire offices were opened in 1969 and the Capel Library was added in 1991. The Shire office expanded into the library area in 2008 when the new Iluka Capel Public Library was opened as part of the rebuilt Capel Community Centre, which was constructed around the former community hall in Forrest Road.
Former Capel Roads Board Expansion and improvement of the Shire administration centre was completed in August 2015 in response to increased demand for services.
Timber railway bridge over Capel River
The Shire has developed slowly as a rural community since 1900 and now looks forward to significant change as urban development surges south from Bunbury and the population grows more quickly than ever anticipated.

Shire of Capel Profile 15
4.0 Demography 4.1 Resident Population The estimated resident population (ERP) of the Shire was 17,061 in June 2014 according to the ABS. In June 2015 the population is likely to be around 17,850. This indicates that the population has more than doubled since 2001. The average annual growth rate between 2001 and 2014 was 7%, which is one of the highest rates in WA.
Table 2 summarises the Shire’s inter-census estimated permanent resident population change between 1991 and 2011. The population increased by 50% between 2001 and 2006, and by 41% between 2006 and 2011. It is estimated that the population will increase to around 18,700 in 2016.
Table 2 Estimated Resident Population 1991-2011
1991 1996 2001 2006 2011
Shire of Capel 5,452 5,990 7,136 10,666 15,060
Change 1,469 538 1,146 3,530 4,394
Average annual growth rate 6.5% 1.9% 3.6% 8.4% 7.14%
Average annual growth rate 2001-2011 7.75% Source: ABS, 3218.0 - Regional Population Growth.
In 2011, 49.6% of residents in the Shire were male and 50.4% female compared to the figures for Australia of 49.4% male and 50.6% female. The Census indicated that 2.3% of Shire residents were indigenous persons, compared with 2.5% in Australia. The median age of indigenous persons in the Shire was 20 in 2011.
There were 3,976 families in the Shire in 2011 and there was an average of two children per family, while the average household size was 2.9 persons. Table 3 includes the estimated resident population of selected localities. The 2011 estimates are derived from 2011 Census data adjusted for the rebased ERP data published by the ABS.
Shire of Capel Profile 16
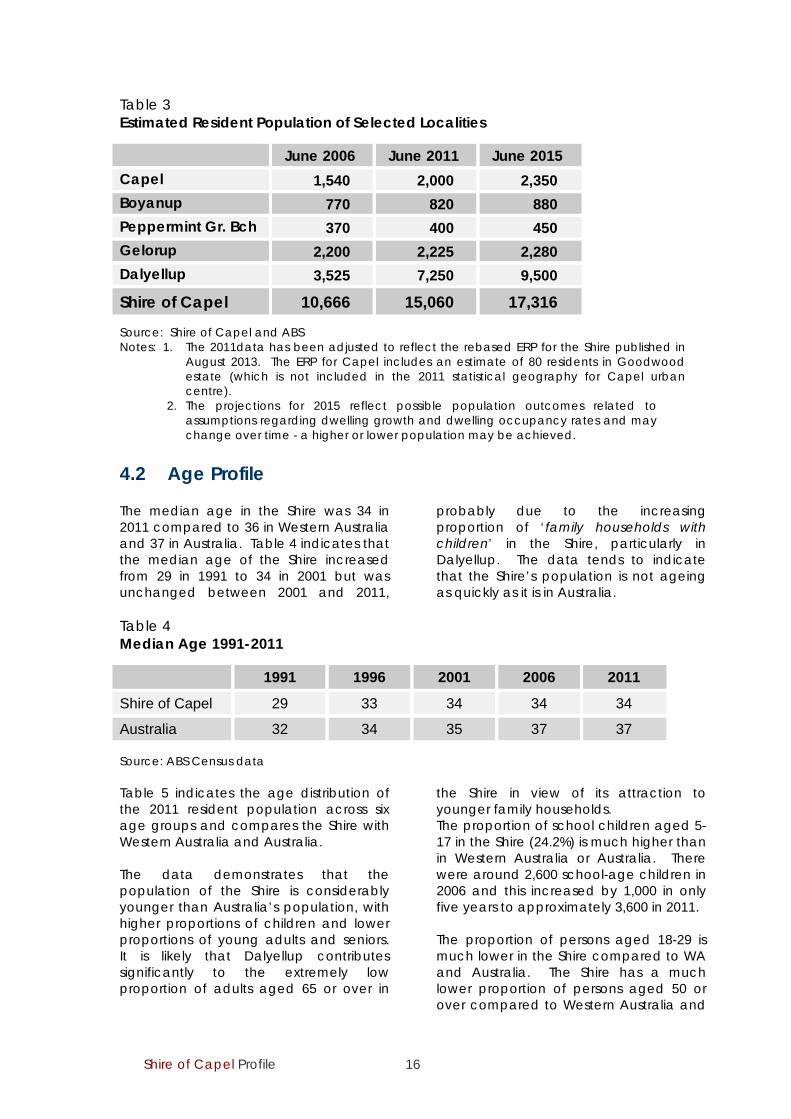
Table 3 Estimated Resident Population of Selected Localities
June 2006 June 2011 June 2015 Capel 1,540 2,000 2,350 Boyanup 770 820 880 Peppermint Gr. Bch 370 400 450 Gelorup 2,200 2,225 2,280 Dalyellup 3,525 7,250 9,500
Shire of Capel 10,666 15,060 17,316
Source: Shire of Capel and ABS Notes: 1. The 2011data has been adjusted to reflect the rebased ERP for the Shire published in
August 2013. The ERP for Capel includes an estimate of 80 residents in Goodwood estate (which is not included in the 2011 statistical geography for Capel urban centre).
2. The projections for 2015 reflect possible population outcomes related to assumptions regarding dwelling growth and dwelling occupancy rates and may change over time - a higher or lower population may be achieved.
4.2 Age Profile The median age in the Shire was 34 in 2011 compared to 36 in Western Australia and 37 in Australia. Table 4 indicates that the median age of the Shire increased from 29 in 1991 to 34 in 2001 but was unchanged between 2001 and 2011,
probably due to the increasing proportion of ‘family households with children’ in the Shire, particularly in Dalyellup. The data tends to indicate that the Shire’s population is not ageing as quickly as it is in Australia.
Table 4 Median Age 1991-2011
1991 1996 2001 2006 2011
Shire of Capel 29 33 34 34 34
Australia 32 34 35 37 37 Source: ABS Census data Table 5 indicates the age distribution of the 2011 resident population across six age groups and compares the Shire with Western Australia and Australia. The data demonstrates that the population of the Shire is considerably younger than Australia’s population, with higher proportions of children and lower proportions of young adults and seniors. It is likely that Dalyellup contributes significantly to the extremely low proportion of adults aged 65 or over in
the Shire in view of its attraction to younger family households. The proportion of school children aged 5-17 in the Shire (24.2%) is much higher than in Western Australia or Australia. There were around 2,600 school-age children in 2006 and this increased by 1,000 in only five years to approximately 3,600 in 2011. The proportion of persons aged 18-29 is much lower in the Shire compared to WA and Australia. The Shire has a much lower proportion of persons aged 50 or over compared to Western Australia and
Shire of Capel Profile 17
Australia. Only 7.7% of the Shire’s population is aged 65 or over compared
to 14% in Australia.
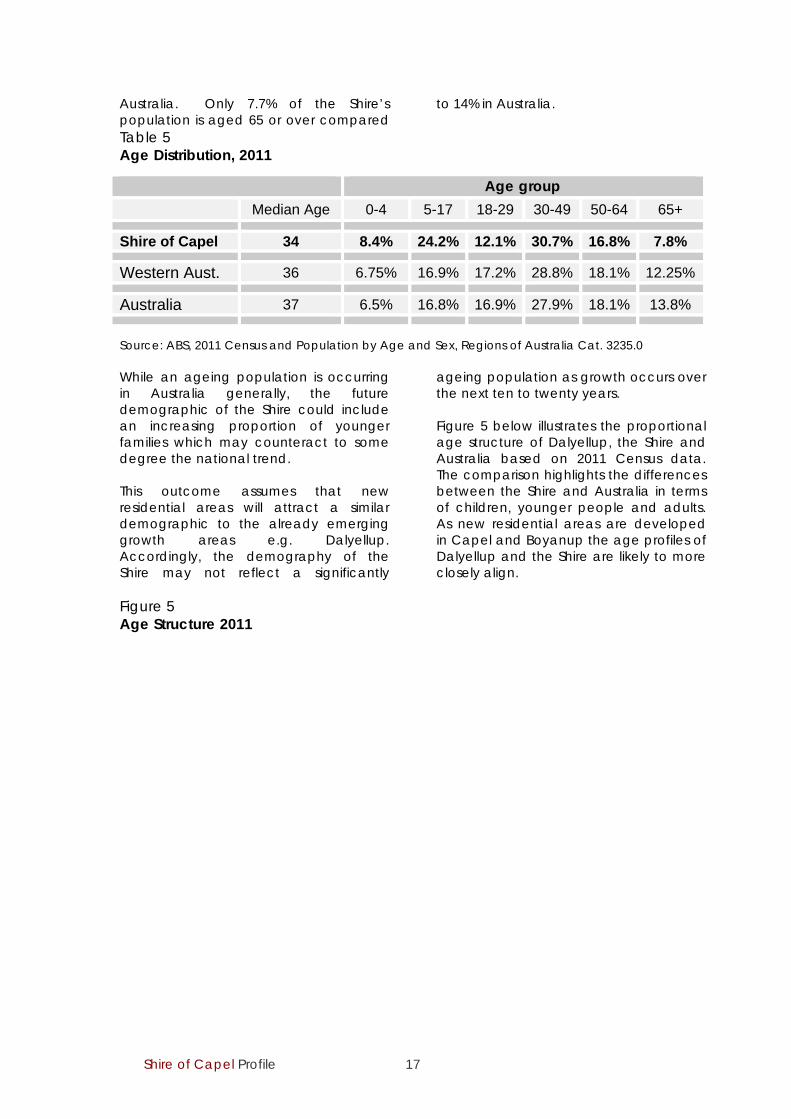
Table 5 Age Distribution, 2011
Age group Median Age 0-4 5-17 18-29 30-49 50-64 65+
Shire of Capel 34 8.4% 24.2% 12.1% 30.7% 16.8% 7.8%
Western Aust. 36 6.75% 16.9% 17.2% 28.8% 18.1% 12.25%
Australia 37 6.5% 16.8% 16.9% 27.9% 18.1% 13.8%
Source: ABS, 2011 Census and Population by Age and Sex, Regions of Australia Cat. 3235.0 While an ageing population is occurring in Australia generally, the future demographic of the Shire could include an increasing proportion of younger families which may counteract to some degree the national trend. This outcome assumes that new residential areas will attract a similar demographic to the already emerging growth areas e.g. Dalyellup. Accordingly, the demography of the Shire may not reflect a significantly
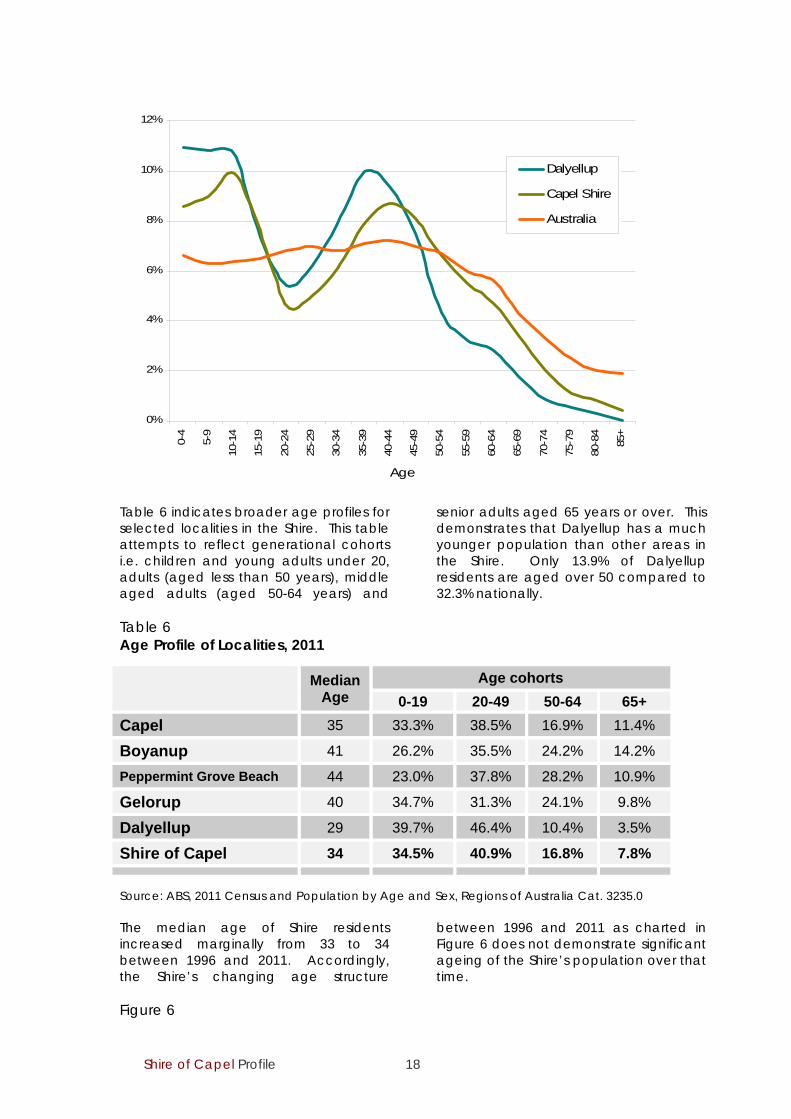
ageing population as growth occurs over the next ten to twenty years. Figure 5 below illustrates the proportional age structure of Dalyellup, the Shire and Australia based on 2011 Census data. The comparison highlights the differences between the Shire and Australia in terms of children, younger people and adults. As new residential areas are developed in Capel and Boyanup the age profiles of Dalyellup and the Shire are likely to more closely align.
Figure 5 Age Structure 2011
Shire of Capel Profile 18
0%
2%
4%
6%
8%
10%
12%
0-4
5-9
10-
14
15-1
9
20-2
4
25-2
9
30-3
4
35-3
9
40-4
4
45-4
9
50-5
4
55-5
9
60-6
4
65-6
9
70-7
4
75-7
9
80-8
4
85+
Age
Dalyellup
Capel Shire
Australia
Table 6 indicates broader age profiles for selected localities in the Shire. This table attempts to reflect generational cohorts i.e. children and young adults under 20, adults (aged less than 50 years), middle aged adults (aged 50-64 years) and
senior adults aged 65 years or over. This demonstrates that Dalyellup has a much younger population than other areas in the Shire. Only 13.9% of Dalyellup residents are aged over 50 compared to 32.3% nationally.
Table 6 Age Profile of Localities, 2011 Median
Age Age cohorts
0-19 20-49 50-64 65+
Capel 35 33.3% 38.5% 16.9% 11.4%
Boyanup 41 26.2% 35.5% 24.2% 14.2%
Peppermint Grove Beach 44 23.0% 37.8% 28.2% 10.9%
Gelorup 40 34.7% 31.3% 24.1% 9.8%
Dalyellup 29 39.7% 46.4% 10.4% 3.5%
Shire of Capel 34 34.5% 40.9% 16.8% 7.8%
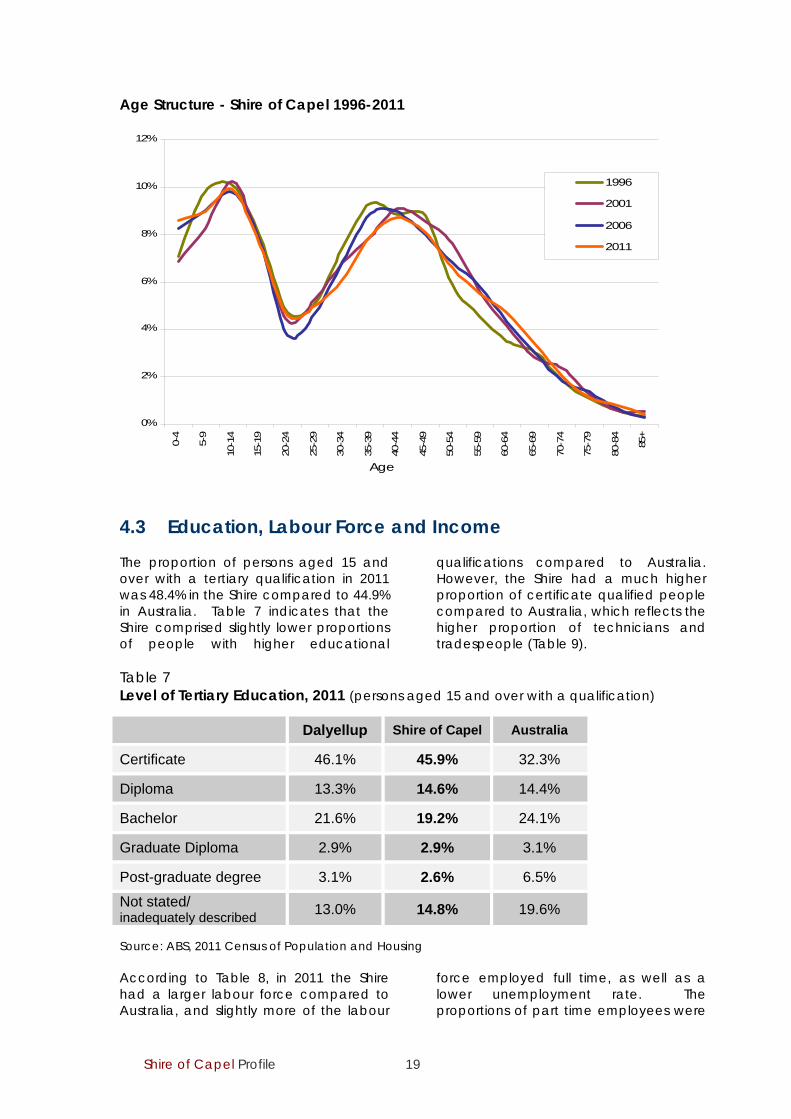
Source: ABS, 2011 Census and Population by Age and Sex, Regions of Australia Cat. 3235.0 The median age of Shire residents increased marginally from 33 to 34 between 1996 and 2011. Accordingly, the Shire’s changing age structure
between 1996 and 2011 as charted in Figure 6 does not demonstrate significant ageing of the Shire’s population over that time.
Figure 6
Shire of Capel Profile 19
Age Structure - Shire of Capel 1996-2011
0%
2%
4%
6%
8%
10%
12%
0-4
5-9
10-
14
15-1
9
20-2
4
25-2
9
30-3
4
35-3
9
40-4
4
45-4
9
50-5
4
55-5
9
60-6
4
65-6
9
70-7
4
75-7
9
80-8
4
85+
Age
1996
2001
2006
2011
4.3 Education, Labour Force and Income The proportion of persons aged 15 and over with a tertiary qualification in 2011 was 48.4% in the Shire compared to 44.9% in Australia. Table 7 indicates that the Shire comprised slightly lower proportions of people with higher educational
qualifications compared to Australia. However, the Shire had a much higher proportion of certificate qualified people compared to Australia, which reflects the higher proportion of technicians and tradespeople (Table 9).
Table 7 Level of Tertiary Education, 2011 (persons aged 15 and over with a qualification)
Dalyellup Shire of Capel Australia
Certificate 46.1% 45.9% 32.3%
Diploma 13.3% 14.6% 14.4%
Bachelor 21.6% 19.2% 24.1%
Graduate Diploma 2.9% 2.9% 3.1%
Post-graduate degree 3.1% 2.6% 6.5%
Not stated/ inadequately described
13.0% 14.8% 19.6%
Source: ABS, 2011 Census of Population and Housing According to Table 8, in 2011 the Shire had a larger labour force compared to Australia, and slightly more of the labour
force employed full time, as well as a lower unemployment rate. The proportions of part time employees were
Shire of Capel Profile 20
the same apart from Dalyellup which had a lower proportion of part time workers. Table 8 Labour Force, 2011 (persons aged 15 years and over)
DalyellupShire of Capel
Australia
Labour force (as a percentage of persons aged over 15 years) 72.4% 67.5% 61.4%
Employed full-time (as a % of labour force) 61.6% 59.9% 59.7%
Employed part-time (as a % of labour force) 26.9% 28.8% 28.7%
Away from work (as a % of labour force) 7.0% 7.3% 5.9%
Unemployed (as a % of labour force) 4.5% 4.0% 5.6%
Source: ABS, 2011 Census of Population and Housing
Shire of Capel Profile 21
Table 9 indicates that in 2011 the Shire had a very high percentage of technicians, tradespeople, machinery operators and labourers compared to Australia, possibly reflecting the mining,
dairy and other similar industries in the Shire. The Shire also had lower proportions of administration workers, managers and professionals compared to the Australian population.
Table 9 Occupation, 2011 (employed persons aged 15 years and over)
Dalyellup Shire of Capel Australia
Technicians/trades workers 19.2% 19.3% 14.2% Labourers 8.7% 10.3% 9.4% Machinery operators 8.5% 9.1% 6.6%
Professionals 19.5% 18.2% 21.3%
Admin. workers 13.8% 11.9% 14.7%
Managers 10.9% 11.9% 12.9%
Sales workers 10.0% 8.6% 9.4%
Community/personal service workers
8.2% 8.6% 9.7%
Source: ABS, 2011 Census of Population and Housing According to 2011 Census data, residents of the Shire, and particularly Dalyellup residents, enjoyed higher median incomes than the national medians, reflecting the high level of skilled employment in the Shire.
Table 10 indicates that the median weekly household income of the Shire was $1,628 in 2011, 32% higher than the weekly median household income for Australia.
Table 10 Income, 2011 (persons aged 15 years and over)
Dalyellup Shire of Capel Australia
Median personal income/week $759 $664 $577
Median household income/week $1,858 $1,628 $1,234
Median family income/week $1,958 $1,783 $1,481
Source: ABS, 2011 Census of Population and Housing 4.4 Household Structure Table 11 indicates that the Shire, particularly Dalyellup, has much higher proportions of family households compared to Australia which may reflect the popularity of the area with younger families building their first homes.
Table 12 confirms that the Shire also has a much higher proportion of couple families with children, which again reflects the popularity of Dalyellup with young families. The Shire has a lower
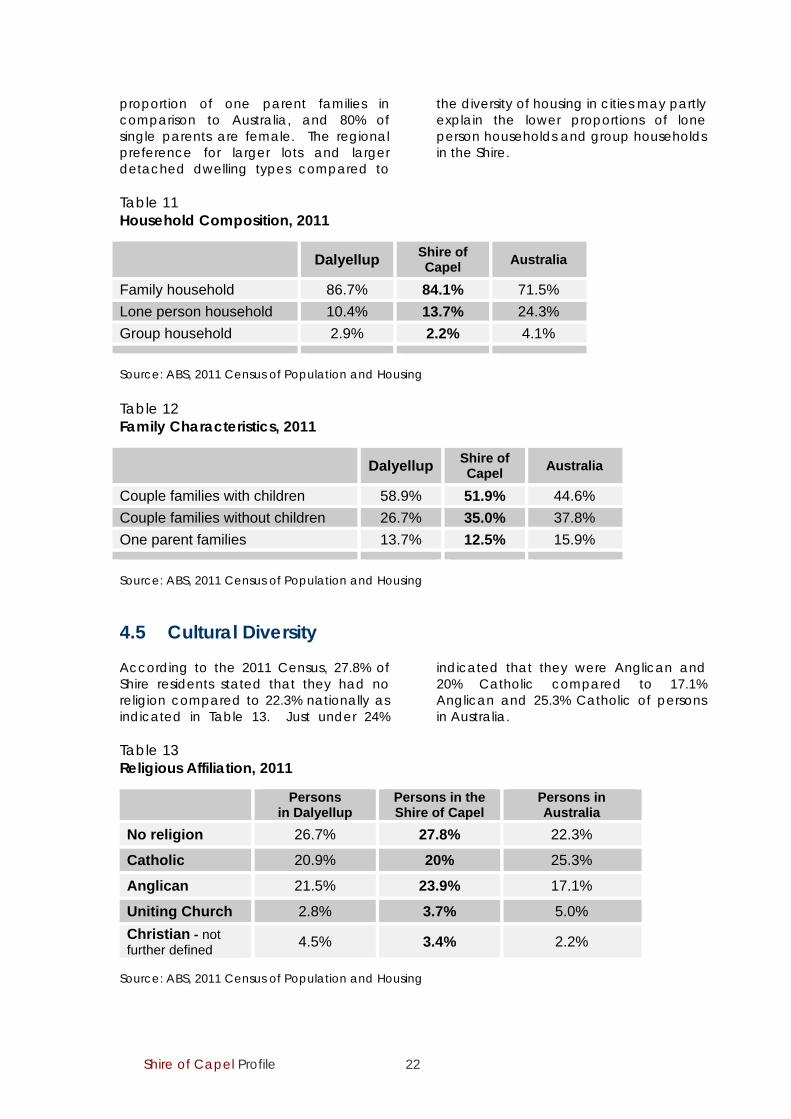
Shire of Capel Profile 22
proportion of one parent families in comparison to Australia, and 80% of single parents are female. The regional preference for larger lots and larger detached dwelling types compared to
the diversity of housing in cities may partly explain the lower proportions of lone person households and group households in the Shire.
Table 11 Household Composition, 2011
Dalyellup Shire of Capel Australia
Family household 86.7% 84.1% 71.5%
Lone person household 10.4% 13.7% 24.3%
Group household 2.9% 2.2% 4.1%
Source: ABS, 2011 Census of Population and Housing Table 12 Family Characteristics, 2011
Dalyellup Shire of Capel Australia
Couple families with children 58.9% 51.9% 44.6%
Couple families without children 26.7% 35.0% 37.8%
One parent families 13.7% 12.5% 15.9%
Source: ABS, 2011 Census of Population and Housing 4.5 Cultural Diversity According to the 2011 Census, 27.8% of Shire residents stated that they had no religion compared to 22.3% nationally as indicated in Table 13. Just under 24%
indicated that they were Anglican and 20% Catholic compared to 17.1% Anglican and 25.3% Catholic of persons in Australia.
Table 13 Religious Affiliation, 2011
Persons in Dalyellup
Persons in the Shire of Capel
Persons in Australia
No religion 26.7% 27.8% 22.3%
Catholic 20.9% 20% 25.3%
Anglican 21.5% 23.9% 17.1%
Uniting Church 2.8% 3.7% 5.0%
Christian - not further defined
4.5% 3.4% 2.2%
Source: ABS, 2011 Census of Population and Housing
Shire of Capel Profile 23
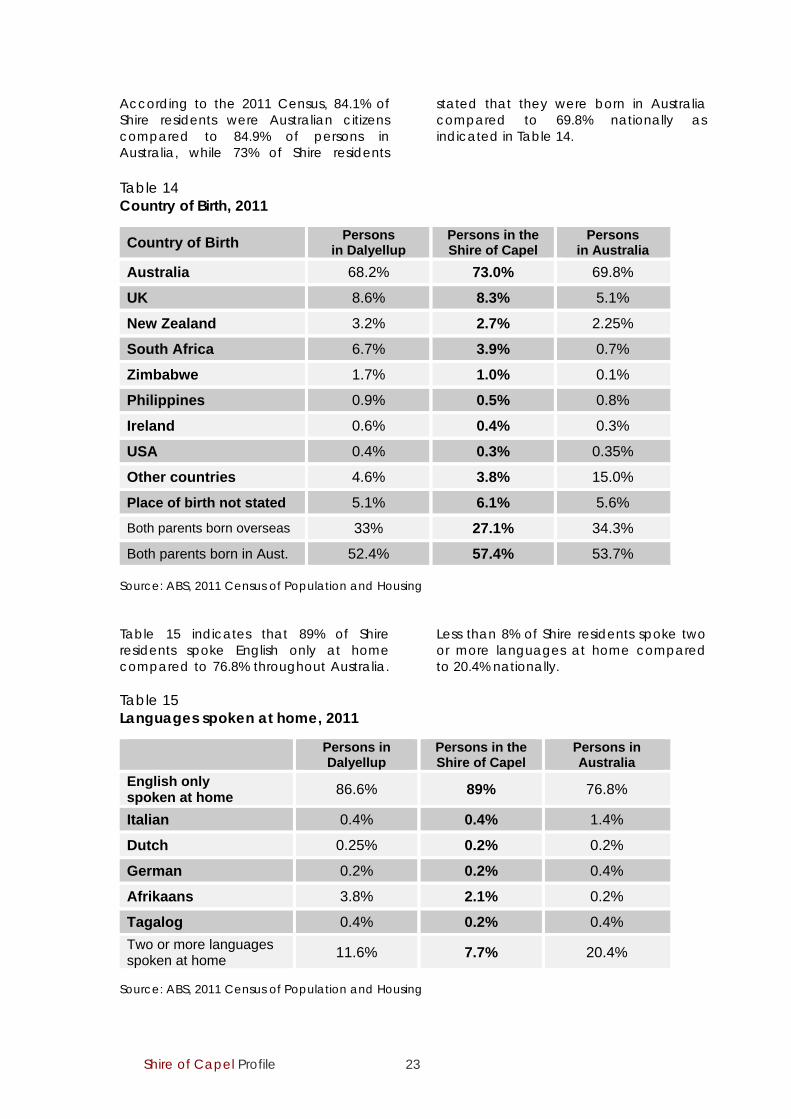
According to the 2011 Census, 84.1% of Shire residents were Australian citizens compared to 84.9% of persons in Australia, while 73% of Shire residents
stated that they were born in Australia compared to 69.8% nationally as indicated in Table 14.
Table 14 Country of Birth, 2011
Country of Birth Persons in Dalyellup
Persons in the Shire of Capel
Persons in Australia
Australia 68.2% 73.0% 69.8%
UK 8.6% 8.3% 5.1%
New Zealand 3.2% 2.7% 2.25%
South Africa 6.7% 3.9% 0.7%
Zimbabwe 1.7% 1.0% 0.1%
Philippines 0.9% 0.5% 0.8%
Ireland 0.6% 0.4% 0.3%
USA 0.4% 0.3% 0.35%
Other countries 4.6% 3.8% 15.0%
Place of birth not stated 5.1% 6.1% 5.6%
Both parents born overseas 33% 27.1% 34.3%
Both parents born in Aust. 52.4% 57.4% 53.7% Source: ABS, 2011 Census of Population and Housing Table 15 indicates that 89% of Shire residents spoke English only at home compared to 76.8% throughout Australia.
Less than 8% of Shire residents spoke two or more languages at home compared to 20.4% nationally.
Table 15 Languages spoken at home, 2011 Persons in
Dalyellup Persons in the Shire of Capel
Persons in Australia
English only spoken at home
86.6% 89% 76.8%
Italian 0.4% 0.4% 1.4%
Dutch 0.25% 0.2% 0.2%
German 0.2% 0.2% 0.4%
Afrikaans 3.8% 2.1% 0.2%
Tagalog 0.4% 0.2% 0.4%
Two or more languages spoken at home
11.6% 7.7% 20.4%
Source: ABS, 2011 Census of Population and Housing
Shire of Capel Profile 24
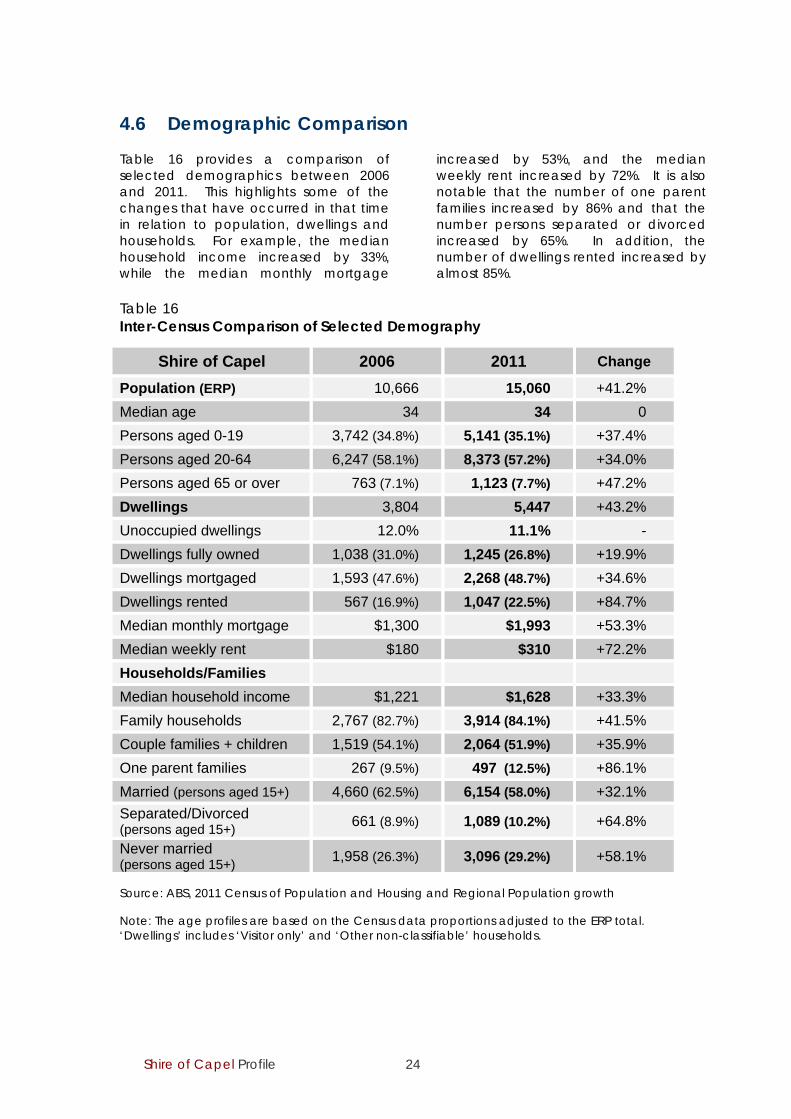
4.6 Demographic Comparison Table 16 provides a comparison of selected demographics between 2006 and 2011. This highlights some of the changes that have occurred in that time in relation to population, dwellings and households. For example, the median household income increased by 33%, while the median monthly mortgage
increased by 53%, and the median weekly rent increased by 72%. It is also notable that the number of one parent families increased by 86% and that the number persons separated or divorced increased by 65%. In addition, the number of dwellings rented increased by almost 85%.
Table 16 Inter-Census Comparison of Selected Demography
Shire of Capel 2006 2011 Change
Population (ERP) 10,666 15,060 +41.2%
Median age 34 34 0
Persons aged 0-19 3,742 (34.8%) 5,141 (35.1%) +37.4%
Persons aged 20-64 6,247 (58.1%) 8,373 (57.2%) +34.0%
Persons aged 65 or over 763 (7.1%) 1,123 (7.7%) +47.2%
Dwellings 3,804 5,447 +43.2%
Unoccupied dwellings 12.0% 11.1% -
Dwellings fully owned 1,038 (31.0%) 1,245 (26.8%) +19.9%
Dwellings mortgaged 1,593 (47.6%) 2,268 (48.7%) +34.6%
Dwellings rented 567 (16.9%) 1,047 (22.5%) +84.7%
Median monthly mortgage $1,300 $1,993 +53.3%
Median weekly rent $180 $310 +72.2%
Households/Families
Median household income $1,221 $1,628 +33.3%
Family households 2,767 (82.7%) 3,914 (84.1%) +41.5%
Couple families + children 1,519 (54.1%) 2,064 (51.9%) +35.9%
One parent families 267 (9.5%) 497 (12.5%) +86.1%
Married (persons aged 15+) 4,660 (62.5%) 6,154 (58.0%) +32.1%
Separated/Divorced (persons aged 15+)
661 (8.9%) 1,089 (10.2%) +64.8%
Never married (persons aged 15+)
1,958 (26.3%) 3,096 (29.2%) +58.1%
Source: ABS, 2011 Census of Population and Housing and Regional Population growth Note: The age profiles are based on the Census data proportions adjusted to the ERP total. ‘Dwellings’ includes ‘Visitor only’ and ‘Other non-classifiable’ households.
Shire of Capel Profile 25
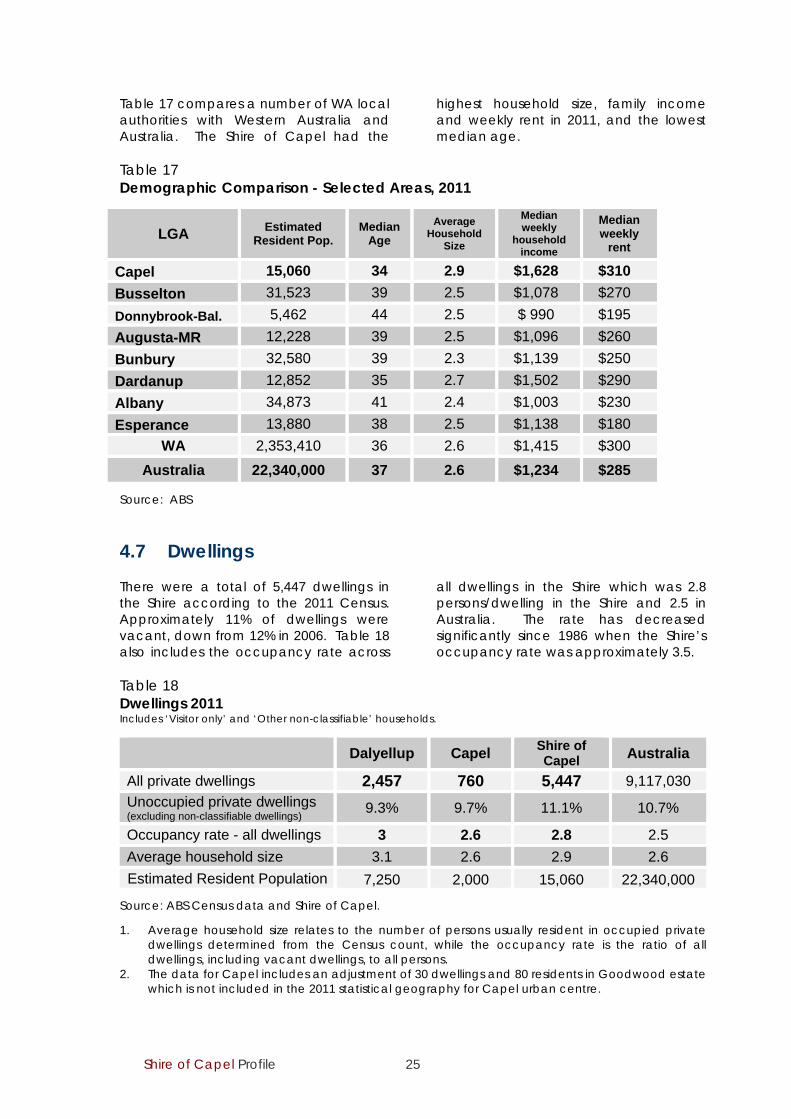
Table 17 compares a number of WA local authorities with Western Australia and Australia. The Shire of Capel had the
highest household size, family income and weekly rent in 2011, and the lowest median age.
Table 17 Demographic Comparison - Selected Areas, 2011
LGA Estimated Resident Pop.
Median Age
Average Household
Size
Median weekly
household income
Median weekly
rent
Capel 15,060 34 2.9 $1,628 $310
Busselton 31,523 39 2.5 $1,078 $270
Donnybrook-Bal. 5,462 44 2.5 $ 990 $195
Augusta-MR 12,228 39 2.5 $1,096 $260
Bunbury 32,580 39 2.3 $1,139 $250
Dardanup 12,852 35 2.7 $1,502 $290
Albany 34,873 41 2.4 $1,003 $230
Esperance 13,880 38 2.5 $1,138 $180
WA 2,353,410 36 2.6 $1,415 $300
Australia 22,340,000 37 2.6 $1,234 $285
Source: ABS 4.7 Dwellings There were a total of 5,447 dwellings in the Shire according to the 2011 Census. Approximately 11% of dwellings were vacant, down from 12% in 2006. Table 18 also includes the occupancy rate across
all dwellings in the Shire which was 2.8 persons/dwelling in the Shire and 2.5 in Australia. The rate has decreased significantly since 1986 when the Shire’s occupancy rate was approximately 3.5.
Table 18 Dwellings 2011 Includes ‘Visitor only’ and ‘Other non-classifiable’ households. Dalyellup Capel Shire of
Capel Australia
All private dwellings 2,457 760 5,447 9,117,030
Unoccupied private dwellings (excluding non-classifiable dwellings)
9.3% 9.7% 11.1% 10.7%
Occupancy rate - all dwellings 3 2.6 2.8 2.5
Average household size 3.1 2.6 2.9 2.6
Estimated Resident Population 7,250 2,000 15,060 22,340,000
Source: ABS Census data and Shire of Capel.
1. Average household size relates to the number of persons usually resident in occupied private dwellings determined from the Census count, while the occupancy rate is the ratio of all dwellings, including vacant dwellings, to all persons.
2. The data for Capel includes an adjustment of 30 dwellings and 80 residents in Goodwood estate which is not included in the 2011 statistical geography for Capel urban centre.

Shire of Capel Profile 26
4.8 Population Projections In 2015 the WAPC reviewed and published ‘Western Australia Tomorrow’, a population report and forecast profile for local government areas including the Shire of Capel. Projections were based on five simulations which resulted in a Shire population range of 22,100 (Band A) to 30,600 (Band E) for 2026. Table 19 includes the data for Band C. Notwithstanding the difficulties of projecting population change in high growth areas over strategic time frames, it would be difficult to argue that the growth of the Shire over the next 20 years will not be significant. The Shire has prepared alternative projections as a comparison with other forecasts. These consider the impacts of
more recent housing development and growth, including the following: An average of 300 dwellings per year
constructed 2006-2014; Urban growth strategies endorsed for
the towns of Capel and Boyanup; Significant structure planning
completed or being prepared; and Aged persons accommodation. The Shire’s projections use a different methodology based on anticipated dwelling outcomes as indicated in Table 19. While this is acknowledged as a more simplistic approach to projecting population, it may nevertheless be considered effective in relation to smaller local government areas which are experiencing significant growth.
Table 19 Shire of Capel Population Projections 2011-2031
Census Year2011 2016 2021 2026 2031
Shire of Capel a 15,060 1 18,700 2 22,000 3 25,500 4 28,360 5
WA Tomorrow b 15,060 18,370 22,020 25,840 -
Dept of Health c 14,092 17,720 21,481 25,357 -
Assumptions:
1. ABS data (ERP 2011). 2. Average growth of 240 dwellings/year 2011-2016 at 2.8 persons/dwelling +
aged persons accommodation (approx. 280 persons). 3. Average growth of 240 dwellings/year 2016-2021 at 2.75 persons/dwelling. 4. Average growth of 240 dwellings/year 2021-2026 at 2.7 persons/dwelling + aged
persons accommodation (approx. 260 persons). 5. Average growth of 220 dwellings/year 2026-2031 at 2.6 persons/dwelling.
Note: These projections reflect possible population outcomes related to the stated assumptions
only. Dwelling estimates and suggested average occupancy rates may vary over time and a higher or lower population may be achieved.
Source:
a. Shire of Capel (2016 -2031 projections) b. Band ‘C’ (median) projections. Western Australia Tomorrow, WAPC, 2015. c. Customised projections prepared for the Australian Government Department of
Health and Ageing by the Australian Bureau of Statistics in 2008. The projections are not official ABS data.
Shire of Capel Profile 27
Forecasts prepared by the Shire in Table 19 are based on anticipated dwelling construction rates as this has been an indicator of increasing growth in recent years. Shire records indicate that dwelling growth between 2006 and 2011averaged 330 per year. Assuming an occupancy rate of 2.8 persons per dwelling and approximately 240 dwellings/year, as well as new aged accommodation in Dalyellup and Capel, the projected 2016 resident population can be estimated at around 18,700. Subsequent projections for the Shire (2021-2031) are based on continued residential development and consistently high growth in accordance with the assumptions stated in Table 19.
In view of recent dwelling construction and the current and potential residential land supply evident in the urban areas of Dalyellup, Capel and Boyanup it can be assumed that the rate of dwelling growth will continue over the medium term at over 200 dwellings per year. Table 20 includes preliminary projections for selected localities in the Shire to 2021. These projections are based on anticipated development outcomes from structure plans and urban growth strategies adopted by the Shire. The assumptions relate to estimates of average annual growth rates based on anticipated dwelling growth and average occupancy of all dwellings in each locality.
Table 20 Preliminary Population Projections 2016-2021
2011 2016 2021
Capel 2,000 2,420 2,870 Boyanup 820 900 1,250 Peppermint Grove Beach 400 480 570 Gelorup 2,225 2,300 2,350 Dalyellup 7,250 10,200 12,500 Rural + other areas 2,365 2,400 2,460
Shire of Capel 15,060 18,700 22,000 Source: Shire of Capel
Note: The projections depicted in Table 20 reflect possible population outcomes only - a higher or lower population may be achieved.
Capel Community Centre and Iluka Capel Public Library
Shire of Capel Profile 28
5.0 Community & Culture 5.1 Indigenous The Capel area is within the traditional lands of the Wardandi people. The Wardandi are the traditional custodians of the area generally between Bunbury and Cape Leeuwin and have a strong connection to the sea. In 2011 the Shire had approximately 330 indigenous persons comprising 2.3% of the Shire’s residents, compared with 2.5% in Australia. A number of Aboriginal heritage sites have been identified in the Shire including burial sites, artefact finds and scarred trees. Places that hold meaning and significance can include: where Aboriginal people have
camped, lived or moved through; places associated with Dreaming
stories depicting the law of the land and how people should behave;
places associated with spirituality; places where other cultures came
into contact with Indigenous people; and that are significant for more contemporary uses.
Aboriginal sites are a precious part of the heritage of the whole community as they are of immense cultural, scientific, educational and historic interest, and provide an important link to the culture and heritage of Indigenous people. The Wardandi have developed the Wardan Aboriginal Centre in Yallingup as a place where they can share culture with visitors, school groups and Aboriginal people from other areas, in an effort to increase understanding and reconciliation in the wider community.
5.2 Post European Many local families have descendants who have been in Capel since European settlement in the 1830s. More recently, people have been enticed to move to the Shire in increasing numbers, attracted by employment, affordable housing and the rural lifestyle. The Shire has an active sporting and cultural background. There are many recreation, arts and community groups offering a diverse range of activities.
Boyanup hosts a popular farmer’s market each month and has a Rail Heritage Centre and Fettlers Park. Capel also hosts a market each month adjacent to the Recreation Ground where new multi-purpose hard courts have been established. Dalyellup is a newly developing urban area adjacent to the City of Bunbury near the beach, which has a young age profile and very high growth rate.
Shire of Capel Profile 29
5.3 Recreation and Cultural Activities
The Shire has opportunities for all ages to participate in sport and recreation and strategies are being formulated to ensure that facilities are available to service the growing population. The Shire’s Sport and Recreation Strategic Plan gives direction on the development of new facilities, the upgrading of existing facilities, highlights gaps in facilities provision and addresses issues of access and equity. The Trails Master Plan provides a framework to direct the planning of trails in the Shire to ensure they are well planned, managed, resourced, promoted, and maintained. Public Open Space Strategies have been adopted for Capel and Boyanup. These Strategies profile existing facilities and future community needs. They are intended to guide the long term planning and development of open space, parks, gardens, reserves and associated community and recreation facilities in the urban areas of Capel and Boyanup. Sporting activities in the Shire are centred on popular ball sports and informal recreation such as bush walking, fishing and swimming at the beach. There are a number of formal recreation facilities in the Shire including sports grounds in Dalyellup, Boyanup and Capel. Active sports clubs include:
Football (soccer) (senior and junior) AFL (senior and junior) Cricket (senior and junior) Hockey (senior and junior)
Netball Tennis Basketball Equestrian and polocrosse Softball Tee-ball Lawn bowls - Boyanup and Capel Capel Golf Club - Stratham Dalyellup Surf Life Saving Club Coolilup rifle range - Capel
Other activities include walking, running, cycling, BMX, skate-boarding, sail-boarding, surfing, canoeing, boating, fishing, diving and taekwondo. Community/cultural organisations active in the Shire include:
Capel Country Club Country Women’s Association Youth Advisory Council Lions Clubs Apex Clubs Playgroups Senior citizens Meals on Wheels HACC Men’s Shed Over 50s social club Scouts Girl Guides Community associations Music - school/singing groups Arts groups Garden clubs Chamber of Commerce Returned and Services League Land Conservation District Committee
A summary of the principal community and cultural facilities available in the Shire is provided in the following schedule.

Shire of Capel Profile 30
Schedule of community and cultural facilities - Shire of Capel
Schools
Capel Kindergarten Boyanup Primary School (established 1875) Capel Primary School (established 1897) Child Side School, Boyanup (established 2003) Dalyellup College (primary + middle) (established 2001) Tuart Forest Primary School, Dalyellup (established 2013) Ocean Forest Lutheran College, Dalyellup (established 2004) Bunbury Cathedral Grammar School, Gelorup (established 1972)
Emergency services
No police station in Shire (Bunbury Police 9722 2111 or 131 444) Capel and Boyanup Ambulance Capel, Gelorup, Elgin and Stirling BFB
Health
Community Health Nurse Capel, Gelorup and Boyanup Child Health Clinics Home and Community Care service GP, physiotherapist and chiropractor - Capel 2 GPs in Dalyellup including Dalyellup Family Medical Centre Dentist – Dalyellup, Capel Pharmacies - Capel, Dalyellup Capel Vet
Commerce
Post Offices in Capel, Boyanup & Gelorup (Post-point in Dalyellup) Bendigo Bank, Capel Supermarket, general store and specialty stores Dalyellup District Centre (first stage of development imminent) Cafes, Galleries, Wineries, Taverns Capel industrial area
Recreation
Capel Sports Ground/Capel Country Club Erle Scott Reserve, Capel Boyanup Memorial Park Boyanup and Capel skate parks Fettlers Park, Boyanup Dalyellup beach, parks, lakes and recreation trails Dalyellup Sports Pavilion Capel Golf Club, Stratham Capel Equestrian Centre Peppermint Grove Beach foreshore Tuart Forest National Park Ironstone Gully Falls Preston River Ramble, Boyanup
Churches
Anglican Church - Capel, Boyanup and Gelorup (BCGS) Catholic Church - Capel, Boyanup and Gelorup (Carmelite) Uniting Church - Capel Seventh Day Adventist Church - Capel Reformed Seventh Day Adventist Church - Boyanup Lutheran Church – Dalyellup
Other facilities Dalyellup, Capel, Boyanup and Gelorup Libraries Capel Community Centre Capel Senior Citizens Centre Capel RSL Hall – Capel and Boyanup War Memorials Capel CWA Hall Jack and Mary Kitchen Community Centre, Boyanup Hugh Kilpatrick Memorial Hall, Boyanup Dalyellup Community Centre Capel, Boyanup and Dalyellup Beach playgroups Gelorup Community Centre Peppermint Grove Beach Community Centre Elgin Community Hall Child Care Centres - Capel and Dalyellup

Shire of Capel Profile 31
5.4 Cultural Diversity in Western Australia The 2011 Australian Census affirmed that Australia is a diverse nation and that Western Australia is one of the fastest growing and most diverse of all the states and territories. Perth had the highest proportion of
people born overseas of all Australian capital cities.
Only 13% of overseas-born people in WA lived in non-metropolitan areas.
Between 2006 and 2011, the majority of migrants to WA were skilled migration visa holders (71%) – and WA received almost one-quarter of Australia’s skilled migrants.
73% of Capel Shire residents (and 63% of Western Australians) stated that they were born in Australia.
21% of Shire residents (and 31% of Western Australians) stated that they were born overseas.
41% of Shire residents (and 52% of Western Australians) had at least one parent born overseas.
2.3% of Shire residents (3.1% of Western Australians) identified as being Aboriginal and/or Torres Strait Islander.
A profile has been produced by the WA Office of Multicultural Interests which tells the story of Western Australia’s cultural and linguistic diversity. Using 2011 Census data, it looks at the countries of birth, ancestries, languages spoken at home, proficiency in spoken English and religious affiliations of Western Australians. Office of Multicultural Interests publications include: Cultural Diversity in Western Australia -
A Demographic Profile The Economic and Social
Contribution of Migrants to WA Local Government Profiles of cultural
and linguistic diversity.
For more information go to: http://www.omi.wa.gov.au http://www.omi.wa.gov.au/omi_diversity_statistics.cfm

Shire of Capel Profile 32
Scar Tree The remnant of a tree trunk exhibiting a
‘scar’ made long ago by the Wardandi is preserved at the Capel Shire administration centre. This scarred tree trunk came from a dead eucalypt found east of Davies Road 15 kilometres north of the Capel-Donnybrook Road and was discovered during a heritage survey.
The scar was made when the tree’s bark
was removed to expose the sapwood. To remove the bark Aboriginal people would cut an outline of the shape they wanted using stone axes and cut the bark to the desired depth. The bark was then levered off using an adze or wedges of stone or wood.
Aboriginals used the bark from scars for
many uses e.g. coolamons (containers), wanda (shields), meero (spearthrowers) and for roofing of mia mia (shelters). Some scar trees have footholds which were used to climb trees to reach food such as honey and possums.
Scar trees were also used to mark
boundaries of a group’s territory or ceremonial area, or to point to something important such as a water hole or burial ground.
An Aboriginal elder has interpreted this
scar as a tribal boundary marker. Few scarred trees remain in the South West but a number are listed on the State’s Register of Aboriginal Sites and are protected.

Shire of Capel Profile 33
6.0 The Economy 6.1 Agriculture
The Shire is still characterised by its earliest industries, forestry and broad acre farming. Other agriculture and rural industries such as viticulture, orchards, dairy processing and blue gum plantations have also been established. Declining farmer numbers and labour sources at peak harvest times are beginning to impact on agricultural production in the region. Competition for water resources resulting from increased water needs and declining rainfall is also a significant issue for agriculture. The average annual rainfall between 2007 and 2012 recorded at the Shire depot in Capel was 704mm while Boyanup’s rainfall was approximately 10% higher than Capel’s over that period. Land use change within the region is leading to some alienation of prime agricultural land primarily due to ongoing residential development or the need for buffers to non-agricultural land uses to address potential land use conflict. Dairy industry The local dairy industry features prominently in Western Australia’s history. The original Capel Dairy, one of Western Australia’s first industries, was established in 1920 in the Capel River valley. This historic site was home to a modern dairy manufacturing plant until late 2010 but is no longer operating. Milk from the South West is primarily processed as fluid milk for the domestic market in a number of South West dairy plants, including in Boyanup. Some branded dairy products are also
produced. The range includes a variety of styles of milk, traditional butter, cheese, yoghurt, skim milk and whey powder. The South West is relatively isolated in agricultural terms, helping to ensure that the local dairy cows are disease free. This is a factor that is highly regarded by statutory agencies as well as being a distinct advantage in terms of international marketing. Grazing Livestock are grazed extensively in the Shire for meat products. The South West region is Western Australia's leading supplier of beef cattle. Processing of prime beef for export occurs at an abattoir near Harvey. Live cattle are exported to the European Union, Asia, and the Middle East. The Boyanup stock saleyard is located in the Boyanup urban area. Investigations are progressing to determine an alternative location for a stock sale facility to service the region. The Shire of Capel represents the most appropriate location for a new facility in view of its central location within the cattle catchment and transport network.
Shire of Capel Profile 34
Fruit and vegetables Most vegetables grown in the region are sold to the Perth market, but increasingly a share is exported to South East Asia. Varieties include potatoes, carrots, broccoli, onions, cauliflowers, pumpkin, beans, lettuce, capsicum, chillies, zucchini and cabbage. Orchard fruits and grapes dominate fruit production in the region. Varieties include table and wine grapes, apples, oranges, plums, prunes, pears, avocados, nectarines, peaches, cherries, apricots and berries. Viticulture The South West is the largest wine producing region in Western Australia and is considered a world-class producer of premium wine. Wine regions include Margaret River, Manjimup/Pemberton, Blackwood Valley and Geographe. The Geographe region includes the Shire of Capel and has a Mediterranean,
maritime climate which is cooled and humidified by breezes from the Indian Ocean. Summers are dry but rainfall is generous during winter. The soils are deep, sandy (overlaying limestone) and well-drained but low in nutrients. Approximately 20% of south west wine production originates from the Geographe appellation which includes producers such as Capel Vale and Pepperwood near Capel. Viticulture production in the Geographe region is increasing every year, and it had an estimated value of $10.3 million in 2008, with 9,400 tonnes of grapes crushed. While wine production has been increasing, lower domestic sales and falling exports have led to increased wine stocks in recent seasons. The Geographe Vignerons Association has a web page with more information ‘www.geographewine.com.au’.
Table 21 Grapes crushed (tonnes)
Region 2005 2006 2007 2008 Blackwood Valley 1,930 1,617 1,609 2,135 Geographe 5,761 4,645 8,184 9,407 Manjimup/Pemberton 5,782 4,173 7,031 5,032 Margaret River 30,631 25,015 31,719 33,819
TOTAL tonnage 44,104 35,450 48,543 50,393 Source: Wine Grape Utilisation Survey 2002-07 - SWDC web page Table 22 Estimated value of grape production ($m)
Region 2005 2006 2007 2008 Blackwood Valley 2.3 1.63 1.5 2.4 Geographe 6.1 5.0 9.4 10.3 Manjimup/Pemberton 8.1 5.1 8.6 6.3 Margaret River 44.1 37.8 47.6 48.9
TOTAL 60.5 49.6 67.1 67.9 Source: Wine Grape Utilisation Survey 2002-07 - SWDC web page
Shire of Capel Profile 35
6.2 Mining Significant reserves of mineral sands occur from Wagerup in the north, through the Shire of Capel to Dunsborough along the base of the Darling and Whicher escarpments. Mineral sands mining in the Shire began in the 1960s and processing provides synthetic rutile, zircon and titanium dioxide minerals to a world market valued at $166m regionally in 2008-09. Iluka Resources Limited is a major participant in the global mineral sands sector and is involved in the production, sales and marketing of titanium mineral products and zircon. Iluka is the world’s largest producer of zircon, with a market share of approximately one third. It is the second largest producer of titanium dioxide minerals and, within this sector, the largest global producer of the higher value titanium dioxide products of rutile and synthetic rutile (upgraded ilmenite). The average number of persons employed by Iluka in its Capel group was around 450 in 2008-09 Source: WA Mineral and Petroleum Statistics Digest 2008-09. Cristal Mining Australia Limited (formerly Bemax Resources) and the Cable Sands Group operate the Gwindinup and Happy Valley deposits which contain 2.9 million tonnes of contained heavy mineral, approximately 10% of which is zircon. Development of the Gwindinup mine commenced in May 2007 and it was commissioned in early 2008. The mine (including Happy Valley North and South) has an approximate nine-year mine life which is relatively long for the region. There is a need to provide a fully integrated transport network to assist export of mined material and address heavy vehicle use of local and regional road networks. Competition for, and costs of water and energy also remain issues for the mining sector in the region.
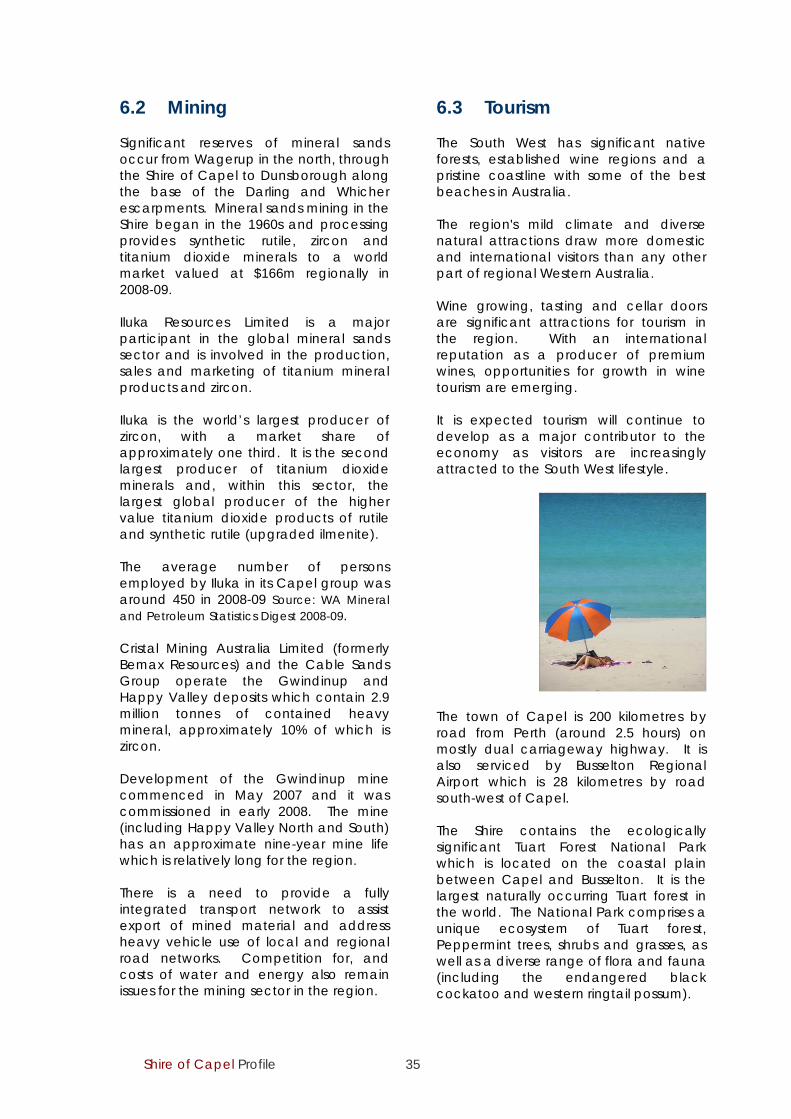
6.3 Tourism The South West has significant native forests, established wine regions and a pristine coastline with some of the best beaches in Australia. The region's mild climate and diverse natural attractions draw more domestic and international visitors than any other part of regional Western Australia. Wine growing, tasting and cellar doors are significant attractions for tourism in the region. With an international reputation as a producer of premium wines, opportunities for growth in wine tourism are emerging. It is expected tourism will continue to develop as a major contributor to the economy as visitors are increasingly attracted to the South West lifestyle.
The town of Capel is 200 kilometres by road from Perth (around 2.5 hours) on mostly dual carriageway highway. It is also serviced by Busselton Regional Airport which is 28 kilometres by road south-west of Capel. The Shire contains the ecologically significant Tuart Forest National Park which is located on the coastal plain between Capel and Busselton. It is the largest naturally occurring Tuart forest in the world. The National Park comprises a unique ecosystem of Tuart forest, Peppermint trees, shrubs and grasses, as well as a diverse range of flora and fauna (including the endangered black cockatoo and western ringtail possum).
Shire of Capel Profile 36
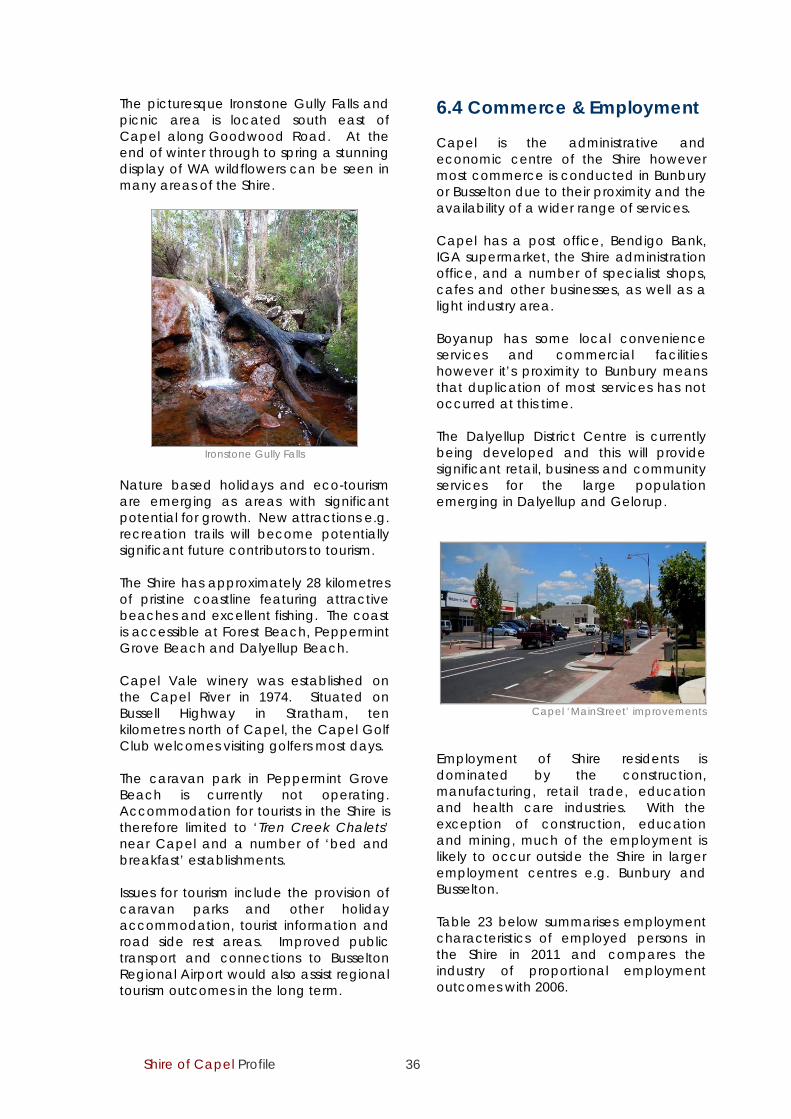
The picturesque Ironstone Gully Falls and picnic area is located south east of Capel along Goodwood Road. At the end of winter through to spring a stunning display of WA wildflowers can be seen in many areas of the Shire.
Ironstone Gully Falls
Nature based holidays and eco-tourism are emerging as areas with significant potential for growth. New attractions e.g. recreation trails will become potentially significant future contributors to tourism. The Shire has approximately 28 kilometres of pristine coastline featuring attractive beaches and excellent fishing. The coast is accessible at Forest Beach, Peppermint Grove Beach and Dalyellup Beach. Capel Vale winery was established on the Capel River in 1974. Situated on Bussell Highway in Stratham, ten kilometres north of Capel, the Capel Golf Club welcomes visiting golfers most days. The caravan park in Peppermint Grove Beach is currently not operating. Accommodation for tourists in the Shire is therefore limited to ‘Tren Creek Chalets’ near Capel and a number of ‘bed and breakfast’ establishments. Issues for tourism include the provision of caravan parks and other holiday accommodation, tourist information and road side rest areas. Improved public transport and connections to Busselton Regional Airport would also assist regional tourism outcomes in the long term.
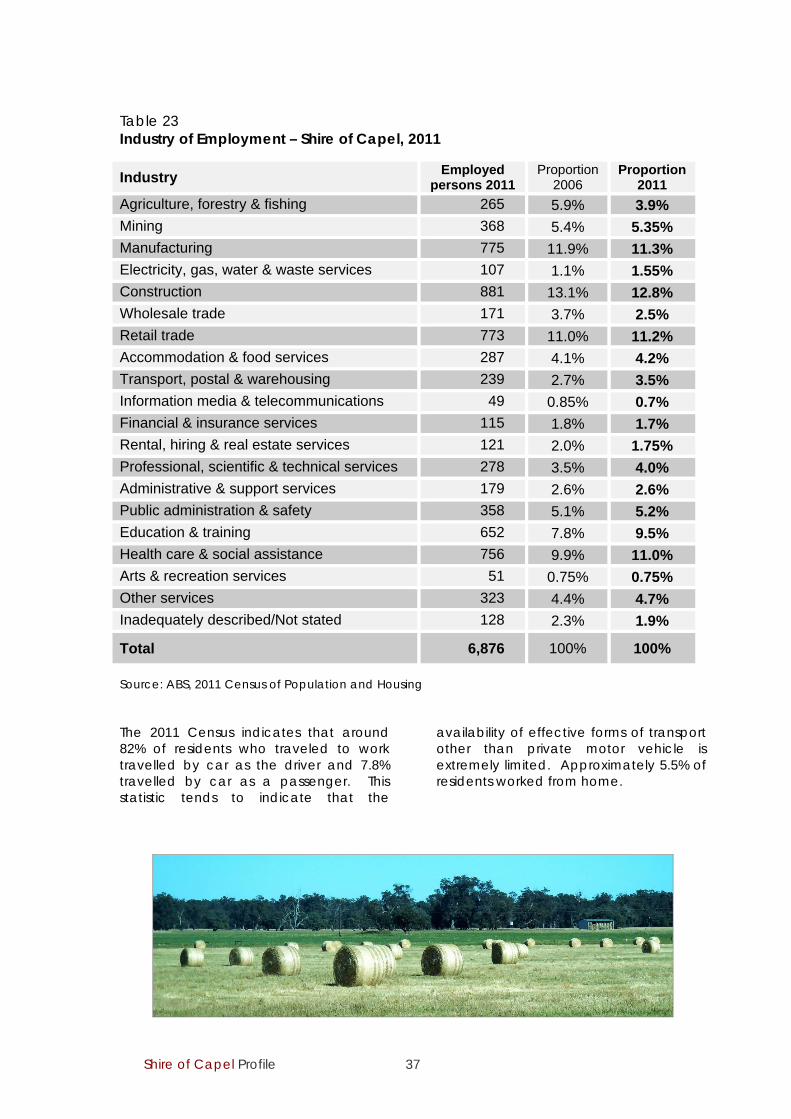
6.4 Commerce & Employment Capel is the administrative and economic centre of the Shire however most commerce is conducted in Bunbury or Busselton due to their proximity and the availability of a wider range of services. Capel has a post office, Bendigo Bank, IGA supermarket, the Shire administration office, and a number of specialist shops, cafes and other businesses, as well as a light industry area. Boyanup has some local convenience services and commercial facilities however it’s proximity to Bunbury means that duplication of most services has not occurred at this time. The Dalyellup District Centre is currently being developed and this will provide significant retail, business and community services for the large population emerging in Dalyellup and Gelorup.
Capel ‘MainStreet’ improvements
Employment of Shire residents is dominated by the construction, manufacturing, retail trade, education and health care industries. With the exception of construction, education and mining, much of the employment is likely to occur outside the Shire in larger employment centres e.g. Bunbury and Busselton. Table 23 below summarises employment characteristics of employed persons in the Shire in 2011 and compares the industry of proportional employment outcomes with 2006.
Shire of Capel Profile 37
Table 23 Industry of Employment – Shire of Capel, 2011
Industry Employed persons 2011
Proportion 2006
Proportion 2011
Agriculture, forestry & fishing 265 5.9% 3.9%
Mining 368 5.4% 5.35%
Manufacturing 775 11.9% 11.3%
Electricity, gas, water & waste services 107 1.1% 1.55%
Construction 881 13.1% 12.8%
Wholesale trade 171 3.7% 2.5%
Retail trade 773 11.0% 11.2%
Accommodation & food services 287 4.1% 4.2%
Transport, postal & warehousing 239 2.7% 3.5%
Information media & telecommunications 49 0.85% 0.7%
Financial & insurance services 115 1.8% 1.7%
Rental, hiring & real estate services 121 2.0% 1.75%
Professional, scientific & technical services 278 3.5% 4.0%
Administrative & support services 179 2.6% 2.6%
Public administration & safety 358 5.1% 5.2%
Education & training 652 7.8% 9.5%
Health care & social assistance 756 9.9% 11.0%
Arts & recreation services 51 0.75% 0.75%
Other services 323 4.4% 4.7%
Inadequately described/Not stated 128 2.3% 1.9%
Total 6,876 100% 100%
Source: ABS, 2011 Census of Population and Housing The 2011 Census indicates that around 82% of residents who traveled to work travelled by car as the driver and 7.8% travelled by car as a passenger. This statistic tends to indicate that the
availability of effective forms of transport other than private motor vehicle is extremely limited. Approximately 5.5% of residents worked from home.

Shire of Capel Profile 38
Table 24 below includes some selected labour force, education and migration data for 2011. This indicates a low unemployment rate of 4% (up from 3% in 2006) compared to 5.6% in Australia.
Significantly, around 45% of the population lived at a different address in 2006. This tends to reflect the high rate of growth and demographic change occurring in the Shire.
Table 24 Selected person characteristics, 2011
Shire of Capel Males Females Persons
Persons aged 15 years and over 5,232 5,378 10,610 Labour force status(a):
Employed, worked full-time(b) 2,968 1,322 4,290 Employed, worked part-time 493 1,568 2,061 Employed, away from work(c) 284 240 524 Unemployed, looking for work 145 145 290 Total labour force 3,890 3,275 7,165
Not in the labour force 1,031 1,846 2,877
% Unemployment(d) 3.7 4.4 4.0 % Labour force participation(e) 74.4 60.9 67.5 % Employment to population(f) 71.6 58.2 64.8
Non-school qualifications(a): Postgraduate Degree 98 58 156 Graduate Diploma/Graduate Certificate 66 112 178 Bachelor Degree 419 737 1,156 Advanced Diploma and Diploma 366 513 879 Certificate Level 1,782 984 2,766
Migration: Lived at same address 1 year ago(g) 5,465 5,606 11,071 Lived at different address 1 year ago(g) 1,269 1,328 2,597
Lived at same address 5 years ago(h) 2,981 3,012 5,993 Lived at different address 5 years ago(h) 3,191 3,372 6,563 Source: ABS 2011 Notes:
(a) Applicable to persons aged 15 years and over only. (b) 'Employed, worked full-time' is defined as having worked 35 hours or more in all jobs during
the week prior to Census Night. (c) Comprises employed persons who did not work any hours in the week prior to Census Night
and employed persons who did not state their hours worked. (d) The number of unemployed persons expressed as a percentage of the total labour force. (e) The number of persons in the labour force expressed as a percentage of persons aged 15
years and over. (f) The number of employed persons as a percentage of persons aged 15 years and over. (g) Excludes persons less than 1 year of age. (h) Excludes persons less than 5 years of age.
Shire of Capel Profile 39
Table 25 indicates that the number of businesses in the Shire remained steady between 2008 and 2012. The number of businesses with five or more employees
decreased by 25% between 2008 and 2012 according to ABS data while the number of smaller businesses increased.
Table 25 Number of Businesses
Shire of Capel June 2008
June 2010
June 2012
Number of non-employing businesses 686 681 703
Number of businesses with 1-4 employees 199 219 208
No. of businesses with 5 or more employees 125 118 94
Total number of businesses 1,010 1,018 1,005 Source: ABS ‘databyregion’. Table 26 highlights the number of businesses by industry in the Shire in 2012. Construction has by far the most
businesses following by agriculture, forestry and fishing and real estate services.
Table 26 Number of Businesses by Industry 2012
Shire of Capel 2012
Accommodation & Food Services 20
Administrative & Support Services 40
Agriculture, Forestry and Fishing 170
Arts & Recreation Services 18
Construction 251
Education & Training 14
Electricity, Gas, Water & Waste Services -
Financial & Insurance Services 52
Health Care & Social Assistance 47
Information Media & Telecommunications 7
Manufacturing 32
Mining 6
Not Classified 23
Other services 33
Professional Scientific & Technical Services 98
Public Administration & Safety -
Rental, Hiring, & Real Estate Services 102
Retail trade 35
Transport, Postal and Warehousing 39
Wholesale trade 24
Source: ABS ‘databyregion’
Shire of Capel Profile 40
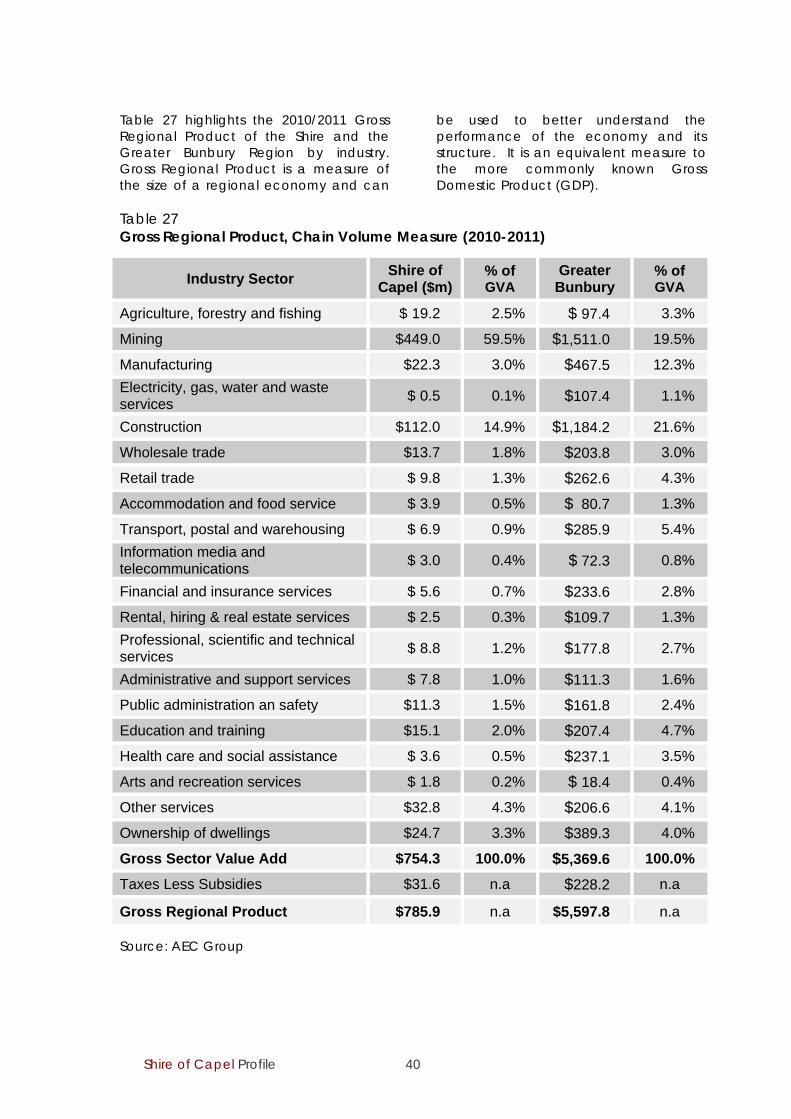
Table 27 highlights the 2010/2011 Gross Regional Product of the Shire and the Greater Bunbury Region by industry. Gross Regional Product is a measure of the size of a regional economy and can
be used to better understand the performance of the economy and its structure. It is an equivalent measure to the more commonly known Gross Domestic Product (GDP).
Table 27 Gross Regional Product, Chain Volume Measure (2010-2011)
Industry Sector Shire of
Capel ($m) % of GVA
Greater Bunbury
% of GVA
Agriculture, forestry and fishing $ 19.2 2.5% $ 97.4 3.3%
Mining $449.0 59.5% $1,511.0 19.5%
Manufacturing $22.3 3.0% $467.5 12.3%
Electricity, gas, water and waste services
$ 0.5 0.1% $107.4 1.1%
Construction $112.0 14.9% $1,184.2 21.6%
Wholesale trade $13.7 1.8% $203.8 3.0%
Retail trade $ 9.8 1.3% $262.6 4.3%
Accommodation and food service $ 3.9 0.5% $ 80.7 1.3%
Transport, postal and warehousing $ 6.9 0.9% $285.9 5.4%
Information media and telecommunications
$ 3.0 0.4% $ 72.3 0.8%
Financial and insurance services $ 5.6 0.7% $233.6 2.8%
Rental, hiring & real estate services $ 2.5 0.3% $109.7 1.3%
Professional, scientific and technical services
$ 8.8 1.2% $177.8 2.7%
Administrative and support services $ 7.8 1.0% $111.3 1.6%
Public administration an safety $11.3 1.5% $161.8 2.4%
Education and training $15.1 2.0% $207.4 4.7%
Health care and social assistance $ 3.6 0.5% $237.1 3.5%
Arts and recreation services $ 1.8 0.2% $ 18.4 0.4%
Other services $32.8 4.3% $206.6 4.1%
Ownership of dwellings $24.7 3.3% $389.3 4.0%
Gross Sector Value Add $754.3 100.0% $5,369.6 100.0%
Taxes Less Subsidies $31.6 n.a $228.2 n.a
Gross Regional Product $785.9 n.a $5,597.8 n.a Source: AEC Group
Shire of Capel Profile 41
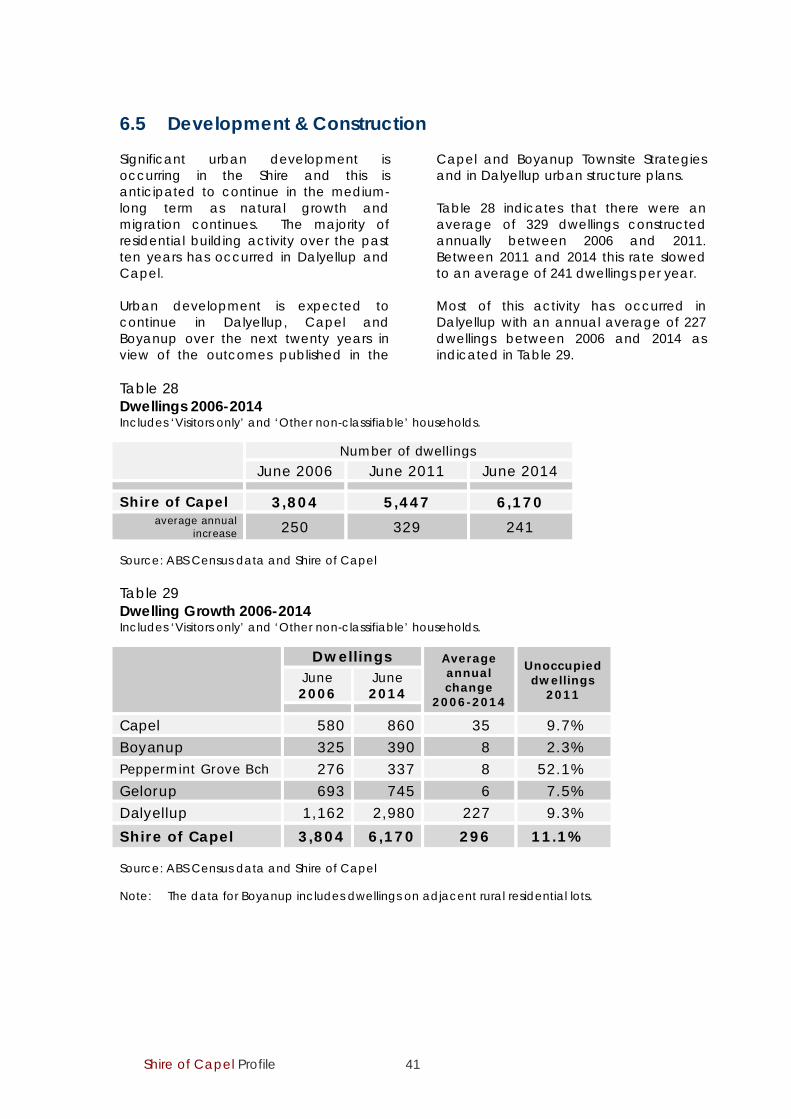
6.5 Development & Construction Significant urban development is occurring in the Shire and this is anticipated to continue in the medium-long term as natural growth and migration continues. The majority of residential building activity over the past ten years has occurred in Dalyellup and Capel. Urban development is expected to continue in Dalyellup, Capel and Boyanup over the next twenty years in view of the outcomes published in the
Capel and Boyanup Townsite Strategies and in Dalyellup urban structure plans. Table 28 indicates that there were an average of 329 dwellings constructed annually between 2006 and 2011. Between 2011 and 2014 this rate slowed to an average of 241 dwellings per year. Most of this activity has occurred in Dalyellup with an annual average of 227 dwellings between 2006 and 2014 as indicated in Table 29.
Table 28 Dwellings 2006-2014 Includes ‘Visitors only’ and ‘Other non-classifiable’ households. Number of dwellings
June 2006 June 2011 June 2014
Shire of Capel 3,804 5,447 6,170 average annual
increase 250 329 241 Source: ABS Census data and Shire of Capel Table 29 Dwelling Growth 2006-2014 Includes ‘Visitors only’ and ‘Other non-classifiable’ households. Dwellings Average
annual change
2006-2014
Unoccupied dwellings
2011 June 2006
June 2014
Capel 580 860 35 9.7% Boyanup 325 390 8 2.3% Peppermint Grove Bch 276 337 8 52.1% Gelorup 693 745 6 7.5% Dalyellup 1,162 2,980 227 9.3% Shire of Capel 3,804 6,170 296 11.1% Source: ABS Census data and Shire of Capel Note: The data for Boyanup includes dwellings on adjacent rural residential lots.
Shire of Capel Profile 42
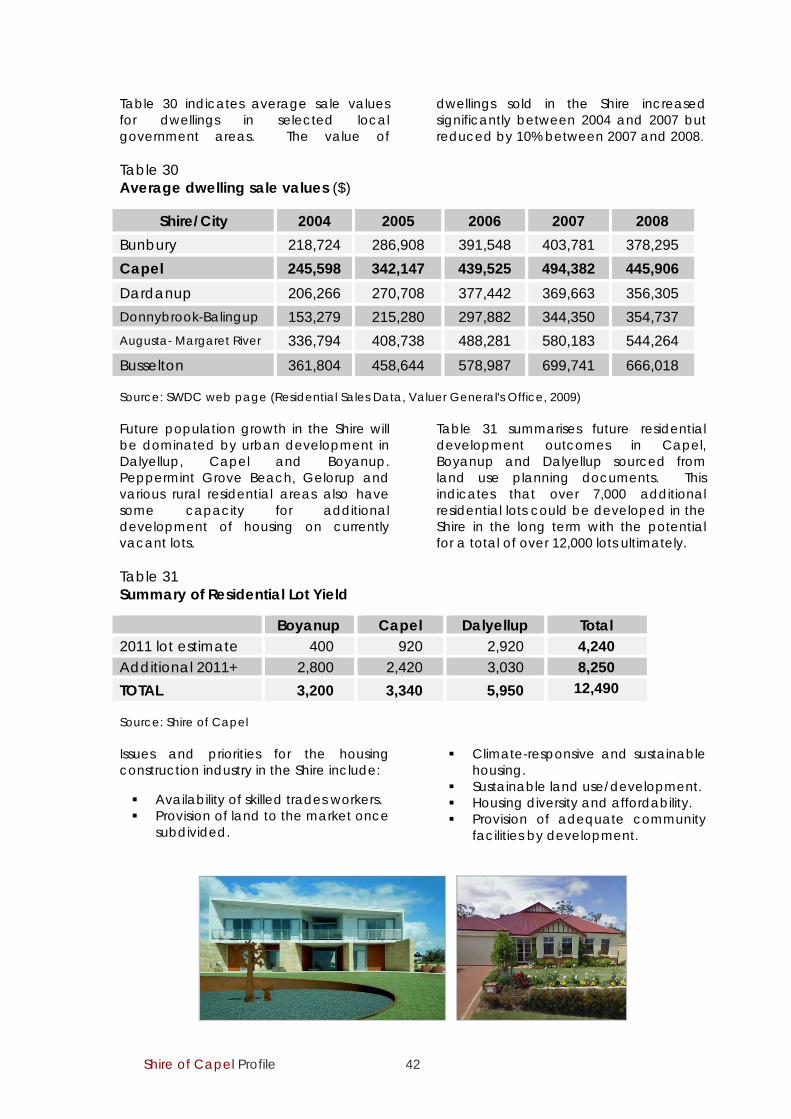
Table 30 indicates average sale values for dwellings in selected local government areas. The value of
dwellings sold in the Shire increased significantly between 2004 and 2007 but reduced by 10% between 2007 and 2008.
Table 30 Average dwelling sale values ($)
Shire/City 2004 2005 2006 2007 2008 Bunbury 218,724 286,908 391,548 403,781 378,295 Capel 245,598 342,147 439,525 494,382 445,906 Dardanup 206,266 270,708 377,442 369,663 356,305 Donnybrook-Balingup 153,279 215,280 297,882 344,350 354,737 Augusta- Margaret River 336,794 408,738 488,281 580,183 544,264 Busselton 361,804 458,644 578,987 699,741 666,018 Source: SWDC web page (Residential Sales Data, Valuer General's Office, 2009) Future population growth in the Shire will be dominated by urban development in Dalyellup, Capel and Boyanup. Peppermint Grove Beach, Gelorup and various rural residential areas also have some capacity for additional development of housing on currently vacant lots.
Table 31 summarises future residential development outcomes in Capel, Boyanup and Dalyellup sourced from land use planning documents. This indicates that over 7,000 additional residential lots could be developed in the Shire in the long term with the potential for a total of over 12,000 lots ultimately.
Table 31 Summary of Residential Lot Yield Boyanup Capel Dalyellup Total 2011 lot estimate 400 920 2,920 4,240 Additional 2011+ 2,800 2,420 3,030 8,250 TOTAL 3,200 3,340 5,950 12,490 Source: Shire of Capel Issues and priorities for the housing construction industry in the Shire include: Availability of skilled trades workers. Provision of land to the market once
subdivided.
Climate-responsive and sustainable housing.
Sustainable land use/development. Housing diversity and affordability. Provision of adequate community
facilities by development.

Shire of Capel Profile 43
6.6 Regional Prosperity The competitiveness of Australia’s regions was revealed for the first time with the launch of [In]Sight in 2013, a tool that enable’s everyone to understand how their local area is performing in terms of regional prosperity indicators. Developed by the Regional Australia Institute in collaboration with Deloitte Access Economics, [In]Sight is an online index and interactive map which ranks Australia’s 560 Local Government Areas. Fifty-nine indicators capture the underlying drivers of sustainable growth in Australia, ranging from unemployment, proximity to major infrastructure, internet connectivity and natural assets. Two themes of competitiveness driving sustainable growth are Human Capital and Technological Readiness. The Shire of Capel is leading regional WA in those areas.
A healthier and better-educated workforce increases competitiveness. Regions with strong workforce capabilities and skills tend to experience higher levels of economic growth, and are more adaptive, innovative and resilient to negative outside influences. Among non-metropolitan LGAs in WA, the Shire of Capel is the highest performing area in the Human Capital theme. A region’s level of Technological Readiness is vital to attracting new businesses and investment. This theme is measured by the percentage of households and businesses with internet and broadband connections, businesses in technology related industries and workers in ICT and electronics. The Shire of Capel is the highest ranking non-metropolitan LGA in WA in relation to technological readiness.
For more information go to: www.regionalaustralia.org.au/research-policy/insight

Shire of Capel Profile 44
7.0 Planning Issues 7.1 Strategic Plan The Shire’s ‘Strategic Community Plan 2013-2031’ was adopted by Council in April 2013 and establishes the long-term direction that the Council and staff will take in relation to the Shire’s administration and development. The Plan addresses strategic initiatives and focuses on matters which are important to the community. The Strategic Plan ‘Vision’ is to establish “a community of diverse lifestyle experiences accommodating progressive growth, sharing in prosperity, and valuing the unique environment”. The following strategic objectives have been developed to support each of the five strategic directions in the Plan. ‘Leadership Experience’ - ensure open,
transparent, effective good governance and communication within the organisation and the community.
‘Community Experience’ - provide facilities and services which recognise the needs of the community and strive to make the Shire a safe place to live, work and visit.
‘Environmental Experience’ - preserve and enhance the natural and built environment to ensure it is liveable, sustainable and adapts to our communities’ needs and expectations.
‘Economic Experience’ - foster and support responsible and progressive economic development opportunities within the Shire.
‘Infrastructure Experience’ - plan and facilitate safe, sustainable and efficient infrastructure and transport networks to meet the needs of the community.
7.2 Urban Growth Between 2006 and 2011 subdivision of new urban development precincts in the Shire, particularly in Dalyellup, has resulted in an average growth of 330 dwellings per year (an average annual growth rate of 7.5%). In that time the resident population has increased by an average of 880 persons per year according to the ABS (an average annual growth rate of over 7%). Approximately 11% of dwellings in the Shire were unoccupied when the Census was counted in August 2011. It is notable that 52% of dwellings in Peppermint Grove Beach were unoccupied when the Census was recorded, highlighting the number of holiday homes and vacant dwellings in that locality.
The significant growth of the Shire is partly a response to the ongoing demand for housing in the Bunbury region to accommodate regional population growth. This demand for housing is anticipated to continue in the Shire for another twenty years.

Shire of Capel Profile 45
7.3 Land Use Planning
The Planning and Development Services Division of the Shire is responsible for the coordination of the growth and form of the Shire via the planning of residential development, commercial centres, tourist development, rural land and recreational areas. This is achieved through the preparation of Local Planning Schemes, assessment of development, rezoning and subdivision applications, and by formulating policies and strategies for sustainable development and conservation. The Division is particularly focused on providing an integrated service in the area of development application assessment and implementation. The Division provides planning and development information to the community and is responsible for assisting Council in the preparation of land use plans and policies designed to manage development and preserve the character and environment of the Shire. Specific services carried out by the Division include: assessment of development and
subdivision applications, assessment of Scheme amendment
proposals (including rezoning), administration of the district Town
Planning Scheme, formulation and implementation of
planning and development policies, preparation of land use and urban
growth strategies, and building control. Town Planning Scheme No. 7 was gazetted in 1998 and comprises a Scheme text and Scheme map (in a number of sheets). All land in the Shire has been ‘zoned’ or ‘reserved’ for a particular land use on the Scheme map e.g. ‘Residential’, ‘Rural’ or ‘Recreation’. The Scheme text lists the types of use or development that is permitted in each zone, specifies the uses which require
planning consent, and describes any restrictions which may relate to land use and/or development. There are also Scheme policies and guidelines which affect the use and development of land within the Shire and can influence outcomes related to landscape protection, clearing of vegetation, building height and related matters. The use or development of land generally requires the approval of the Shire. Planning decisions are based on the local and regional planning framework, and often involves consultation with the community and Government agencies. If planning consent is granted, it is usually subject to a range of conditions, which must be met before the issue of the building licence, prior to the occupation of the completed development, or before commencement of the use. Subdivision applications are determined by the Western Australian Planning Commission which takes into account comments from the Shire and other referral authorities. The rapid growth of the Shire presents various challenges for land use planning in the Shire and these are being addressed through a number of outcomes and initiatives including: Implementation of the local planning
scheme; implementation of adopted urban
growth strategies; assessment of structure plans for new
urban development; implementation of policies for public
open space and urban landscaping; preparation of community facilities
and development contribution plans; implementation of streetscape and
civic precinct plans in Capel; and monitoring and analysis of lot
creation, building completions, population growth and demographic trends.
Shire of Capel Profile 46
7.4 Capel Townsite Strategy The 2008 Capel Townsite Strategy recognises that the town of Capel represents the major community, administrative, and economic (district) centre for the Shire. Capel is experiencing significant and ongoing demands for urban growth along with the urban development occurring in Dalyellup. The Strategy indicates that future development of more than 2,000 additional lots could ultimately result in a population of up to 7,000 persons in the town. The Strategy establishes strategic planning directions for Capel in relation to residential, community, environmental, recreation, social, economic and other outcomes over a 15 year timeframe. Subsequent urban structure planning will ultimately determine the size, form and nature of Capel in terms of land use and development.
A number of actions have been adopted relating to: Population Growth and Land Supply Economy and Employment Community Facilities/Recreation Environmental Values Infrastructure and Utilities Transport and Access Character and Sustainability Heritage
The Capel Townsite Structure Plan identifies six planning precincts which identify residential, commercial, industrial, recreation and other areas. Recommendations for future urban development, including notional residential densities and indicative timing of future development are also provided. Table 32 summarises the projected lot yields in Capel over the short, medium and long terms with an estimated 2,400 additional lots to be created over the next 20-30 years. This estimate is in addition to the 920 lots existing in 2011.
Table 32 Capel Residential Lot Potential
Category Indicative timeframe
Potential lot yield
Existing lots 2011 - 920
Zoned land - SE Capel Structure Plan 3-5 years 650
Urban consolidation/infill 3-5 years 500
Short term deferred – ST1, ST2 3-5 years 370
Medium term deferred – MT1, MT2, MT3 5-10 years 200
Long term deferred – LT1, LT2, LT3 10-20 years+ 700
Total lot yield 3,340 Source: adapted from Capel Townsite Strategy 2008 and SE Capel Local Structure Plan 2014
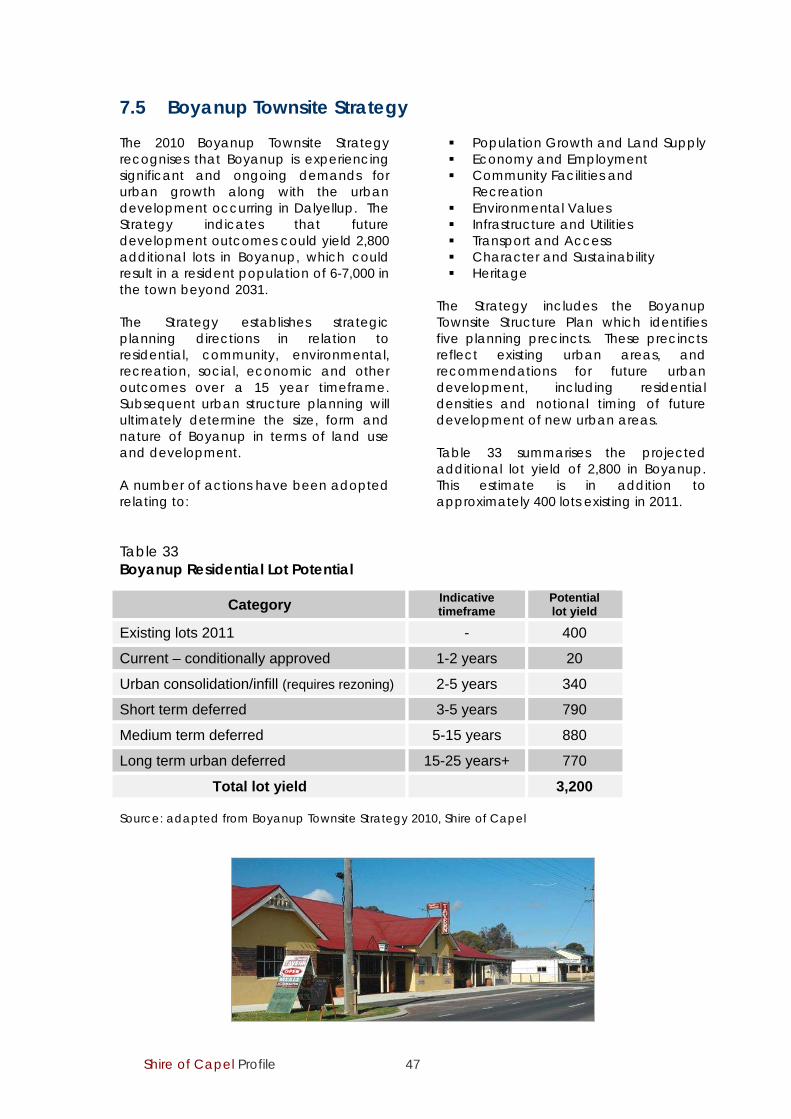
Shire of Capel Profile 47
7.5 Boyanup Townsite Strategy The 2010 Boyanup Townsite Strategy recognises that Boyanup is experiencing significant and ongoing demands for urban growth along with the urban development occurring in Dalyellup. The Strategy indicates that future development outcomes could yield 2,800 additional lots in Boyanup, which could result in a resident population of 6-7,000 in the town beyond 2031. The Strategy establishes strategic planning directions in relation to residential, community, environmental, recreation, social, economic and other outcomes over a 15 year timeframe. Subsequent urban structure planning will ultimately determine the size, form and nature of Boyanup in terms of land use and development. A number of actions have been adopted relating to:
Population Growth and Land Supply Economy and Employment Community Facilities and
Recreation Environmental Values Infrastructure and Utilities Transport and Access Character and Sustainability Heritage
The Strategy includes the Boyanup Townsite Structure Plan which identifies five planning precincts. These precincts reflect existing urban areas, and recommendations for future urban development, including residential densities and notional timing of future development of new urban areas. Table 33 summarises the projected additional lot yield of 2,800 in Boyanup. This estimate is in addition to approximately 400 lots existing in 2011.
Table 33 Boyanup Residential Lot Potential
Category Indicativetimeframe
Potential lot yield
Existing lots 2011 - 400
Current – conditionally approved 1-2 years 20
Urban consolidation/infill (requires rezoning) 2-5 years 340
Short term deferred 3-5 years 790
Medium term deferred 5-15 years 880
Long term urban deferred 15-25 years+ 770
Total lot yield 3,200 Source: adapted from Boyanup Townsite Strategy 2010, Shire of Capel
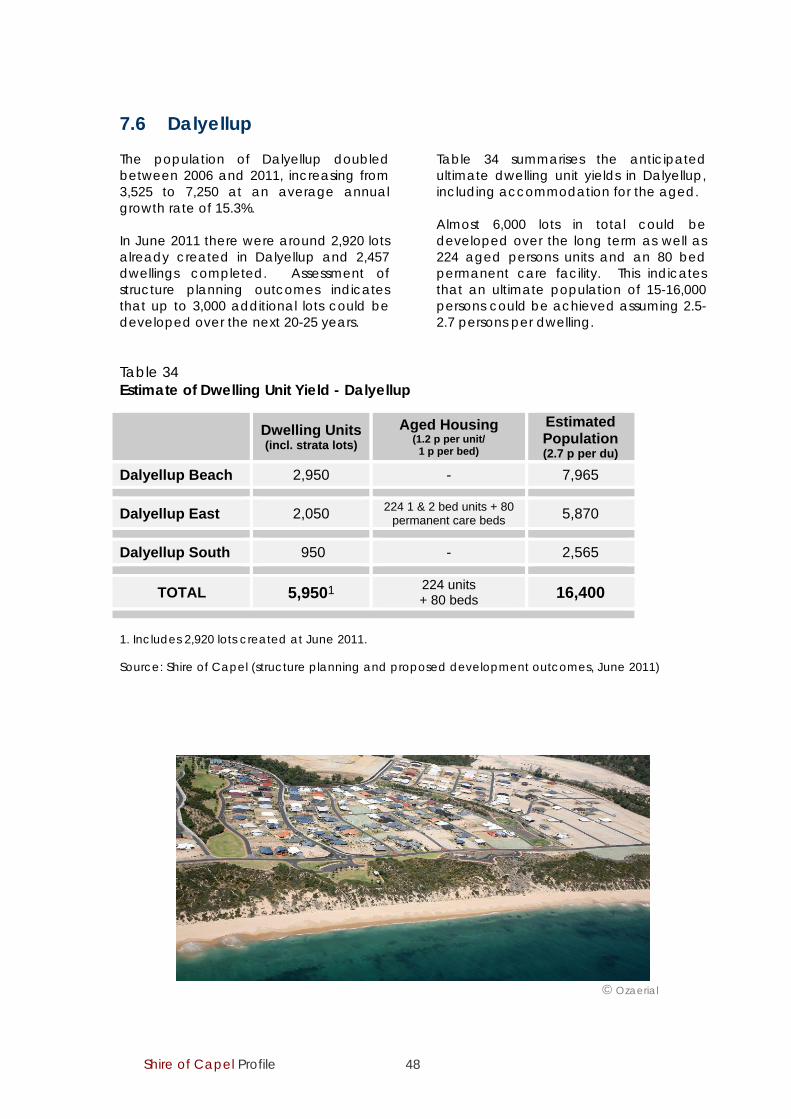
Shire of Capel Profile 48
7.6 Dalyellup The population of Dalyellup doubled between 2006 and 2011, increasing from 3,525 to 7,250 at an average annual growth rate of 15.3%. In June 2011 there were around 2,920 lots already created in Dalyellup and 2,457 dwellings completed. Assessment of structure planning outcomes indicates that up to 3,000 additional lots could be developed over the next 20-25 years.
Table 34 summarises the anticipated ultimate dwelling unit yields in Dalyellup, including accommodation for the aged. Almost 6,000 lots in total could be developed over the long term as well as 224 aged persons units and an 80 bed permanent care facility. This indicates that an ultimate population of 15-16,000 persons could be achieved assuming 2.5-2.7 persons per dwelling.
Table 34 Estimate of Dwelling Unit Yield - Dalyellup
Dwelling Units(incl. strata lots)
Aged Housing (1.2 p per unit/
1 p per bed)
Estimated Population (2.7 p per du)
Dalyellup Beach 2,950 - 7,965
Dalyellup East 2,050 224 1 & 2 bed units + 80 permanent care beds 5,870
Dalyellup South 950 - 2,565
TOTAL 5,9501 224 units + 80 beds 16,400
1. Includes 2,920 lots created at June 2011. Source: Shire of Capel (structure planning and proposed development outcomes, June 2011)
© Ozaerial

Shire of Capel Profile 49
7.7 Greater Bunbury Region Scheme The Greater Bunbury Region Scheme (GBRS) has been in operation since November 2007 and provides the legal basis for land use planning in the region. The Greater Bunbury region comprises the area from Lake Preston in the north to Peppermint Grove Beach in the south, and east to the Darling Scarp. It includes the City of Bunbury and the Shires of Harvey, Dardanup and Capel. It is estimated that by 2026 the population of the Greater Bunbury region will exceed 120,000 people. It is therefore important to ensure that there is an adequate supply of commercial, residential and industrial land to accommodate future growth, as well as adequate mechanisms to conserve key environmental features. The GBRS defines the future land use of the region, dividing it into zones and reservations. Local government is required to reflect planning outcomes in local Schemes consistent with the GBRS. The GBRS comprises a Scheme map and text. The text provides planning rules for zones and reservations, which are shown on the map sheets in different colours and patterns. Scheme zones include:
Urban: to provide for residential development and associated local employment, recreation and open space, shopping, schools and other community facilities. Urban deferred: land suitable for future urban development. Various planning, servicing and environmental requirements need to be addressed before urban development can occur. Rural: for the sustainable use of land for agricultural purposes, to assist in the conservation and the wise use of natural resources. These areas can also provide a distinctive rural landscape unique to the region and accommodate carefully planned rural living developments. The Scheme also identifies Regional Open Space reserves which are designed to protect the natural environment, provide recreational opportunities and safeguard important rural and natural landscapes to be enjoyed by the public. The GBRS text and map can be found on the Department of Planning web page ‘www.planning.wa.gov.au’.
GBRS map extract - Dalyellup and Gelorup
Shire of Capel Profile 50
References Australian Bureau of Statistics. 2001, 2006 and 2011 Census data. Canberra, ACT Australian Bureau of Statistics. 3218.0 Regional Population Growth, Australia. Canberra. Capel Vale web page, 2011. www.capelvale.com Challenge Dairy web page, 2010. www.challengedairy.com.au Department of Agriculture and Food web page, 2010. www.agric.wa.gov.au Department of Infrastructure and Regional Development, 2014. Progress in Australian
Regions: Yearbook 2014. Canberra, ACT. Department of Local Government web page, 2010. www.dlg.wa.gov.au Department of Regional Development and Lands web page, 2010. www.rdl.wa.gov.au Geographe Vignerons Association web page, 2011. www.geographewine.com.au Office of Multicultural Interests (Department of Local Government) web page, 2013.
www.omi.wa.gov.au Regional Australia Institute web page, 2013. www.regionalaustralia.org.au Regional Development Australia - South West, 2010. South West Regional Plan 2010.
Bunbury, WA. Satterley Property Group web page, 2011. www.satterley.com.au Shire of Capel, 2010. Boyanup Townsite Strategy. Capel, WA. Shire of Capel, 2011. Boyanup Public Open Space Strategy. Capel, WA Shire of Capel, 2011. Capel Town Public Open Space Strategy. Capel, WA. Shire of Capel, 2008. Capel Townsite Strategy. Capel, WA. Shire of Capel, 2013. Peppermint Grove Beach Land Use Strategy. Capel, WA Shire of Capel, 1995. Just a Horse Ride Away. Capel, WA. Shires of Capel, Harvey and Dardanup, City of Bunbury and Department of Sport and
Recreation, 2009. Greater Bunbury Sports Facilities Planning Report. Bunbury, WA. South West Development Commission web page. www.swdc.wa.gov.au Western Australia Planning Commission web page. www.planning.wa.gov.au
Shire of Capel Profile 51
Notes on ABS data Confidentiality In relation to Census data for small areas, the ABS advises that this data is subject to a confidentiality process before release to avoid releasing information that may allow for identification of particular individuals, families or households. Accordingly, care should be taken in analysing tables with cells containing small numbers. Aside from the effects of the confidentiality process, possible respondent and processing errors have greatest relative impact on small numbers. It is not possible to determine which individual figures have been affected by random error adjustments, but the ABS advises that the small variance which may be associated with derived totals can, for the most part, be ignored. Estimated Resident Population The Estimated Resident Population (ERP) is the official measure of the Australian population, and is based on the concept of usual residence. It refers to all people, regardless of nationality or citizenship, who usually live in Australia, with the exception of foreign diplomatic personnel and their families. The ERP includes usual residents who are overseas for less than 12 months and excludes overseas visitors who are in Australia for less than 12 months. In the Census year, the ERP is first calculated at the Census date (9 August for the 2011 Census), and is then backdated to calculate the ERP at 30 June of the Census year. After each Census, estimates for the preceding inter-census period are revised to ensure that the total inter-census increase agrees with the difference between the estimated resident populations at the two 30 June dates in the respective Census years. In the compilation of the 30 June ERP for a Census year, three important adjustments are made to the Census count based on Place of usual residence.
The first is an adjustment for Census under-enumeration. The level of under-enumeration is derived from the Post Enumeration Survey which is conducted soon after the Census, and from estimates based on demographic analysis.
The second adjustment is the inclusion of the estimated number of Australian residents who are temporarily overseas on Census Night and are therefore not covered by the Australian Census. Using data on residents returning in the 12 months after the Census date, an estimate of the number of residents temporarily overseas is made.
The third adjustment occurs because the Census is not conducted on 30 June - the 2011 Census was held on 9 August and population estimates were back-dated to 30 June.
Statistical Geography The ABS replaced the Australian Standard Geographical Classification (ASGC) with the Australian Statistical Geography Standard (ASGS) in July 2011. The mid-2011 release of ‘Regional Population Growth, Australia’ (cat. no. 3218.0) contained data on both geographies, allowing a smoother transition to the new geography. Consequently resident population estimates for both geographies e.g. SLA and the Statistical Area Level 2 (SA2) were released at that time. Population estimates will be available at the SA2 level and at other levels such as SA3 and SA4. ERP data will be available on request for other geographical aggregations (for example geographical areas built up from SA1s) as a charged consultancy service. The LGA is one of the non-ABS geographies included in the ASGS, and as LGA population estimates are regarded as an important ABS output, they will continue to be prepared and released post 2011.
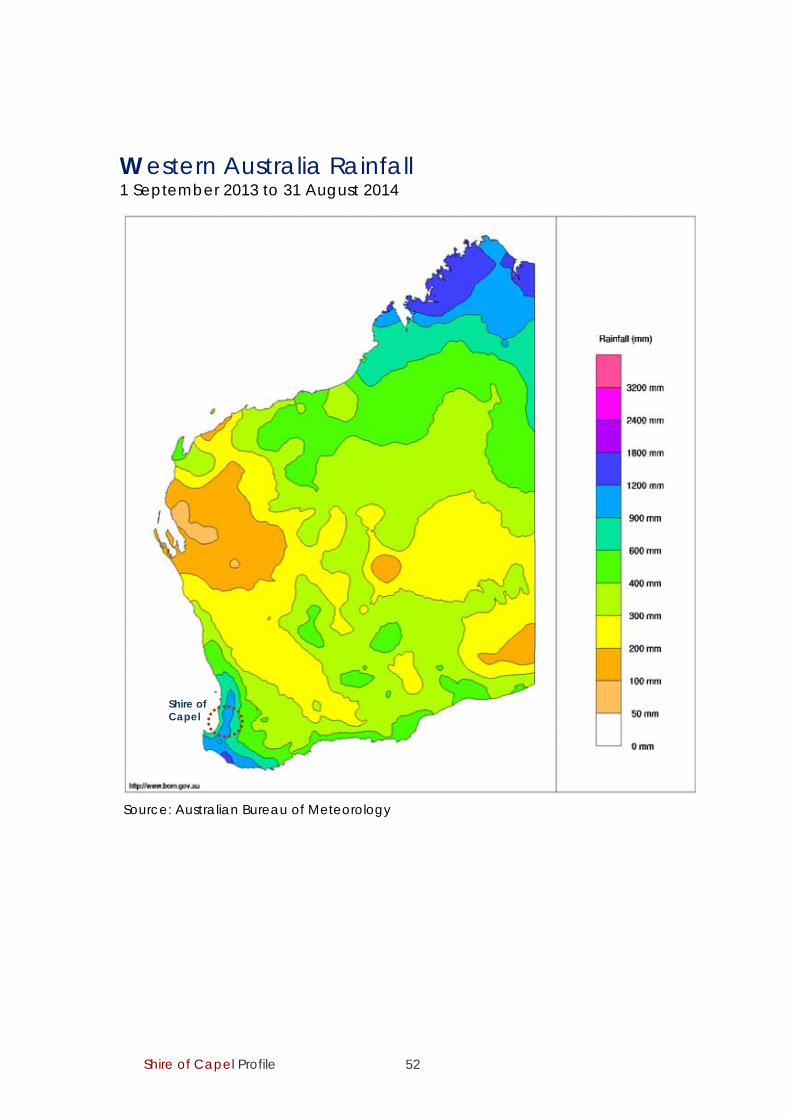
Shire of Capel Profile 52
Western Australia Rainfall 1 September 2013 to 31 August 2014
Source: Australian Bureau of Meteorology
Shire of Capel

Shire of Capel Profile 53
Acknowledgments Shire of Capel Tim Shingles - Strategic Projects Planner Chris Burwood - Manager, Strategic Projects Australian Bureau of Statistics www.abs.gov.au Department of Planning www.planning.wa.gov.au South West Development Commission www.swdc.wa.gov.au Landgate www.landgate.wa.gov.au Department of Indigenous Affairs www.dia.wa.gov.au Department of Regional Development www.drd.wa.gov.au Department of Local Government and Communities www.dlg.wa.gov.au Regional Australia Institute www.regionalaustralia.org.au
photos © Tim Shingles
Department of Indigenous Affairs