shoreline analysis report for for shorelines in whitman ... · 5.3.5 city of palouse ... appendix b...
TRANSCRIPT

FINAL
Shoreline Analysis Report for for Shorelines in Whitman County; the Cities of Colfax, Palouse, Pullman and Tekoa; and the Towns of Albion, Malden and Rosalia
Whitman County P.O. Box 430310 N. Main StreetColfax WA, 99111
Prepared for:
August 2014


F INAL WHITMAN COUNTY GRANT NO . G1400494
S H O R E L I N E A N A L Y S I S R E P O R T
FOR SHORELINES IN WHITMAN COUNTY; THE
CITIES OF COLFAX, PALOUSE, PULLMAN AND
TEKOA; AND THE TOWNS OF ALBION,
MALDEN AND ROSALIA
Prepared for:
Prepared by:
August 12, 2014
The Watershed Company
Reference Number:
130736
Whitman County
P.O. Box 430
310 N. Main Street
Colfax WA, 99111
This report was funded in part
through a grant from the
Washington Department of
Ecology.
STRATEGY | ANALYSIS | COMMUNICATIONS
2025 First Avenue, Suite 800 Seattle WA 98121

Cite this document as:
The Watershed Company and BERK. August 2014. Final Shoreline Analysis
Report for Shorelines in Whitman County; Cities of Colfax, Palouse, Pullman and
Tekoa; and the Towns of Albion, Malden and Rosalia. Prepared for Whitman
County.
The Watershed Company Contact Person:
Amy Summe / Clover Muters
BERK Contact Person:
Alex Cohen

i
T A B L E O F C O N T E N T S Page #
1 Introduction ............................................................................... 1
1.1 Background and Purpose ............................................................................. 1
1.2 Shoreline Jurisdiction .................................................................................. 2
1.2.1 Shorelines of the State .................................................................................... 2 1.2.2 Shorelines of Statewide Significance ............................................................ 3
1.3 Study Area ..................................................................................................... 3
2 Summary of Current Regulatory Framework .......................... 4
2.1 Shoreline Management Act .......................................................................... 4
2.2 Local Regulations ......................................................................................... 5
2.2.1 Whitman County .............................................................................................. 5 2.2.2 Town of Albion ................................................................................................. 6 2.2.3 City of Colfax .................................................................................................... 6 2.2.4 Town of Malden................................................................................................ 7 2.2.5 Town of Rosalia ............................................................................................... 7 2.2.6 City of Palouse ................................................................................................. 7 2.2.7 City of Pullman................................................................................................. 7 2.2.8 City of Tekoa .................................................................................................... 7
2.3 State Agencies and Regulations .................................................................. 8
2.4 Federal Regulations .................................................................................... 10
3 Summary of Ecosystem Conditions ...................................... 12
3.1 Palouse (WRIA 34) ...................................................................................... 12
3.1.1 Geographic and Ecosystem Context ........................................................... 12 3.1.2 Topography, Geology, and Drainage Patterns ........................................... 13 3.1.3 Major Land Use Changes .............................................................................. 13 3.1.4 Fish and Wildlife ............................................................................................ 15
3.2 Middle Snake (WRIA 35) ............................................................................. 16
3.2.1 Geographic and Ecosystem Context ........................................................... 16 3.2.2 Topography, Geology, and Drainage Patterns ........................................... 17 3.2.3 Major Land Use Changes .............................................................................. 17 3.2.4 Fish and Wildlife ............................................................................................ 18

ii
3.3 Hangman (Latah) Creek (WRIA 56) ............................................................ 19
3.3.1 Geographic and Ecosystem Context ........................................................... 19 3.3.2 Topography, Geology, and Drainage Patterns ........................................... 19 3.3.3 Major Land Use Changes .............................................................................. 19 3.3.4 Fish and Wildlife ............................................................................................ 20
4 Shoreline Inventory ................................................................. 20
4.1 Inventory Data Sources, Assumptions and Data Gaps ............................ 20
4.1.1 Ecological Characterization ......................................................................... 21 4.1.2 Land Use Characterization ........................................................................... 25
4.2 Reach Delineation ....................................................................................... 29
4.3 Summary of Shoreline Inventory Results .................................................. 32
5 Analysis of Ecological Functions .......................................... 32
5.1 Approach, Rationale and Limitations of Functional Analysis .................. 32
5.1.1 Functions and Impairments .......................................................................... 33 5.1.2 Limitations ...................................................................................................... 40
5.2 County Shoreline Results ........................................................................... 40
5.2.1 Lakes ............................................................................................................... 40 5.2.2 Palouse River ................................................................................................. 47 5.2.3 South Fork Palouse River ............................................................................. 50 5.2.4 Rock Creek ..................................................................................................... 52 5.2.5 Cottonwood Creek ......................................................................................... 54 5.2.6 Fourmile Creek............................................................................................... 56 5.2.7 Hangman Creek ............................................................................................. 58 5.2.8 Pine Creek ...................................................................................................... 60 5.2.9 Union Flat Creek ............................................................................................ 62 5.2.10 Snake River .................................................................................................... 64
5.3 City and Town Shoreline Results ............................................................... 68
5.3.1 Town of Albion ............................................................................................... 68 5.3.2 City of Colfax .................................................................................................. 72 5.3.3 Town of Malden.............................................................................................. 80 5.3.4 Town of Rosalia ............................................................................................. 82 5.3.5 City of Palouse ............................................................................................... 85 5.3.7 City of Pullman............................................................................................... 89 5.3.8 City of Tekoa .................................................................................................. 95
5.4 Restoration Opportunities .......................................................................... 99

iii
5.4.1 County- and City-wide ................................................................................... 99 5.4.2 City of Palouse ............................................................................................. 100 5.4.3 City of Pullman............................................................................................. 101
6 Land Use Analysis ................................................................ 102
6.1 County ....................................................................................................... 102
6.1.1 Lakes ............................................................................................................. 102 6.1.2 Palouse River ............................................................................................... 104 6.1.3 South Fork Palouse River ........................................................................... 108 6.1.4 Rock Creek ................................................................................................... 110 6.1.5 Hangman Creek ........................................................................................... 112 6.1.6 Pine Creek .................................................................................................... 114 6.1.7 Union Flat Creek .......................................................................................... 116 6.1.8 Snake River .................................................................................................. 118
6.2 City and Towns ......................................................................................... 124
6.2.1 Town of Albion ............................................................................................. 124 6.2.2 City of Colfax ................................................................................................ 126 6.2.3 Town of Malden............................................................................................ 132 6.2.4 Town of Rosalia ........................................................................................... 133 6.2.5 City of Palouse ............................................................................................. 136 6.2.6 City of Pullman............................................................................................. 141 6.2.7 City of Tekoa ................................................................................................ 148
7 Shoreline Management Recommendations ........................ 151
7.1 Environment Designations ....................................................................... 151
7.2 General Policies and Regulations ............................................................ 153
7.2.1 Archaeological and Historic Resources ................................................... 153 7.2.2 Critical Areas ................................................................................................ 153 7.2.3 Flood Hazard Reduction ............................................................................. 153 7.2.4 Public Access .............................................................................................. 154 7.2.5 Shoreline Vegetation Conservation ........................................................... 154 7.2.6 Water Quality, Stormwater, and Nonpoint Pollution ................................ 154
7.3 Shoreline Modification Provisions ........................................................... 154
7.3.1 Shoreline Stabilization ................................................................................ 154 7.3.2 Piers and Docks ........................................................................................... 155 7.3.3 Fill .................................................................................................................. 155 7.3.4 Breakwaters, Jetties, Groins and Weirs .................................................... 155 7.3.5 Dredging and Dredge Material Disposal ................................................... 155 7.3.6 Shoreline Habitat and Natural Systems Enhancement Projects ............ 155

iv
7.4 Shoreline Uses .......................................................................................... 156
7.4.1 Agriculture .................................................................................................... 156 7.4.2 Aquaculture .................................................................................................. 156 7.4.3 Boating Facilities ......................................................................................... 156 7.4.4 Commercial Development .......................................................................... 156 7.4.5 Forest Practices ........................................................................................... 156 7.4.6 Industry ......................................................................................................... 156 7.4.7 In-stream Structural Uses ........................................................................... 157 7.4.8 Mining ........................................................................................................... 157 7.4.9 Recreational Development ......................................................................... 157 7.4.10 Residential Development ............................................................................ 157 7.4.11 Transportation and Parking ........................................................................ 158 7.4.12 Utilities .......................................................................................................... 158
7.5 Restoration Plan........................................................................................ 158
8 References ............................................................................. 160
9 List of Acronyms and Abbreviations ................................... 162
APPENDIX A Whitman County Assessment of Shoreline Jurisdiction APPENDIX B Shoreline Inventory Map Folio APPENDIX C Shoreline Inventory Data Sources APPENDIX D Summary of Shoreline Inventory by Reach
L I S T O F F I G U R E S Page #
Figure 3-1. Map of Water Resource Inventory Areas in Whitman County (WDFW, Salmonscape) ........................................................................................ 12
Figure 6-1. Town of Albion Population and Housing Units 1990 – 2010 ................. 125
Figure 6-2. City of Colfax Population and Housing Units 1990 – 2010 .................... 130
Figure 6-3. Town of Rosalia Population and Housing Units 1990 - 2010 ................ 135
Figure 6-4. City of Palouse Housing and Population Units 1990 - 2010 .................. 139
Figure 6-5. City of Pullman Population and Housing Units 1990 - 2010 .................. 144
Figure 6-6. City of Tekoa Population and Housing Units 1990 - 2010 ..................... 150

v
L I S T O F T A B L E S Page #
Table 3-1. Category 4 Waterbodies in WRIA 34 ...................................................... 14
Table 3-2. Category 5 Waterbodies (Impaired) in WRIA 34 ..................................... 14
Table 3-3. Priority Habitats and Species in Whitman County ................................... 15
Table 3-4. Category 4 Waterbodies in WRIA 35 ...................................................... 18
Table 3-5. Category 5 Waterbodies in WRIA 35 ...................................................... 18
Table 4-1. Water-Oriented Uses Definitions and Examples. .................................... 27
Table 4-2. Shoreline Reaches Used in Functional Analysis..................................... 30
Table 5-1. Ecological processes and functions used to evaluate shoreline reaches. ................................................................................................. 33
Table 5-2. Description of shoreline functions and common sources of human disturbance. ........................................................................................... 35
Table 5-3. Functional score ranking criteria for streams and rivers.1 ....................... 37
Table 5-4. Functional score ranking criteria for lakes .............................................. 39
Table 5-5. Functional scoring for shoreline lakes .................................................... 41
Table 5-6. Functional scoring for Palouse River reaches ........................................ 48
Table 5-7. Functional scoring for South Fork Palouse River reaches ...................... 50
Table 5-8. Functional scoring for Rock Creek reaches ............................................ 52
Table 5-9. Functional scoring for Cottonwood Creek reaches ................................. 54
Table 5-10. Functional scoring for Fourmile Creek .................................................... 56
Table 5-11. Functional scoring for Hangman Creek .................................................. 58
Table 5-12. Functional scoring for Pine Creek reaches ............................................. 60
Table 5-13. Functional scoring for Union Flat Creek reaches .................................... 62
Table 5-14. Functional scoring for Snake River reaches ........................................... 65
Table 5-15. Functional scoring for South Fork Palouse River reaches in the Town of Albion ....................................................................................... 69
Table 5-16. Functional scoring for Palouse River reaches in the City of Colfax ......... 72
Table 5-17. Functional scoring for Pine Creek reaches in the Town of Malden ......... 80
Table 5-18. Functional scoring for Pine Creek reaches in the Town of Rosalia ......... 82
Table 5-19. Functional scoring for Palouse River reaches in the City of Palouse ...... 85
Table 5-20. Functional scoring for Palouse River reaches in the City of Pullman ...... 89
Table 5-21. Functional scoring for Hangman Creek reaches in the City of Tekoa ..... 95
Table 5-22. Documented Restoration Opportunities in Whitman County ................... 99
Table 6-1. Publicly Owned Whitman County Lake Shorelines ............................... 102
Table 6-2. Palouse River Open Space and Public Access Summary .................... 107
Table 6-3. Rock Creek Open Space and Public Access Summary by Reach ........ 112
Table 6-4. Snake River Open Space and Public Access Summary ....................... 123
Table 6-5. City of Pullman Open Space and Public Access Summary .................. 146


The Watershed Company/BERK August 2014
1
S H O R E L I N E A N A LY S I S R E P O R T WHITMAN COUNTY; THE C ITIES OF COLFAX , PALOUSE , PULLMAN , AND TEKOA; AND THE TOWNS OF ALBION , MALDEN AND ROSALIA
1 INTRODUCTION
1.1 Background and Purpose
Whitman County (County); the Cities of Colfax, Palouse, Pullman and Tekoa; and the
Towns of Albion, Malden and Rosalia (cities and towns collectively referred to as Cities)
obtained a grant from the Washington Department of Ecology (Ecology) in 2013 to
complete a comprehensive update of their Shoreline Master Programs (SMP). One of the
first steps of the update process is to inventory and characterize the County and City
shorelines as defined by the State’s Shoreline Management Act (SMA) (RCW 90.58).
This Shoreline Analysis Report was conducted in accordance with the Shoreline Master
Program Guidelines (Guidelines, Chapter 173-26 WAC) and project Scope of Work
promulgated by Ecology. Under these Guidelines, the County and Cities must identify
and assemble the “most current, accurate, and complete scientific and technical
information available that is applicable to the issues of concern” regarding natural and
built environment characteristics in shoreline jurisdiction.
This Shoreline Analysis Report inventories and describes existing conditions and
characterizes ecological functions in the shoreline jurisdiction. This assessment of
current conditions will serve as the baseline against which the impacts of future
development actions in shoreline jurisdiction will be measured. The Guidelines require
that the County and Cities demonstrate that their updated SMPs yield “no net loss” in
shoreline ecological functions relative to the baseline (current condition) due to its
implementation. By describing and inventorying existing conditions, this Shoreline
Analysis Report will be used to help inform the development of appropriate SMP
policies, regulations, and environment designations to help meet the “no net loss” goal.

Final Whitman County Coalition Shoreline Analysis Report
2
1.2 Shoreline Jurisdiction
1.2.1 Shorelines of the State
As defined by the Shoreline Management Act of 1971, shorelines include certain waters
of the state plus their associated “shorelands.” At a minimum, the waterbodies
designated as shorelines of the state are streams whose mean annual flow is 20 cubic feet
per second (cfs) or greater, lakes whose area is greater than 20 acres, and all marine
waters. Ecology has identified the upstream limits of shoreline streams and rivers based
on projected mean annual flow of 20 cfs (Higgins 2003), and those lakes that are 20 acres
or greater in size.
Shorelands are defined as:
“those lands extending landward for 200 feet in all directions as measured on a
horizontal plane from the ordinary high water mark; floodways and contiguous
floodplain areas landward 200 feet from such floodways; and all wetlands and river
deltas associated with the streams, lakes, and tidal waters which are subject to the
provisions of this chapter…Any county or city may determine that portion of a one-
hundred-year-floodplain to be included in its master program as long as such
portion includes, as a minimum, the floodway and the adjacent land extending
landward two hundred feet therefrom… Any city or county may also include in its
master program land necessary for buffers for critical areas (RCW 90.58.030)”
The ordinary high water mark (OHWM) is:
“that mark that will be found by examining the bed and banks and ascertaining
where the presence and action of waters are so common and usual, and so long
continued in all ordinary years, as to mark upon the soil a character distinct from
that of the abutting upland, in respect to vegetation as that condition exists on June
1, 1971, as it may naturally change thereafter, or as it may change thereafter in
accordance with permits issued by a local government or the department:
PROVIDED, That in any area where the ordinary high water mark cannot be found,
the ordinary high water mark adjoining salt water shall be the line of mean higher
high tide and the ordinary high water mark adjoining fresh water shall be the line of
mean high water” (RCW 90.58.030(2)(b)).
A detailed discussion of the initial jurisdiction assessment and determination process,
which concluded in March 2014, can be reviewed in full in Appendix A of this report.
During the more detailed shoreline investigations conducted to prepare this report,

The Watershed Company/BERK August 2014
3
additional modifications to the shoreline jurisdiction map were made in the City of
Pullman area as follows.
The FEMA map identified two floodway areas that extend down South Grand Avenue
and generally up North Grand Avenue. The City’s planning and public
works/engineering staff provided additional information about these features that
resulted in their omission from shoreline jurisdiction. According to the City, the
floodway along South Grand Avenue is actually a part of Dry Fork Creek, a piped
system underneath the roadway. There is no surface flow associated with this piped
feature, and thus it cannot reasonably be considered a shoreland. City staff have
determined that a second floodway finger shown along North Grand Avenue is
associated with Missouri Flat Creek (a non-shoreline stream), and is caused by drainage
problems on that creek rather than flows and processes in the Palouse River. Shoreline
jurisdiction up the Missouri Flat Creek floodway was terminated at the point where
flood activity shifts from being related to the Palouse River to being a byproduct of
internal Missouri Flat Creek conditions.
On the mainstem South Fork Palouse River near the north end of the City, shoreline
jurisdiction area was also reduced by omitting areas mapped as hydric soils, but not
mapped as wetland in the National Wetlands Inventory. The affected lands are active
industrial area; examination of the aerial photo clearly shows that wetland conditions
could not be present.
1.2.2 Shorelines of Statewide Significance
A subset of state shorelines, called Shorelines of Statewide Significance, receives special
attention in the Shoreline Management Act and Guidelines. In Eastern Washington, all
streams and rivers which have mean annual flow of 200 cfs or greater or portions of
waterbodies downstream from the first 300 square miles of drainage area are considered
Shorelines of Statewide Significance. Additionally, any lakes larger than 1,000 acres are
also Shorelines of Statewide Significance. This special status applies to all shorelines
within the County along the Palouse and Snake Rivers and Rock Creek and to most of
the shoreline on Pine and Union Flat Creeks. Rock Lake is also a Shoreline of Statewide
Significance. For Shorelines of Statewide Significance, the SMA sets specific preferences
for uses and calls for a higher level of effort in implementing its objectives.
1.3 Study Area
Whitman County encompasses 2,178 square miles and is located in the southeast part of
Washington. Whitman County is bounded to the south by the Snake River. The County

Final Whitman County Coalition Shoreline Analysis Report
4
is bordered to the east by Idaho, to the north by Spokane and Lincoln Counties, and to
the west by Adams and Franklin Counties. The County includes portions of three Water
Resource Inventory Areas (WRIAs). The majority of the County is in the Palouse River
Watershed (WRIA 34), the southern portion of the County is in the Middle Snake River
Watershed (WRIA 35), and a relatively small area in the northeastern portion of the
County is in the Hangman, or Latah, Creek Watershed (WRIA 56).
The County is predominantly rural and agricultural in nature, with unincorporated
areas making up most of the county territory. Incorporated towns include Albion,
Colton, Endicott, Farmington, Garfield, La Crosse, Lamont, Malden, Oakesdale, Rosalia,
Saint John and Uniontown. The two largest cities are Pullman and Colfax where the
majority of housing, commercial and industrial activities are centered. Pullman has a
designated Urban Growth Area (UGA) in which the County retains governance until the
area is annexed. Other incorporated cities include Tekoa and Palouse.
The study area for this report includes all land currently within proposed shoreline
jurisdiction for unincorporated and incorporated areas within Whitman County. The
study area includes relevant discussion of the contributing watersheds.
In total, this shoreline inventory has mapped approximately 464 miles of river/stream
shoreline and 40 miles of lake shoreline that meet shoreline jurisdiction criteria. Total
jurisdictional shoreland area equals approximately 29 square miles, which includes
associated wetlands, floodways, and portions of associated floodplains. Federal lands
make up approximately 19 percent of that area, or 5.5 square miles. The three federal
entities that own the majority of the federal land are the U.S. Bureau of Reclamation, the
U.S. Army Corps of Engineers (Corps), and the U.S. Bureau of Land Management. State
lands make up approximately 6 percent of the total shoreline area, or 1.7 square miles.
2 SUMMARY OF CURRENT REGULATORY FRAMEWORK
2.1 Shoreline Management Act
The Shoreline Management Act of 1971 promoted planning along shorelines and
coordination among governments. The legislative findings and policy intent of the SMA
states:

The Watershed Company/BERK August 2014
5
“There is, therefore, a clear and urgent demand for a planned, rational, and
concerted effort, jointly performed by federal, state, and local governments, to
prevent the inherent harm in an uncoordinated and piecemeal development of the
state's shorelines (RCW 90.58.020).”
While protecting shoreline resources by regulating development, the SMA is also
intended to provide balance by encouraging water-dependent or water-oriented uses
while also conserving or enhancing shoreline ecological functions and values. SMPs will
be based on state guidelines, but should be tailored to the specific conditions and needs
of the local community.
Whitman County adopted its present Shoreline Management Master Plan in 1974, and it
has not been updated since that time. The Cities are all currently using the County’s
SMP.
2.2 Local Regulations
2.2.1 Whitman County
Whitman County adopted its present Shoreline Management Master Plan in 1974, and it
has not been updated since that time. Shoreline uses, developments, and activities are
also subject to the County’s Comprehensive Plan, County Code, and various other
provisions of County, state and federal laws.
The current Shoreline Management Master Plan designations for Whitman County are
briefly described below.
Urban: The Urban environment is an area of high density land-use including
residential, commercial, recreational and industrial development. It is particularly
suitable to those areas presently subjected to extremely intensive use pressure, as
well as areas planned to accommodate urban expansion.
Rural: The Rural environment is intended for those areas characterized by intensive
agriculture and recreational uses and those areas having a high capability to support
active agricultural practices and intensive recreational development
Conservancy: The Conservancy environment is for those areas which are intended
to maintain their existing character. Preferred uses in the Conservancy environment
are those which are non-consumptive of the physical and biological resources of the
area.

Final Whitman County Coalition Shoreline Analysis Report
6
Natural: The Natural environment is characterized by the presence of some unique
natural or cultural features considered valuable in their natural or original condition
which are relatively intolerant of intensive human use.
The County Comprehensive Plan, last updated in 2010, is a statement of policies and
goals that guides growth and development throughout the County. The County is not
required to plan under the Growth Management Act (GMA), although its non-GMA
plan contains many of the same elements required by the GMA. The County
Comprehensive Plan addresses the following elements: land use, transportation,
environmental quality and natural conservation, renewable energy, economic
development, telecommunication, and parks and recreation.
County regulations applicable to critical areas are detailed in Whitman County Code
(WCC) Chapter 9.05. These regulations were adopted in 1994, and were most recently
revised in 2012. In those regulations the County specifies minimum Riparian Habitat
Area buffer widths of 150 feet to 250 feet depending on the stream type (WCC
9.05B.050(B)(30(b)). The regulations also require wetland buffers between 25 and 250
feet based on wetland classification and intensity of proposed land use (WCC
9.05A.050). The County’s Critical Areas regulations also apply to geologically
hazardous areas, critical aquifer recharge areas, and frequently flooded areas.
Many shoreline and wetland areas within the County contain functioning buffers of the
required widths. Smaller functioning buffers are found where developments existed
prior to the critical areas regulations or where buffers of different widths were
previously established in approved site plans or protected critical area easements.
Shoreline uses, developments, and activities regulated under the Critical Areas
regulations are also subject to the County’s Comprehensive Plan, WCC, and various
other provisions of County, state and federal laws. Any applicant must comply with all
applicable laws prior to commencing any use, development, or activity. The County
will ensure consistency between the SMP and other County codes, plans and programs
by reviewing each for consistency during periodic updates.
2.2.2 Town of Albion
The Town of Albion has adopted the County’s SMP.
2.2.3 City of Colfax
The City of Colfax has adopted the County’s SMP. However, the City has its own
critical areas regulations contained in Colfax Municipal Code Title 17, adopted via
The Watershed Company/BERK August 2014
7
Ordinance 13-02 in May 2013. In those regulations, the City requires wetland buffers of
between 50 and 250 feet based solely on wetland category (CMC 17.14.040.C). No
stream buffer widths are specified, although the regulations require preparation of a
habitat management plan based on best available science and a demonstration that a
project would not degrade functions and values of the habitat (CMC 17.14.060).
2.2.4 Town of Malden
The Town of Malden has adopted the County’s SMP. However, the City has its own
critical areas regulations contained in Malden Municipal Code Chapter 17.12, adopted
via Ordinance No. 444 in July 2007. In those regulations, the City requires wetland
buffers of between 50 and 250 feet based solely on wetland category (MMC 17.12.050.C).
No stream buffer widths are specified, although the regulations require preparation of a
habitat management plan based on best available science and a demonstration that a
project would not degrade functions and values of the habitat (MMC 17.12.070).
2.2.5 Town of Rosalia
The Town of Rosalia has adopted the County’s SMP.
2.2.6 City of Palouse
The City of Palouse has adopted the County’s SMP. However, the City has its own
critical areas regulations contained in Palouse Municipal Code Chapter 17.26, last
updated in 2007. In those regulations, the City requires wetland buffers of between 50
and 250 feet based solely on wetland category (PMC 17.26.050). No stream buffer
widths are specified, although the regulations require preparation of a habitat
management plan based on best available science and a demonstration that a project
would not degrade functions and values of the habitat (PMC 17.26.070).
2.2.7 City of Pullman
The City of Pullman has adopted the County’s SMP. However, the City has its own
critical areas regulations contained in Title 16 of the Pullman Municipal Code, most
recently updated in 2007. In those regulations the City specifies recommended
minimum Riparian Habitat Area buffer widths of 50 feet to 150 feet depending on the
stream type (PMC 16.50.470). Wetland buffers of between 25 and 200 feet are required
based on wetland category and intensity of proposed land use (PMC 16.50.270).
2.2.8 City of Tekoa
The City of Tekoa has adopted the County’s SMP. However, the City has its own critical
areas regulations contained in Ordinance 764, which amends Tekoa Municipal Code
Chapter 4.24, Critical Areas Protection. These regulations from 2007 require wetland
Final Whitman County Coalition Shoreline Analysis Report
8
buffers of between 50 and 250 feet based solely on wetland category (TMC 4.24.050.C).
No stream buffer widths are specified, although the regulations require preparation of a
habitat management plan based on best available science and a demonstration that a
project would not degrade functions and values of the habitat (TMC 4.24.070).
2.3 State Agencies and Regulations
Aside from the Shoreline Management Act, State regulations most pertinent to
development in the County’s shorelines include the State Hydraulic Code, State
Environmental Policy Act, Watershed Planning Act, Water Resources Act, Salmon
Recovery Act, and case law. A variety of agencies (e.g., Washington Department of
Ecology, Washington Department of Fish and Wildlife, Washington Department of
Natural Resources) are involved in implementing these regulations or otherwise
managing public shoreline areas. The Department of Ecology reviews all shoreline
projects that require a shoreline permit, but has specific regulatory authority over
shoreline conditional use permits and shoreline variances. Other agency reviews of
shoreline developments are typically triggered by in- or over-water work, discharges of
fill or pollutants into the water, or substantial land clearing.
Depending on the nature of the proposed development, state regulations can play an
important role in the design and implementation of a shoreline project, ensuring that
impacts to shoreline functions and values are avoided, minimized, and/or mitigated.
During the comprehensive SMP update, the County will consider other state regulations
to ensure consistency as appropriate and feasible with the goal of streamlining the
shoreline permitting process. A summary of some of the key state regulations and/or
state agency responsibilities follows.
Hydraulic Code: Chapter 77.55 RCW (the Hydraulic Code) gives the Washington
Department of Fish and Wildlife (WDFW) the authority to review, condition, and
approve or deny “any construction activity that will use, divert, obstruct, or change the
bed or flow of State waters.” These activities may include stream alteration, culvert
installation or replacement, pier and bulkhead repair or construction, among others. In
a permit called a Hydraulic Project Approval (HPA), WDFW can condition projects to
avoid, minimize, restore, and compensate adverse impacts.
Section 401 Water Quality Certification: Section 401 of the federal Clean Water Act
allows states to review, condition, and approve or deny certain federal permitted actions
that result in discharges from fills or excavations to State waters, including wetlands and
streams. In Washington, the Department of Ecology is the State agency that has been

The Watershed Company/BERK August 2014
9
delegated responsibility for conducting that review, with their primary review criteria of
ensuring that State water quality standards are met. Actions within streams or wetlands
within the shoreline zone that require a Section 404 permit (see below), Coast Guard
Permit, or a Federal Energy Regulatory Commission (FERC) license require a Section 401
water quality certification.
Washington Department of Natural Resources: Washington Department of Natural
Resources (WDNR) is charged with protecting and managing use of state-owned aquatic
lands. WDNR manages more than 5.6 million acres of state-owned forest, range,
commercial, agricultural, conservation, and aquatic lands. WDNR manages these lands
for revenue, outdoor recreation, and habitat for native fish and wildlife. Water-
dependent uses waterward of the ordinary high water mark require review by WDNR
to establish whether the project is on state-owned aquatic lands. WDNR recommends
that all proponents of a project waterward of the ordinary high water mark make
contact with WDNR to determine jurisdiction and requirements.
Watershed Planning Act: The Watershed Planning Act of 1998 (Chapter 90.82 RCW)
was passed to encourage local planning of local water resources, recognizing that there
are citizens and entities in each watershed that “have the greatest knowledge of both the
resources and the aspirations of those who live and work in the watershed; and who
have the greatest stake in the proper, long-term management of the resources.”
Whitman County is within three watershed basins. The Palouse Watershed Plan (WRIA
34) was approved and adopted in 2007. However, the Palouse Watershed Planning
Group is not currently operating under the Watershed Planning Act and has not met for
several years. The Middle Snake Watershed Plan (WRIA 35) was completed in 2007 and
had an updated, detailed implementation plan completed in 2011. However, the Middle
Snake Watershed Planning Group is not currently operating under the Watershed
Planning Act. Whitman County adopted the final Hangman (Latah) Creek Watershed
Management Plan (WRIA 56) in September 2005. Phase 4 implementation started in
October 2006, and the detailed implementation plan was completed in early 2008.
Water Pollution Control Act: Chapter 90.48 RCW establishes the State’s policy “to
maintain the highest possible standards to insure the purity of all waters of the State
consistent with public health and public enjoyment thereof, the propagation and
protection of wild life, birds, game, fish and other aquatic life, and the industrial
development of the State, and to that end require the use of all known available and
reasonable methods by industries and others to prevent and control the pollution of the
waters of the State of Washington.” The Department of Ecology is the agency charged

Final Whitman County Coalition Shoreline Analysis Report
10
with crafting and implementing rules and regulations in accordance with this
legislation.
2.4 Federal Regulations
Federal regulations most pertinent to development in the County’s shorelines include
the Endangered Species Act, the Clean Water Act, and the Rivers and Harbors
Appropriation Act. Other relevant federal laws include the National Environmental
Policy Act, Anadromous Fish Conservation Act, Clean Air Act, and the Migratory Bird
Treaty Act. A variety of agencies (e.g., Corps, National Marine Fisheries Service, U.S.
Fish and Wildlife Service) are involved in implementing these regulations, but review by
these agencies of shoreline development in most cases would be triggered by in- or over-
water work, or discharges of fill or pollutants into the water. Depending on the nature
of the proposed development, federal regulations can play an important role in the
design and implementation of a shoreline project, ensuring that impacts to shoreline
functions and values are avoided, minimized, and/or mitigated. During the SMP
update, the County will consider other federal regulations to ensure consistency as
appropriate and feasible with the goal of streamlining the shoreline permitting process.
A summary of some of the key federal regulations and/or federal agency responsibilities
follows.
Clean Water Act: Major components of the Clean Water Act include Section 404, Section
401, and the National Pollutant Discharge Elimination System (NPDES).
Section 404 provides the Corps, under the oversight of the U.S. Environmental
Protection Agency, with authority to regulate “discharge of dredged or fill material into
waters of the United States, including wetlands”
(http://www.epa.gov/owow/wetlands/pdf/reg_authority_pr.pdf). The extent of the
Corps’ authority and the definition of fill have been the subject of considerable legal
activity. As applicable to the County’s shoreline jurisdiction, however, it generally
means that the Corps must review and approve most activities in streams and wetlands.
These activities may include wetland fills, stream and wetland restoration, and culvert
installation or replacement, among others. The Corps requires projects to avoid,
minimize, and compensate for impacts.
A Section 401 Water Quality Certification is required for any applicant for a federal
permit for any activity that may result in any discharge to waters of the United States.
States and tribes may deny, certify, or condition permits or licenses based on the
proposed project’s compliance with water quality standards. In Washington State, the

The Watershed Company/BERK August 2014
11
Department of Ecology has been delegated the responsibility by the U.S. Environmental
Protection Agency for managing implementation of this program.
The NPDES is similar to Section 401, and it applies to ongoing point-source discharge.
Permits include limits on what can be discharged, monitoring and reporting
requirements, and other provisions designed to protect water quality. Examples of
discharges requiring NPDES permits include municipal stormwater discharge,
wastewater treatment effluent, or discharge related to industrial activities.
Endangered Species Act (ESA): Section 9 of the ESA prohibits “take” of listed species.
Take has been defined in Section 3 as: “harass, harm, pursue, hunt, shoot, wound, kill,
trap, capture, or collect, or to attempt to engage in any such conduct.” The take
prohibitions of the ESA apply to everyone, so any action that results in a take of listed
fish or wildlife would be a violation of the ESA and is strictly prohibited. Per Section 7
of the ESA, activities with potential to affect federally listed or proposed species and that
either require federal approval, receive federal funding, or occur on federal land must be
reviewed by the National Marine Fisheries Service (NOAA Fisheries) and/or U.S. Fish
and Wildlife Service (USFWS) via a process called “consultation.” Activities requiring a
Section 10 or Section 404 permit also require such consultation if these activities occur in
waterbodies with listed species. Section 4(f) of the ESA directs the Services to develop or
appoint teams to develop and implement recovery plans for threatened and endangered
species. Whitman County is a member of the Snake River Salmon Recovery Board and
County staff contributed to the development of the 2011 Snake River Salmon Recovery
Plan for Southeast WA.
Magnuson-Stevens Fishery Conservation and Management Act: The Magnuson-
Stevens Fishery Conservation and Management Act of 1996 is administered by the
National Marine Fisheries Service to foster and protect commercial and recreational
fisheries of designated species that “contribute to the food supply, economy, and health
of the Nation and provide recreational opportunities” (18 U.S.C. §1801-a). In Whitman
County, Chinook salmon and steelhead are the two designated species. The primary
avenue for on-the-ground management of those species is designation and protection of
“essential fish habitat” (EFH), which is “those waters and substrate necessary to fish for
spawning, breeding, feeding, or growth to maturity.” The National Marine Fisheries
Service incorporates consideration of EFH into the same process under which projects
are reviewed per the Endangered Species Act.
Rivers and Harbors Act: Section 10 of the federal Rivers and Harbors Appropriation Act
of 1899 provides the U.S. Army Corps of Engineers (Corps) with authority to regulate

Final Whitman County Coalition Shoreline Analysis Report
12
activities that may affect navigation of “navigable” waters. The only designated
“navigable” water in Whitman County is the Snake River. Proposals to construct new or
modify existing over-water structures (including bridges), to excavate or fill, or to “alter
or modify the course, location, condition, or capacity of” navigable waters must be
reviewed and approved by the Corps.
3 SUMMARY OF ECOSYSTEM CONDITIONS
Portions of three major watersheds are located within Whitman County; these include:
the Palouse (34), Middle Snake (35), and Hangman (Latah) Creek (56) Water Resource
Inventory Areas (WRIAs). A map of the WRIAs within Whitman County is provided in
Figure 3-1. These watersheds are described in the following sections.
Figure 3-1. Map of Water Resource Inventory Areas in Whitman County (WDFW, Salmonscape)
3.1 Palouse (WRIA 34)
3.1.1 Geographic and Ecosystem Context
The Palouse watershed covers the majority of Whitman County. The Palouse River
originates in the Bitterroot Mountains in northern Idaho, and flows westerly into
Whitman County before joining the Snake River at the Whitman/Franklin County line.
34-Palouse
35-Middle Snake
56-Hangman Creek

The Watershed Company/BERK August 2014
13
Although there are no man-made dams on the Palouse River, the 185-foot Palouse Falls,
approximately 6 miles upstream from the River’s confluence with the Snake River,
prevents anadromous salmon passage (Golder Associates, Inc. 2009).
3.1.2 Topography, Geology, and Drainage Patterns
The topography of the Palouse watershed transitions from mountainous terrain in Idaho
to rolling hills composed of basalt covered with loess in the central portion of the
watershed. The far western portion of the watershed is in an area called the Channeled
Scablands. This area was shaped by massive floods over the past million years, which
left behind exposed channels of the underlying basalt amongst islands of loess (HDR
and EES 2007).
Precipitation primarily occurs in the winter months, and ranges from 10 inches in the
west to 50 inches in the eastern portion or the watershed (HDR and EES 2007). Many of
the smaller steam channels are dry in the summer. Major tributaries in the watershed
include the North and South Forks, Rebel Flat Creek, Rock Creek, Pine Creek, Union Flat
Creek and Cow Creek. Several lakes occur in the Palouse Watershed, mostly in the Cow
Creek and Rock Creek subbasins. Many of the lakes are natural depressions with basalt
bottoms and no outlets (HDR and EES 2007). Extensive wetlands are present in the Rock
Creek and North Fork Palouse subbasins.
3.1.3 Major Land Use Changes
Historically, the dominant vegetation in the Palouse watershed was a bunchgrass
association. Much of that vegetation has been converted to dryland agriculture or
altered by rangeland uses. Soil erosion resulting from storm water runoff has been a
continuing problem throughout WRIA 34 as a result of land conversions to agriculture.
An estimated 40% of the topsoil in the Palouse has been lost to erosion during this time
(HDR and EES 2007). Most livestock grazing occurs in the westernmost portion of the
basin, within the Channeled Scablands. Urban development makes up a small portion
of the watershed; however, several cities are located directly adjacent to the Palouse
River and its tributaries. The South Fork Palouse River passes through the City of
Pullman and Town of Albion. The North Fork Palouse River passes through the City of
Palouse. The City of Colfax is situated at the confluence of the North and South Forks.
As a result of a flood control project, constructed in 1965, the North Fork Palouse River
is channelized through the City of Colfax, including 3,740 feet of concrete-lined channel
(HDR and EES 2007). Riparian areas have been significantly altered by land use in the
South Fork Palouse subbasin, and many small intermittent streams have been converted
to drainage ditches throughout the North and South Fork subbasins.

Final Whitman County Coalition Shoreline Analysis Report
14
Water quality concerns are primarily from non-point sources throughout most of the
watershed, including erosion, livestock, fertilizers, and septic systems, which contribute
sediment, fecal coliforms, and nutrients. Temperature is also a concern in many of the
waterbodies in the watershed. The Washington Department of Ecology performs
regular water quality assessments and places waterbodies into one of five categories to
describe the status of their water quality. Polluted waters fall into Category 4 and 5.
Category 4 are polluted waters that either have or do not require a TMDL, and Category
5 are polluted waters requiring a TMDL, traditionally referred to as waters on the 303(d)
list. Category 4 and 5 shoreline waterbodies within WRIA 34 are identified in Tables 3-1
and 3-2 below.
Potential point sources of pollutants are particularly significant in the South Fork
Palouse River, where municipal wastewater discharges from the City of Pullman and
the City of Moscow, Idaho contribute nearly all of the summer flows (HDR and EES
2007). In 1997, the South Fork was listed as impaired by elevated levels of ammonia;
however, the City of Pullman and the City of Moscow upgraded their wastewater
treatment facilities, such that water quality standards are now being met on the South
Fork (HDR and EES 2007).
Consumptive water uses are not expected to change significantly within the watershed,
except in the City of Pullman, where municipal, domestic, and university water demand
is expected to increase by approximately 45 percent between 2006 and 2028 (HDR and
EES 2007).
Table 3-1. Category 4 Waterbodies in WRIA 34
River Category Bacteria Ammonia-N Other chemical compounds, including pesticides
PCB
Palouse River, south fork
4a (has a TMDL) X X X X
Palouse River 4a (has a TMDL) X X X
Table 3-2. Category 5 Waterbodies (Impaired) in WRIA 34
River Dieldrin Dissolved Oxygen pH Temperature Bacteria
Palouse River X X X Palouse River, south fork X X X Pine Creek X X Rock Lake X

The Watershed Company/BERK August 2014
15
3.1.4 Fish and Wildlife
There are no ESA-listed salmonids or other listed aquatic species above the Palouse
Falls. Resident fish species above the falls include rainbow trout, brown trout,
smallmouth bass, sculpin, largescale sucker, northern squawfish, shiner perch and
speckled dace (HDR and EES 2007). Trout are less common in the lower portions of the
watershed, presumably as a result of temperature and water quality constraints in the
lower watershed. Rainbow trout have been stocked in Rock Lake, and Kokanee salmon
that are annually stocked into Chapman Lake in Spokane County are found downstream
as far as Rock Lake (HDR and EES 2007). Various warm-water fish are also found in
many of the lakes in the watershed.
Table 3-3 below lists the priority habitats and species (PHS) WDFW has identified in
Whitman County. Fish and Wildlife PHS maps are included as Maps 15-17 in the map
folio (Appendix B).
Table 3-3. Priority Habitats and Species in Whitman County
Priority Habitat/Species State Status
Federal Status Habitats Aspen Stands Biodiversity Areas & Corridors Eastside Steppe Shrub-Steppe Riparian Freshwater Wetlands & Freshwater Deepwater Instream Caves Cliffs Snags and Logs Talus Fish Pacific Lamprey Species of Concern River Lamprey Candidate Species of Concern White Sturgeon Leopard Dace Candidate Mountain Sucker Candidate Bull Trout/Dolly Varden Candidate* Threatened*
Chinook Salmon Candidate Threatened (Upper Columbia Spring run is Endangered)
Rainbow Trout/Steelhead/Inland Redband Trout Candidate** Threatened** Sockeye Salmon Candidate Endangered in Snake River Westslope Cutthroat Wildlife
Columbia Spotted Frog Candidate Western Toad Candidate Species of Concern Sagebrush Lizard Candidate Species of Concern

Final Whitman County Coalition Shoreline Analysis Report
16
Priority Habitat/Species State Status
Federal Status American White Pelican Endangered E WA breeding concentrations of: Grebes, Cormorants E WA breeding: Terns Great Blue Heron Waterfowl Concentrations Bald Eagle Sensitive Species of Concern Ferruginous Hawk Threatened Species of Concern Golden Eagle Candidate Peregrine Falcon Sensitive Species of Concern Prairie Falcon Chukar Ring-necked Pheasant Wild Turkey Upland Sandpiper Endangered E WA breeding occurrences of: Phalaropes, Stilts and Avocets Burrowing Owl Candidate Species of Concern Vaux’s Swift Candidate Pileated Woodpecker Candidate Loggerhead Shrike Candidate Sage Sparrow Candidate Sage Thrasher Candidate Merriam’s Shrew Candidate Preble's Shrew Candidate Species of Concern Roosting Concentrations of: Big-brown Bat, Myotis bats, Pallid Bat Townsend’s Big-eared Bat Candidate Species of Concern Black-tailed Jackrabbit Candidate White-tailed Jackrabbit Candidate Washington Ground Squirrel Candidate Candidate Moose Northwest White-tailed Deer Elk Rocky Mountain Mule Deer Columbia River Tiger Beetle Candidate Mann’s mollusk-eating Ground Beetle Candidate Giant Palouse Earthworm Candidate Shepard’s Parnassian Candidate Silver-bordered Fritillary Candidate
Source: Washington Department of Fish and Wildlife 2008 *Bull trout only **Steelhead only
3.2 Middle Snake (WRIA 35)
3.2.1 Geographic and Ecosystem Context
The Snake River originates in western Wyoming, passing through Idaho, and into
southeastern Washington. The Middle Snake River includes areas in Idaho and Oregon,
and extends downstream to the confluence of the Palouse and Snake Rivers. The Middle

The Watershed Company/BERK August 2014
17
Snake Basin is semi-arid, with annual precipitation ranging from 5 inches in the
lowlands up to 45 inches in the Blue Mountains (Kuttel 2002).
3.2.2 Topography, Geology, and Drainage Patterns
The Snake River contributes about 20 percent of the Columbia River flow (Snake River
Salmon Recovery Board 2011). Stream flows are controlled by the hydropower system,
as well as seasonally variable flows in smaller tributaries corresponding with winter
precipitation and spring snowmelt. The Snake River receives inflow from groundwater
aquifers along its reach, including upper aquifers and deeper basalt aquifers.
3.2.3 Major Land Use Changes
Historically, the Middle Snake River watershed was covered by prairie and canyon
grasslands and shrub-steppe at low to mid-elevations. Forests dominated as elevation
and proximity to the Blue Mountains increased (Kuttel 2002). As a result of land use
changes and development, much of the prairie, shrub-steppe, and riparian habitats have
been lost or modified. Conversion of perennial bunchgrass prairies to production of
annual crops has led to significant quantities of fine sediment erosion and deposition in
WRIA 35 streams (Kuttel 2002).
Floodplains throughout WRIA 35 have been converted to agricultural and residential
use (Kuttel 2002). This development has resulted in channel straightening, armoring,
and simplification (Kuttel 2002).
The hydrology along the Snake River has been severely altered by the installation of
hydroelectric dams. The Corps operates four dams along the lower and middle Snake
River. The dams were built to provide hydroelectric power, river navigation, irrigation
water, and flood control. The upper two dams, Little Goose Dam and Lower Granite
Dam, are located along Whitman County’s shorelines. The dams on the Lower Snake
and Columbia Rivers impound water, creating shallow reservoirs that fill the width of
the steep-sided canyons. Lower Granite Lake is located upstream of Little Granite Dam.
Between Little Goose Dam to the base of Lower Granite Dam, the River is called Lake
Bryan; below Little Goose Dam, it is called Lake Herbert G. West.
Water quality in portions of the Snake River is impaired by several pesticides, dioxin,
PCBs, temperature and dissolved oxygen. Category 4 and 5 shoreline waterbodies
within WRIA 35 are identified in Tables 3-4 and 3-5 below.

Final Whitman County Coalition Shoreline Analysis Report
18
Table 3-4. Category 4 Waterbodies in WRIA 35
River Category Total Dissolved
Gas Invasive Exotic
Species Dioxin
Snake (Herbert G West Lake) 4c X 4a X
Snake (Bryan Lake) 4c X Snake (Lower Granite Lake) 4a X X
Table 3-5. Category 5 Waterbodies in WRIA 35
River PCB
2,3,
7,8-
TCD
D
Die
ldrin
Dis
solv
ed O
xyge
n
pH
Tem
pera
ture
Dio
xin
4,4'
-DD
E
Tota
l Chl
orda
ne
Snake (Bryan Lake) X X X X X X Snake (Herbert G West Lake) X Snake (Lower Granite Lake) X X X X X X X
3.2.4 Fish and Wildlife
The Snake River Basin historically produced substantial runs of spring Chinook, fall
Chinook, coho, and sockeye salmon, and steelhead; however, the abundance of these
species decreased substantially through the 1900s, primarily as a result of fish passage
barriers, poaching, and changes to habitat (Kuttel 2002). In the case of Snake River
sockeye salmon, three of the four main sockeye-rearing lakes were poisoned for decades
in an effort to reduce competition with Kamloops rainbow trout (Kuttel 2002). Snake
River coho salmon have been considered extinct since the early 1980s. Snake River
spring/summer Chinook, fall Chinook, and steelhead are listed as federally threatened.
Snake River sockeye salmon are federally listed as endangered.
The Middle Snake River primarily serves as a migratory corridor for these species. Fall
Chinook salmon also spawn in the Snake River downstream from Hells Canyon Dam,
with limited spawning in the tailraces of the four lower Snake River Dams and the lower
portions of the Grande Ronde, Tucannon, and Palouse Rivers (Kuttel 2002).
The Watershed Company/BERK August 2014
19
3.3 Hangman (Latah) Creek (WRIA 56)
3.3.1 Geographic and Ecosystem Context
The Hangman Creek watershed originates in the mountains in Idaho, and flows south
through the Palouse region in Whitman County.
3.3.2 Topography, Geology, and Drainage Patterns
Hangman Creek flows through sedimentary hills of sand, gravel and cobbles deposited
during the Lake Missoula floods (Spokane County Conservation District (SCCD) 2005).
Precipitation in the Hangman Creek watershed ranges from 18 inches per year at the
mouth to over 40 inches per year in the southeastern headwaters SCCD 2005).
Precipitation occurs primarily in the winter, and summers are dry. As such, flows are
highest (over 200 cfs at the State line) in the winter months, and lowest (less than 1 cfs at
the State line) in late summer.
In upper Hangman Creek, the underlying aquifer occurs within the Columbia River
Basalts.
3.3.3 Major Land Use Changes
Hangman Creek historically supported a tribal salmon fishery upstream of the Town of
Tekoa (Edelen and Allen, 1998 in SCCD 2005). However, as vegetation was cleared and
soils were tilled to accommodate agriculture in the late 1800s, stream conditions became
degraded. In 1893, Gilbert and Evermann described Hangman Creek in the Town of
Tekoa as “an unimportant stream … found to be a small, rather filthy stream, not
suitable for trout or other food-fishes” (Edelen and Allen, 1998 in SCCD 2005).
Today, agriculture is the predominant land use in the upper and middle reaches of the
Hangman Creek watershed. Removal of riparian vegetation has resulted in increased
bank erosion and stream siltation. Forestry practices in the upper watershed have
altered stream flows, increasing peak flows and lowering summer low-flows. The
Lower Hangman Creek watershed supports significant urban development in and
around the City of Spokane, and this area is expected to undergo 50 percent of the City
of Spokane’s urban growth in the next ten years (SCCD 2005).
Water quality is a concern in Hangman Creek. It is on the State’s list of impaired waters
(Category 5) for dissolved oxygen and has a Category 4a listing (has an approved TMDL
in place) for bacteria, temperature and turbidity.

Final Whitman County Coalition Shoreline Analysis Report
20
3.3.4 Fish and Wildlife
Riparian corridors along Hangman Creek support a variety of wildlife, including white-
tailed deer, Rocky Mountain elk, moose, coyote, river otter, beaver, meadow vole, and
deer mice (SCCD 2005). Birds commonly found in riparian habitats include great blue
heron, kingfisher, yellow warbler, mallard, cinnamon teal, green-winged teal, wood
duck, common merganser, western bluebirds, red-winged blackbirds, magpies and
Canada geese. Bald eagles may migrate through the Hangman Creek riparian corridor,
but no known nesting sites have been reported (SCCD 2005).
Native trout and salmon populations that were once documented in Hangman Creek
have decreased substantially as a result of dams, loss of habitat, and water quality
degradation. Corresponding with habitat degradation and temperature increases, more
tolerant fish species, such as sculpin and redside shiners, have apparently expanded
their distribution and increased their population (SCCD 2005).
4 SHORELINE INVENTORY
4.1 Inventory Data Sources, Assumptions and Data Gaps
Development of a shoreline inventory is intended to record the existing or baseline
conditions upon which the development of SMP provisions will be examined to ensure
the adopted regulations provide no net loss of shoreline ecological functions. At a
minimum, local jurisdictions shall gather the inventory elements listed in the
Guidelines, to the extent information is relevant and readily available. Given the nature
of the rural County, the Cities other than Pullman are generally managed by a very
small staff, typically a clerk and a couple of public works personnel. The ability of these
small towns to provide information that supports mapping and analysis is limited.
Collected information principally included Watershed Resource Inventory Area (WRIA)
and other basin documents, Whitman County studies, scientific literature, aerial
photographs, and Geographic Information Systems (GIS) data from a variety of data
providers.
Appendix C identifies the data sources used in the development of each of the Map
Folio elements. The table in Appendix C also describes the information collected for
each of the required inventory elements. Map figures are provided in the Map Folio
(Appendix B), and they depict the various inventory pieces listed in the table, as well as
additional analysis. Data gaps and limitations are discussed further in Appendix C. The

The Watershed Company/BERK August 2014
21
Guidelines do not require generation of new information or mapping to fill identified
data gaps.
4.1.1 Ecological Characterization
The following discussion identifies assumptions and limitations for each of the
inventory elements, and may provide a brief Countywide or watershed-wide narrative
where qualitative descriptions provide more information than quantitative measures.
Despite data gaps and limitations, a substantial quantity of information is available for
the shorelines of Whitman County to aid in the development of the inventory and
analysis report, as well as the updated SMP(s).
Land Cover (Vegetation)
The data was generated using multi-spectral satellite imagery with 30x30-meter cell
resolution. Spectral data was classified using Multi-Resolution Land Characteristics
(MRLC) Consortium, National Land Cover (NLC) Database. Because each cell
represents 900 square meters, the classification may over or under represent coverage
when the type of coverage within cells is mixed. The spatial resolution of the NLC data
provides a good foundation for broad scale assessment of land cover, including
vegetation coverage. Its utility is higher in rural areas where vegetative cover is more
uniform over broad areas compared to more developed towns and cities.
Because the data is based on interpretation of multi-spectral imagery, classification of
some data may be inaccurate. Most notably, shrub steppe vegetation on steeper slopes
is frequently miscategorized as “cultivated crops” using the NLC model. So long as the
inherent inaccuracies of the data are recognized, the NLC data provides a good broad-
scale assessment of vegetation coverage.
Finally, because the ordinary high water mark changes over time, water is occasionally
included within the total shoreline area used for the calculation of vegetation coverage.
For this reason, any area identified as “Water” was excluded from the calculation of
percent coverage.
Impervious Surfaces
Similar to the vegetation coverage data, impervious surface data was generated using
MRLC Consortium NLC data (2006) of multispectral satellite imagery with 30x30-meter
cell resolution. National Land Cover categories that apply to areas of higher impervious
surface coverage include Developed- Low, Medium, and High Intensity categories. The
same limitation as the vegetation coverage data apply to impervious surfaces. With

Final Whitman County Coalition Shoreline Analysis Report
22
these limitations in mind, a comparison of impervious surface coverage among reaches
provides useful information on broad scale spatial trends in development.
Wetlands
Wetland mapping was assembled from the National Wetlands Inventory (NWI) and
hydric soils data from USDA NRCS. Neither Whitman County nor the Cities have
completed a County or City-wide inventory of potential wetlands, and therefore the
NWI dataset along with hydric soils mapping was used as the most relevant and useful
information. The NWI dataset is based on many factors, including soil inventories and
aerial interpretations. Although it is very comprehensive and is fairly accurate in
approximating wetland locations, it is acknowledged that many wetlands, especially
small wetlands, are not identified by NWI and may not be indicated by hydric soils
mapping. Likewise, some areas identified as NWI wetlands or hydric soils may not
meet wetland criteria. Whether or not they are captured by this mapping effort and
included in the preliminary shoreline jurisdiction maps, actual wetland conditions that
may or may not be found on a site will determine shoreline jurisdiction (as a potential
shoreline-associated wetland) on a site-specific basis.
Soils
Soil data are derived from the Natural Resource Conservation Service (NRCS) national
soil survey. These data represent soils over broad areas; therefore, site-specific soil
characteristics may differ from what is mapped. Information on alluvial soil presence
and distribution was used to assess hyporheic functions.
Surficial Geology
Data on surficial geology are based on information from Washington DNR. The data is
based on broad-scale geologic classifications; therefore, site-specific characteristics may
differ. The map should not be used in place of site-specific studies.
Fish and Wildlife Habitat Conservation Areas
WDFW Priority Habitat and Species maps are presented as three separate units: Habitat
Regions (species or habitat ranges by area), Habitat Species (precise species locations);
and Fish (fish species presence).
These maps do not capture every priority species location or habitat in shoreline
jurisdiction, particularly rare species or species that use the water for foraging and
drinking, but that nest or den farther from the shoreline. Absence of mapping
information does not indicate that a particular species does not or could not utilize the
shoreline or adjacent lands. Furthermore, the number of documented species may

The Watershed Company/BERK August 2014
23
reflect the relative amount of past survey efforts rather than the presence or absence of
suitable habitat.
Frequently Flooded Areas
For all practical purposes, “frequently flooded areas” are those areas within the 100-year
floodplain. Floodplain and floodway maps were developed using FEMA’s Q3 map for
Whitman County.
Channel Migration Zone
Channel Migration Zone (CMZ) data is not available for shorelines within Whitman
County. For the purpose of this analysis report, the 100-year floodplain (FEMA’s Q3) is
being used as a proxy for the CMZ extent with the following conditions per WAC 173-
26-221(3)(b):
Where available data indicates areas separated from the active river channel by
legally existing artificial channel constraints that limit channel movement, those
areas are excluded from the channel migration zone.
All areas separated from the active channel by a legally existing artificial
structure(s) that is likely to restrain channel migration, including major
transportation facilities, built above or constructed to remain intact through the
one hundred-year flood, will not be considered to be in the channel migration
zone.
Additionally, a visual spot check of aerial photos was used to search for evidence of
historic migration outside the floodplain. Those areas would have been considered
within the CMZ; however, no such areas were identified within the subject area. In
general, this approach may slightly over-estimate the CMZ in flatter lowland areas and
slightly under-estimate the CMZ in higher-gradient areas through the Snake River
bluffs.
The CMZ map represents a graphical overlay of the different elements and does not
include field surveys or onsite data collection. Approvals for projects and permits
relying on these boundaries should include detailed assessments with stream surveys.
Geologically Hazardous Areas
Maps of geologically hazardous areas were developed by Washington Department of
Natural Resources. The data primarily focus on seismic hazards, and landslide hazard
data seems limited. Data on the distribution and location of steep slopes within the

Final Whitman County Coalition Shoreline Analysis Report
24
proposed shoreline jurisdiction was not available, and this represents a data gap. Steep
slopes should be evaluated for landslide hazard potential on a site and project specific
basis.
The presence of geologically hazardous areas in shorelines can be a factor in
determining suitability of the area for certain activities, including restoration and
development. Human safety is an important concern for development in geologically
hazardous areas. In addition, geologically hazardous areas can be important sources of
large woody debris and sediment to the aquatic system, the latter to the benefit or
detriment of aquatic life.
Water Quality
As a requirement of Section 303(d) of the federal Clean Water Act that all waterbodies be
“fishable and swimmable,” Ecology classifies waterbodies into five categories:
Category 1: Meets tested standards,
Category 2: Waters of concern,
Category 3: No data,
Category 4: polluted waters that either have or do not require a TMDL, and
Category 5: polluted waters requiring a TMDL.
Individual waterbodies are assigned to particular “beneficial uses” (public water supply;
protection for fish, shellfish, and wildlife; recreational, agricultural, industrial,
navigational and aesthetic purposes). Waterbodies must meet certain numeric and
narrative water quality criteria established to protect each of those established beneficial
uses. Waterbodies may provide more than one beneficial use, and may have different
levels of compliance with different criteria for those beneficial uses in different segments
of the stream or lake. As a result, many waterbodies may be on the 303(d) list for more
than one parameter in multiple locations.
As presented in the Water Quality map of Appendix B, only Category 4 and 5 waters are
depicted. For more information on specific waterbodies and their water quality
classifications, Ecology provides an interactive on-line viewer at the following website:
http://apps.ecy.wa.gov/wqawa2008/viewer.htm.

The Watershed Company/BERK August 2014
25
Shoreline Modifications
Shoreline modifications are human-caused alterations to the natural water’s edge. The
most common types of shoreline modifications include overwater structures and
shoreline armoring.
The Washington Department of Natural Resources has digitized piers and other in-
water structures such as boatlifts, boathouses, and moorage covers. However, this
dataset does not differentiate between each of these various types of overwater
structures. Thus, reporting of overwater cover is usually an overstatement when
assessing just piers, docks, and floats. Although not technically overwater structures,
boat ramps are also reported in the inventory.
Levees were mapped based on data from the Department of Ecology. Countywide data
were not available for shoreline stabilization, including rip rap armoring and dikes. A
visual assessment of shoreline stabilization using aerial photography was incorporated
into the analysis of ecological functions. This visual assessment is likely to
underestimate the extent of armoring and diked areas.
Critical Aquifer Recharge Areas
Critical aquifer recharge area data was not available. This is a data gap in this analysis.
4.1.2 Land Use Characterization
This shoreline inventory reviews current land use, zoning, and ownership within
shoreline jurisdiction, and land use plans, where available. The ultimate purpose is to
provide a basis to establish a compatible use pattern over the 20-year planning period of
the SMP and to identify current or planned preferred or water-oriented uses in shoreline
jurisdiction that should be protected or promoted to meet SMA goals for water-oriented
uses, shoreline access, and ecological protection.
The SMA promotes the following use preferences (RCW 90.58.020) for Shorelines of
Statewide Significance (identified in Section 1.2) in the stated order:
1. Recognize and protect the statewide interest over local interest;
2. Preserve the natural character of the shoreline;
3. Result in long term over short term benefit;
4. Protect the resources and ecology of the shoreline;

Final Whitman County Coalition Shoreline Analysis Report
26
5. Increase public access to publicly owned areas of the shorelines;
6. Increase recreational opportunities for the public in the shoreline; and
7. Provide for any other element as defined in RCW 90.58.100 deemed appropriate or
necessary.
In addition, the following use preferences apply within shoreline jurisdiction in the
following order [from WAC 173-26-201(2)(d)]:
1. Reserve appropriate areas for protecting and restoring ecological functions to control
pollution and prevent damage to the natural environment and public health. In
reserving areas, local governments should consider areas that are ecologically intact
from the uplands through the aquatic zone of the area, aquatic areas that adjoin
permanently protected uplands, and tidelands in public ownership. Local
governments should ensure that these areas are reserved consistent with
constitutional limits.
2. Reserve shoreline areas for water-dependent and associated water-related uses.
Harbor areas, established pursuant to Article XV of the state Constitution, and other
areas that have reasonable commercial navigational accessibility and necessary
support facilities, such as transportation and utilities, should be reserved for water-
dependent and water-related uses that are associated with commercial navigation
unless the local governments can demonstrate that adequate shoreline is reserved for
future water-dependent and water-related uses and unless protection of the existing
natural resource values of such areas preclude such uses. Local governments may
prepare master program provisions to allow mixed-use developments that include
and support water-dependent uses and address specific conditions that affect water-
dependent uses.
3. Reserve shoreline areas for other water-related and water-enjoyment uses that are
compatible with ecological protection and restoration objectives.
4. Locate single-family residential uses where they are appropriate and can be
developed without significant impact to ecological functions or displacement of
water-dependent uses.
5. Limit nonwater-oriented uses to those locations where the above described uses are
inappropriate or where nonwater-oriented uses demonstrably contribute to the
objectives of the Shoreline Management Act.

The Watershed Company/BERK August 2014
27
Current Land Use
Existing land use provides a baseline for types of land use and land use patterns found
within shoreline jurisdiction. Existing land use data was obtained from the Washington
State department of Ecology and the Whitman County Assessor, and then overlaid on
Map Folio maps for current land use, land ownership patterns, and aerial images. These
data sources may not be updated frequently, but they are the best sources for a County-
wide land use analysis. The predominant shoreline land use pattern across all shoreline
jurisdiction in Whitman County is agriculture with the exception of the port industrial
sites that are zoned Heavy Industrial. Within the Cities and Towns, commercial,
residential and industrial uses are present.
Water Oriented Use
According to Ecology’s SMP Guidelines (WAC 173-26-020), “water-oriented use means a
use that is water-dependent, water-related, or water-enjoyment, or a combination of
such uses.” The Shoreline Management Act promotes uses that are “unique to or
dependent upon use of the state's shoreline,” as well as “ports, shoreline recreational
uses including but not limited to parks, marinas, piers, and other improvements
facilitating public access to shorelines of the state, industrial and commercial
developments which are particularly dependent on their location on or use of the
shorelines of the state and other development that will provide an opportunity for
substantial numbers of the people to enjoy the shorelines of the state.” (RCW 90.58.020)
Definitions and examples of water-oriented uses are included in Table 4-1 below.
Table 4-1. Water-Oriented Uses Definitions and Examples.
Water-Oriented Use Definitions Examples "Water-dependent use" means a use or portion of a use which cannot exist in a location that is not adjacent to the water and which is dependent on the water by reason of the intrinsic nature of its operations. (WAC 173-26-020(39))
Examples of water-dependent uses may include ship cargo terminal loading areas, ferry and passenger terminals, barge loading facilities, ship building and dry docking, marinas, aquaculture, irrigation diversions, float plane facilities and sewer outfalls.
"Water-related use" means a use or portion of a use which is not intrinsically dependent on a waterfront location but whose economic viability is dependent upon a waterfront location because: (a) The use has a functional requirement for a
waterfront location such as the arrival or shipment of materials by water or the need for large quantities of water; or
(b) The use provides a necessary service supportive of the water-dependent uses and the proximity of the use to its customers makes its services less
Examples of water-related uses may include warehousing of goods transported by water, seafood processing plants, hydroelectric generating plants, gravel storage when transported by barge, oil refineries where transport is by tanker, log storage, and potentially agriculture and agriculturally related water transportation systems.

Final Whitman County Coalition Shoreline Analysis Report
28
Water-Oriented Use Definitions Examples expensive and/or more convenient. (WAC 173-26-020(43))
"Water-enjoyment use" means a recreational use or other use that facilitates public access to the shoreline as a primary characteristic of the use; or a use that provides for recreational use or aesthetic enjoyment of the shoreline for a substantial number of people as a general characteristic of the use and which through location, design, and operation ensures the public's ability to enjoy the physical and aesthetic qualities of the shoreline. In order to qualify as a water-enjoyment use, the use must be open to the general public and the shoreline-oriented space within the project must be devoted to the specific aspects of the use that fosters shoreline enjoyment. (WAC 173-26-020(40))
Primary water-enjoyment uses may include, but are not limited to, parks, piers and other improvements facilitating public access to the shorelines of the state; and general water-enjoyment uses may include, but are not limited to, restaurants (where views or other features allowing significant public access are provided), museums, aquariums, scientific/ecological reserves, and resorts/hotels (as part of mixed-use development or with significant public access or restoration components), and commercial/office as part of a mixed-use development.
Water-oriented uses were identified through review of land use data, as well as other
inventory data sources such as public access and shoreline modification data.
Transportation and Utility Infrastructure
There are several County, state and federal highway road sections and railroad corridors
in Whitman County that either parallel, cross or are otherwise located in existing or
future shoreline jurisdiction. Road densities are highest in the eastern portion of the
County near the Cities and Towns. Railroads are prevalent throughout the County to
support the County’s agricultural industry.
Utility infrastructure, such as water, wastewater, electrical, communication, and other
facilities, is found throughout the County as well, although data on each is not readily
available in all cases. Utility infrastructure has a higher prevalence in populated areas of
the County. More information about transportation and utility infrastructure by
waterbody is found in Chapter 6.
Existing and Potential Public Access
The waterbodies of Whitman County are accessed at federal, state, and County parks
and trails, though there are gaps in the network, which are the subject of parks and
recreation plans. Information about Whitman County shoreline public access facilities
and potential opportunities was obtained from land use data, review of County and City
documents, and review of aerial photographs. Notable sources included the Whitman
County Comprehensive Parks Plan (2008), as well as Comprehensive Plans from
Pullman, Colfax and Palouse.
The Watershed Company/BERK August 2014
29
Historical or Archaeological Sites
Shorelines are typical places for ancient and historic human settlement and use. Data
gathered from the Department of Archaeology and Historic Preservation was used to
identify any listed sites.
Future Land Use
Whitman County is not a GMA County. As a result, the communities within the County
are not required to maintain updated future land use maps. Because of this, data on
future land use patterns was limited. In order to identify potential future land uses,
general growth trends in the County were analyzed to understand potential demand for
private development. Undeveloped lands were analyzed to identify if they existed
within areas of recent growth. City and County plans were reviewed to identify
planned projects or future recommended projects. Lastly, County and City staff were
contacted and asked to identify anticipated or potential new developments or uses in the
shoreline.
4.2 Reach Delineation
In order to assess shoreline functions at a local scale, each shoreline was broken into
discrete reaches based on political boundaries, and then a review of maps and aerial
photography. In most cases where the level of existing and potential future
development is very low, an entire lake may constitute a reach. Establishing political
boundaries as the first step in reach breaks enables discrete characterizations of each
City/Town and the County, and the single jointly planned urban growth area outside of
Pullman.
Land use (e.g., land use patterns, zoning, vegetation coverage, and shoreline
modifications) was weighted heavily in determining reach break locations because the
intensity and type of land use has affected and will affect shoreline ecological
conditions. Furthermore, functional analysis outcomes will be more relevant for future
determination of appropriate shoreline environment designations if the reach breaks
occur at likely transition points in environment designations.
In addition to land use, physical drivers of shoreline processes were used to establish an
overall framework for determining reach break locations. The following criteria in the
following general order were used for determining reach break locations:
City and urban growth area boundaries
Changes in land use

Final Whitman County Coalition Shoreline Analysis Report
30
Changes in vegetation (coverage and type)
Shoreline modifications (levees, dikes, dams)
Significant wetland areas
Reach breaks were placed at parcel boundaries whenever feasible. In all of the above
criteria (except the city/UGA boundaries), reach breaks were made where fairly
significant changes were evident. For example, the presence of a couple of single-family
residences along a stretch of undeveloped shoreline would not necessitate creation of a
reach break to separate out those two different uses.
The following is a complete list of the 79 reaches initially created for this effort. A map
of shoreline reaches is included as Map 23 in Appendix B.
Table 4-2. Shoreline Reaches Used in Functional Analysis
Shoreline Reaches County
Lakes (each own reach) o Alkali Lake o Crooked Knee Lake o Duck Lake o Folsom Lake
o Lavista Lake o Rock Lake o Snyder Slough o Stevens Lake
o Texas Lake o Tule Lake o Bonnie Lake o Sheep Lake
Hangman Creek 1. Hangman Creek-Agriculture
Pine Creek 1. Pine Creek-Agriculture 2. Pine Creek-Waste Water Treatment Lagoons 3. Pine Creek-Scrub/Shrub
Cottonwood Creek 1. Cottonwood Creek-Agriculture 2. Cottonwood Creek-PAW
Palouse River 1. Palouse River-Confluence with Snake 2. Palouse River-Cliffs 3. Palouse River-Canyon 4. Palouse River-Palouse Falls State Park 5. Palouse River- Agriculture 6. Palouse River-Western Palouse 7. Palouse River- Meanders 8. Palouse River- County Industrial 9. Palouse River- Open Space 10. North Fork Palouse River- Agriculture
South Fork Palouse River 1. South Fork Palouse- South Fork River Road 2. South Fork Palouse-Agriculture 3. South Fork Palouse-Agriculture/Residential

The Watershed Company/BERK August 2014
31
Shoreline Reaches 4. South Fork Palouse-Commercial 5. South Fork Palouse- Pullman UGA
Snake River 1. Snake River- Cliffs 2. Snake River- Railroad 3. Snake River- Parks/Open Space 4. Snake River- Industrial 5. Snake River- Steptoe Canyon
Rock Creek 1. Rock Creek- Agriculture 2. Rock Creek- Escure Ranch 3. Rock Creek- Imbler Creek 4. Rock Creek- Cottonwood Confluence/PAW 5. Rock Creek- Lake Outlet 6. Rock Creek- Pine Creek Confluence
Union Flat Creek 1. Union Flat Creek- Scablands 2. Union Flat Creek- Agriculture 3. Union Flat Creek- Agriculture Riparian
Cities
Albion - South Fork Palouse River 1. Albion, Industrial 2. Albion, Agriculture 3. Albion, Residential
Colfax Palouse River
1. Colfax, Industrial/Commercial 2. Colfax, Scrub/shrub/PAW 3. Colfax, Residential 4. Colfax, Agriculture 5. Colfax, Parks
South Fork Palouse River 1. Colfax, Flume/Commercial 2. Colfax, Flume/Residential 3. Colfax, Flume/Undeveloped 4. Colfax, Open Space
Malden - Pine Creek 1. Malden
Pullman - South Fork Palouse River 1. Pullman, Industrial 2. Pullman, Parks 3. Pullman, Commercial/Business District 4. Pullman, South Commercial 5. Pullman, Residential
Palouse - Palouse River 1. City of Palouse, Agriculture 2. City of Palouse, Industrial

Final Whitman County Coalition Shoreline Analysis Report
32
Shoreline Reaches 3. City of Palouse, Residential 4. City of Palouse, Commercial 5. City of Palouse, Open Space
Rosalia - Pine Creek 1. Rosalia, Airport 2. Rosalia, Agriculture 3. Rosalia, Residential/Open Space 4. Rosalia, City Park
Tekoa - Hangman Creek 1. Tekoa, Rural Residential 2. Tekoa, Urban Residential/Commercial 3. Tekoa, Open Space 4. Tekoa, Floodway
4.3 Summary of Shoreline Inventory Results
In order to assess shoreline conditions and functions at a local scale, each shoreline
waterbody’s jurisdictional area was broken into discrete segments known as reaches (see
Section 4.2 above for a description of how the reaches were determined). Appendix D
expands upon the relevant required inventory elements, providing specific detail and
data for each reach. Unless otherwise noted, the results reported in Appendix D
consider only information available within the boundaries of shoreline jurisdiction of
each reach.
5 ANALYSIS OF ECOLOGICAL FUNCTIONS
5.1 Approach, Rationale and Limitations of Functional Analysis
A GIS-based semi-quantitative method was developed to characterize the relative
performance of relevant ecological processes and functions by shoreline reach, as
outlined in WAC 173-26-201(3)(d)(i). The assessment used the available information
gathered as part of the shoreline inventory and applied a standardized ranking criterion
for each independent shoreline reach to provide a consistent methodological treatment
among reaches. These semi-quantitative results will ensure consistent and well-
documented treatment of all reaches when assessing existing ecological conditions, yet
allow for a qualitative evaluation of functions for data that are not easily summarized by
GIS data alone. The results are intended to complement the inventory information in
Chapter 4 and provide a comparison of watershed functions relative to other reaches in

The Watershed Company/BERK August 2014
33
the County. Analysis scores and descriptions are accompanied by photographs taken
during site visits or aerial images from Google Earth (Google, electronic reference).
5.1.1 Functions and Impairments
The analysis of reach functions was based on the Department of Ecology’s list of
processes and functions for freshwater lakes and streams (WAC 173-26-201(3)(d)(i)(C)).
The list includes the evaluation of three major processes: 1) hydrologic; 2) vegetative;
and 3) habitat.
Table 5-1. Ecological processes and functions used to evaluate shoreline reaches.
Lake Processes and Functions Stream Processes and Functions 1. Hydrologic Functions Storing water and sediment Attenuating wave energy Removing excess nutrients and
toxic compounds Recruitment of large woody
debris (LWD) and other organic material
1. Hydrologic Functions Storing water and sediment Moderating erosion processes and the transport of water
and sediment Attenuating flow energy Developing pools, riffles, and gravel bars Removing excess nutrients and toxic compounds Recruitment of LWD and other organic material
2. Vegetative Functions Temperature regulation Water quality improvement Attenuating wave energy Sediment removal and bank
stabilization LWD and organic matter
recruitment
2. Vegetative Functions Temperature regulation Water quality improvement Slowing riverbank erosion; bank stabilization Attenuating of flow energy Sediment removal Provision of LWD and organic matter
3. Habitat Functions Physical space and conditions
for life history Food production and delivery
3. Habitat Functions Physical space (upland and aquatic, including migration
corridors) and conditions for life history Food production and delivery 4. Hyporheic Functions Removing excess nutrients and toxic compounds Water storage and maintenance of base flows Support of vegetation Sediment storage
Based on data availability, these functions were further broken down into those most
meaningful for the purposes of this analysis. The available information gathered
County-wide in the Shoreline Inventory Map Folio (Appendix B) was used to determine
the performance of these functions (High, Moderate, or Low) (Tables 5-3 and 5-4).
Metrics were developed based on best professional judgment related to known impacts
of different parameters and the data available. Rankings were developed for each

Final Whitman County Coalition Shoreline Analysis Report
34
function based on the distribution of conditions within the County or City for each
waterbody, so that each ranking provides a relative measure of functions compared to
other reaches in the waterbody and local jurisdiction.
Table 5-2 provides a description of the significance of each function, and how each
function may be affected by human alterations. It should be noted that alterations to
watershed-wide processes (e.g., flow regulation) affect functions throughout all reaches
of each river. Since the purpose of this analysis is to differentiate between levels of
function and anthropogenic alterations, the effects of these watershed-wide impairments
are addressed in Table 5-2, and not incorporated into the scoring of each reach.
Scoring of functions was done separately for the reaches within each local jurisdiction
and within each waterbody in order for the range of scores for reaches to represent the
range of relative functions of each reach compared to other reaches in both the same
river and within the same local jurisdiction. For example, the levees within the City of
Colfax lower many of the functions of the South Fork Palouse River through the City.
These reaches were scored and ranked relative to one another in order to represent a
more accurate range of functions within the City’s shorelines, and differentiate between
varying levels of function despite the overall functional impairment due to the levees.
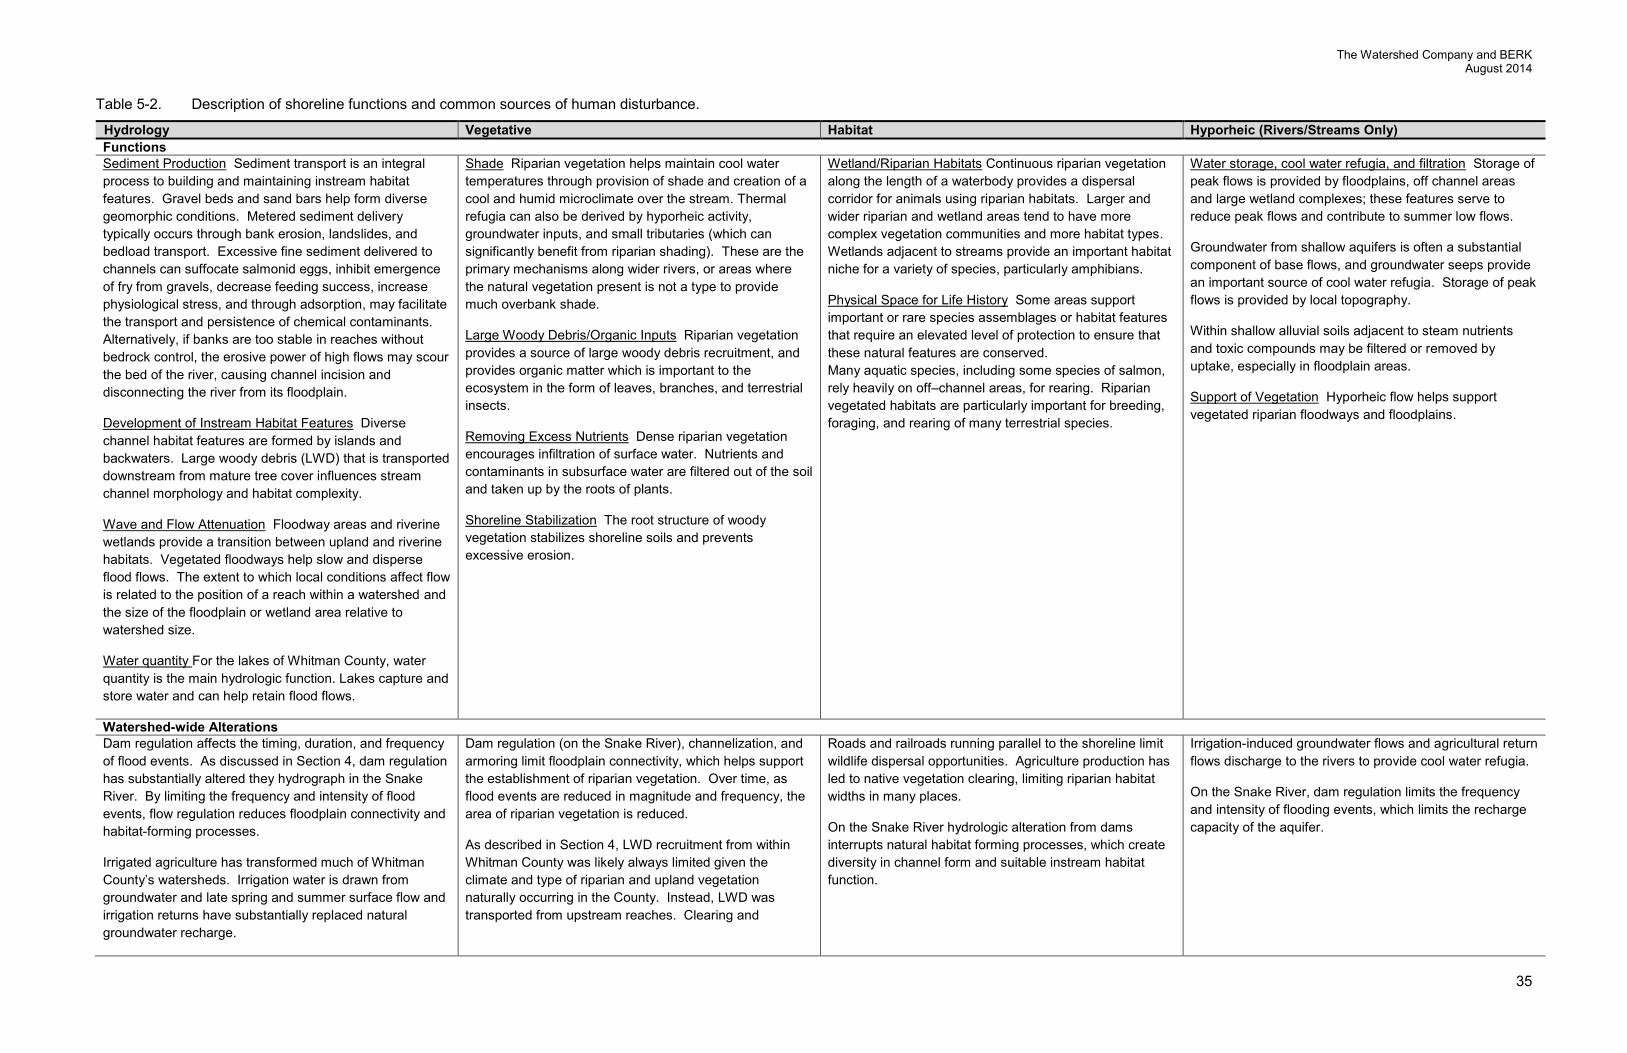
The Watershed Company and BERK August 2014
35
Table 5-2. Description of shoreline functions and common sources of human disturbance.
Hydrology Vegetative Habitat Hyporheic (Rivers/Streams Only) Functions Sediment Production Sediment transport is an integral process to building and maintaining instream habitat features. Gravel beds and sand bars help form diverse geomorphic conditions. Metered sediment delivery typically occurs through bank erosion, landslides, and bedload transport. Excessive fine sediment delivered to channels can suffocate salmonid eggs, inhibit emergence of fry from gravels, decrease feeding success, increase physiological stress, and through adsorption, may facilitate the transport and persistence of chemical contaminants. Alternatively, if banks are too stable in reaches without bedrock control, the erosive power of high flows may scour the bed of the river, causing channel incision and disconnecting the river from its floodplain.
Development of Instream Habitat Features Diverse channel habitat features are formed by islands and backwaters. Large woody debris (LWD) that is transported downstream from mature tree cover influences stream channel morphology and habitat complexity.
Wave and Flow Attenuation Floodway areas and riverine wetlands provide a transition between upland and riverine habitats. Vegetated floodways help slow and disperse flood flows. The extent to which local conditions affect flow is related to the position of a reach within a watershed and the size of the floodplain or wetland area relative to watershed size.
Water quantity For the lakes of Whitman County, water quantity is the main hydrologic function. Lakes capture and store water and can help retain flood flows.
Shade Riparian vegetation helps maintain cool water temperatures through provision of shade and creation of a cool and humid microclimate over the stream. Thermal refugia can also be derived by hyporheic activity, groundwater inputs, and small tributaries (which can significantly benefit from riparian shading). These are the primary mechanisms along wider rivers, or areas where the natural vegetation present is not a type to provide much overbank shade.
Large Woody Debris/Organic Inputs Riparian vegetation provides a source of large woody debris recruitment, and provides organic matter which is important to the ecosystem in the form of leaves, branches, and terrestrial insects.
Removing Excess Nutrients Dense riparian vegetation encourages infiltration of surface water. Nutrients and contaminants in subsurface water are filtered out of the soil and taken up by the roots of plants.
Shoreline Stabilization The root structure of woody vegetation stabilizes shoreline soils and prevents excessive erosion.
Wetland/Riparian Habitats Continuous riparian vegetation along the length of a waterbody provides a dispersal corridor for animals using riparian habitats. Larger and wider riparian and wetland areas tend to have more complex vegetation communities and more habitat types. Wetlands adjacent to streams provide an important habitat niche for a variety of species, particularly amphibians.
Physical Space for Life History Some areas support important or rare species assemblages or habitat features that require an elevated level of protection to ensure that these natural features are conserved. Many aquatic species, including some species of salmon, rely heavily on off–channel areas, for rearing. Riparian vegetated habitats are particularly important for breeding, foraging, and rearing of many terrestrial species.
Water storage, cool water refugia, and filtration Storage of peak flows is provided by floodplains, off channel areas and large wetland complexes; these features serve to reduce peak flows and contribute to summer low flows.
Groundwater from shallow aquifers is often a substantial component of base flows, and groundwater seeps provide an important source of cool water refugia. Storage of peak flows is provided by local topography.
Within shallow alluvial soils adjacent to steam nutrients and toxic compounds may be filtered or removed by uptake, especially in floodplain areas.
Support of Vegetation Hyporheic flow helps support vegetated riparian floodways and floodplains.
Watershed-wide Alterations Dam regulation affects the timing, duration, and frequency of flood events. As discussed in Section 4, dam regulation has substantially altered they hydrograph in the Snake River. By limiting the frequency and intensity of flood events, flow regulation reduces floodplain connectivity and habitat-forming processes.
Irrigated agriculture has transformed much of Whitman County’s watersheds. Irrigation water is drawn from groundwater and late spring and summer surface flow and irrigation returns have substantially replaced natural groundwater recharge.
Dam regulation (on the Snake River), channelization, and armoring limit floodplain connectivity, which helps support the establishment of riparian vegetation. Over time, as flood events are reduced in magnitude and frequency, the area of riparian vegetation is reduced.
As described in Section 4, LWD recruitment from within Whitman County was likely always limited given the climate and type of riparian and upland vegetation naturally occurring in the County. Instead, LWD was transported from upstream reaches. Clearing and
Roads and railroads running parallel to the shoreline limit wildlife dispersal opportunities. Agriculture production has led to native vegetation clearing, limiting riparian habitat widths in many places.
On the Snake River hydrologic alteration from dams interrupts natural habitat forming processes, which create diversity in channel form and suitable instream habitat function.
Irrigation-induced groundwater flows and agricultural return flows discharge to the rivers to provide cool water refugia.
On the Snake River, dam regulation limits the frequency and intensity of flooding events, which limits the recharge capacity of the aquifer.

FINAL Whitman County Coalition Shoreline Analysis Report
36
Hydrology Vegetative Habitat Hyporheic (Rivers/Streams Only) development in the upper watersheds has limited recruitment of LWD to Whitman County shoreline reaches.
Localized Alterations Armored shorelines prevent natural erosion and sediment delivery processes. Shoreline armoring can limit floodway interactions, accelerate streamflow along the bank, and contributing to erosion of adjacent properties.
Loss of mature native vegetation and wetlands affects the timing, rate, magnitude, and duration of stream flows. An increase in impervious surfaces results in increased frequency and intensity of flooding. Changes in flow volume or frequency can alter channel morphology and the sediment balance of the stream.
In addition to watershed scale effects, irrigation withdrawals can have localized effects on stream flow. The effect of withdrawals on stream flow may depend on the withdrawal rate, as well as the local groundwater interchange (i.e. if the reach is a gaining or losing reach).
Clearing and grading for development often results in the removal of significant vegetation. Impervious surfaces related to roadways, driveways and parking areas tend to produce hydrocarbon pollutants and heavy metals. Depending on management activities, even pervious surfaces such as lawns and pastures can substantially increase nutrients from fertilizers and pollutants and toxins through herbicides and pesticides.
Armored shorelines can isolate the river from potential sources of organic matter and eliminate filtration potential.
Historic draining, ditching, and fill of wetlands for agriculture and development have reduced the availability of suitable habitat for aquatic and terrestrial species.
In water structures interrupt the longitudinal flow of sediment and alter habitat associations.
Impervious surfaces reduce infiltration, increasing surface flows. The net result is a reduction in shallow groundwater and hyporheic flows capable of maintaining summer low flows in streams and rivers.
Levees that limit channel migration and floodplain area also restrict hyporheic activity.

The Watershed Company and BERK August 2014
37
Table 5-3. Functional score ranking criteria for streams and rivers.1
Process/Function High Moderate Low H
ydro
logi
c
Moderation of sediment transport
No armoring or dams present within the reach
AND If present, creek mouths present with
natural deltas
Steep slopes present, but well-vegetated or not developed
AND Limited armoring present
Steep slopes present with development
OR Majority of the reach is armored2
Development/ maintenance of in-stream
habitat features
Backwater areas, islands, and/or wetlands occupy >60% of the reach
Backwater areas, islands, and/or wetlands occupy 20-60% of the reach
Backwater areas, islands, and/or wetlands occupy <20% of the reach
Attenuation of flow energy
Majority of the reach is not armored or protected by levees
AND Floodplain >70% of area or floodway
>5% of the area
Majority of the reach is not armored or protected by levees
AND Floodplain 60-70% of area or
floodway is present, but less than 5%
Levees present OR Majority of the reach is armored OR Floodplain area <60% of total area
Vege
tativ
e
LWD and organic matter
recruitment
Forest, shrub, or wetland vegetation >80% of area within the reach
AND No armoring or structures separate
vegetation from the water’s edge.
Forest, shrub, or wetland vegetation 40-80% of area within the reach
OR A portion of the vegetation isolated
from the water’s edge by armoring or other structures
Forest, shrub, or wetland vegetation <40% of area within the reach
OR Vegetation is separated from the
shoreline by armoring and other structures
Filtration of upland inputs
A broad band of dense vegetation separates uplands from the river
A narrow band of dense vegetation or a broad band of sparse vegetation separates uplands from the river
No vegetation along the shoreline OR A narrow band of sparse vegetation
separates uplands from the river
Bank stabilization
Riparian trees and shrubs stabilize the banks in the majority of the reach
Riparian trees and shrubs are sparsely present along the shoreline
OR A portion of the shoreline is armored
The majority of the reach is armored
Hab
itat Wetland/
riparian habitat
Wetland area >60% of total area OR A broad band of dense riparian
vegetation is present
Wetland area 20-60% of total area OR Limited areas of dense riparian
vegetation are present
Wetland area <20% of total area AND Dense riparian vegetation is absent

FINAL Whitman County Coalition Shoreline Analysis Report
38
Process/Function High Moderate Low
Space and conditions supporting
wildlife, including
PHS species
Two PHS regions > 50% of area OR Four or more different PHS regions
present OR Significant wetland, riparian, or
unique habitat features are present and corridors between habitats are free from roads and other development
Significant wetland, riparian, or unique habitat features are present within the reach, but the corridors between habitats are impaired by development
Significant wetland, riparian, or unique habitat features are absent of significantly degraded
Hyp
orhe
ic
Water storage and
filtration
Riverine wetlands are present AND Armoring does not isolate the
wetland from the mainstem channel
Banks of the river are moderately sloped
AND The majority of the banks are not
armored
Banks slope steeply up from the River
OR The majority of the banks are
armored
Support of vegetation
Large, riverine wetlands occur within the reach
OR Alluvial soils comprise over 65% of
the reach
River banks support moderate density of scrub or forested vegetation
AND Alluvial soils comprise 10-65% of
the reach
Banks of the river support little, if any, vegetation
OR Alluvial soils comprise under 10% of
the reach
1. For City/Town shorelines, the numeric thresholds were not used to distinguish between high, moderate, and low levels of function. Rather, best professional judgment was applied to allow for more meaningful differentiation between reach scores, relative to the range of conditions present within each local jurisdiction (see Section 5.3) 2. For purposes of this scoring, armoring includes both artificial structures and similarly functioning naturally occurring features such as bedrock

The Watershed Company and BERK August 2014
39
Table 5-4. Functional score ranking criteria for lakes
Process/Function High Moderate Low H
ydro
logi
c
Storage of sediment and
water
Water quantity function is the primary hydrologic function occurring in all of the lakes. All lakes have the capacity for providing water and sediment storage and are given a “high” score for this function.
Vege
tativ
e
LWD and organic matter
recruitment
Forest, shrub, or wetland vegetation >80% of area within the reach
AND No armoring or structures separate
vegetation from the water’s edge.
Forest, shrub, or wetland vegetation 40-80% of area within the reach
OR A portion of the vegetation isolated
from the water’s edge by armoring or other structures
Forest, shrub, or wetland vegetation <40% of area within the reach
OR Vegetation is separated from the
shoreline by armoring and other structures
Filtration of upland inputs
A broad band of dense vegetation separates uplands from the river
A narrow band of dense vegetation or a broad band of sparse vegetation separates uplands from the river
No vegetation along the shoreline OR A narrow band of sparse vegetation
separates uplands from the river
Bank stabilization
Riparian trees and shrubs stabilize the banks in the majority of the reach
Riparian trees and shrubs are sparsely present along the shoreline
OR A portion of the shoreline is armored
The majority of the reach is armored
Hab
itat
Wetland/ riparian habitat
Wetland area >60% of total area OR A broad band of dense riparian
vegetation is present
Wetland area 20-60% of total area OR Limited areas of dense riparian
vegetation are present
Wetland area <20% of total area AND Dense riparian vegetation is absent
Space and conditions supporting
wildlife, including
PHS species
Two PHS regions> 50% of area OR Four or more different PHS regions
present OR Significant wetland, riparian, or
unique habitat features are present and corridors between habitats are free from roads and other development
Significant wetland, riparian, or unique habitat features are present within the reach, but the corridors between habitats are impaired by development
Significant wetland, riparian, or unique habitat features are absent of significantly degraded

Final Whitman County Coalition Shoreline Analysis Report
40
For purposes of ranking the relative function of each reach within the County and
assisting with later development of the Restoration Plan, the descriptive ratings were
assigned a value of 1 through 3, with 1 representing low function and 3 representing
high function.
5.1.2 Limitations
This evaluation was limited by the quality and availability of inventory data. Therefore,
limitations presented in Appendix C also apply to this evaluation.
In evaluating shoreline functions, the area of shoreline impacts and conditions assessed
was generally limited to the area of shoreline jurisdiction. In many cases, shoreline
impacts may occur at a site due to ecological and geomorphological processes that are
disturbed at a remote site upstream, further inland, or up-current. This evaluation
approach may not identify all of the functional responses occurring as a result of
impacts to nearby or remote areas.
The approach was limited to an evaluation of shoreline ecological potential, and it did
not integrate this potential with the opportunity to perform a given function based on
site-specific conditions. For example, the analysis assessed the ability of a shoreline to
store water, but it did not consider the frequency of flooding downstream and the
corresponding significance of such a function.
5.2 County Shoreline Results
The following sections summarize the results of the functional analysis for each
shoreline waterbody.
5.2.1 Lakes
There are twelve shoreline lakes present in Whitman County, all located in the
northwest portion of the County in the far western portion of the Palouse watershed
known as the Channeled Scablands. The level of existing and potential future
development surrounding the lakes is generally low. For this reason, and because of
fairly consistent conditions along each lake’s shoreline, each lake was kept as one
discrete reach for the purposes of this analysis. The shoreline lakes range from
approximately 34 acres (Duck Lake) to 367 acres (Rock Lake). Half of the lakes are
under 100 acres.
The Channeled Scablands is an area shaped by massive floods over the past million
years, which left behind exposed channels of the underlying basalt amongst islands of
loess (HDR and EES 2007). Many of the lakes are natural depressions with basalt

The Watershed Company and BERK August 2014
41
bottoms and no outlets (HDR and EES 2007). Various warm-water fish are found in
many of the lakes in the watershed and rainbow trout have been stocked in Rock Lake.
No anadromous salmonid use is documented.
The table below shows the functional scores for each lake for each of the four ecological
processes categories identified in Table 5-1. The following pages provide a summary of
the main functional attributes and impacts contributing to the scores for similarly
scoring groups of lakes.
Table 5-5. Functional scoring for shoreline lakes
Lake
Ran
k
Hydrologic Vegetative Habitat St
orag
e of
wat
er a
nd
sedi
men
t
LWD
and
org
anic
m
atte
r rec
ruitm
ent
Filtr
atio
n of
upl
and
inpu
ts
Ban
k st
abili
zatio
n
Wet
land
/ripa
rian
habi
tat
Spac
e an
d co
nditi
ons
supp
ortin
g w
ildlif
e
Lavista Lake 1 H H H M H H Tule Lake 2 H H H M M H Sheep Lake 3 H H M M H M Snyder Slough 3 H H M M H M Alkali Lake 3 H H M M M H Duck Lake 3 H H M M M H Stevens Lake 3 H M M M H H Bonnie Lake 4 H M M M M H Crooked Knee Lake 4 H H M M M M Folsom Lake 4 H H M M M M Texas Lake 5 H M M M M M Rock Lake 5 H M L M M H
Relative ranking order from highest to lowest function based on mean reach scores (L= Low function, M=Medium function, H= High function).

Final Whitman County Coalition Shoreline Analysis Report
42
Lavista Lake & Tule Lake
Process Function Notes
Hydrologic Storage of water and sediment
The Lavista Lake shoreline jurisdiction includes nearly 49 acres and Tule Lake includes approximately 32 acres. 74.1% of the Lavista Lake area and 55.4% of Tule Lake is mapped as wetland which further helps to store water and sediment.
Vegetation
LWD and organic matter recruitment
Evergreen forest makes up 46.3% of the shorelands land cover of Lavista Lake. Shrub/scrub, herbaceous and woody wetlands are also present. Emergent herbaceous wetlands, shrub/scrub and woody wetlands are each around 30% of the Tule Lake jurisdiction. A narrow band of dense vegetation is present along the shoreline helping to provide filtration function. Vegetation appears most dense along the shorelines of these two lakes compared to the other County lakes.
Filtration of upland inputs
Bank stabilization
Habitat
Wetland/riparian habitat
The John Wayne Pioneer Trail runs along the eastern edge of Lavista Lake shoreline jurisdiction. No other developed infrastructure is present which allows for good access for wildlife and undisturbed corridors between habitat types. Bald eagle and mule deer PHS regions cover nearly 100% of both jurisdictions. A high percentage of wetland and woody vegetation is also present compared to the other lakes.
Space and conditions supporting wildlife, including PHS species
Key Environmental or Land Use Factors Affecting Processes/Functions: Lavista Lake receives the highest functional ranking overall due mainly to the large area of associated wetland which helps provide filtration of upland inputs and high habitat values. Tule Lake has similar structure and function, but less wetland which decreases its wetland/riparian habitat score.
Image Source: Google Earth
Shoreline jurisdiction line
Lavista Lake

The Watershed Company and BERK August 2014
43
Sheep Lake & Snyder Slough
Process Function Notes
Hydrologic Storage of water and sediment
Sheep Lake and Snyder Slough are connected by a swath of potentially associated wetland and have similar characteristics and overall functional rankings compared to the other lakes. Both have wetland mapped over half of their jurisdiction providing further water and sediment storage functions in addition to their holding capacity. Floodplain is less than a quarter of each jurisdiction.
Vegetation
LWD and organic matter recruitment Emergent herbaceous wetlands and scrub/shrub vegetation
are the majority landcover types. Vegetation is naturally sparse along the shoreline edge.
Filtration of upland inputs
Bank stabilization
Habitat
Wetland/riparian habitat A road and railroad run through the Sheep Lake and Snyder Slough jurisdictions otherwise no development is present which allows for good access for wildlife and undisturbed corridors between habitat types. Several PHS habitat regions are mapped over these areas including prairies and steppe (both lakes), American white pelican and waterfowl concentrations (Sheep Lake).
Space and conditions supporting wildlife, including PHS species
Key Environmental or Land Use Factors Affecting Processes/Functions:
Existing and potential development pressure is limited and few modifications exist to the natural system. Impacts to these shorelines to these shorelines are mainly from a road and railroad.
Sheep Lake
Snyder Slough
Image Source: Google Earth

Final Whitman County Coalition Shoreline Analysis Report
44
Alkali Lake, Duck Lake & Stevens Lake
Process Function Notes
Hydrologic Storage of water and sediment
Shoreline jurisdiction of these lakes ranges from 34 acres (Duck Lake) to 134 acres (Stevens Lake), but all three have similar characteristics and overall functional rankings compared to the other lakes. Wetland is present over greater than 30% of each of the lake’s jurisdictional areas, providing further water and sediment storage functions in addition to their holding capacity.
Vegetation
LWD and organic matter recruitment
Herbaceous and scrub/shrub vegetation are the dominant land cover types. These lakes scored lower than the previous ones for filtration function due to more sparse and narrow areas of shoreline vegetation.
Filtration of upland inputs
Bank stabilization
Habitat
Wetland/riparian habitat Several PHS habitat regions are mapped over these areas including prairies and steppe, mule deer and bald eagle. Extensive wetland areas are also present, particularly associated with Stevens Lake. Few roads and no development are present providing good access for wildlife and undisturbed corridors between habitat types.
Space and conditions supporting wildlife, including PHS species
Key Environmental or Land Use Factors Affecting Processes/Functions:
Existing and potential development pressure is limited and few modifications exist to the natural system. Lower scores for vegetation functions are due to naturally sparse riparian areas.
Image Source: Google Earth
Duck Lake
Stevens Lake
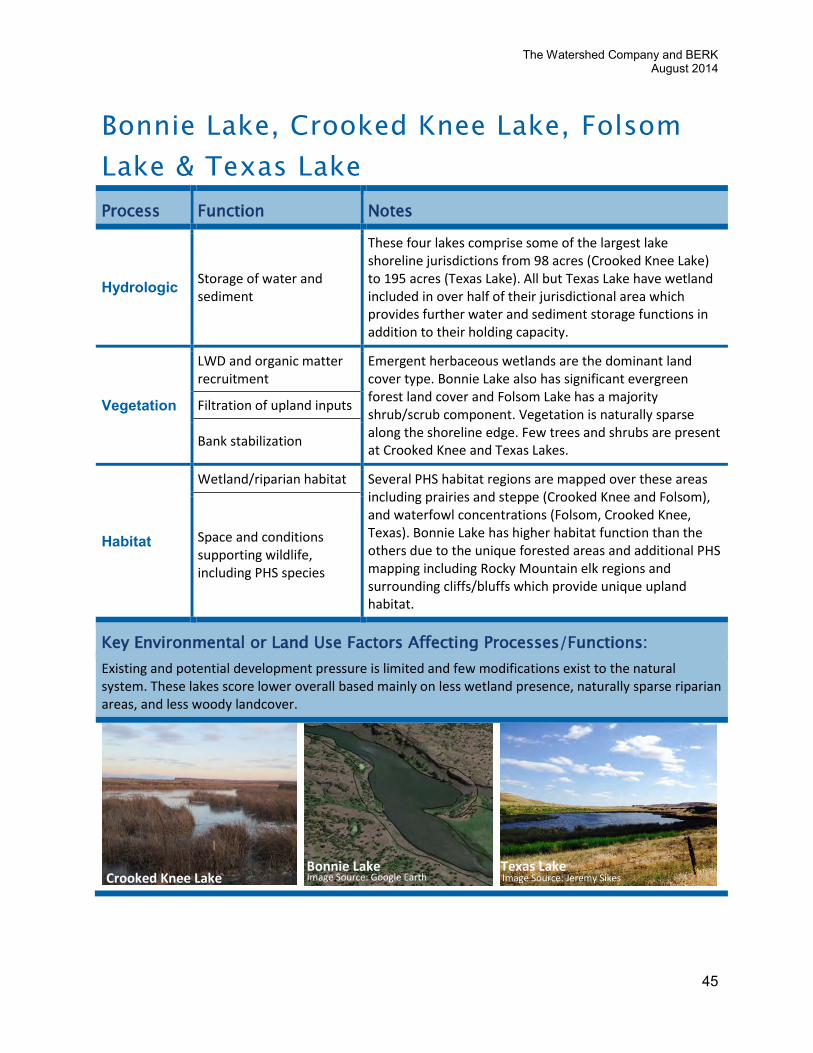
The Watershed Company and BERK August 2014
45
Bonnie Lake, Crooked Knee Lake, Folsom
Lake & Texas Lake
Process Function Notes
Hydrologic Storage of water and sediment
These four lakes comprise some of the largest lake shoreline jurisdictions from 98 acres (Crooked Knee Lake) to 195 acres (Texas Lake). All but Texas Lake have wetland included in over half of their jurisdictional area which provides further water and sediment storage functions in addition to their holding capacity.
Vegetation
LWD and organic matter recruitment
Emergent herbaceous wetlands are the dominant land cover type. Bonnie Lake also has significant evergreen forest land cover and Folsom Lake has a majority shrub/scrub component. Vegetation is naturally sparse along the shoreline edge. Few trees and shrubs are present at Crooked Knee and Texas Lakes.
Filtration of upland inputs
Bank stabilization
Habitat
Wetland/riparian habitat Several PHS habitat regions are mapped over these areas including prairies and steppe (Crooked Knee and Folsom), and waterfowl concentrations (Folsom, Crooked Knee, Texas). Bonnie Lake has higher habitat function than the others due to the unique forested areas and additional PHS mapping including Rocky Mountain elk regions and surrounding cliffs/bluffs which provide unique upland habitat.
Space and conditions supporting wildlife, including PHS species
Key Environmental or Land Use Factors Affecting Processes/Functions:
Existing and potential development pressure is limited and few modifications exist to the natural system. These lakes score lower overall based mainly on less wetland presence, naturally sparse riparian areas, and less woody landcover.
Crooked Knee Lake Bonnie Lake Image Source: Google Earth
Texas Lake Image Source: Jeremy Sikes

Final Whitman County Coalition Shoreline Analysis Report
46
Rock Lake
Process Function Notes
Hydrologic Storage of water and sediment
The Rock Lake shoreline jurisdiction includes nearly 467 acres, by far the largest of all the lakes. 13.5% of the area is mapped as wetland which further helps to store water and sediment. Three overwater structures are present. Rock Creek flows into the lake at its northern end and flows out of it at the southern end where it continues south and west to where it converges with the Palouse River.
Vegetation
LWD and organic matter recruitment
Shrub/Scrub vegetation makes up approximately half of the shorelands land cover. Evergreen forest, herbaceous and woody wetlands are also present. Some narrow bands of dense vegetation are also present along the shoreline but most of the vegetation is sparse limiting filtration functions.
Filtration of upland inputs
Bank stabilization
Habitat
Wetland/riparian habitat Rock Lake is the largest natural lake in Eastern WA. Provides habitat for various warm-water fish and is stocked with rainbow trout. Development around the lake is very limited providing good access for wildlife and corridors between habitat types. Associated wetland area is limited and riparian vegetation is sparse in areas, but surrounding cliffs and bluffs also provide unique upland habitat.
Space and conditions supporting wildlife, including PHS species
Key Environmental or Land Use Factors Affecting Processes/Functions: Existing and potential development pressure is limited and few modifications exist to the natural system. Riparian vegetation is naturally minimal.
The Watershed Company and BERK August 2014
47
5.2.2 Palouse River
The Palouse River enters the County from northern Idaho, flowing west through the
City of Palouse, into the center of the County. At Colfax it meets with the south fork
which flows through Albion and Pullman and is discussed separately below. From
Colfax, the mainstem Palouse meanders east then turns south and flows along the
southern half of the County’s western border until it enters the Snake River in the
southwest corner of the County. For the purposes of this report, the shoreline
jurisdiction area of the Palouse River that lies within the County has been divided into
ten reaches. Spatially divergent portions of the shoreline with similar characteristics
have been aggregated together into one reach. For example, several agricultural areas
are present throughout the entire length of the river which have been joined together
into one agriculture reach for the purpose of this analysis. Reaches are numbered
sequentially upstream from where the first instance of that reach type occurs.
The portion of the Palouse River from the Idaho border to Colfax may locally be referred
to as the North Fork Palouse River. For purposes of this analysis, this segment is
included in the mainstem Palouse discussion. It is identified as Reach 10- “North Fork
Palouse Agriculture.” Reaches of the Palouse which flow through Cities are discussed
in the relevant City’s section in 5.3.
Shoreline conditions vary greatly throughout the reaches from steep cliffs and canyons
in the lower sections (Reach 2, 3), to forested meanders through the center of the County
(Reach 7). The longest reaches are Reaches 5 and 10, which constitute the shorelands
which are predominantly in agricultural use.
There are no ESA-listed salmonids or other listed aquatic species above the Palouse Falls
which is located in Reach 4. Upstream of the falls, resident rainbow trout are present in
all reaches. Downstream of the falls, there is documented presence of Dolly Varden/bull
trout, summer steelhead and fall Chinook in Reaches 1 and 4 and the portions of
Reaches 2 and 3 which are below the falls, including known spawning of fall Chinook in
Reaches 1 and 4.
The following table provides the functional scores for each reach for each of the four
ecological processes categories identified in Table 5-1. Reaches are ranked according to
their overall functional score. The table is followed by a summary page which discusses
the main functional attributes and impacts contributing to the scores.

Final Whitman County Coalition Shoreline Analysis Report
48
Table 5-6. Functional scoring for Palouse River reaches
Reach Name
Ran
k
Hydrologic Vegetative Habitat Hyporheic
Mod
erat
ion
of s
edim
ent
tran
spor
t
In-s
trea
m h
abita
t fea
ture
s
Atte
nuat
ing
flow
ene
rgy
LWD
and
org
anic
mat
ter
recr
uitm
ent
Filtr
atio
n of
upl
and
inpu
ts
Ban
k st
abili
zatio
n
Wet
land
/ripa
rian
habi
tat
Spac
e an
d co
nditi
ons
supp
ortin
g w
ildlif
e
Wat
er s
tora
ge a
nd
filtr
atio
n
Supp
ort o
f veg
etat
ion
3- Canyon 1 M H H H M M H H H M 6- Western Palouse 1 H H M H H M M M H H 7- Meanders 2 H H H M M H M M H M 4- Palouse Falls State Park 3 M H L H M M M M M M
5- Agriculture 4 M M M L L M M H M H 9- Open Space 4 M M H L M M M L M H 10- North Fork Palouse Agriculture 4 M M M M M M M M M M
2- Cliffs 5 L L L H L L L H L L 1- Confluence with Snake 6 L L L M L L L H L L 8- County Industrial 7 L L L L L L M L L M
Relative ranking order from highest to lowest function based on mean reach scores (L= Low function, M=Medium function, H= High function).

The Watershed Company and BERK August 2014
49
Palouse River (County reaches)
Process/Function Notes
Hydrologic
Moderation of sediment transport
Functions are highest in Reaches 3, 6 and 7 where islands and backwater areas are present and there is little armoring. Function is lowest in Reaches 1 and 2 where steep cliffs act as natural armoring and in Reach 8 where the majority is leveed. Palouse Falls is located in Reach 4. Overwater structures are present in many reaches, particularly Reach 5. Floodplain is greatest in the upper reaches. Floodway is present in Reaches 7 and 9.
Development and maintenance of in-stream habitat features
Attenuating flow energy
Vegetation
LWD and organic matter recruitment
Landcover varies greatly. Naturally sparse vegetation is present on the cliffs of the lower reaches and agriculture has impacted much of the riparian vegetation in Reach 5. The meanders through the central portion of the County (Reaches 7 and 6) have the highest amount of woody shoreline vegetation.
Filtration of upland inputs
Bank stabilization
Habitat
Wetland/riparian habitat Moderate to high amounts of wetland are mapped in all but Reaches 1 and 2. However the cliffs in those reaches provide unique upland habitat. At least one PHS region or species is documented in all reaches except for 8. ESA listed salmonids are present below the Falls in Reaches 1, 2 and 3.
Space and conditions supporting wildlife, including PHS species
Hyporheic
Water storage, cool water refugia, and filtration
High percentages of alluvial soils are present in the more agricultural reaches (5, 6, and 9). Hyporheic functions are limited by armoring and/or natural cliffs particularly in Reaches 1, 2 and 8. Support of vegetation
Key Environmental or Land Use Factors Affecting Processes/Functions:
Environmental and land use factors affecting Palouse River reach functions varies from significant agricultural impacts to natural steep cliffs and bluffs. The majority of shorelands are undeveloped outside of agricultural uses.
Reach 5, Agriculture Canyons and cliffs of
Reaches 2 and 3
Reach 7, Meanders
Image Sources: Google Earth

Final Whitman County Coalition Shoreline Analysis Report
50
5.2.3 South Fork Palouse River
The South Fork of the Palouse River flows through the central eastern portion of the
County, through Pullman and Albion to where it meet with the mainstem Palouse in
Colfax. Reaches within the cities are discussed in Section 5.3 below. For the purposes of
this report, the shoreline jurisdiction area of the South Fork Palouse River that lies
within the County has been divided into five reaches, numbered sequentially upstream.
Reach five consists of a very small (0.2 acre) piece of Pullman’s Urban Growth Area
(UGA) which lies within shoreline jurisdiction but is not contiguous with the river
channel itself (see Map 23 in Appendix B). It is currently a forested area mapped
predominately as wetland with high vegetation and habitat functions, however it is
isolated from the river channel by a railroad grade. Reach 4 is also not contiguous with
the river channel. It consists of a commercial area east of River road and is designated as
its own reach because of the existing land use which is unique compared to that of the
other reaches. It is predominantly developed and has low function overall. These small
areas are not ranked with the other reaches as some of the ecological processes are not
applicable given that the river channel is not within the reach.
The following table provides the functional scores for each reach for each of the four
ecological processes categories identified in Table 5-1. The table is followed by a
summary page which discusses the main functional attributes and impacts contributing
to the scores.
Table 5-7. Functional scoring for South Fork Palouse River reaches
Reach Number/ Name
Ran
k
Hydrologic Vegetative Habitat Hyporheic
Mod
erat
ion
of s
edim
ent
tran
spor
t
In-s
trea
m h
abita
t fe
atur
es
Atte
nuat
ing
flow
ene
rgy
LWD
and
org
anic
mat
ter
recr
uitm
ent
Filtr
atio
n of
upl
and
inpu
ts
Ban
k st
abili
zatio
n
Wet
land
/ripa
rian
habi
tat
Spac
e an
d co
nditi
ons
supp
ortin
g w
ildlif
e
Wat
er s
tora
ge a
nd
filtr
atio
n
Supp
ort o
f veg
etat
ion
1- South Fork River Road 1 M M M M M M M M M M 3- Agriculture/Residential 2 M H H L L M H L L M 2- Agriculture 3 M L H L M M M L M M 5- Pullman UGA* - NA* NA* L H H NA* H M M L 4- Commercial* - NA* NA* L L L NA* L L L L
Relative ranking order from highest to lowest function based on mean reach scores (L= Low function, M=Medium function, H= High function). *reach only includes shorelands that are not contiguous with river

The Watershed Company and BERK August 2014
51
South Fork Palouse River (County reaches)
Process / Function Notes
Hydrologic
Moderation of sediment transport
Floodway is present in Reaches 2, 3 and 4, however Reach 4 is separated from the channel and is mostly developed with roads and impervious surface decreasing its function. Wetlands cover the majority of Reach 3, which help slow and disperse flood flows however riparian vegetation is very limited. Several overwater structures are present in Reaches 1 and 2.
Development and maintenance of in-stream habitat features
Attenuating flow energy
Vegetation
LWD and organic matter recruitment
Occasional trees and shrubs are present in all reaches, most in Reach 1, which provide some filtration and bank stabilization but vegetation function is generally low overall. Riparian vegetation widths are narrow in most areas and shorelands are dominated by agricultural uses. Filtration of upland inputs
Bank stabilization
Habitat
Wetland/riparian habitat Low to moderate wildlife function is present. A high percentage of wetland in Reach 3 raises its score above the others. No PHS regions are mapped in any of the reaches. Narrow riparian vegetation separates the agriculture fields and associated development from the river in most places but roads or development are also present in all reaches. No anadromous fish use is documented.
Space and conditions supporting wildlife, including PHS species
Hyporheic
Water storage, cool water refugia, and filtration
Moderate hyporheic function scores due to presence of alluvial soils that can store water and support vegetation within the shoreline area, except for Reach 4 which is mainly commercially developed. Support of vegetation
Key Environmental or Land Use Factors Affecting Processes/Functions: Hydrologic functions are generally the highest functions of this waterbody due to extensive floodplain and some floodway and generally good connections to the channel. Vegetation and habitat functions are limited mainly by modifications from agricultural use.
Image Source: Google Earth
Reach 2- Agriculture

Final Whitman County Coalition Shoreline Analysis Report
52
5.2.4 Rock Creek
Rock Creek enters Whitman County from Spokane County to the north, and flows
southwest though the northwest corner of the County. It briefly enters Adams County
and then re-enters Whitman County and flows south parallel to the County’s western
border until it converges with the Palouse River west of Endicott. For the purposes of
this report, the shoreline jurisdiction area of Rock Creek has been divided into five
reaches, numbered sequentially upstream.
There are no ESA-listed salmonids documented in Rock Creek, but rainbow trout are
documented throughout all reaches.
The following table provides the functional scores for each reach for each of the four
ecological processes categories identified in Table 5-1. The table is followed by a
summary page which discusses the main functional attributes and impacts contributing
to the scores.
Table 5-8. Functional scoring for Rock Creek reaches
Reach Number/ Name
Ran
k
Hydrologic Vegetative Habitat Hyporheic
Mod
erat
ion
of s
edim
ent
tran
spor
t
In-s
trea
m h
abita
t fe
atur
es
Atte
nuat
ing
flow
ene
rgy
LWD
and
org
anic
mat
ter
recr
uitm
ent
Filtr
atio
n of
upl
and
inpu
ts
Ban
k st
abili
zatio
n
Wet
land
/ripa
rian
habi
tat
Spac
e an
d co
nditi
ons
supp
ortin
g w
ildlif
e
Wat
er s
tora
ge a
nd
filtr
atio
n
Supp
ort o
f veg
etat
ion
5- Lake Outlet 1 H H M H H H H H H H 2- Escure Ranch 2 H H L H H H M H H M 6- Pine Creek Confluence 2 H H M M M M H H H H 4- Cottonwood Confluence/PAW 3 H H L H M M H M H H
3- Imbler Creek 4 H M H H M M M M H L 1- Agriculture 5 H H L M L L H M H H
Relative ranking order from highest to lowest function based on mean reach scores (L= Low function, M=Medium function, H= High function).

The Watershed Company and BERK August 2014
53
Rock Creek
Process Function Notes
Hydrologic
Moderation of sediment transport
No armoring and high percentages of wetland yield high hydrologic function scores for moderation of sediment transport and in stream habitat features. Floodplain is relatively low in Reaches 1, 2 and 4 m lowering those reaches scores for attenuating flow energy. Towell Falls is present in Reach 2 along with some meanders and backwater areas.
Development and maintenance of in-stream habitat features
Attenuating flow energy
Vegetation
LWD and organic matter recruitment
Function is highest in Reaches 2 and 5 where shrubby riparian vegetation is generally present separating the channel from uplands and stabilizing banks. More intact natural vegetation and less agricultural impacts are found in these reaches. Reach 1 has the lowest scores due to agricultural impacts and a lack of trees and shrubs.
Filtration of upland inputs
Bank stabilization
Habitat
Wetland/riparian habitat Overall, moderate to high habitat functions are present. Several PHS regions are mapped including Rocky Mountain Elk over almost all of Reach 6. Some off-channel habitat and small island areas are present in Reaches 2 and 5.
Space and conditions supporting wildlife, including PHS species
Hyporheic
Water storage, cool water refugia, and filtration
High hyporheic functions are present in Reaches 1 and 4-6 due to a high percentage of alluvial soils which help store water and support vegetation within the shoreline area. Lower percentages are present in Reaches 2 and 3 but riverine wetlands are present in all reaches and are well connected to the mainstem channel.
Support of vegetation
Key Environmental or Land Use Factors Affecting Processes/Functions:
Agricultural use is the main shoreline modification but is mostly limited to Reach 1. Reach 2 includes a recreational use area. Vegetation is naturally limited by the basalt landscape throughout the region.
Rock Creek Image Source: Google Earth
Aerial view
of Reach 5

Final Whitman County Coalition Shoreline Analysis Report
54
5.2.5 Cottonwood Creek
Cottonwood Creek originates in the northeastern quadrant of the County and flows east
to where it converges with Rock Creek, just south of Rock Lake. Only the very western
end of Cottonwood Creek meets jurisdictional requirements. For the purposes of this
report, the shoreline jurisdiction area was divided into two reaches, numbered
sequentially upstream. The reach division was based mainly on the extensive
potentially associated wetland included in Reach 2. No anadromous fish species are
documented in Cottonwood Creek.
The following table provides the functional scores for each reach for each of the four
ecological processes categories identified in Table 5-1. The table is followed by a
summary page which discusses the main functional attributes and impacts contributing
to the scores.
Table 5-9. Functional scoring for Cottonwood Creek reaches
Reach Number/ Name
Ran
k
Hydrologic Vegetative Habitat Hyporheic
Mod
erat
ion
of s
edim
ent
tran
spor
t
In-s
trea
m h
abita
t fea
ture
s
Atte
nuat
ing
flow
ene
rgy
LWD
and
org
anic
mat
ter
recr
uitm
ent
Filtr
atio
n of
upl
and
inpu
ts
Ban
k st
abili
zatio
n
Wet
land
/ripa
rian
habi
tat
Spac
e an
d co
nditi
ons
supp
ortin
g w
ildlif
e
Wat
er s
tora
ge a
nd
filtr
atio
n
Supp
ort o
f veg
etat
ion
1- Agriculture 1 H H H H L M H M H L 2- PAW 2 H H L M L M H M H H
Relative ranking order from highest to lowest function based on mean reach scores (L= Low function, M=Medium function, H= High function).

The Watershed Company and BERK August 2014
55
Cottonwood Creek
Process Function Notes
Hydrologic
Moderation of sediment transport
High hydrologic function is present overall, however, limited floodplain in Reach 2 lowers its score for attenuating flow energy. No levees or overwater structures. Generally simple channel structure, few backwater areas or meanders but high percentage of wetland.
Development and maintenance of in-stream habitat features
Attenuating flow energy
Vegetation
LWD and organic matter recruitment
The channel itself is a vegetated swale in some areas. No armoring or structures are present. Function is limited by very narrow width of riparian vegetation in many places. Much of the wetland is in agricultural use. Only sparse trees or shrubs occasionally present.
Filtration of upland inputs
Bank stabilization
Habitat
Wetland/riparian habitat Moderate to high habitat functions are present. Reach 2 is entirely wetland and a high percentage is present in Reach 1 as well. Some PHS regions are mapped in each reach but generally unique habitat features are lacking and habitat is impacted from agricultural uses.
Space and conditions supporting wildlife, including PHS species
Hyporheic
Water storage, cool water refugia, and filtration
High hyporheic functions are present in Reach 2 due to a high percentage of alluvial soils which help store water and support vegetation within the shoreline area. Alluvial soils are less present in Reach 1, but good wetland connectivity is present.
Support of vegetation
Key Environmental or Land Use Factors Affecting Processes/Functions: Agricultural uses are the main shoreline modificaitons in this reach. The narrow channel has herbaceous vegetation present within it in places. Trees and shrubs are limited throughout most of both reaches. Most of the PAW in Reach 2 are in agricultural use.
Cottonwood Creek near St.
John (Reach 2)
Aerial view of Reach 2
associated wetlands
Image Source: Google Earth
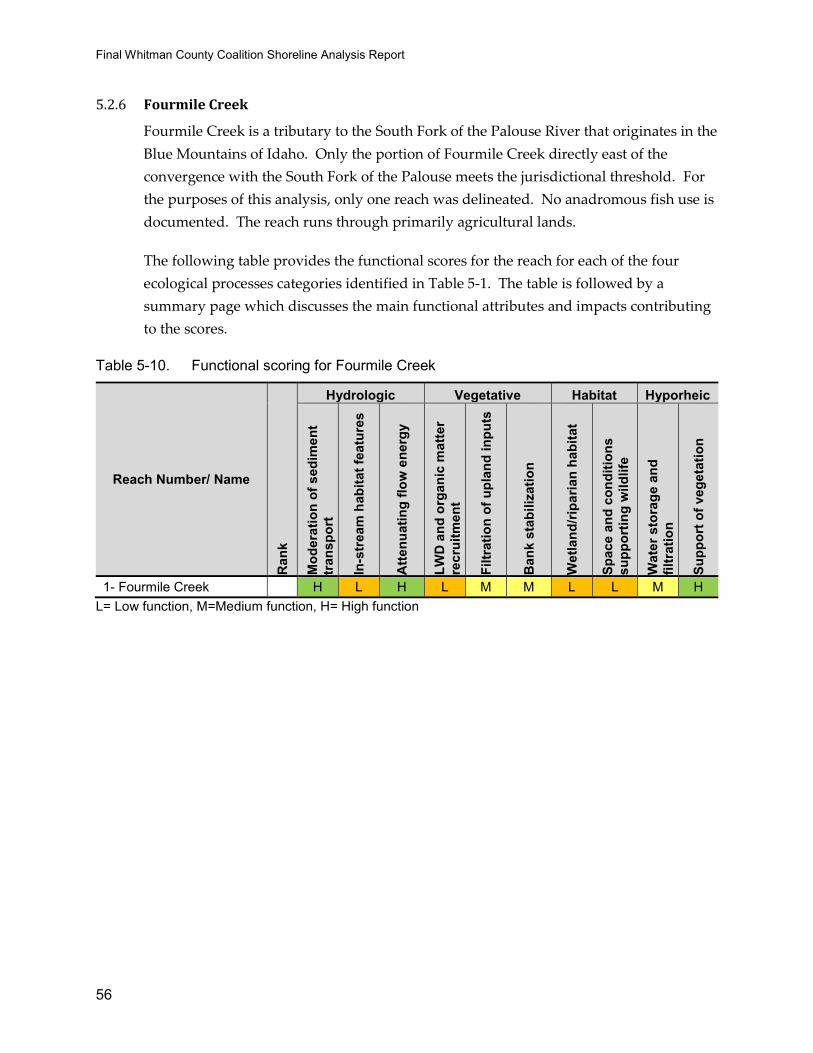
Final Whitman County Coalition Shoreline Analysis Report
56
5.2.6 Fourmile Creek
Fourmile Creek is a tributary to the South Fork of the Palouse River that originates in the
Blue Mountains of Idaho. Only the portion of Fourmile Creek directly east of the
convergence with the South Fork of the Palouse meets the jurisdictional threshold. For
the purposes of this analysis, only one reach was delineated. No anadromous fish use is
documented. The reach runs through primarily agricultural lands.
The following table provides the functional scores for the reach for each of the four
ecological processes categories identified in Table 5-1. The table is followed by a
summary page which discusses the main functional attributes and impacts contributing
to the scores.
Table 5-10. Functional scoring for Fourmile Creek
Reach Number/ Name
Ran
k
Hydrologic Vegetative Habitat Hyporheic
Mod
erat
ion
of s
edim
ent
tran
spor
t
In-s
trea
m h
abita
t fea
ture
s
Atte
nuat
ing
flow
ene
rgy
LWD
and
org
anic
mat
ter
recr
uitm
ent
Filtr
atio
n of
upl
and
inpu
ts
Ban
k st
abili
zatio
n
Wet
land
/ripa
rian
habi
tat
Spac
e an
d co
nditi
ons
supp
ortin
g w
ildlif
e
Wat
er s
tora
ge a
nd
filtr
atio
n
Supp
ort o
f veg
etat
ion
1- Fourmile Creek H L H L M M L L M H L= Low function, M=Medium function, H= High function

The Watershed Company and BERK August 2014
57
Fourmile Creek
Process Function Notes
Hydrologic
Moderation of sediment transport
High functional scores for moderation of sediment transport and attenuating flow energy due to a significant amount of floodplain with good connectivity to the channel and little armoring present. One bridge crosses the reach along Albion Parvin Road. However, no backwater areas, island or wetlands are present.
Development and maintenance of in-stream habitat features
Attenuating flow energy
Vegetation
LWD and organic matter recruitment
Low to moderate vegetation function is present. Riparian vegetation is generally limited to dense herbaceous species which provide some filtration function. Shoreland area is dominated by cultivated crops which have limited the width of natural vegetation.
Filtration of upland inputs
Bank stabilization
Habitat
Wetland/riparian habitat Low habitat function is present overall. No wetlands are present and riparian habitat is limited to mainly agriculture fields and a narrow band of herbaceous vegetation. No documentation of PHS species.
Space and conditions supporting wildlife, including PHS species
Hyporheic
Water storage, cool water refugia, and filtration
Shallow alluvial soils along the majority of the creek increases hyporheic function. However, limited woody riparian vegetation and no adjacent wetlands are present, limiting water storage. Support of vegetation
Key Environmental or Land Use Factors Affecting Processes/Functions: Agricultural uses are the primary modification in this reach. No other development is present within the reach except for roads.
Fourmile Creek in
December
Aerial view of reach
Image Source: Google Earth

Final Whitman County Coalition Shoreline Analysis Report
58
5.2.7 Hangman Creek
Hangman Creek (also known as Latah Creek), is a tributary to the Spokane river which
flows northwest through the northeast corner of Whitman County, through the City of
Tekoa. City reaches are addressed in Section 5.3.8. For the purposes of this analysis the
jurisdictional area of Hangman Creek in the County was left as one reach. Shorelands in
the County reach have been modified mainly by agricultural practices.
Hangman Creek has degraded water quality and is on the 303(d) list for dissolved
oxygen and has a Category 4a listing (TMDL in place) for bacteria and temperature. No
anadromous fish presence is documented.
The following table provides the functional scores for the reach for each of the four
ecological processes categories identified in Table 5-1. The table is followed by a
summary page which discusses the main functional attributes and impacts contributing
to the scores.
Table 5-11. Functional scoring for Hangman Creek
Reach Number/ Name
Ran
k
Hydrologic Vegetative Habitat Hyporheic
Mod
erat
ion
of s
edim
ent
tran
spor
t
In-s
trea
m h
abita
t fea
ture
s
Atte
nuat
ing
flow
ene
rgy
LWD
and
org
anic
mat
ter
recr
uitm
ent
Filtr
atio
n of
upl
and
inpu
ts
Ban
k st
abili
zatio
n
Wet
land
/ripa
rian
habi
tat
Spac
e an
d co
nditi
ons
supp
ortin
g w
ildlif
e
Wat
er s
tora
ge a
nd
filtr
atio
n
Supp
ort o
f veg
etat
ion
1- Agriculture M L H L M M L L M H L= Low function, M=Medium function, H= High function

The Watershed Company and BERK August 2014
59
Hangman Creek-Agriculture (County Reach)
Process Function Notes
Hydrologic
Moderation of sediment transport
Hydrologic function varies. A high percentage of floodplain and some floodway are mapped throughout the reach yielding a high score for attenuating flow energy. Little armoring and no dams or overwater structures are present. However the channel structure is generally simple, with little backwater areas, meanders or wetland.
Development and maintenance of in-stream habitat features
Attenuating flow energy
Vegetation
LWD and organic matter recruitment
Scattered trees and shrubs are present providing some screening between the channel and agricultural lands. However riparian vegetation is generally very narrow and cultivated crops dominate the shore lands.
Filtration of upland inputs
Bank stabilization
Habitat
Wetland/riparian habitat Low habitat function is present. Riparian habitat is limited to mainly agriculture fields and a narrow band of herbaceous vegetation. Very little wetland is mapped and there is no documentation of PHS species.
Space and conditions supporting wildlife, including PHS species
Hyporheic
Water storage, cool water refugia, and filtration
High hyporheic functions are present due to a high percentage of alluvial soils along the reach which help store water and support vegetation within the shoreline area. However very little wetland is present, decreasing the storage and filtration functions.
Support of vegetation
Key Environmental or Land Use Factors Affecting Processes/Functions: Agriculture is a significant land use in this area and is the primary modification in this reach. Development of agriculture has led to a reduction of natural riparian vegetation and altered channel structure. Degraded water quality is a concern in this reach.
Aerial view of reach
near Fairbanks Road
Image Source: Google Earth

Final Whitman County Coalition Shoreline Analysis Report
60
5.2.8 Pine Creek
Pine Creek flows west near the northern border of the County, through the Towns of
Rosalia and Malden (See Sections 5.3.4 and 5.3.3 for analysis of those reaches). For the
purposes of this report, the shoreline jurisdiction area of Pine Creek that lies within the
County has been divided into three reaches, numbered sequentially upstream. Reaches
1 and 3 each include several spatially divergent portions of the shoreline with similar
characteristics which have been aggregated together into two reaches. Reach 1 is heavily
agricultural with limited riparian vegetation, while Reach 3 has more woody vegetation
present and less agricultural impact in the shorelands. Reach 2 is a small area just
outside of Rosalia which includes a wastewater treatment facility.
The following table provides the functional scores for the reach for each of the four
ecological processes categories identified in Table 5-1. The table is followed by a
summary page which discusses the main functional attributes and impacts contributing
to the scores.
Table 5-12. Functional scoring for Pine Creek reaches
Reach Number/ Name
Ran
k
Hydrologic Vegetative Habitat Hyporheic
Mod
erat
ion
of s
edim
ent
tran
spor
t
In-s
trea
m h
abita
t fea
ture
s
Atte
nuat
ing
flow
ene
rgy
LWD
and
org
anic
mat
ter
recr
uitm
ent
Filtr
atio
n of
upl
and
inpu
ts
Ban
k st
abili
zatio
n
Wet
land
/ripa
rian
habi
tat
Spac
e an
d co
nditi
ons
supp
ortin
g w
ildlif
e
Wat
er s
tora
ge a
nd
filtr
atio
n
Supp
ort o
f veg
etat
ion
3- Scrub/Shrub 1 H L L M M M M H M M 1- Agriculture 2 H L H L L M L L M H 2- Waste Water Treatment Lagoons 2 M L* H L M M L* L M* M
Relative ranking order from highest to lowest function based on mean reach scores (L= Low function, M=Medium function, H= High function). *excluding artificial treatment lagoons, mapped as wetland

The Watershed Company and BERK August 2014
61
Pine Creek (County Reaches)
Process Function Notes
Hydrologic
Moderation of sediment transport A high percentage of floodplain and some floodway is
present in Reaches 1 and 2, but is limited in Reach 3. Excluding the treatment lagoons in Reach 2 which are mapped as wetland, wetland is limited in all reaches. No dams are present and armoring is limited.
Development and maintenance of in-stream habitat features
Attenuating flow energy
Vegetation
LWD and organic matter recruitment
Highest vegetative function is present in Reach 3 where evergreen forest makes up over 40% of the landcover. Reach 1 is dominated by agriculture and Reach 2 by the wastewater treatment lagoons.
Filtration of upland inputs
Bank stabilization
Habitat
Wetland/riparian habitat Low habitat function is present in Reaches 1 and 2. Function increases in Reach 3 where more undisturbed shorelands are present with forested vegetation. Multiple PHS regions are also present in Reach 3 including Rocky Mountain Elk and Cliffs/Bluffs
Space and conditions supporting wildlife, including PHS species
Hyporheic
Water storage, cool water refugia, and filtration
Alluvial soils are present throughout all reaches, the highest percentage in Reach 1, which help store water and support vegetation within the shoreline area. However minimal wetland is present, decreasing the storage and filtration functions.
Support of vegetation
Key Environmental or Land Use Factors Affecting Processes/Functions: Agricultural uses and loss of riparian vegetation are the primary modifications along the county reaches of Pine Creek, primarily in Reach 1.
Reach 1
Image Source: Google Earth Reach 3

Final Whitman County Coalition Shoreline Analysis Report
62
5.2.9 Union Flat Creek
Union Flat Creek is a tributary to the Palouse River. It flows west through the central
portion of Whitman County, entering the Palouse just northwest of Lacrosse. No
anadromous salmonid species are documented in the creek. For the purposes of this
report, the shoreline jurisdiction area Union Flat Creek has been divided into three
reaches, numbered sequentially upstream. Reach 1 flows through a canyon through the
scabland region while Reaches 2 and 3 are within regions with more agricultural use.
Reach 2 has a very narrow area of riparian vegetation with shorelands dominated by
agricultural fields, while Reach 3 has a somewhat wider area of riparian vegetation
including areas of sparse evergreen forest. Rainbow trout are documented in all
reaches.
The following table provides the functional scores for the reach for each of the four
ecological processes categories identified in Table 5-1. The table is followed by a
summary page which discusses the main functional attributes and impacts contributing
to the scores.
Table 5-13. Functional scoring for Union Flat Creek reaches
Reach Number/ Name
Ran
k
Hydrologic Vegetative Habitat Hyporheic
Mod
erat
ion
of s
edim
ent
tran
spor
t
In-s
trea
m h
abita
t fea
ture
s
Atte
nuat
ing
flow
ene
rgy
LWD
and
org
anic
mat
ter
recr
uitm
ent
Filtr
atio
n of
upl
and
inpu
ts
Ban
k st
abili
zatio
n
Wet
land
/ripa
rian
habi
tat
Spac
e an
d co
nditi
ons
supp
ortin
g w
ildlif
e
Wat
er s
tora
ge a
nd
filtr
atio
n
Supp
ort o
f veg
etat
ion
2- Agriculture 1 H L H L M M L L H H 3- Riparian/Agriculture 1 H L H L M M M L M H 1- Scablands 2 M M L H M M M L M M
Relative ranking order from highest to lowest function based on mean reach scores (L= Low function, M=Medium function, H= High function).

The Watershed Company and BERK August 2014
63
Union Flat Creek
Process Function Notes
Hydrologic
Moderation of sediment transport Very high percentages of floodplain in Reaches 2 and 3 with
good connectivity to the channel. Hydrologic functions are more limited in Reach 1 by fairly steep slopes. Wetland is greatest in Reach 1, otherwise development and maintenance of in stream features is low.
Development and maintenance of in-stream habitat features
Attenuating flow energy
Vegetation
LWD and organic matter recruitment
Reaches 2 and 3 are dominated by cultivated crops. Reach 1 flows through an area with naturally sparse scrub/shrub vegetation but has some denser vegetation present along the banks and less agriculture modifications.
Filtration of upland inputs
Bank stabilization
Habitat
Wetland/riparian habitat
Low wetland in Reach 3 but more riparian veg. Wetland in Reach 2 and scablands.
Space and conditions supporting wildlife, including PHS species
Hyporheic
Water storage, cool water refugia, and filtration
Shallow alluvial soils are present throughout all reaches, with highest amounts in Reaches 2 and 3. Wetlands connected to the channel contribute to water storage primarily in Reach 2 where wetland percentage is highest and slopes are limited.
Support of vegetation
Key Environmental or Land Use Factors Affecting Processes/Functions: Agricultural uses and loss of riparian vegetation are the primary modifications. Functions in Reach 1 are limited by naturally sparse vegetation and steeper slopes.
Detail of upper reaches
Image Source: Google Earth
Aerial view of Reach 1
Final Whitman County Coalition Shoreline Analysis Report
64
5.2.10 Snake River
The Snake River forms the southern border of Whitman County. For the purposes of
this report, the shoreline jurisdiction area has been divided into five reaches. Spatially
divergent portions of the shoreline with similar characteristics have been aggregated
together in to one reach for example, several industrial areas are present throughout the
entire length of the river which have been joined together into one industrial reach for
the purpose of this analysis. Reaches are numbered sequentially upstream from where
the first instance of that reach type occurs.
The channel in most areas has steeply sloped banks or is within steep-sided canyons
with limited vegetation. The largest reach, Reach 2 (Railroad), is impacted from a
railroad and associated armoring that parallels the shoreline for the majority of the river.
Reach 1 (Cliffs) consists entirely of predominantly unvegetated steep cliffs along the
lowest portion of the Snake. The railroad does not run through Reach 1 except where is
cuts across the reach perpendicularly at the point where it crosses the river and enters
Columbia County.
Reach 3 (Parks/Open Space) includes official parks, recreation areas and distinct areas
where more riparian or buffer vegetation is present, usually where banks are less steep.
Industrial uses are present within Reach 4 (Industrial) including two dams, the Lower
Granite and Little Goose Dams. Reach 5 (Steptoe Canyon) includes the backwater area
and associated wetland near Steptoe Canyon Road.
The following table provides the functional scores for each reach for each of the four
ecological processes categories identified in Table 5-1. The table is followed by
summary pages which discuss the main functional attributes and impacts contributing
to the scores. Reaches 1, 2, 3 and 5 are summarized together. Reach 4 (Industrial) is
described separately given its unique uses and modified condition.
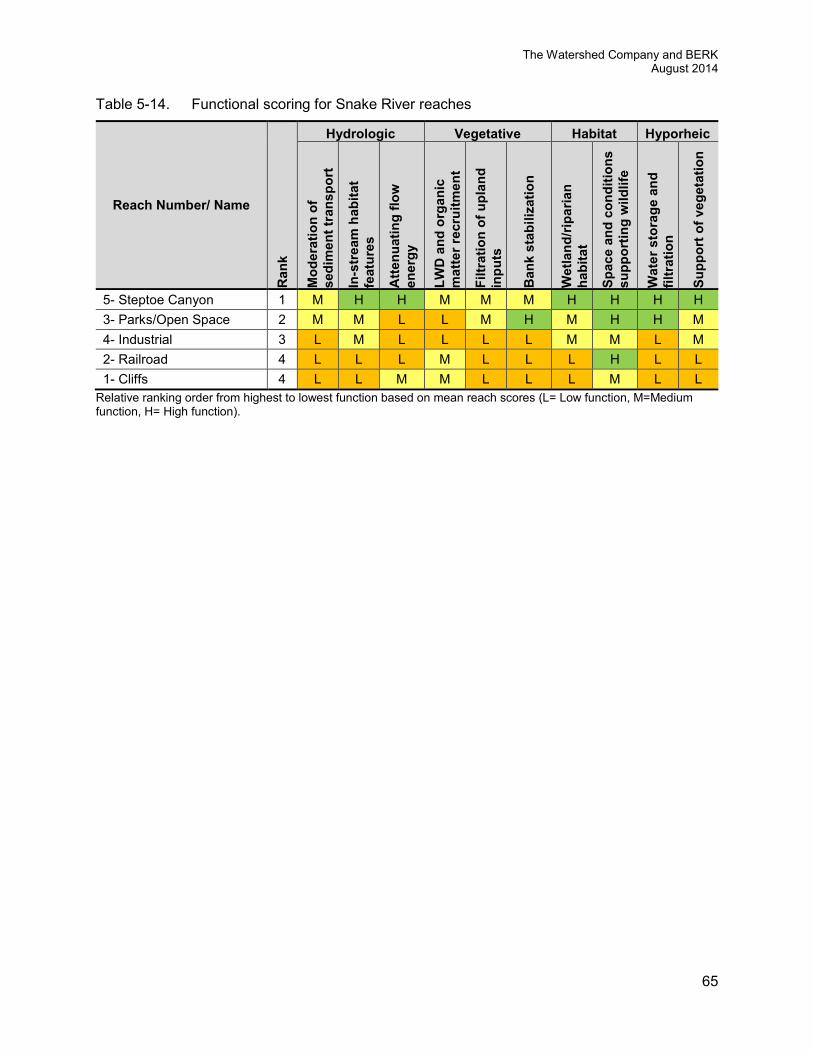
The Watershed Company and BERK August 2014
65
Table 5-14. Functional scoring for Snake River reaches
Reach Number/ Name
Ran
k
Hydrologic Vegetative Habitat Hyporheic
Mod
erat
ion
of
sedi
men
t tra
nspo
rt
In-s
trea
m h
abita
t fe
atur
es
Atte
nuat
ing
flow
en
ergy
LWD
and
org
anic
m
atte
r rec
ruitm
ent
Filtr
atio
n of
upl
and
inpu
ts
Ban
k st
abili
zatio
n
Wet
land
/ripa
rian
habi
tat
Spac
e an
d co
nditi
ons
supp
ortin
g w
ildlif
e
Wat
er s
tora
ge a
nd
filtr
atio
n
Supp
ort o
f veg
etat
ion
5- Steptoe Canyon 1 M H H M M M H H H H 3- Parks/Open Space 2 M M L L M H M H H M 4- Industrial 3 L M L L L L M M L M 2- Railroad 4 L L L M L L L H L L 1- Cliffs 4 L L M M L L L M L L
Relative ranking order from highest to lowest function based on mean reach scores (L= Low function, M=Medium function, H= High function).

Final Whitman County Coalition Shoreline Analysis Report
66
Snake River-Reaches 1, 2, 3 and 5
Process Function Notes
Hydrologic
Moderation of sediment transport
Armoring and natural steep cliffs along the majority of the shoreline (Reaches 1 and 2) limits flow attenuation and instream habitat diversity. Functions are higher in Reaches 3 and 5 where less armoring, more wetland and backwater areas are present. The percentage of floodplain is generally high but connectivity to the channel is limited due to the natural and artificial armoring.
Development and maintenance of in-stream habitat features
Attenuating flow energy
Vegetation
LWD and organic matter recruitment
A railroad and associated armoring runs along much of the shoreline. Shrub steppe vegetation is located upland of the railroad prism, limiting its potential shoreline functions. Reaches 3 and 5 have more riparian vegetation.
Filtration of upland inputs
Bank stabilization
Habitat
Wetland/riparian habitat
The railroad running parallel to the river limits wildlife dispersal opportunities. Riparian vegetation is also limited along these reaches. However, shrub steppe vegetation and bluffs provide upland habitat value. Wetland habitat is most significant in Reaches 3 and 5. Anadromous fish use is documented throughout the river.
Space and conditions supporting wildlife, including PHS species
Hyporheic
Water storage, cool water refugia, and filtration
Hyporheic functions are limited by armoring and/or natural cliffs throughout most of the shoreline (Reaches 1 and 2). However high percentages of alluvial soils that store water and support vegetation are present in Reaches 3 and 5 where wetland is also highest. Support of vegetation
Key Environmental or Land Use Factors Affecting Processes/Functions: The railroad prism and associated armoring limits shoreline functions and natural cliffs limit vegetative and hyporheic functions. However, cliffs and bluffs provide unique upland habitats and waterfowl concentration areas are present throughout.

The Watershed Company and BERK August 2014
67
Snake River- Reach 4, Industrial
Process Function Notes
Hydrologic
Moderation of sediment transport
Armoring and natural steep cliffs along the majority of the shoreline limits flow attenuation and instream habitat diversity. Lower Granite and Little Goose Dams (Reach 4) impound water, creating shallow reservoirs that typically fill the width of the steep-sided canyons. The percentage of floodplain is moderately high but connectivity to the channel is limited due to the armoring.
Development and maintenance of in-stream habitat features
Attenuating flow energy
Vegetation
LWD and organic matter recruitment
Armoring associated with industrial development and roads runs along much of the shoreline. Very limited shrub steppe vegetation is located immediately along the river’s edge in some locations.
Filtration of upland inputs
Bank stabilization
Habitat
Wetland/riparian habitat
Anadromous fish use is documented in the reach and bluffs, where not developed provide upland habitat value. Waterfowl concentrations, mule deer and chukar PHS regions are documented. However, roads, railroad and industrial development limits wildlife dispersal opportunities and riparian vegetation is very limited.
Space and conditions supporting wildlife, including PHS species
Hyporheic
Water storage, cool water refugia, and filtration
Hyporheic functions are limited by armoring and/or natural cliffs, however wetland is documented over 43% of the reach which helps provide water storage and filtration.
Support of vegetation
Key Environmental or Land Use Factors Affecting Processes/Functions: Dam operations retain sediment and result in seasonal and daily fluctuations in water levels. Industrial development and associated armoring limits shoreline functions and development and natural cliffs limit vegetative and hyporheic functions. Lack of vegetation and development limits terrestrial wildlife habitat.
Image Source: Google Earth
Image Source: Google Earth

Final Whitman County Coalition Shoreline Analysis Report
68
5.3 City and Town Shoreline Results
The following sections discuss the functions are shorelines within each City and Town.
As the results of this analysis may be used to create or update separate SMPs for each
local jurisdiction, the shorelines within each City/Town have been analyzed separately
so that functional rankings are relative to other reaches within the same local
jurisdiction.
The same ecological processes and functions used to evaluate the County reaches (Table
5-1) have been used to evaluate the City reaches; however, rather than using the numeric
thresholds identified in Table 5.4 to distinguish between high, moderate and low
function, best professional judgment has been applied based on the range of conditions
present within each local jurisdiction. This allows the scores and rankings to represent a
more accurate range of functions within the City’s shorelines, and to more meaningfully
differentiate between varying levels of function despite the overall greater level of
impairment found in the City’s shorelines compared to the County’s due to the greater
level of development present.
5.3.1 Town of Albion
The South Fork of the Palouse River flows north through the Town of Albion. It crosses
the southwest corner of the City. Shorelands are primarily undeveloped but some
residential and industrial development is present. Agricultural uses are dominate. For
the purposes of this analysis three reaches have been delineated. For descriptive
purposes, reaches are numbered sequentially from downstream to upstream. Reach 1
encompasses multiple spatially divergent industrial areas that have been aggregated
together into one reach.
All reaches have a water quality Category 4a listing for bacteria.
The following table provides the functional scores for each reach for each of the four
ecological processes categories identified in Table 5-1 and ranks the reaches according to
their overall functional score. The table is followed by summary pages which discuss
the main functional attributes and impacts contributing to the scores for similarly
functioning reaches.

The Watershed Company and BERK August 2014
69
Table 5-15. Functional scoring for South Fork Palouse River reaches in the Town of Albion
Reach Number/Name
Ran
k
Hydrologic Vegetative Habitat Hyporheic
Mod
erat
ion
of s
edim
ent
tran
spor
t
In-s
trea
m h
abita
t fea
ture
s
Atte
nuat
ing
flow
ene
rgy
LWD
and
org
anic
mat
ter
recr
uitm
ent
Filtr
atio
n of
upl
and
inpu
ts
Ban
k st
abili
zatio
n
Wet
land
/ripa
rian
habi
tat
Spac
e an
d co
nditi
ons
supp
ortin
g w
ildlif
e W
ater
sto
rage
and
fil
trat
ion
Supp
ort o
f veg
etat
ion
1-Albion, Industrial 1 H M L H L M M L M M 3-Albion, Residential 2 H L H M L M L L L H 2-Albion, Agriculture 3 H L M L L M L L L M
Relative ranking order from highest to lowest function based on mean reach scores (L= Low function, M=Medium function, H= High function).

Final Whitman County Coalition Shoreline Analysis Report
70
South Fork Palouse River- Albion
Agriculture and Residential (Reaches 2 / 3)
Process Function Notes
Hydrologic
Moderation of sediment transport
These two reaches have the highest function for attenuating flow energy due to extensive floodplain and floodway present. No armoring and moderate slopes provide good connectivity to the floodplain. However, no wetland is present in Reach 2 and only constitutes only 1% of Reach 3. No unique in-stream features are present and the channel form is simple.
Development and maintenance of in-stream habitat features
Attenuating flow energy
Vegetation
LWD and organic matter recruitment
Low to moderate vegetation function is present in these reaches. Reach 3 has some evergreen forest landcover present, but developed open space and cultivated crops dominate both reaches. Occasional trees and shrubs are present in the shorelands and along stream banks. However, most of the shoreline vegetation consists of a narrow but dense band of herbaceous vegetation separating the channel from surrounding agriculture and residential development.
Filtration of upland inputs
Bank stabilization
Habitat
Wetland/riparian habitat Low habitat function is present. Residential development and city roads are present in the reaches limited habitat connectivity. No PHS documentation occurs within the reach and very little wetland habitat is mapped.
Space and conditions supporting wildlife, including PHS species
Hyporheic
Water storage, cool water refugia, and filtration
Both reaches are located on shallow alluvial soils (Reach 3 has more than Reach 2) which increase the hyporheic function score because of their ability to store water and help support vegetation within the shoreline area. Support of vegetation
Key Environmental or Land Use Factors Affecting Processes/Functions: Agricultural uses and loss of riparian vegetation are the primary modifications to these reaches.
Aerial view of
Residential Reach
Image Source: Google Earth
Detail of typical conditions
Image Source: Google Earth

The Watershed Company and BERK August 2014
71
South Fork Palouse River- Albion Industrial
(Reach 1)
Process Function Notes
Hydrologic
Moderation of sediment transport
Relatively little floodplain and floodway are present in this reach, though the most wetland are is mapped here of the three reaches. No overwater structures or levees are present. Few unique in-stream features are present and the channel form is simple.
Development and maintenance of in-stream habitat features
Attenuating flow energy
Vegetation
LWD and organic matter recruitment
This reach has the highest vegetation score due to a greater presence of shrubs and trees. 58.5% of the reach is mapped as Evergreen Forest land cover. A moderately wide and dense band of vegetation generally separates the channel from surrounding land use.
Filtration of upland inputs
Bank stabilization
Habitat
Wetland/riparian habitat Low habitat function is present overall though the highest percentage of wetland is found in this reach which increases its wetland/riparian habitat score. No PHS documentation occurs within the reach and several roads run through it, decreasing the connectivity to other habitat types.
Space and conditions supporting wildlife, including PHS species
Hyporheic
Water storage, cool water refugia, and filtration
Shallow alluvial soils are present, as well as some wetland which increase the hyporheic function score. Currently impervious surface is limited to roads except for one small area of industrial development. Support of vegetation
Key Environmental or Land Use Factors Affecting Processes/Functions: Roads and loss of riparian vegetation are the primary modifications to this reach.
Aerial view of the western
portion of Industrial Reach
Image Source: Google Earth

Final Whitman County Coalition Shoreline Analysis Report
72
5.3.2 City of Colfax
The north and south forks of the Palouse River meet in the City. The north fork
meanders through recreational, residential, and agricultural uses before entering a
concrete flume. Most of the south fork meanders through more dense residential and
commercial areas and is contained with a concrete flume for most of its length.
Downstream of the confluence, the Palouse River continues along some minor
residential uses and primarily industrial uses. For the purposes of this analysis, nine
reaches have been delineated. For descriptive purposes, reaches are numbered
sequentially from downstream to upstream.
The following table provides the functional scores for each reach for each of the four
ecological processes categories identified in Table 5-1 and ranks the reaches according to
their overall functional score. The table is followed by summary pages which discuss
the main functional attributes and impacts contributing to the scores for similarly
functioning reaches.
Table 5-16, below, provides a summary of functional ranking of reaches on the Palouse
River in the City of Colfax.
Table 5-16. Functional scoring for Palouse River reaches in the City of Colfax
Reach Number/Name
Ran
k
Hydrologic Vegetative Habitat Hyporheic
Mod
erat
ion
of s
edim
ent
tran
spor
t
In-s
trea
m h
abita
t fe
atur
es
Atte
nuat
ing
flow
ene
rgy
LWD
and
org
anic
mat
ter
recr
uitm
ent
Filtr
atio
n of
upl
and
inpu
ts
Ban
k st
abili
zatio
n
Wet
land
/ripa
rian
habi
tat
Spac
e an
d co
nditi
ons
supp
ortin
g w
ildlif
e
Wat
er s
tora
ge a
nd
filtr
atio
n
Supp
ort o
f veg
etat
ion
2- Colfax, Scrub/Shrub/PAW 1 H M H H H H H M H H 4- Colfax, Agriculture 2 H L H M H M M L M H 5- Colfax, Parks 3 M L L M M M L L M H 8- Colfax, Flume Undeveloped 3 M L L M M M M L M M
9- Colfax, Open Space 4 M L M M M M L L L M 3- Colfax, Residential 5 L L L M M L L L L L 1- Colfax, Industrial/Commercial 6 L L L L L M L L L L
6- Colfax, Flume Commercial 7 L L L L L L L L L L 7- Colfax, Flume Residential 7 L L L L L L L L L L
Relative ranking order from highest to lowest function based on mean reach scores (L= Low function, M=Medium function, H= High function).

The Watershed Company and BERK August 2014
73
Palouse River – Colfax Scrub Shrub/PAW
Process/Function Notes
Hydrologic
Moderation of sediment transport
This reach has the highest performance of hydrologic functions relative to other City reaches because it lacks armoring, has substantial area of floodplain and floodway (~66% of the reach for both), and contains a wetland fringe. No unique in-stream features are present and the channel form is simple, although it does contain a floodway bench.
Development and maintenance of in-stream habitat features
Attenuating flow energy
Vegetation
LWD and organic matter recruitment
Again, relative to other City reaches, this reach rates the highest based on the structure and width of the riparian vegetation. While the floodway bench appears to be mostly herbaceous vegetation, the slope above the bench is vegetated with a mix of dense shrubs and small trees.
Filtration of upland inputs
Bank stabilization
Habitat
Wetland/riparian habitat Although this reach is uniquely vegetated, the upper limit of the reach is defined by a railroad. Aside from the floodway wetland, no PHS documentation or key habitats occur within the reach.
Space and conditions supporting wildlife, including PHS species
Hyporheic
Water storage, cool water refugia, and filtration
The reach is located over mapped alluvial soils, which, in combination with the riverine wetland, boosts the hyporheic function score because of its ability to store water and help support vegetation within the shoreline area.
Support of vegetation
Key Environmental or Land Use Factors Affecting Processes/Functions:
The proximity of the reach to intense development and alteration on the opposite bank, as well as the presence of the railroad at the upland edge of the reach, limits reach function.
Image Source: Google Earth

Final Whitman County Coalition Shoreline Analysis Report
74
Palouse River – Colfax Agriculture
Process/Function Notes
Hydrologic
Moderation of sediment transport
High function due to extensive floodplain. No armoring and low banks provide good connectivity to the floodplain. Significant wetland areas are found in the reach, as well as a few “islands” and some other channel complexity.
Development and maintenance of in-stream habitat features
Attenuating flow energy
Vegetation
LWD and organic matter recruitment
This reach is a mix of actively farmed lands, riparian areas with some alteration (network of mostly dirt paths), and what may be range lands that maintain sparse conifer forest. Approximately a third of the reach is mapped as wetland. While there are some more developed roadways along the reach, these are mostly set well back from the water.
Filtration of upland inputs
Bank stabilization
Habitat
Wetland/riparian habitat This reach contains a mix of habitats, including a variety of in-stream conditions (riffles, runs, side channels). Vegetation is highly variable depending on the character of the agricultural activity (farming, range). According to NWI mapping, approximately one-third of the reach is wetland. There is no PHS documentation.
Space and conditions supporting wildlife, including PHS species
Hyporheic
Water storage, cool water refugia, and filtration
The reach is located over mapped alluvial soils, which, in combination with the significant wetland areas, boosts the hyporheic function score because of its ability to store water and help support vegetation within the shoreline area.
Support of vegetation
Key Environmental or Land Use Factors Affecting Processes/Functions:
Agricultural uses and loss of riparian vegetation are the primary modifications to these reaches, as well as a network of dirt paths and roads.
Image Source: Google Earth
Image Source: Google Earth

The Watershed Company and BERK August 2014
75
Palouse River – Colfax Parks
Process/Function Notes
Hydrologic
Moderation of sediment transport
Approximately a third of the reach is mapped as floodplain. Although the mapping does not indicate this, the reach appears to be almost fully leveed, with stretches of rip rap armoring along the upper levee. Some wetland areas are mapped in the reach, as well as a few “islands” and some other channel complexity.
Development and maintenance of in-stream habitat features
Attenuating flow energy
Vegetation
LWD and organic matter recruitment
The river is flanked by a variable width band of dense herbaceous and shrubby vegetation, with a narrow strip of trees along the waterward edge of the golf course. McDonald Park is more limited in its shoreline vegetation, but there is still a narrower band of dense shrubby/herbaceous vegetation. The banks appear to be adequately stabilized, either by vegetation or stretches of riprap. It is unknown what treatments may be applied to the golf greens and ball fields, but the riparian strip likely provides some good filtration.
Filtration of upland inputs
Bank stabilization
Habitat
Wetland/riparian habitat The reach is compromised upland of the riparian strip by levee and some riprap armoring, and heavily altered golf course and ballfield maintained grass areas. According to NWI mapping, approximately one-third of the reach is wetland. There is no PHS documentation.
Space and conditions supporting wildlife, including PHS species
Hyporheic
Water storage, cool water refugia, and filtration
The reach is entirely located over mapped alluvial soils, which, in combination with the modest wetland areas, boosts the hyporheic function score because of its ability to store water and help support vegetation within the shoreline area.
Support of vegetation
Key Environmental or Land Use Factors Affecting Processes/Functions:
Maintained golf course and ballfields limit upland functions.
McDonald Park
Image Source: Google Earth

Final Whitman County Coalition Shoreline Analysis Report
76
Palouse River – Colfax Flume Undeveloped
and Colfax Open Space (Reaches 8 and 9)
Process/Function Notes
Hydrologic
Moderation of sediment transport
The portion of the reaches upstream of the flume is limited by sloped banks and levees (less levee in Reach 9), but the banks are also well vegetated which can help moderate flows before entering the flume.
Development and maintenance of in-stream habitat features
Attenuating flow energy
Vegetation
LWD and organic matter recruitment
Upstream of the flume, the banks are densely vegetated with trees and shrubs for a depth of approximately 50 feet before being interrupted by a road on the north side and 70-100 feet before being interrupted by development/alterations on the south side. This vegetation likely provides good filtration for any pollutant inputs, and maintains stable banks.
Filtration of upland inputs
Bank stabilization
Habitat
Wetland/riparian habitat The flume portion has no habitat benefits, but the upstream section between and upstream of the levees has a densely vegetated bank that provides habitat for birds and small mammals. There is no PHS documentation.
Space and conditions supporting wildlife, including PHS species
Hyporheic
Water storage, cool water refugia, and filtration
The concrete flume walls eliminate any potential for adjacent lands to perform hyporheic functions. Upstream of the flume, the presence of alluvial soils is modest but the banks lack armoring and are well-vegetated. Support of vegetation
Key Environmental or Land Use Factors Affecting Processes/Functions:
A portion of the reach is in the flume and the entire reach is bounded by levees and/or roads/development. These modifications limit performance of functions and processes.
Image Source: Google Earth

The Watershed Company and BERK August 2014
77
Palouse River – Colfax Residential
Process/Function Notes
Hydrologic
Moderation of sediment transport
This reach is flanked by levees, and a large portion is in a concrete flume or has concrete sidewalls. The levees and the concrete flume have a significant adverse effect on hydrologic function. Some functions are performed in the portions of the reach downstream and upstream of the flume where there are banks densely vegetated by herbaceous and shrubby vegetation.
Development and maintenance of in-stream habitat features
Attenuating flow energy
Vegetation
LWD and organic matter recruitment
Downstream and upstream of the flume, there is some in-channel and bank riparian vegetation – primarily weedy herbaceous and shrub. The banks are stabilized by concrete flume walls or concrete sidewalls, or vegetation upstream and downstream of the flume. This vegetation likely provides good filtration for any pollutant inputs.
Filtration of upland inputs
Bank stabilization
Habitat
Wetland/riparian habitat Again, the lining of the concrete channel eliminates any potential for stream-associated wetlands or meaningful riparian habitat in the flume portion. Downstream and upstream of the flume, densely vegetated banks and some riparian wetland provides habitat for birds and small mammals.
Space and conditions supporting wildlife, including PHS species
Hyporheic
Water storage, cool water refugia, and filtration
The concrete flume walls eliminate any potential for adjacent lands to perform hyporheic functions. Downstream and upstream of the flume, the presence of alluvial soils and well-vegetated banks indicate some hyporheic function.
Support of vegetation
Key Environmental or Land Use Factors Affecting Processes/Functions:
The flume and levees, as well as upland residential development, have a strong, adverse impact on processes and functions.
Image Source: Google Earth
Image Source: Google Earth

Final Whitman County Coalition Shoreline Analysis Report
78
Palouse River – Colfax Industrial/
Commercial
Process/Function Notes
Hydrologic
Moderation of sediment transport
This reach is flanked by levees, and more than half of the reach that includes the river itself is in a concrete flume or has concrete sidewalls. The levees and the concrete flume have a significant adverse effect on hydrologic function. Some functions are performed in the portion of the reach downstream of the flume where there are banks densely vegetated by herbaceous and shrubby vegetation.
Development and maintenance of in-stream habitat features
Attenuating flow energy
Vegetation
LWD and organic matter recruitment
Downstream of the flume, there is some in-channel and bank riparian vegetation – primarily weedy herbaceous and shrub. The banks are stabilized by concrete flume walls or concrete sidewalls on the north fork. Downstream, vegetation appears to be maintaining stable banks. This vegetation likely provides good filtration for any pollutant inputs.
Filtration of upland inputs
Bank stabilization
Habitat
Wetland/riparian habitat Again, the lining of the concrete channel eliminates any potential for stream-associated wetlands or meaningful riparian habitat in the flume portion. Downstream of the flume, densely vegetated banks and some riparian wetland provides habitat for birds and small mammals.
Space and conditions supporting wildlife, including PHS species
Hyporheic
Water storage, cool water refugia, and filtration
The concrete flume walls eliminate any potential for adjacent lands to perform hyporheic functions. Downstream of the flume, the presence of alluvial soils and well-vegetated banks indicate some hyporheic function. Support of vegetation
Key Environmental or Land Use Factors Affecting Processes/Functions:
The flume and levees, as well as upland commercial and industrial development, have a strong, adverse impact on processes and functions.
Image Source: Google Earth

The Watershed Company and BERK August 2014
79
Palouse River – Colfax Flume Commercial
and Flume Residential (Reaches 6 and 7)
Process/Function Notes
Hydrologic
Moderation of sediment transport
Reaches 6 and 7 have the lowest possible hydrologic function by virtue of being entirely lined with concrete. The bottom of the flume is flat, with a narrow low-flow channel and steeply sloped or vertical sides. There are no in-stream habitat features, wetlands, or other special habitat elements.
Development and maintenance of in-stream habitat features
Attenuating flow energy
Vegetation
LWD and organic matter recruitment
Reach 7 does have a limited fringe of sparse trees/shrubs and weedy vegetation along the flume margins. However the ability of any vegetation in the uplands to provide functions other than limited organic input (leaf drop) is extremely reduced as the runoff from pollution-generating surface typically passes into the stream directly via the stormwater system, rather than flowing through a buffer. The banks are stabilized by concrete flume walls.
Filtration of upland inputs
Bank stabilization
Habitat
Wetland/riparian habitat Again, the lining of the concrete channel eliminates any potential for stream-associated wetlands or meaningful riparian habitat. There is no PHS documentation.
Space and conditions supporting wildlife, including PHS species
Hyporheic Water storage, cool water refugia, and filtration
The concrete flume walls eliminate any potential for adjacent lands to perform hyporheic functions.
Support of vegetation
Key Environmental or Land Use Factors Affecting Processes/Functions:
The fenced concrete flume prevents performance of most ecological functions or natural processes.
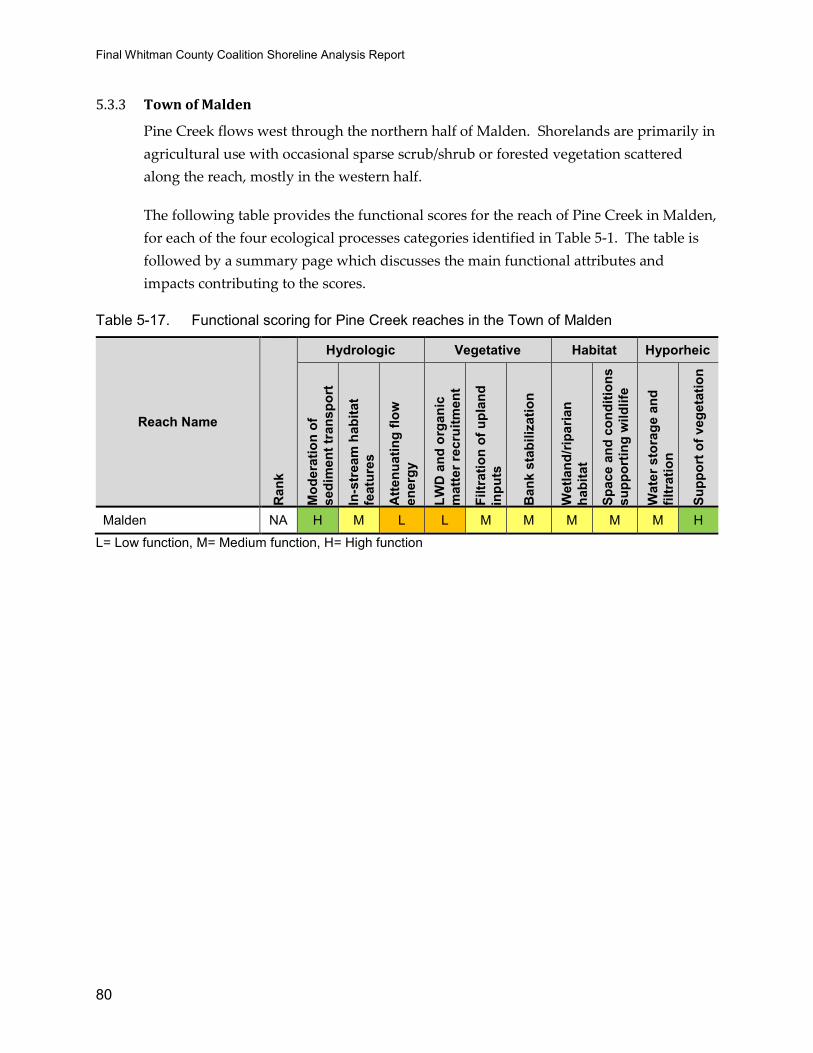
Final Whitman County Coalition Shoreline Analysis Report
80
5.3.3 Town of Malden
Pine Creek flows west through the northern half of Malden. Shorelands are primarily in
agricultural use with occasional sparse scrub/shrub or forested vegetation scattered
along the reach, mostly in the western half.
The following table provides the functional scores for the reach of Pine Creek in Malden,
for each of the four ecological processes categories identified in Table 5-1. The table is
followed by a summary page which discusses the main functional attributes and
impacts contributing to the scores.
Table 5-17. Functional scoring for Pine Creek reaches in the Town of Malden
Reach Name
Ran
k
Hydrologic Vegetative Habitat Hyporheic
Mod
erat
ion
of
sedi
men
t tra
nspo
rt
In-s
trea
m h
abita
t fe
atur
es
Atte
nuat
ing
flow
en
ergy
LWD
and
org
anic
m
atte
r rec
ruitm
ent
Filtr
atio
n of
upl
and
inpu
ts
Ban
k st
abili
zatio
n
Wet
land
/ripa
rian
habi
tat
Spac
e an
d co
nditi
ons
supp
ortin
g w
ildlif
e
Wat
er s
tora
ge a
nd
filtr
atio
n
Supp
ort o
f veg
etat
ion
Malden NA H M L L M M M M M H
L= Low function, M= Medium function, H= High function

The Watershed Company and BERK August 2014
81
Pine Creek- Malden
Process / Function Notes
Hydrologic
Moderation of sediment transport
Moderate to high function due to no armoring and moderate slopes however no floodplain is present. Wetland is present but no backwater areas or islands.
Development and maintenance of in-stream habitat features
Attenuating flow energy
Vegetation
LWD and organic matter recruitment
Generally a narrow band of dense herbaceous vegetation separates the channel from cultivated crops which dominate the shorelands. Trees or shrubs are occasionally present helping to provide bank stabilization.
Filtration of upland inputs
Bank stabilization
Habitat
Wetland/riparian habitat Moderate habitat function is present. No PHS documentation occurs within the reach however there is very little development and some wetland and riparian habitat is present. There is also undisturbed connectivity between the channel and evergreen forest located upslope.
Space and conditions supporting wildlife, including PHS species
Hyporheic
Water storage, cool water refugia, and filtration
The reach is located on shallow alluvial soils which increase the hyporheic function score because of their ability to store water and help support vegetation within the shoreline area. Some riverine wetlands are present to store and filter water.
Support of vegetation
Key Environmental or Land Use Factors Affecting Processes/Functions:
Agricultural uses are the main shoreline modifications in this reach.
Aerial view of reach through
north –central Malden
Detail of conditions Image Source: Google Earth

Final Whitman County Coalition Shoreline Analysis Report
82
5.3.4 Town of Rosalia
Pine Creek flows north through the western half of Rosalia. It then briefly enters
Spokane County before turning and continuing back southwest into Whitman County
toward Malden. This southwest flowing portion of Pine Creek shoreline jurisdiction
encompasses a small piece of the parcel containing the Town of Rosalia airport located
directly west of the Town. For the purposes of this analysis, this area is identified as
Reach 1, though it is not contiguous with the river channel. Its condition does affect the
function of the southwest flowing portion of Pine Creek, but a County reach separates
the Town jurisdiction from the channel. Three other reaches have been delineated,
numbered sequentially upstream, all within the northern flowing section of Pine Creek
within Rosalia city limits.
The following table provides the functional scores for each reach for each of the four
ecological processes categories identified in Table 5-1 and ranks the reaches according to
their overall functional score. The table is followed by summary pages which discuss
the main functional attributes and impacts contributing to the scores for Reaches 2, 3
and 4. (The small piece of the airport parcel (Reach 1) described above is not further
discussed).
Table 5-18. Functional scoring for Pine Creek reaches in the Town of Rosalia
Reach Number/ Name
Ran
k
Hydrologic Vegetative Habitat Hyporheic
Mod
erat
ion
of
sedi
men
t tra
nspo
rt
In-s
trea
m h
abita
t fe
atur
es
Atte
nuat
ing
flow
en
ergy
LWD
and
org
anic
m
atte
r rec
ruitm
ent
Filtr
atio
n of
upl
and
inpu
ts
Ban
k st
abili
zatio
n
Wet
land
/ripa
rian
habi
tat
Spac
e an
d co
nditi
ons
supp
ortin
g w
ildlif
e W
ater
sto
rage
and
fil
trat
ion
Supp
ort o
f veg
etat
ion
3- Rosalia, Residential/Open Space 1 H L H M M M L L M H
4- Rosalia, City Park 2 H L H L L L L L M H 2- Rosalia, Agriculture 3 H L H L L L L L M M 1- Rosalia, Airport* NA NA L L L NA L L M L
Relative ranking order from highest to lowest function based on mean reach scores (L= Low function, M=Medium function, H= High function). *reach only includes shorelands that are not contiguous with river

The Watershed Company and BERK August 2014
83
Pine Creek- Rosalia Residential/Open
Space (Reach 3)
Process / Function Notes
Hydrologic
Moderation of sediment transport
High function due to extensive floodplain (96.6% of reach) and floodway (30.7%). No armoring and moderate slopes provide good connectivity to the floodplain. However, no wetland or unique in-stream features are present and the channel form is simple.
Development and maintenance of in-stream habitat features
Attenuating flow energy
Vegetation
LWD and organic matter recruitment
Vegetation function is slightly higher in this reach than in Reaches 2 and 4 due to more shrubs and trees occasionally present in the shorelands and along stream banks. However, most of the shoreline vegetation consists of a narrow but dense band of herbaceous vegetation separating the channel from surrounding open space fields and residential development.
Filtration of upland inputs
Bank stabilization
Habitat
Wetland/riparian habitat Low habitat function is present. W 7th St. bisects the reach. Residential development and city roads are present particularly in the southern half of the reach. No PHS documentation occurs within the reach and no wetland habitat is mapped.
Space and conditions supporting wildlife, including PHS species
Hyporheic
Water storage, cool water refugia, and filtration
The reach is located on shallow alluvial soils which increase the hyporheic function score because of their ability to store water and help support vegetation within the shoreline area. Support of vegetation
Key Environmental or Land Use Factors Affecting Processes/Functions:
This reach is most impacted from development and roads, but also has the most woody vegetation present upland of the channel.
Image Source: Google Earth
Aerial view of
Residential/Open Space
Reach

Final Whitman County Coalition Shoreline Analysis Report
84
Pine Creek-Rosalia Agriculture & City Park
(Reaches 2 and 4)
Process / Function Notes
Hydrologic
Moderation of sediment transport
High function due to extensive floodplain and floodway in both reaches. No armoring and moderate slopes provide good connectivity to the floodplain. However, no wetland or unique in-stream features are present and the channel form is simple.
Development and maintenance of in-stream habitat features
Attenuating flow energy
Vegetation
LWD and organic matter recruitment
Vegetation function is slightly lower in these reaches than in Reach 3 due to the dominance of mowed fields and cultivated crops. Few shrubs and trees are present and there is little riparian vegetation separating the channel from surrounding uses.
Filtration of upland inputs
Bank stabilization
Habitat
Wetland/riparian habitat Low habitat function is present. No PHS documentation occurs within the reaches and no wetland habitat is mapped. The reaches are intersected by roads limiting connectivity to other habitat types. Reach 2 has impaired water quality and is on the 303(d) list for bacteria and dissolved oxygen.
Space and conditions supporting wildlife, including PHS species
Hyporheic
Water storage, cool water refugia, and filtration
Both reaches are located on shallow alluvial soils (Reach 4 has more than 2) which increase the hyporheic function score because of their ability to store water and help support vegetation within the shoreline area.
Support of vegetation
Key Environmental or Land Use Factors Affecting Processes/Functions: Agricultural uses and loss of riparian vegetation are the primary modifications to these reaches.
Typical Condition

The Watershed Company and BERK August 2014
85
5.3.5 City of Palouse
The Palouse River flows west from the Idaho border into the southeast corner of the City
of Palouse. It meanders north and continues flowing west through the center of the
City. For the purposes of this analysis five reaches have been delineated. Spatially
divergent portions of the shoreline jurisdiction with similar characteristics have been
aggregated together into one reach, for example, multiple open space areas are present
throughout the entire length of the river which have been joined together into one Open
Space reach (Reach 5). For descriptive purposes, reaches are numbered sequentially
upstream from where the first instance of that reach type occurs.
The following table provides the functional scores for each reach for each of the four
ecological processes categories identified in Table 5-1 and ranks the reaches according to
their overall functional score. Reach 3 is a residentially zoned and developed shoreland
area that is separated from the river channel by a small arm of Reach 5. Therefore, not
all functions were applicable and it is not ranked along with the others. The table is
followed by summary pages which discuss the main functional attributes and impacts
contributing to the scores for similarly functioning reaches.
Table 5-19. Functional scoring for Palouse River reaches in the City of Palouse
Reach Number/ Name
Ran
k
Hydrologic Vegetative Habitat Hyporheic
Mod
erat
ion
of
sedi
men
t tra
nspo
rt
In-s
trea
m h
abita
t fe
atur
es
Atte
nuat
ing
flow
en
ergy
LWD
and
org
anic
m
atte
r rec
ruitm
ent
Filtr
atio
n of
upl
and
inpu
ts
Ban
k st
abili
zatio
n
Wet
land
/ripa
rian
habi
tat
Spac
e an
d co
nditi
ons
supp
ortin
g w
ildlif
e
Wat
er s
tora
ge a
nd
filtr
atio
n
Supp
ort o
f veg
etat
ion
5- City of Palouse, Open Space 1 M M M H H H M H M M
1- City of Palouse, Agriculture 2 H M H M L M M M M H
2- City of Palouse, Industrial 3 M L M L M H L L L H
4- City of Palouse, Commercial 4 M L M L L M L L L L
3- City of Palouse, Residential - M M M M M NA* M L M L
Relative ranking order from highest to lowest function based on mean reach scores (L= Low function, M=Medium function, H= High function). *Reach is not contiguous with stream bank, separated by a small piece of Reach 5

Final Whitman County Coalition Shoreline Analysis Report
86
City of Palouse, Open Space and
Agriculture (Reaches 1 and 5)
Process / Function Notes
Hydrologic
Moderation of sediment transport
Hydrologic function is highest in Reach 1 which includes 89% active floodplain and 38% floodway. Less, though still significant floodplain and floodway are present in Reach 5. Little or no armoring and moderate slopes provide good connectivity to the floodplain. Some wetland, islands and backwater areas are also present, predominantly in Reach 5.
Development and maintenance of in-stream habitat features
Attenuating flow energy
Vegetation
LWD and organic matter recruitment
Vegetation function is highest in Reach 5 which has areas of dense riparian forested vegetation. Function is lower in Reach 1 which is dominated by cultivated crops and has limited areas of vegetation capable of providing filtration functions. However, the majority of shorelands in Reach 1 are vegetated compared to the other, more developed city reaches.
Filtration of upland inputs
Bank stabilization
Habitat
Wetland/riparian habitat
Generally moderate habitat function is present, with some relatively high function in Reach 5. No PHS documentation occurs within the reach and only a minimal amount of wetland habitat is mapped. However, minimal development is present and more vegetated riparian corridor compared to the other reaches.
Space and conditions supporting wildlife, including PHS species
Hyporheic
Water storage, cool water refugia, and filtration
Shallow alluvial soils are mapped throughout portions of both reaches which, together with undeveloped open space, moderate slopes and wetland, provide moderate to high hyporheic function.
Support of vegetation
Key Environmental or Land Use Factors Affecting Processes/Functions: Agriculture and roads are the primary modifications to these reaches. Some small areas of development are also present
Image Source: Google Earth
Reach 1, Open Space

The Watershed Company and BERK August 2014
87
City of Palouse, Industrial and Commercial
(Reaches 2 and 4)
Process /Function Notes
Hydrologic
Moderation of sediment transport
Floodplain and floodway are present within both reaches. Banks are moderately sloped but generally vegetated. Little wetland is present and channel has a simple form through these reaches with no backwater areas or islands. Three overwater structures are present in Reach 4 and one in Reach 2.
Development and maintenance of in-stream habitat features
Attenuating flow energy
Vegetation
LWD and organic matter recruitment
The banks of Reach 2 are quite well vegetated with trees and shrubs; however, the shorelands upland are almost all developed with industrial uses. Reach 2 is also predominantly developed with a narrow band of shoreline vegetation separating the channel from the development.
Filtration of upland inputs
Bank stabilization
Habitat
Wetland/riparian habitat
Low habitat function is present. No PHS documentation occurs within the reach and only a minimal amount of wetland habitat is mapped. Reaches are predominantly and corridors from the stream channel to other habitat types are impaired by development.
Space and conditions supporting wildlife, including PHS species
Hyporheic
Water storage, cool water refugia, and filtration
Low hyporheic function is present. Alluvial soils are mapped in Reach 2 which could support shoreline vegetation and filtration functions however the majority of the reach is impervious surface.
Support of vegetation
Key Environmental or Land Use Factors Affecting Processes/Functions: These reaches are the most modified and lowest functioning due to commercial and industrial development.
Reach 4, Commercial
Reach 2, Industrial
(South side of river)
Image Source: Google Earth

Final Whitman County Coalition Shoreline Analysis Report
88
City of Palouse, Residential (Reach 3)
Process/Function Notes
Hydrologic
Moderation of sediment transport
This reach is 100% within the active floodplain of the river. A little over 4% of the reach is also identified as floodway. The reach is not directly contiguous with the channel however the narrow portion of Reach 5 which connects the two has similar conditions and currently provides connectivity between the channel and Reach 3.
Development and maintenance of in-stream habitat features
Attenuating flow energy
Vegetation
LWD and organic matter recruitment
While this reach is predominantly developed with residential lots, 42% of the landcover is identified as developed open space. Trees and shrubs area present throughout the residential development providing a source of LWD and organic matter and helping filter inputs from the development.
Filtration of upland inputs
Bank stabilization
Habitat
Wetland/riparian habitat Generally low habitat function is present, though relative to Reaches 2 and 4 some habitat is provided by the forested and scrub/shrub vegetation present and the corridor it provides to the stream channel. No PHS documentation occurs within the reach and no wetland is mapped.
Space and conditions supporting wildlife, including PHS species
Hyporheic Water storage, cool water refugia, and filtration
Virtually no alluvial soils and no wetland are mapped within this reach, however some vegetation is supported near the top of the stream bank.
Support of vegetation
Key Environmental or Land Use Factors Affecting Processes/Functions: Residential development is the primary modification in this reach. It is entirely located within floodplain.
Image Source: Google Earth
Approximate reach
boundary (not adjacent to
stream bank)

The Watershed Company and BERK August 2014
89
5.3.7 City of Pullman
The South Fork of the Palouse River flows northwest through the City. The first two
reaches heading upstream (Industrial and Commercial/Business District) pass through
the most developed areas of the town, with a number of crossings, narrower riparian
corridor, and high impervious surface. The next reach (Parks) contains more open
space, active recreational lands, and scattered pockets of more intense commercial
development. The most upstream reach is South Commercial. Similar to the Industrial
reach, this reach has some intense commercial developments, but these are separated
from the stream by wider riparian corridors generally. The Residential reach is
composed of a number of scattered segments, most of which do not directly abut the
river, but are separated from the river by other reaches.
Table 5-20, below, provides a summary of functional ranking of reaches on the South
Fork Palouse River in the City of Pullman.
Table 5-20. Functional scoring for Palouse River reaches in the City of Pullman
Reach Number/ Name
Ran
k
Hydrologic Vegetative Habitat Hyporheic
Mod
erat
ion
of s
edim
ent
tran
spor
t
In-s
trea
m h
abita
t fe
atur
es
Atte
nuat
ing
flow
ene
rgy
LWD
and
org
anic
mat
ter
recr
uitm
ent
Filtr
atio
n of
upl
and
inpu
ts
Ban
k st
abili
zatio
n
Wet
land
/ripa
rian
habi
tat
Spac
e an
d co
nditi
ons
supp
ortin
g w
ildlif
e
Wat
er s
tora
ge a
nd
filtr
atio
n
Supp
ort o
f veg
etat
ion
3- Pullman, Parks 1 M L H H M M H H H H 5- Pullman, Residential* 1 H L H H M H M M H H 4- Pullman, South Commercial 2 M L H M M M M L H H
1- Pullman, Industrial 3 M L H L M M L L M M 2- Pullman, Commercial/Business District 4 L L L M M M M L L L
Reach ranking order from highest to lowest function for South Fork Palouse River reaches in the City of Pullman based on mean reach scores (L= Low function, M=Medium function, H= High function). * Completed for the portion of the reach that is contiguous with the River.

Final Whitman County Shoreline Analysis Report
90
Palouse River – Pullman South Commercial
Process/Function Notes
Hydrologic
Moderation of sediment transport
This reach has a mix of hydrologic functions. While the presence of armoring appears to be limited to road and trail crossing areas and the stream has good connectivity to significant floodplain and floodway, the channel still lacks complexity with no backwater areas or islands.
Development and maintenance of in-stream habitat features
Attenuating flow energy
Vegetation
LWD and organic matter recruitment
Although much of the reach area is altered, most of the stream length in the reach has a modest riparian area of herbaceous, shrubby and scattered tree vegetation. The vegetation appears to be maintaining stable banks.
Filtration of upland inputs
Bank stabilization
Habitat
Wetland/riparian habitat There are no mapped wetlands within the reach, and the riparian area is flanked on either side by railroad, pedestrian trail, paved roads, or intense development. The stream corridor likely has limited use for smaller mammals, birds and other urban wildlife.
Space and conditions supporting wildlife, including PHS species
Hyporheic
Water storage, cool water refugia, and filtration
The reach is located over mapped alluvial soils, and the banks are generally not armored except likely at crossings. Vegetation support appears to be good except where development is located. Support of vegetation
Key Environmental or Land Use Factors Affecting Processes/Functions:
The reach is closely bounded by railroad, trails, roads and other development.
Image Source: Google Earth

The Watershed Company and BERK August 2014
91
Palouse River – Pullman Parks
Process/Function Notes
Hydrologic
Moderation of sediment transport
Some of the banks have some rock armoring, but this does not appear to be a consistent feature. More than three-quarters of the reach is floodplain. No armoring or levees and low banks in most places provide good connectivity to the floodplain. Although no wetlands are mapped in the reach, riverine wetland was observed on the west side of the stream west of the ball fields.
Development and maintenance of in-stream habitat features
Attenuating flow energy
Vegetation
LWD and organic matter recruitment
The river is flanked by a variable width band of dense herbaceous, shrubby and tree vegetation, including a mix of deciduous and coniferous species (narrower in general on the side closest to park). The banks appear to be adequately stabilized in most places by vegetation. It is unknown what treatments may be applied to the ball fields and other formal park areas, but the riparian strip likely provides some good filtration.
Filtration of upland inputs
Bank stabilization
Habitat
Wetland/riparian habitat Relative to the other reaches, the area contains substantial riparian vegetation (much of it dense) and open spaces that may provide habitat for a variety of wildlife. As mentioned, wetland presence seems very likely. Some spotty but intense development is also present in the reach, but the riparian corridor is generally unbroken except for crossings.
Space and conditions supporting wildlife, including PHS species
Hyporheic
Water storage, cool water refugia, and filtration
The reach is almost entirely located over mapped alluvial soils, which, in combination with the likely wetland areas, boosts the hyporheic function score because of its ability to store water and help support vegetation. Support of vegetation
Key Environmental or Land Use Factors Affecting Processes/Functions:
Intensive recreational uses and related modifications outside of the riparian buffer affect function performance.
Downstream of E Main St. West of City Playfields
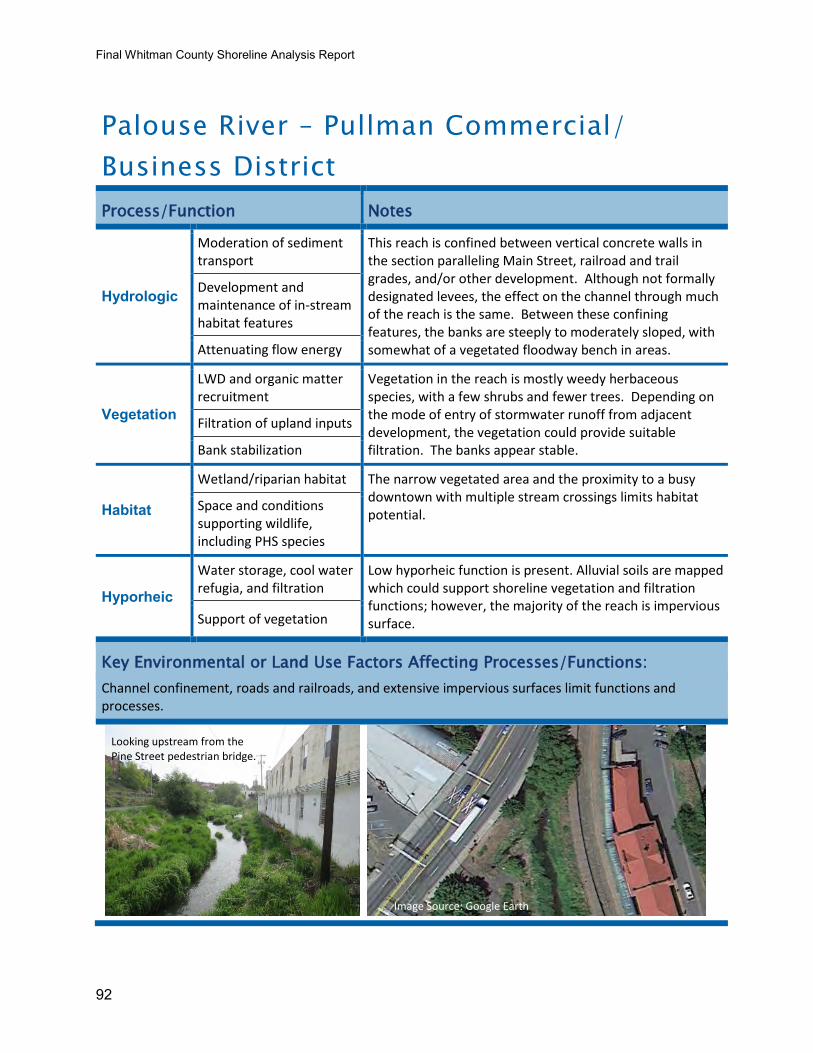
Final Whitman County Shoreline Analysis Report
92
Palouse River – Pullman Commercial/
Business District
Process/Function Notes
Hydrologic
Moderation of sediment transport
This reach is confined between vertical concrete walls in the section paralleling Main Street, railroad and trail grades, and/or other development. Although not formally designated levees, the effect on the channel through much of the reach is the same. Between these confining features, the banks are steeply to moderately sloped, with somewhat of a vegetated floodway bench in areas.
Development and maintenance of in-stream habitat features
Attenuating flow energy
Vegetation
LWD and organic matter recruitment
Vegetation in the reach is mostly weedy herbaceous species, with a few shrubs and fewer trees. Depending on the mode of entry of stormwater runoff from adjacent development, the vegetation could provide suitable filtration. The banks appear stable.
Filtration of upland inputs
Bank stabilization
Habitat
Wetland/riparian habitat The narrow vegetated area and the proximity to a busy downtown with multiple stream crossings limits habitat potential.
Space and conditions supporting wildlife, including PHS species
Hyporheic
Water storage, cool water refugia, and filtration
Low hyporheic function is present. Alluvial soils are mapped which could support shoreline vegetation and filtration functions; however, the majority of the reach is impervious surface. Support of vegetation
Key Environmental or Land Use Factors Affecting Processes/Functions:
Channel confinement, roads and railroads, and extensive impervious surfaces limit functions and processes.
Looking upstream from the Pine Street pedestrian bridge.
Image Source: Google Earth

The Watershed Company and BERK August 2014
93
Palouse River – Pullman Industrial
Process/Function Notes
Hydrologic
Moderation of sediment transport
No obvious indicators of levees or armoring were noted immediately adjacent to the channel. There appear to be some minor backwater/side-channels/wetland patches along the corridor, and a well-connected floodway and floodplain.
Development and maintenance of in-stream habitat features
Attenuating flow energy
Vegetation
LWD and organic matter recruitment
Vegetation in the reach is mostly weedy herbaceous species, with scattered patches of shrubs and a few trees. Where the variable width band of vegetated is wider, it likely provides good filtration of runoff from adjacent disturbed industrial areas. The banks appear stable.
Filtration of upland inputs
Bank stabilization
Habitat
Wetland/riparian habitat The riparian corridor is very narrow in places, but widens to over 100 feet in a few areas. However, much of it is herbaceous and shrubby, which limits habitat value, or is located upland of an intervening road or railroad. The lack of cover between the stream and the adjacent land uses is also limiting.
Space and conditions supporting wildlife, including PHS species
Hyporheic
Water storage, cool water refugia, and filtration
About half of the reach is mapped as alluvial soils, which could support shoreline vegetation and filtration functions. Lack of armoring and presence of hydric soils also supports hyporheic function. Support of vegetation
Key Environmental or Land Use Factors Affecting Processes/Functions:
Agricultural uses and alteration of riparian vegetation are the primary modifications to these reaches.
Image Source: Google Earth

Final Whitman County Shoreline Analysis Report
94
Palouse River – Pullman Residential
Process/Function Notes
Hydrologic
Moderation of sediment transport
No obvious indicators of armoring were noted in the aerial photographs, and the slopes appear shallow to moderate. Vegetation is generally dense trees and shrubs, varying from 25-50+ feet wide, in the floodplain. The stream appears to lack channel form complexity.
Development and maintenance of in-stream habitat features
Attenuating flow energy
Vegetation
LWD and organic matter recruitment
The river is flanked by a variable width band of dense shrub and tree vegetation. No obvious indicators of armoring were noted in the aerial photographs, and the banks appear to be adequately stabilized by vegetation. The riparian vegetation likely provides good filtration.
Filtration of upland inputs
Bank stabilization
Habitat
Wetland/riparian habitat Relative to the other City reaches, the area contains substantial riparian vegetation (much of it dense) and open spaces that may provide habitat for a variety of wildlife. There is no wetland mapping in this reach, but wetland presence seems very likely. Some spotty but intense development is also present in the reach, but the riparian corridor is generally unbroken except for crossings.
Space and conditions supporting wildlife, including PHS species
Hyporheic
Water storage, cool water refugia, and filtration
The reach is almost entirely located over mapped alluvial soils, which, in combination with the likely wetland areas, boosts the hyporheic function score because of its ability to store water and help support vegetation. Support of vegetation
This functional characterization applies only to the portion of the reach that is contiguous with the river, mostly west of the City playfield. This piece of the reach is zoned Residential, but has very little residential development.
Key Environmental or Land Use Factors Affecting Processes/Functions:
Loss of riparian vegetation in the southern part of the reach and other development adversely affects function performance.
Image Source: Google Earth

The Watershed Company and BERK August 2014
95
5.3.8 City of Tekoa
Hangman Creek flows northwest through the City of Tekoa in the northwest corner of
the County. For the purposes of this analysis four reaches were delineated, numbered
sequentially upstream. Reach 1 is a rural residential area with the highest function
relative to the other reaches. Reach 2 is the lowest functioning reach which consists of a
commercial and urban residential area. Reach 3 is the open space meanders in the
southern end of the City. Reach 4 is an associated floodplain/floodway reach adjacent to
the tributary to Hangman Creek near Highway 274.
The following table provides the functional scores for each reach for each of the four
ecological processes categories identified in Table 5-1 and ranks the reaches according to
their overall functional score. The table is followed by summary pages which discuss
the main functional attributes and impacts contributing to the scores for similarly
functioning reaches.
Table 5-21. Functional scoring for Hangman Creek reaches in the City of Tekoa
Reach Number/ Name
Ran
k
Hydrologic Vegetative Habitat Hyporheic
Mod
erat
ion
of
sedi
men
t tra
nspo
rt
In-s
trea
m h
abita
t fe
atur
es
Atte
nuat
ing
flow
en
ergy
LWD
and
org
anic
m
atte
r rec
ruitm
ent
Filtr
atio
n of
upl
and
inpu
ts
Ban
k st
abili
zatio
n
Wet
land
/ripa
rian
habi
tat
Spac
e an
d co
nditi
ons
supp
ortin
g w
ildlif
e
Wat
er s
tora
ge a
nd
filtr
atio
n
Supp
ort o
f veg
etat
ion
1- Tekoa, Rural Residential 1 H H H H H M H M M H
3- Tekoa, Open Space 2 H M M M M M M M M H 4- Tekoa, Floodway 3 H H M M L M M L M H 2- Tekoa, Urban Residential/Commercial 4 H L L L L M L L L H
Relative ranking order from highest to lowest function based on mean reach scores (L= Low function, M=Medium function, H= High function).

Final Whitman County Shoreline Analysis Report
96
Tekoa, Rural Residential and Open Space
(Reaches 1 and 3)
Process Function Notes
Hydrologic
Moderation of sediment transport
Moderate to high hydrologic function. No armoring is present and good connectivity exists between the channel and extensive floodplain. Reach 1 has the highest function due to the greatest amount of floodway and wetland present. Both reaches have some vegetated riparian areas helping to slow and disperse flood flows.
Development and maintenance of in-stream habitat features
Attenuating flow energy
Vegetation
LWD and organic matter recruitment
Relatively moderate to high vegetation function is present. Both reaches have some Evergreen Forest land cover and less developed areas than the other city reaches. An area of narrow but dense herbaceous vegetation is present along the channel with occasional shrubs and trees providing filtration and stabilization functions. Reach 1 has the broadest band of riparian vegetation of the city reaches, followed by Reach 3.
Filtration of upland inputs
Bank stabilization
Habitat
Wetland/riparian habitat Habitat function is highest in these reaches. The least amount of development is present and the riparian corridor provides some connectivity between habitat types including forested areas. No PHS regions are documented.
Space and conditions supporting wildlife, including PHS species
Hyporheic
Water storage, cool water refugia, and filtration
Low percentages of wetland are present but predominantly undeveloped shoreland, moderately slopes banks with little armoring and extensive areas of alluvial soil provide moderate to high hyporheic function. Support of vegetation
Key Environmental or Land Use Factors Affecting Processes/Functions: These reaches are the highest functioning of the Tekoa reaches. The forested areas of Reach 1 and undeveloped open space in Reach 2 contribute to the higher functional scores.
Aerial view of Reach 3
Image Source: Google Earth

The Watershed Company and BERK August 2014
97
Tekoa, Floodway (Reach 4)
Process Function Notes
Hydrologic
Moderation of sediment transport
Moderate to high hydrologic function. Some armoring is present along the tributary associated with this reach which consist of floodplain and floodway hydrologically connected to Hangman Creek.
Development and maintenance of in-stream habitat features
Attenuating flow energy
Vegetation
LWD and organic matter recruitment
Relatively low to moderate vegetation function is present. Some industrial development is present along with agricultural fields and roads. Limited shrub or forested vegetation and a very narrow band of riparian herbaceous vegetation is present which limits filtration function and organic matter recruitment.
Filtration of upland inputs
Bank stabilization
Habitat
Wetland/riparian habitat Low to moderate relative habitat function is present. Some wetland is mapped but surrounding development limits habitat connectivity. No PHS regions are documented.
Space and conditions supporting wildlife, including PHS species
Hyporheic Water storage, cool water refugia, and filtration
Extensive areas of alluvial soil provide hyporheic function but little wetland, impervious roads and other development limit water storage and filtration functions.
Support of vegetation
Key Environmental or Land Use Factors Affecting Processes/Functions: This reach is floodway associated with the Hangman Creek channel. It is contiguous to a tributary and is hydrologically connected to Hangman Creek. Industrial areas, farm land and roads dominate the land use.
Tekoa Floodway
Image Source: Google Earth

Final Whitman County Shoreline Analysis Report
98
Tekoa, Urban Residential/Commercial
(Reach 2)
Process Function Notes
Hydrologic
Moderation of sediment transport
Floodplain is present but less than in the other city reaches. Floodway is also present. Less than 1% of the reach is mapped as wetland and no unique in stream features exist.
Development and maintenance of in-stream habitat features
Attenuating flow energy
Vegetation
LWD and organic matter recruitment
Low vegetation function is present overall. The dominate land cover is developed, low intensity. Some trees and shrubs are present but are predominantly in a developed residential area, and are separated from the stream bank by Water Street.
Filtration of upland inputs
Bank stabilization
Habitat
Wetland/riparian habitat Low habitat function is present. No PHS regions are documented. Water Street runs parallel to the western bank of the stream. There is some connectivity to other habitat types through the stream corridor to the north but surrounding development and limited vegetation decrease this function.
Space and conditions supporting wildlife, including PHS species
Hyporheic
Water storage, cool water refugia, and filtration
Extensive areas of alluvial soils are mapped which could help support shoreline vegetation, however little wetland, impervious roads and other development limit water storage and filtration functions. Support of vegetation
Key Environmental or Land Use Factors Affecting Processes/Functions: Functions are lowest in this reach which has little vegetation present overall, a limited riparian area and shorelands that are dominated by residential and commercial development.
Image Source:
Google Earth

The Watershed Company and BERK August 2014
99
5.4 Restoration Opportunities
5.4.1 County- and City-wide
Some of the primary issues affecting the region’s streams and waterbodies that may be
addressed with restoration or protection include: (1) habitat degradation with the
alteration of riparian zones and conversion of small channels to drainage ditches,
(2) poor water quality where fecal coliform bacteria, nutrient levels, and water
temperatures often exceed Washington state standards, and (3) soil erosion from storm
water runoff with the conversion to agriculture. In the Palouse River basin, land use
changes have led to the loss of most of the basin’s riparian habitat and wetlands
contributing to erosion, increased sedimentation, and higher water temperatures (HDR
and EES 2007). Water quality concerns are primarily from non-point sources, including:
erosion, livestock, fertilizers, and septic systems (HDR and EES 2007). In the Middle
Snake River Watershed, restoration goals are often aimed at achieving healthy,
sustainable, and harvestable salmonid populations.
Table 5-22 highlights potential restoration opportunities for the Palouse River, Middle
Snake River, and Hangman Creek Watersheds. While many of these items are more
applicable to the unincorporated areas of the County, many of them are also universally
applicable in the Cities and Towns as well.
Table 5-22. Documented Restoration Opportunities in Whitman County
Actions/Waterbody Benefit Source Palouse River Watershed
Implement habitat improvement projects involving construction or placement of instream structures
water quality, streambank stabilization
Palouse Watershed Plan 2007
Implement habitat improvement projects involving out-of-stream riparian restoration or enhancement
stream temperature, water quality, streambank stabilization
Palouse Watershed Plan 2007
Move river dikes back from existing river channels to allow for floodplain restoration and channel maintenance
Instream flow, habitat enhancement
Palouse Watershed Plan 2007
Relocate campgrounds further from stream edges where assessments show potential for erosion and other adverse effects
Streambank stabilization
Palouse Watershed Plan 2007

Final Whitman County Shoreline Analysis Report
100
Actions/Waterbody Benefit Source
Manage grazing in riparian areas by installing livestock exclusion fencing and off-stream watering
water quality, streambank stabilization
HDR and EES 2007
Work with individual landowners to review pesticide and fertilizer use, and to implement the following best management practices to limit water quality impacts: 1. Manage Sprague Lake inputs to reduce nutrient loading; 2. Enhance riparian areas; 3. Urban/rural education program; 4. Conservation tillage
Water quality Palouse Watershed Plan 2007
Middle Snake River Watershed
Near Shore Assessment WRIA 35 – Investigate alternatives for modifying near shore habitat in the Snake River Reservoirs to benefit salmonids survival.
Habitat improvement
Snake River Salmon Recovery Board
Head Cut Barrier Removal (Alkali Creek) (35-00133) - Investigate the severity of the fish barrier and determine a project design to rectify passage issues.
Barrier removal
Snake River Salmon Recovery Board
Palouse Prairie Protection (32-00161) – protect native wet uplands through fencing or conservation agreements; restoration through digging or plugging old drain ditches no longer in use
watershed retention, reduce sediment routing
Snake River Salmon Recovery Board
Hangman (Latah) Creek Watershed
Restore buffer of mature riparian vegetation to reduce heat loads on the stream
stream temperature, water quality, streambank stabilization
Hangman Creek TMDL
Install livestock exclusion fencing and off-stream watering
stream temperature, water quality, streambank stabilization
Hangman Creek TMDL
5.4.2 City of Palouse
The City of Palouse’s Comprehensive Plan (2014) identifies a number of strategies to
improve environmental conditions within the City, including the following:
Preserve natural areas through conservation easements, land acquisition and land
swaps, designation of some areas as “critical wildlife habitat conservation areas,”
and using a Conservation Land Trust to acquire and manage natural areas.
Planting native riparian vegetation along the Palouse River streambanks.

The Watershed Company and BERK August 2014
101
In pursuit of improved water quality and to reduce flooding, “develop partnerships
with upstream parties to improve upriver watershed management.”
⁻ Implement and enforce North Fork Palouse River Water Quality Improvement
Plan
⁻ Reduce soil erosion by requiring property owners to control storm run-off to a
level that prevents soil erosion on their property.
⁻ Encourage native plantings when possible.
5.4.3 City of Pullman
The City of Pullman’s Comprehensive Plan (1999) includes a specific goal and policies that
would contribute significantly to improvements in ecological function in the City:
“GOAL P4: Complete and protect a system of green belts, centered on streams and
wildlife corridors, to protect natural resources and provide passive recreation.
Policy P4.1: Attempt to restore the South Fork of the Palouse River to a more natural
appearance and function.
Policy P4.2: Protect riparian corridors along perennial streams from the adverse
effects of development. Maintain a buffer of vegetation (preferably native
vegetation) along all streams.
Policy P4.3: Whenever possible, establish greenways to link open space areas located
in close proximity to one another.”
The Plan contains other goals and policies that support acquisition of habitat areas,
setting back developments from the water’s edge, and working with property owners to
preserve and enhance riparian areas.
Stream restoration is also ongoing in the City through the Palouse-Clearwater
Environmental Institute (PCEI). A long stretch of the South Fork adjacent to the City
Playfields has been enhanced with native vegetation and banks stabilized with coir
fabric “logs” to help minimize erosion. PCEI also organizes an annual spring stream
cleanup activity for volunteers. At present, there are also 13 stream segments in the
City, including South Fork Palouse River and tributary streams, that are sponsored by
different organizations or families under the Adopt-A-Stream program.

Final Whitman County Shoreline Analysis Report
102
6 LAND USE ANALYSIS
6.1 County
6.1.1 Lakes
Land Use Pattern
There are ten lakes in Whitman County that meet the criteria as Shorelines of the State.
They include: Alkali Lake, Bonnie Lake, Crooked Knee Lake, Duck Lake, Folsom Lake,
Lavista Lake, Rock Lake, Sheep Lake, Stevens Lake, Texas Lake and Tule Lake. The
County’s lakes are located in relatively remote locations in the western and
northwestern portion of the County, and are fairly homogenous in terms of shoreline
land use. For this reason, they are analyzed together in this section. The total shoreline
jurisdiction around the lakes is 1,190 acres.
Agriculture is the dominant shoreline land use within the jurisdiction of all of the
County’s shoreline lakes. Open space (classified under 84.34 RCW) is the only other
current land use identified within the lake shorelines. The classified open space is
located along Rock Lake, which is the largest lake in the County. See Appendix D for
summary tables of zoning and current land use by lake and reach.
Existing and Planned Land Uses
All of the lakes’ shorelines are within unincorporated Whitman County and are zoned
Agriculture under the County’s zoning code. Roughly two thirds (67%) of the shoreline
jurisdiction of the County’s lakes is privately owned. Approximately 389 acres (33%) of
the shoreline area are publicly owned. These publicly owned lake shorelines are
presented in Table 6-1.
Table 6-1. Publicly Owned Whitman County Lake Shorelines
Lake Total
Shoreline Area (acres)
Publicly Owned
Shoreline Area (acres)
Owner Percent of Shoreline Jurisdiction
Alkali Lake 40 40 Bureau of Reclamation 100
Folsom Lake 131 131 State Parks and Recreation Commission 100
Rock Lake 467 184 Bureau of Reclamation 39
Tule Lake 34 9 25
Bureau of Reclamation Department of Natural Resources
27 73

The Watershed Company and BERK August 2014
103
The current shoreline environment designation for all of the lakes except Rock Lake is
Rural. According to the current (1974) Shoreline Management Master Program, the
Rural designation is intended “to protect agricultural land from urban expansion,
restrict intensive development along undeveloped shorelines functions as a buffer
between urban areas, and maintain open spaces and opportunities for recreational uses
compatible with agricultural uses.”
Rock Lake is designated Conservancy. The purpose of the Conservancy designation is
“to protect, conserve and manage existing natural resources and valuable historic and
cultural areas in order to ensure a continuous flow of recreational benefits to the public
and to achieve sustained resource utilization.”
Potential New Development and Uses
The majority of lands within the County’s lake shorelines are in agricultural use.
Existing structures may be repaired, but the overall trend for shoreline use along the
lakes is likely to remain agricultural. The County’s Parks and Recreation Master Plan
(2004) contains several recommended recreational improvements (see Public Access
discussion below), some of which may occur during the planning horizon of this SMP
(20 years). No other planned future uses have been identified.
Water-oriented Use
Water-oriented uses along the lake shorelines are limited to agriculture and public
access. Nearly all of the shorelines are currently identified as being in agricultural use.
The public access sites listed below (see Public Access) are also considered water-
oriented. Recreational activities such as fishing, swimming, and boating (motorized and
non-motorized) that occur on the lakes are considered water-oriented.
Transportation and Utilities
In general, there is limited road or transportation infrastructure within the shoreline
jurisdiction of the County’s lake shorelines. Folsom Lake and Lavista Lake have
minimal rail infrastructure within shoreline jurisdiction, all of which are abandoned rail.
Folsom Lake has 0.04 mile of abandoned rail in shoreline jurisdiction.
Most lakes have no road infrastructure within shoreline jurisdiction. There is 0.11 mile
of road infrastructure within shoreline jurisdiction of Rock Lake, and 0.41 mile of road
infrastructure within shoreline jurisdiction of Sheep Lake. The majority of roads are
classified as rural local access roads. Major roads include State Highway 23, which
crosses Crooked Knee Lake.

Final Whitman County Shoreline Analysis Report
104
There are two identified bridges within shoreline jurisdiction.
1. State Highway 23 crosses Crooked Knee Lake
2. Rock Lake Road crosses Rock Lake
Public Access
Current Parks and Public Open Space
Given the generally high amount of lake shoreline in the County, there are only a few
established public access facilities. The John Wayne Trail extends along Rock Creek,
Lavista Lake, Rock Lake, and Pine Creek, and offers visual and physical access to those
waterbodies. Most of the publicly owned lands listed above are available for public use.
There is a public access site and informal boat launch and parking area at the southern
end of Rock Lake.
Future Public Access
The County’s Parks and Recreation Comprehensive Plan (2004) notes several
deficiencies in shoreline recreational opportunities and offers recommendations. It notes
that the western portion of the County and the northwest section in particular have a
lack of recreation facilities. It also notes that, to date, public access to Rock Lake and
Bonnie Lake is limited. Access is available due to willingness of land owners to allow
use of their lands by permission and, previously, by lease agreement at the southern end
of Rock Lake. The Plan suggests that efforts be made to establish more public access to
Rock Lake and Bonnie Lake. The Plan also includes the following implementation
action related to the lakes:
1. Strive to insure public access to Rock Lake and Bonnie Lake.
Historic and Archeological Sites
According to available data, there are no historic or archeological sites within the
shoreline reaches of lakes in unincorporated Whitman County.
6.1.2 Palouse River
This section addresses both the Palouse River and the North Fork Palouse River. The
Palouse River flows across Whitman County from east to west. At the west side of the
County, the river turns south forming the County’s southwest border and flows into the
Snake River. The Palouse River flows through the Cities of Palouse and Colfax (along
the North Fork), but this section deals with the portion in the unincorporated County.
There are very few uses or structures within the river and its shorelines. It is heavily
leveed through Colfax (see Section 6.3).

The Watershed Company and BERK August 2014
105
The vast majority of the Palouse River shoreline jurisdiction is currently used for
agriculture. Approximately 4,904 shoreline acres1, representing 96 percent of the
waterbody’s total shoreline jurisdiction area, is used for agriculture. Other shoreline
land uses include Open Space2 (2.4%) and a variety of uses that occur on less than ten
acres (<1%) (e.g., single-family residences, manufacturing, recreational, utilities). The
North Fork’s shorelines are also nearly all in agricultural use (98%). See Appendix D for
summary tables of zoning and current land use by lake and reach
Land Use Pattern
Existing and Planned Land Uses
The river has been divided into ten reaches for the analysis. As noted, existing land use
within shoreline jurisdiction for the Palouse River is dominated by agriculture. Small
percentages of the land use (<1%) along the North Fork are classified as single-family
households, manufacturing, recreation and utilities. These areas are near or adjacent to
Colfax.
Land within shoreline jurisdiction is primarily privately owned. Public ownership
includes County, Washington Department of Natural Resources, and U.S. Bureau of
Land Management in the southwest of the County. With the exception of small areas
along the North Fork, the entire shoreline is zoned as Agriculture.
The current shoreline environment designation for most of the unincorporated County
areas along the river is Rural. According to the current (1974) Shoreline Management
Master Program, the Rural designation is intended “to protect agricultural land from
urban expansion, restrict intensive development along undeveloped shorelines
functions as a buffer between urban areas, and maintain open spaces and opportunities
for recreational uses compatible with agricultural uses.” As the river turns south along
the boundary with Adams County, it is designated Conservancy. Palouse Falls State
Park is designated Natural. Appendix D presents current land use, ownership and
zoning data by reach along the Palouse and North Fork Palouse Rivers.
Potential New Development and Uses
As noted, the vast majority of lands within the Palouse River’s shoreline jurisdiction are
in agricultural use. Additionally, a majority of those agricultural lands have been
1 62% of the agricultural lands are classified under current use chapter 84.34 RCW. The remaining lands are not classified.
2 Classified under chapter 84.34 RCW
Final Whitman County Shoreline Analysis Report
106
classified under 83.84 RCW, indicating they are likely to remain in agricultural use.
Existing structures may be repaired, but the overall trend for shoreline use along the
river will be to remain in agricultural use. An area north of Colfax is classified as
undeveloped land, and is adjacent to other industrial uses. However, the area in the
County is zoned Agriculture. A change of use would require a rezone.
Water-oriented Use
The primary identified potentially water-oriented use along the Palouse River’s
shoreline is agriculture. The three parks (Elberton County Park, Colfax
Equestrian/Multi-use Trail, and Palouse Falls State Park) and other public access sites
are considered water-oriented uses and are described in further detail below under
Public Access.
Transportation and Utilities
In general, there is little to no road or transportation infrastructure within shoreline
jurisdiction of the Palouse River reaches in unincorporated Whitman County.
There are approximately 11 miles of rail infrastructure in shoreline jurisdiction
concentrated mainly along the Palouse River - Agriculture reach, which contains 4.61
miles of active rail. The Palouse River - Western Palouse reach contains approximately
one mile of active rail, and the Palouse River - Meanders reach contains less than one
mile of abandoned rail infrastructure.
There are approximately nine miles of roads within Palouse River reaches. The majority
of road infrastructure is within the North Fork Palouse River – Agriculture reach (3.59
miles) and the Palouse River – Agriculture reach (3.43 miles). The majority of road
infrastructure is classified as rural local access and minor roads. Major road
infrastructure includes the following:
State Highway 272 crosses the North Fork Palouse River near the City of Palouse in
the North Fork Palouse River – Agriculture reach.
State Highway 26 crosses the Palouse River in the Palouse River – Agriculture,
Palouse River – County Industrial, and Palouse River - Open Space reaches.
There are approximately 19 bridges within shoreline jurisdiction.
There are nine bridges in the North Fork Palouse River – Agriculture reach,
including six minor road bridges, one abandoned rail bridge, one active rail bridge,
and one bridge on State Highway 272.

The Watershed Company and BERK August 2014
107
There are five bridges on minor roads in the North Fork Palouse River – Meanders
reach.
There are four bridges, including three on minor roads and one on State Highway
26, in the North Fork Palouse River – Agriculture reach.
There is one bridge on State Highway 26 near the City of Colfax in the Palouse River
– County Industrial and Palouse River - Open Space reaches.
Public Access
Current Parks and Public Open Space
Given the size of the Palouse River’s shoreline area, there are relatively few public access
sites, which is consistent with an area of intense agricultural use. Public access sites that
are present are summarized in Table 6-2.
Table 6-2. Palouse River Open Space and Public Access Summary
Shoreline Reach Open Space Acres (Percent of Reach)
Parks Campground Trail (Length in Feet)
Boat Launches Moorage
North Fork Palouse River - Agriculture
0.3 (0) 1 - - - -
Palouse River - Canyon 68.4 (64.7) - - - - -
Palouse River – Meanders 37.7 (2.3) - - Colfax Trail
(7,334) - -
Palouse River – Palouse Falls State Park
- 1 1 - - -
Palouse River – Western Palouse 18.7 (2.2) - - - - -
There are scenic highways that provide visual access to shorelines of the Palouse River.
The County’s Parks and Recreation Comprehensive Plan (2004) identifies the Palouse
River as a popular destination for boating, canoeing and fishing. Specific locations are
not provided.
The Palouse River has 4.5 acres of recreational off highway vehicle areas within
shoreline jurisdiction. The following shoreline public access sites and trails are located
within Palouse River shoreline jurisdiction:
Elberton County Park is the site of the Whitman County Ropes Challenge Course.
The Park’s picnic area was considered a site for future development in the 2004-2009
Whitman County Parks and Recreation Comprehensive Plan.

Final Whitman County Shoreline Analysis Report
108
Colfax Equestrian/Multi-use Trail is a 3 mile long undeveloped abandoned railroad
bed which follows the Palouse River west out of Colfax. The trail allows for non-
motorized and equestrian uses.
Palouse Falls State Park is a 105-acre park with camping, picnic and day use
facilities.
Future Public Access
No future public access has been identified.
Historic and Archeological Sites
There are two historic sites within shoreline reaches of the Palouse River in
unincorporated Whitman County.
Manning-Rye Covered Bridge spans the Palouse River. It is also known as the
Harpole Bridge. It is a Historic Bridge on the National Register of Historic Places.
Elberton Historic District is on the State Register of Historic Districts. The district
was on the National Historic Register, but it was removed in 1990. The District is
near Washington State Highway 272 at the Palouse River.
There are 15 structures more than 50 years old within the shoreline reaches of the
Palouse River in unincorporated Whitman County. The structures are concentrated in
the North Fork Palouse River – Agriculture shoreline reach.
6.1.3 South Fork Palouse River
Land Use Pattern
The South Fork of the Palouse River (South Fork) flows from east to west from the City
of Pullman (Section 6.2.6), through the Town of Albion (Section 6.2.1), entering the
Mainstem Palouse River at the north end of Colfax (Section 6.2.2). The South Fork’s
shoreline jurisdiction comprises approximately 963 acres of uplands. There are very few
uses or structures within the river and its shorelands. The vast majority of the South
Fork’s shoreline jurisdiction is in agricultural use. Approximately 907 shoreline acres
(94%) are agriculture classified under chapter 84.34 RCW. Other shoreline land uses
include Open Space3 (2.9%), single-family residences (1.8%), and undeveloped land
(1.2%).
3 Classified under chapter 84.34 RCW

The Watershed Company and BERK August 2014
109
Existing and Planned Land Uses
The majority of land within shoreline jurisdiction is privately owned (95%).
Approximately 28.5 acres are owned mapped under the ownership of Washington State
University (3.0%). Land within shoreline jurisdiction of the South Fork is largely zoned
agricultural with some small areas zoned for residential and industrial uses adjacent to
the City of Pullman (<1% each).
The current shoreline environment designation along the South Fork is Rural.
According to the current (1974) Shoreline Management Master Program, the Rural
designation is intended “to protect agricultural land from urban expansion, restrict
intensive development along undeveloped shorelines functions as a buffer between
urban areas, and maintain open spaces and opportunities for recreational uses
compatible with agricultural uses.” Appendix D presents current land use, ownership
and zoning along the South Fork Palouse River.
Potential New Development and Uses
The vast majority of land within the South Fork’s shoreline jurisdiction is under
agricultural use and classified under 83.84 RCW, indicating they will remain in
agricultural use. Existing structures may be repaired, but the overall trend for shoreline
use along the river will be to remain in agricultural use. An area north of Pullman is
classified as undeveloped land. It is adjacent to more urban and industrial uses and new
non-agricultural uses would be most likely in this area of the unincorporated South
Fork.
Water-oriented Use
The only identified water-oriented uses along the South Fork shoreline include
agriculture, of which the vast majority of the shoreline jurisdiction is used for. There are
no other identified water-oriented uses.
Transportation and Utilities
There is a moderate amount of road and transportation infrastructure in shoreline
jurisdiction of the South Fork in the unincorporated County. There are approximately
6.5 miles of road and 10 miles of rail infrastructure concentrated mainly in the South
Fork Palouse River - Agriculture and South Fork Palouse River - South Fork River Road
reaches.
There are approximately nine bridges within shoreline jurisdiction of the South Fork
Palouse River.
Final Whitman County Shoreline Analysis Report
110
Public Access
Current Parks and Public Open Space
There are approximately 28 acres of open space land classified under chapter 84.34 RCW
located southeast of Colfax along South Palouse River Road. There are no other
designated or established recreation sites within the shoreline of the South Fork Palouse
River.
Future Public Access
There are no identified future public access sites.
Historic and Archeological Sites
There are no historic sites within the shoreline reaches of the South Fork Palouse River.
There are two structures more than 50 years old within shoreline reaches of the South
Fork Palouse River: the Whitman County Bridge and the Risbeck Grain Elevator.
6.1.4 Rock Creek
Land Use Pattern
Rock Creek flows generally south from Rock Lake to the Palouse River in the western
side of the County. Rock Creek’s shoreline jurisdiction comprises approximately 2,337
acres of uplands. Rock Creek’s shorelines are primarily in agricultural (75%) and open
space (25%) uses. There are very few uses or structures within the river and its
shorelands.
Existing and Planned Land Uses
The shoreline areas within all five Rock Creek reaches are zoned Agriculture by the
County. Roughly half (48%) of the shoreline area of Rock Creek is owned publicly by a
combination of the Bureau of Reclamation (44 acres), Bureau of Land Management (767
acres), and WDFW (309 acres). The remainder (1,217 acres) is privately owned.
The current shoreline environment designation along Rock Creek is Rural. According to
the current (1974) Shoreline Management Master Program, the Rural designation is
intended “to protect agricultural land from urban expansion, restrict intensive
development along undeveloped shorelines functions as a buffer between urban areas,
and maintain open spaces and opportunities for recreational uses compatible with
agricultural uses.” Appendix D presents current land use, ownership and zoning by
reach for Rock Creek.
The Watershed Company and BERK August 2014
111
Potential New Development and Uses
Shorelines of Rock Creek are completely in agricultural use and open space designated
under 83.84, indicating they are likely to remain undeveloped. Existing structures may
be repaired, but the overall trend for shoreline use along the creek will be to remain in
agricultural and open space use.
Water-oriented Use
Potentially water-oriented uses along Rock Creek include agriculture, for which 75% of
the shoreline jurisdiction is used. There are several public access areas which are
considered water-oriented (refer to Public Access below). The County’s Parks and
Recreation Comprehensive Plan (2004) also identifies Rock Creek as a common fishing
site.
Transportation and Utilities
In general, there is little road and rail infrastructure in the Rock Creek shoreline
jurisdiction. There are approximately 0.39 mile of abandoned rail within shoreline
jurisdiction, concentrated in the Rock Creek – Cottonwood Confluence/PAW reach.
There are approximately 1.31 miles of roads within shoreline jurisdiction, concentrated
mainly in the Rock Creek – Agriculture reach. The majority of roads are classified as
rural local roads. State Highway 23 crosses Rock Creek in the Rock Creek – Lake Outlet
reach.
There are five bridges within shoreline jurisdiction.
State Highway 23 crosses Rock Creek in the Lake Outlet reach.
Endicott West Road crosses Rock Creek in the Agriculture reach.
Hole-In-The-Ground Road crosses Rock Creek in the Pine Creek Confluence reach.
Texas Lake Road crosses Rock Creek in the Cottonwood Confluence /PAW reach.
Jordan Knott Road crosses Rock Creek in the Imbler Creek reach.
Public Access
Current Parks and Public Open Space
Shoreline public access sites are summarized in Table 6-3:

Final Whitman County Shoreline Analysis Report
112
Table 6-3. Rock Creek Open Space and Public Access Summary by Reach
Shoreline Reach Open Space
Acres (Percent of
Reach) Parks Campground
Trail (Length in
Feet) Boat
Launches Moorage
Rock Creek – Cottonwood Confluence/PAW
3.7 (0.6) - - John Wayne Pioneer Trail
(4,124) - -
Rock Creek – Escure Ranch 375.2 (76.6) - 1 - - -
Rock Creek – Imbler Creek 198.4 (65.6) - -
John Wayne Pioneer Trail
(702) - -
Rock Creek – Lake Outlet - - -
John Wayne Pioneer Trail
(412) - -
Source: Whitman County, 2014 TWC, 2014; BERK, 2014
The following shoreline public access sites and trails are located within Rock Creek’s
shorelines:
Escure Ranch Campsite is managed by the Bureau of Land Management. It offers
30 miles of non-motorized trails, and is popular for camping, hiking, horseback
riding, biking, fishing and hunting.
John Wayne Pioneer Trail is a DNR-owned trail that covers 12 miles within
Whitman County.
Future Public Access
According to the County’s Parks and Recreation Comprehensive Plan (2004), the Bureau
of Land Management’s Escure Ranch is a potential site for future trail development for
hiking, mountain biking, and equestrian use. Future development in that area could
also include primitive camping facilities, trails, and interpretive signage.
Historic and Archeological Sites
There are eight structures more than 50 years old within the shoreline of Rock Creek.
The structures are concentrated around the confluence of Rock and Cottonwood Creeks.
6.1.5 Hangman Creek
Land Use Pattern
Hangman Creek flows across the northeast corner of the County from Idaho to Spokane
County. The Creek flow through the Town of Tekoa. This section only addresses the
portion of the creek within the unincorporated County. There are approximately 7.5
miles of shoreline that comprise 372 acres of shoreline jurisdiction. Of that area, 99

The Watershed Company and BERK August 2014
113
percent (639 acres) is currently in agricultural use. The remaining one percent has been
designated under chapter 84.34 RCW as open space.
Existing and Planned Land Uses
The shoreline area within Hangman Creek is completely zoned Agriculture by the
County. The shorelines of Hangman Creek are primarily privately owned.
Approximately seven acres on the west side of the river, downstream from Tekoa, are
owned by the Washington Department of Natural Resources.
The current shoreline environment designation along Hangman Creek is Rural.
According to the current (1974) Shoreline Management Master Program, the Rural
designation is intended “to protect agricultural land from urban expansion, restrict
intensive development along undeveloped shorelines functions as a buffer between
urban areas, and maintain open spaces and opportunities for recreational uses
compatible with agricultural uses.” Appendix D presents current land use, ownership
and zoning for Hangman Creek.
Potential New Development and Uses
Shorelines of Hangman Creek are completely in agricultural use that has been
designated under 83.84 RCW, indicating they are likely to remain in agricultural use.
Existing structures may be repaired, but the overall trend for shoreline use along the
creek will be to remain in agriculture.
Water-oriented Use
Potential water-oriented uses along Hangman Creek include agriculture, for which 99%
of the shoreline jurisdiction is used.
Transportation and Utilities
There is little road or transportation infrastructure within shoreline jurisdiction of
Hangman Creek. Transportation facilities are concentrated near the City of Tekoa.
There are 1.18 miles of abandoned rail within shoreline jurisdiction. There are
approximately 2.72 miles of minor roads within shoreline jurisdiction concentrated
within the southeast section of Hangman Creek. The majority of roads are classified as
rural access roads. State Highway 27 is within shoreline jurisdiction for less than half a
mile.
There are four bridges within shoreline jurisdiction, including three bridges on minor
roads and one abandoned rail bridge.

Final Whitman County Shoreline Analysis Report
114
Public Access
Current Parks and Public Open Space
There is approximately 1.4 acres of open space land classified under chapter 84.34 RCW
along Hangman Creek. There are no other designated or established recreation sites
within the shoreline of Hangman Creek.
Future Public Access
There are no identified future public access sites.
Historic and Archeological Sites
There are no historic or archeological sites within shoreline jurisdiction of Hangman
Creek. There are also no structures 50 years or older.
6.1.6 Pine Creek
Land Use Pattern
Pine Creek flows northwest through the Town of Rosalia and into Spokane County. It
then re-enters Whitman County and travels west through the Town of Malden to its
confluence with Rock Creek and Rock Lake. It travels approximately 34 miles through
unincorporated Whitman County, and its shoreline uplands comprise approximately
1,705 acres. All of Pine Creek’s shorelines are currently in agricultural use.
Approximately a third of that agricultural use has been designated under chapter 84.34
RCW.
Existing and Planned Land Uses
The shoreline area within Pine Creek is completely zoned Agriculture by the County.
The shorelines of Pine Creek are primarily privately owned (97%). Three percent of the
shoreline jurisdiction is owned by DNR (23 acres) and the State Parks and Recreation
Commission (34 acres).
The current shoreline environment designation along Pine Creek is Rural. According to
the current (1974) Shoreline Management Master Program, the Rural designation is
intended “to protect agricultural land from urban expansion, restrict intensive
development along undeveloped shorelines functions as a buffer between urban areas,
and maintain open spaces and opportunities for recreational uses compatible with
agricultural uses.” Appendix D presents current land use, ownership and zoning by
reach for Pine Creek.

The Watershed Company and BERK August 2014
115
Potential New Development and Uses
Shorelines of Pine Creek are completely in agricultural use, much of which has been
designated under 83.84 RCW, indicating they will likely remain in agricultural use.
Existing structures may be repaired, but the overall trend for shoreline use along the
creek will be to remain in agriculture. The Town of Rosalia has been completing
updates to its wastewater treatment facility, some of which may be located north of
town within the unincorporated County. The Town is developing a wetland mitigation
plan which may include mitigation activities north of Town in the County.
Water-oriented Use
The primary potential water-oriented use along Pine Creek is agriculture, for which all
of the shoreline jurisdiction is used. The public access sites listed below under Public
Access are also considered water-oriented. The wastewater treatment facility and
settling ponds are considered water-related facilities, but their outfalls are considered
water-dependent uses.
Transportation and Utilities
There is a moderate amount of transportation infrastructure within shoreline jurisdiction
of Pine Creek in the unincorporated County. There are approximately 5.48 miles of rail
within shoreline jurisdiction, of which 4.92 miles are abandoned and 0.56 mile are active.
The majority of rail is concentrated in the Agriculture reach (2.98 miles abandoned and
0.56 mile of active rail) and the Pine Creek – Scrub/Shrub reach (1.84 miles of abandoned
rail). There are three rail bridges on the John Wayne Trail.
There is 8.32 miles of road infrastructure in shoreline jurisdiction. There are
approximately 23 bridges within shoreline jurisdiction.
There are 17 bridges in the Pine Creek – Agriculture reach, including three major
road bridges, 14 minor road bridges, and three rail bridges- two that are part of the
John Wayne Trail.
There are a total of five bridges in the Pine Creek – Scrub/Shrub reach, including
three minor road bridges and two rail bridges on the John Wayne Trail.
There is one bridge on a minor road in the Pine Creek – Wastewater Lagoons reach.
Public Access
Current Parks and Public Open Space
There are limited public access sites along Pine Creek. SR 195, which is located near
Rosalia, is a Scenic and Recreational Highway. The John Wayne Pioneer Trail (also
referred to as Iron Horse State Park) runs along the creek most of its length and

Final Whitman County Shoreline Analysis Report
116
continues along Rock Lake. Steptoe Battlefield State Park is located at the south end of
Rosalia and within unincorporated County. The park is four acres and contains a
monument with interpretive signs in memory of the battle between a band of Palouse,
Spokane, and Coeur D'Alene Native Americans and 159 American soldiers.
Future Public Access
There are no identified future public access sites.
Historic and Archeological Sites
The Rosalia Railroad Bridge on Washington Highway 271 is the only historic site within
the shoreline of Pine Creek. It is a Historic Bridge on the National Register of Historic
Places.
6.1.7 Union Flat Creek
Land Use Pattern
Union Flat Creek flows for 58 miles east to west across the County to its confluence with
the Palouse River. Union Flat Creek’s shorelands comprise 2,181 acres. There are no
incorporated towns or cities on Union Flat Creek. Nearly all (99%) of Union Flat Creek’s
shorelines are currently in agricultural use; approximately 80 percent of those lands
have been designated under chapter 84.34 RCW. The remaining one percent is classified
as open space under 84.34 RCW.
Existing and Planned Land Uses
Shoreline jurisdiction within Union Flat Creek’s three reaches is completely zoned
Agriculture by the County. The shorelines of Union Flat Creek are primarily privately
owned. Approximately 63 acres (2.9%) of shoreline jurisdiction located at the end of
Kincaid Road are County-owned (Klemgard County Park). Another 178 acres (8.2%) are
owned by DNR.
The current shoreline environment designation along most of Union Flat Creek is Rural.
According to the current (1974) Shoreline Management Master Program, the Rural
designation is intended “to protect agricultural land from urban expansion, restrict
intensive development along undeveloped shorelines functions as a buffer between
urban areas, and maintain open spaces and opportunities for recreational uses
compatible with agricultural uses.” Klemgard County Park is designated Conservancy.
Appendix D presents current land use, ownership and zoning by reach for Union Flat
Creek.

The Watershed Company and BERK August 2014
117
Potential New Development and Uses
Shorelines of Union Flat Creek are almost completely in agricultural use, most of which
has been designated as resource lands of long-term significance (83.84 RCW), indicating
they are likely to remain in agricultural use. Existing structures may be repaired, but the
overall trend for shoreline use along the creek will be to remain in agriculture. Some
improvements at Klemgard County Park are possible. These are listed below under
Public Access.
Water-oriented Use
Water-oriented uses along Union Flat Creek include agriculture, for which the entire
shoreline jurisdiction is used. The public access sites listed below, under Public Access,
are also considered water-oriented. Union Flat Creek has been identified as an area for
swimming and fishing, which are both water-dependent activities.
Transportation and Utilities
There is little road and transportation infrastructure within the shoreline jurisdiction.
Most of the road infrastructure is concentrated in the Union Flat Creek – Agriculture
Riparian reach. There is a small amount of rail in shoreline jurisdiction, with .08 miles of
active rail within the Union Flat Creek – Agriculture reach.
There are approximately 5.15 miles of roads within shoreline jurisdiction. Much of the
road infrastructure is concentrated within the Union Flat Creek – Agriculture Riparian
reach (3.13 miles) and the Union Flat Creek – Agriculture reach (1.84 miles). The two
major roads present are:
State Highway 194 crosses Union Flat Creek in the Agriculture Riparian reach, and
State Highway 26 crosses Union Flat Creek in the Agriculture Riparian reach.
There are approximately 15 bridges within shoreline jurisdiction. The Union Flat Creek
– Agriculture Riparian reach has seven bridges, including two bridges on major roads
and five bridges on minor roads. The Union Flat Creek – Agriculture reach has seven
bridges on minor roads, and the Scablands reach has one bridge on a minor road.
Public Access
Current Parks and Public Open Space
The only public access site along Union Flat Creek is Klemgard County Park. This park
is 59 acres. Amenities include a hiking trail, playground, sand volleyball courts,
horseshoe pits, shelters, picnic areas, and a playfield.

Final Whitman County Shoreline Analysis Report
118
Future Public Access
The 2004-2009 Whitman County Parks and Recreation Comprehensive Plan (2004)
outlines a number of renovations, including replacing the bridge crossing and roofing
the large picnic shelter, to improve the Park for visitors. No other future public access
sites have been identified.
Historic and Archeological Sites
There are no listed historic or archeological sites along Union Flat Creek. There are
numerous structures identified as being 50 years old or older in the vicinity of the creek,
but only one is within the shoreline jurisdiction of Union Flat Creek.
6.1.8 Snake River
The Snake River flows through southern Whitman County from the Washington/Idaho
border to its confluence with the Palouse River, which marks the western boundary of
the County. The Snake River forms the Southern boundary of the County with its
southern shorelines in Columbia and Garfield Counties. The influences of the Lower
Granite and Little Goose Dams are highly determinant of how the River’s shorelines are
used.
None of the River’s shorelines are within an incorporated municipality. There are no
residential or commercial uses along the river, although all of the Port of Whitman
County’s on-water lands are located along the River. The majority of the River’s
shoreline jurisdiction (2,215 acres) is under federal ownership (91% Corps and 6% BLM).
The remainder is owned by WDNR and 26.5 acres (<2%) are owned by Washington State
University.
Land Use Pattern
Existing Land Uses
The Snake River has been divided into five shoreline reaches. Existing land use within
the shoreline jurisdiction is a mix of agriculture, water areas, manufacturing, food and
kindred products, and open space (see Appendix D for summary tables). Nearly all of
the land within the shoreline jurisdiction is publicly owned. None of the River’s
shorelines are within an incorporated municipality. Upland shoreline jurisdiction is the
Snake River- Industrial reach is zoned Heavy Industrial (Port of Whitman County
properties); the remaining reaches are zoned Agricultural by the County.
The most prevalent use along the River is transportation. The BNSF railway occupies a
20- to 30-foot-wide right-of-way within shoreline jurisdiction from the eastern County
boundary to a crossing between Lyons Ferry and the Tucannon River. SR 194 is also

The Watershed Company and BERK August 2014
119
located within shoreline jurisdiction. It parallels the railroad from the County’s
boundary to Almota (transportation infrastructure is detailed below under
Transportation and Utilities). Other uses include the in-water and upland facilities
related to the Lower Granite and Little Goose Dams (refer to Water-oriented Uses
below), three Port of Whitman County sites (refer to Water-oriented Uses below), and
several public access and/or recreational sites (refer to Current Parks and Public Open
Space below).
The current shoreline environment designations include Urban at several areas along the
river and Rural. According to the current (1974) Shoreline Master Program, the Urban
designation is meant to provide “optimum utilization of shorelines within urbanized
areas by providing for intensive public use and by managing development so that it
enhances and maintains shorelines for a multiplicity of uses.” The Rural designation is
intended “to protect agricultural land from urban expansion, restrict intensive
development along undeveloped shorelines functions as a buffer between urban areas,
and maintain open spaces and opportunities for recreational uses compatible with
agricultural uses.”
Water-oriented Uses
Army Corps of Engineers Dams
Both the Little Goose and Lower Granite Dams and associated facilities are considered
water-dependent uses. The Little Goose Dam was constructed and is owned by the
Corps. The Dam was completed in 1970. Waters behind the dam form Lake Bryan,
which extends upstream about 37.2 miles and provides navigation to Lower Granite
Lock and Dam. The lake has an area of 10,025 acres. There are 5,398 acres of project
lands surrounding Lake Bryan on both sides of the river. These lands include fee lands
that are federally owned and managed by the Corps, as well as easement lands to which
the Corps has specific rights or easements. There are 5,143 acres of Corps-managed
lands used for public recreation purposes, wildlife habitat, wildlife mitigation, and
water-connected industrial development. Two areas totaling approximately 150 acres
are licensed either to the state or local port for recreation
(http://www.nww.usace.army.mil/Locations/DistrictLocksandDams/LittleGooseLockan
dDam.aspx).
The Lower Granite Dam is also owned by the Corps. It was completed in 1984. The
dam and associated facilities are located approximately 23 miles south of Colfax and
comprise approximately 500 acres on either side of the river. The project consisted of the
dam, navigation lock, powerhouse, a fish ladder and associated facilities. The lake

Final Whitman County Shoreline Analysis Report
120
created by the dam, known as Lower Granite Lake, extends upstream on the Snake
River about 40 miles to Lewiston. There are about 13,000 acres of project lands
surrounding Lower Granite Lake. These project lands include fee lands that are
federally owned and managed by the Corps or are managed by lessees. Most of these
lands are used for wildlife habitat, wildlife mitigation, public recreation purposes, and
water-connected industrial development. There are 12 public boat launching facilities
(http://www.nww.usace.army.mil/Locations/DistrictLocksandDams/LowerGraniteLock
andDam.aspx).
Port of Whitman County
The Port of Whitman County was formed by vote in 1958 to fulfill three goals: 1) Provide
access to slack water navigation on the Columbia and Snake River system, 2) promote
industrial development, and 3) provide recreation opportunities on the Snake River.
The Port of Whitman County has three on-water sites that, depending on the particular
tenant’s use, would be considered either water-dependent or water-related. These
include, from upstream: the Port of Wilma, the Port of Almota, and the Port of Central
Ferry. The Port also developed and operates Boyer Park and Marina.
The Wilma site is located roughly 2 miles west of the Idaho border. The site includes all
lands south of the Camas Prairie Railroad and upland of the Snake River shoreline. As
of 2010, the site was comprised of 279.9 acres of developed industrial property and 76
acres of undeveloped property. The Port holds an additional 76 acres on the landward
side of SR 193 that is undeveloped and zoned agricultural. The developed shorelines of
the Wilma site are nearly all leased. The property is currently occupied by the following
users:
A lumber milling and
manufacturing company
One wood chip processor and
shipper
A concrete block manufacturer
Two propane distribution and
storage companies
A wood recycling company
A tree service company
A self-contained waste
processing facility
A helicopter business
A meat processor
A boat manufacturing company
A break bulk shipper
Two grain shipment and storage
companies
An agrichemical company
The Watershed Company and BERK August 2014
121
The Almota site, located 30 miles downstream of the Wilma site, is approximately 10.5
acres in size. The site serves as a transshipment point for white wheat. The property’s
users include two grain storage and shipping companies. Nearly all of the 10.5 Port-
controlled acres along the shoreline are leased. Because of the topography, expansion at
the site is impossible.
The Central Ferry Port site is the third and most downstream Port site on the Snake
River. It is located immediately east of SR 127 and includes most of the land south
(waterward) of the Camas Prairie Railroad. The site includes 131.9 acres. The site is
divided into 15 lots, most of which are developed. Current tenants include four grain
storage/shipping companies, three fertilizer companies, and the Fire District #8 fire
house (Port of Whitman County 2010).
Other Water-oriented Uses
In addition to the dams, ports, and associated facilities, water-oriented uses along the
Snake River include all of the parks, public access sites, trails, campgrounds, boat
launches, docks and other recreational facilities described under Public Access. Water-
related uses include outfalls and utilities that are located within shoreline jurisdiction.
Lastly, agricultural use, which occupies 1,249.9 acres, may be considered water-oriented.
Developing or Redeveloping Waterfronts
There is very little private land along the Snake River in Whitman County. New private
residential or commercial uses are not expected. As noted above, the major land uses
include Corps dams and associated facilities; the Port’s facilities at Wilma, Almota and
Central Ferry; and the roads and railways. Ongoing maintenance and operation of the
dams and associated facilities is expected. Siltation behind the dams has raised concerns
about flooding, particularly in Lewiston, Idaho, where downtown is protected by a
system of levees. The Corps issued a Programmatic Sediment Management Plan and
Draft Environmental Impact Statement in 2012. The Corps’ preferred alternative
included dredging and dredged material management, along with other sediment and
system management measures. Alternatives are currently being evaluated.
There are unleased areas at the Port’s Wilma site that may be developed. Based on
conversations with Port staff and site visits, there are current lease holders that may
change uses or develop new facilities, but specific plans are not known. The Central
Ferry site has undeveloped Port properties which may be developed for new industrial
uses during the planning horizon of the Comprehensive Plan. However, the Port has
noted that lack of workforce due to the site’s isolation represents a challenge to new
development. The Port’s Comprehensive Plan includes a list of planned improvements

Final Whitman County Coalition Shoreline Analysis Report
122
at each of its on-water sites. Listed improvement that could potentially occur in or affect
shoreline resources include:
Wilma Site
Possible rezone of upland land trade acreage
Obtain more land from corps west of Wilma
Improve and repair the public port site dock and booms
Continue to aggressively market to and potentially develop or improve vacant land
for potential tenants
Almota Site
Pave gravel roads
Central Ferry Site
Acquire additional lands near present site as the need arises
Continue to level, prepare, and improve undeveloped sites as needed
Transportation and Utilities
In general, there is a large amount of road and rail infrastructure within shoreline
jurisdiction of the Snake River. There are 39 miles of active rail within shoreline
jurisdiction. The majority of rail infrastructure is within the Snake River – Railroad
reach (35.22 miles), and the Snake River – Parks/Open Space reach (3.33 miles).
There are 25.38 miles of road infrastructure within shoreline jurisdiction. The majority
of road infrastructure is within the eastern half of the Snake River – Railroad reach (21.94
miles). The Snake River – Industrial and Snake River – Parks/Open Space reaches each
contain less than two miles of road. The majority of roads are classified as rural major
roads. State Highway 128 crosses the Snake River to Clarkston.
There are approximately three bridges within shoreline jurisdiction of the Snake River –
Railroad reach, including one bridge on State Highway 128 and two active rail bridges.
Public Access
Current Parks and Public Open Space
There are numerous public access opportunities and sites along the Snake River. Table
6-4 summarizes the public access lands and facilities, which are described in more detail
below.

The Watershed Company and BERK August 2014
123
Table 6-4. Snake River Open Space and Public Access Summary
Shoreline Reach
Open Space Acres (Percent of Reach)
Parks Campground Trail (Length in Feet in Reach)
Boat Launches
Moorage Slips
Snake River – Parks/Open Space
57.6 (14.5%) 9 0 0 15 36
Snake River – Railroad
202.5 (13.8%) 0 0 0 2 0
The following are more detailed descriptions of public access sites along the Snake
River:
Blyton Landing is a 3-acre park with day use facilities, as well as boating and
primitive camping facilities. Park amenities include fire pits, grills, and picnic tables.
There is a one-lane boat launch ramp and a handling dock. The park is operated by
the Army Corps of Engineers.
Boyer Park and Marina is 80 acres and is open year round. The park has day-use
facilities, boating, fishing, hunting, a bike/jogging path, an RV park, camping sites, a
swimming area, a grocery and a motel. There is a three-lane boat launch ramp, 150
slips, three docks, and a marine dump station. Boyer Park is operated by the Port of
Whitman County.
Central Ferry State Park was a 185-acre day-use park. The area is transitioning to a
Habitat Management Unit and was closed by the Army Corps of Engineers. There
are no facilities available to the public.
Nisqually John Landing is 8 acres and is for day-use, boating and primitive
camping. It has camping facilities and a one lane boat launch ramp with a dock. It is
open year round and operated by the Army Corps of Engineers.
Riparia is a 32-acre day-use and primitive camping park with day use facilities and a
RV/Tent campsite. Amenities include fire pits, grills, and picnic tables. It is operated
by the Army Corps of Engineers.
Wawawai Landing is three acres and offers camping and boating facilities. There is
a tent/RV site, day-use facilities, and a one-lane boat launch ramp with a dock. The
landing is operated by the Army Corps of Engineers.
Future Public Access
There is little information on future public access along the Snake River. The Port of
Whitman County has included planned improvements at Boyer Park and Marina in its
Final Whitman County Coalition Shoreline Analysis Report
124
Comprehensive plan. These improvement include needed repair and replacements and
development of “income producing infrastructure” when feasible.
Historic and Archeological Sites
There is one historic site within the shoreline reaches of the Snake River in
unincorporated Whitman County: the Interior Grain Tramway. The Interior Grain
Tramway was built in 1901 near Pullman. The tramway was used to move grain from
the Palouse hills to the Snake River. The tramway was listed on the National Register of
Historic Places in 1988.
6.2 City and Towns
6.2.1 Town of Albion
Land Use Pattern
The Town of Albion is located on the South Fork Palouse River (South Fork). It has a
current population of 572. The shoreline jurisdiction includes 54 acres along just under a
mile of the River. The shoreline area extends from the south through mostly agricultural
areas (72%). Shoreline jurisdiction includes some residential development (27%),
governmental services (1%), and some industrial development in the form of grain silos
(<1%).
Existing and Planned Land Uses
Most of the Albion shoreline jurisdiction contains agricultural uses. Residential uses are
present in the center of town. The U.S. Post Office is also within shoreline jurisdiction.
The railroad and grain silos are on the west side of the river. Zoning in Albion’s
shorelines is a mix of residential, commercial and industrial. There are several areas for
which data is not available. This is a data gap. Ownership data shows no state or
federal ownership in shoreline. Appendix D shows the current land use, ownership
profile and current zoning for each shoreline reach.
The current shoreline environment designation is Urban. According to the current
(1974) Shoreline Management Master Program, the Urban designation is meant to
provide “optimum utilization of shorelines within urbanized areas by providing for
intensive public use and by managing development so that it enhances and maintains
shorelines for a multiplicity of uses.”
Potential New Development and Uses
As a means of providing context for a discussion of future shoreline development and
use, historic population and housing growth trends are presented for Albion. The Town

The Watershed Company and BERK August 2014
125
of Albion has steadily lost population since 1990. Albion experienced a dramatic drop in
population from 2000 to 2002, but recovered most of its population by 2003. Since then,
the population continues to decline, but at a slower rate. In 2010, Albion had 579 people.
The population decline is not consistent with historical trends for housing units. In the
Town of Albion, housing units steadily increased from 1991 to 2001, before trending
downward. From 2001 to 2010, housing units in Albion have declined. In 2010, Albion
had 302 housing units. Figure 6-1 compares historical trends for population and
housing units for the Town of Albion, years 1990 through 2010.
Source: Washington State OFM, 2014. Figure 6-1. Town of Albion Population and Housing Units 1990 – 2010
There are no known new uses or developments planned for Albion’s shorelines.
Water-oriented Use
Water-oriented uses within Albion are limited. The South Fork is not commercially
navigable. Waters are typically too shallow to allow water transportation. Agriculture
is prevalent along the Town’s shorelines (39 acres). Activities such as fishing and
swimming are considered water-oriented as well. There are no other identified water-
oriented uses.
Transportation and Utilities
There is 0.33 mile of active rail within shoreline jurisdiction. There is 0.66 mile of roads
as well. The roads are classified as rural local access road; there are no major roads.

Final Whitman County Coalition Shoreline Analysis Report
126
There are two bridges within shoreline jurisdiction of the South Fork Palouse within the
Town of Albion, as follows:
One active rail bridge in Albion – Agriculture reach
South D Street crosses the South Fork Palouse River in the Albion – Agriculture
reach
Public Access
There are no identified public access sites in the Town of Albion. There are no identified
future public access sites in Albion.
Historic and Archeological Sites
There are no historic or archeological sites identified within the shoreline of the Town of
Albion.
6.2.2 City of Colfax
Land Use Pattern
Colfax’s population is 2,846. A significant portion of Colfax lies within shoreline
jurisdiction. Colfax is located at the confluence of the North and South Forks of the
Palouse River. Most of the City, including Main Street, lies along the South Fork. The
rivers are almost completely contained within a system of concrete levees through town.
Shoreline land use within the City’s 368 acres of shoreline jurisdiction includes open
space and agriculture at the south end of town; commercial and residential uses through
the Main Street corridor; and residential and industrial uses at the north end of town.
Colfax has railroad and road infrastructure throughout. Current land uses within the
City’s shorelines are as follows:
Resource production and extraction 54%
Transportation, communication, and utilities 15%
Residential 9%
Undeveloped land and water areas 8%
Trade 6%
Cultural, entertainment, and recreational 4%
Manufacturing 4%
Services 1%
Existing and Planned Land Uses
Colfax’s shorelines are unique in the County. In the 1960s, a concrete levee system for
the North Fork, South Fork and Mainstem of the Palouse River was constructed through

The Watershed Company and BERK August 2014
127
town. The primary purpose of the system is to protect the low-lying residential,
commercial and business areas of the City. The system, which is operated and
maintained by the City, includes two components. The Colfax No. 1 levee system is
located along the North Fork and Mainstem. The project consists of approximately 3,700
feet of concrete-lined channel, 4,900 feet of revetted channel, 2,300 feet of unrevetted
channel, and drainage structures (USACE 2014). The Colfax No. 2 Flood Reduction
Project is located along the South Fork and Spring Flat Creek (a tributary). The project
consists of approximately 7,190 feet of concrete-lined channel, 2,610 feet of left and right
bank revetted levees, and drainage structures (USACE 2014). Both were completed in
1965. As a result of the levee system, a large portion of the City’s shorelines are fenced
and do not provide the typical visual experience of a free-flowing stream.
Agriculture (seen primarily in the Colfax–Agriculture reach) is the most common use in
the City’s shorelines. The use is largely located northeast of the town center along the
North Fork. This area was recently annexed into the City in 2006 and, at 1,140 acres,
doubled the land area of the City and greatly increased its shoreline jurisdiction as well.
The City has applied a new zoning district to this area – Rural Residential. Current land
use in the area is predominantly agriculture with cattle grazing. Residential
development is extremely low density. The City views this area as appropriate for
continued low-density residential development provided water and sewer services are
extended (City of Colfax 2007).
Southeast of town, a large area of open space occurs. Several parks are located within
the City’s shoreline as well. Open space, parks and recreational activities comprise
approximately 10 percent of the City’s shorelines. Through the Main Street corridor,
shoreline jurisdiction includes the west side of Main Street, which is characterized by
retail, commercial, service and hotel/motel uses. Residential uses surround the
commercial district and residential uses along the west bank of the South Fork are
within shoreline jurisdiction as well.
Shoreline land use north of the town center and past the confluence includes more
residential uses, but also includes industrial uses. The City’s 6.5-acre wastewater
treatment plant and settling pond are located in the northwest portion of the City
between SR 26 and the Palouse River. After treatment, effluent is discharged to the
Palouse River. The facility was last refurbished in 2004 (City of Colfax 2007).
Zoning through the City generally follows the current land use pattern with the
exception of the northeast annexation area described above. Commercial zoning is
applied along the South Fork through the City’s business district and in the northwest
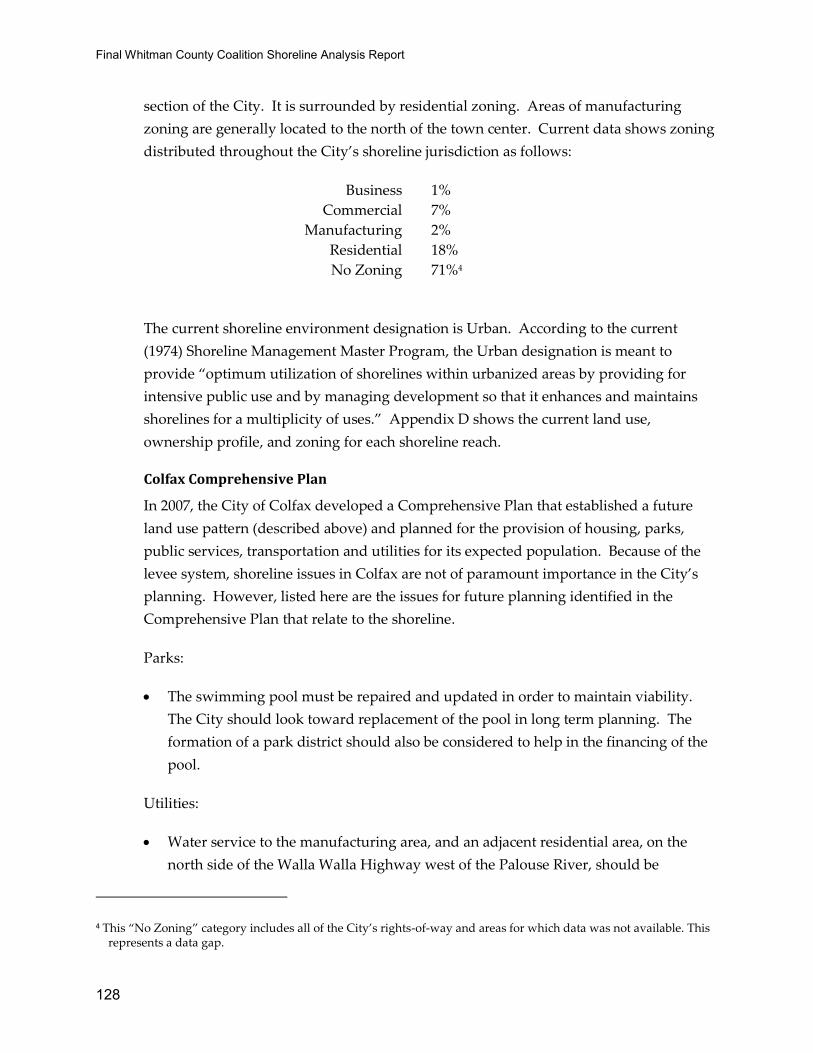
Final Whitman County Coalition Shoreline Analysis Report
128
section of the City. It is surrounded by residential zoning. Areas of manufacturing
zoning are generally located to the north of the town center. Current data shows zoning
distributed throughout the City’s shoreline jurisdiction as follows:
Business 1%
Commercial 7%
Manufacturing 2%
Residential 18%
No Zoning 71%4
The current shoreline environment designation is Urban. According to the current
(1974) Shoreline Management Master Program, the Urban designation is meant to
provide “optimum utilization of shorelines within urbanized areas by providing for
intensive public use and by managing development so that it enhances and maintains
shorelines for a multiplicity of uses.” Appendix D shows the current land use,
ownership profile, and zoning for each shoreline reach.
Colfax Comprehensive Plan
In 2007, the City of Colfax developed a Comprehensive Plan that established a future
land use pattern (described above) and planned for the provision of housing, parks,
public services, transportation and utilities for its expected population. Because of the
levee system, shoreline issues in Colfax are not of paramount importance in the City’s
planning. However, listed here are the issues for future planning identified in the
Comprehensive Plan that relate to the shoreline.
Parks:
The swimming pool must be repaired and updated in order to maintain viability.
The City should look toward replacement of the pool in long term planning. The
formation of a park district should also be considered to help in the financing of the
pool.
Utilities:
Water service to the manufacturing area, and an adjacent residential area, on the
north side of the Walla Walla Highway west of the Palouse River, should be
4 This “No Zoning” category includes all of the City’s rights-of-way and areas for which data was not available. This represents a data gap.

The Watershed Company and BERK August 2014
129
improved and extended to serve the entire area and any development that might
occur there.
Storm Drainage system:
Regular maintenance of the flood control channel should be considered at each
budgeting time and a maintenance program established that will adequately keep
the flood control channel free of rock and silt buildup.
Transportation:
The City should investigate the possibility of making improvements to the road
which parallels the North Fork of the Palouse River through the newly-annexed
area. These improvements could include providing a BST or asphalt surface and the
additions of some new exits. This could entail the construction of a bridge or a
connection to Hilty Road on the southeast side or constructing a road across from the
school grounds on the northwest side.
Environment:
The city should strongly encourage conservation of natural resources.
Any structure permitted in a flood area should be subject to strict flood proofing
regulations.
Potential New Development and Uses
The City of Colfax has decreased in population year to year, since 2006. Colfax saw a
steady increase in population from 1991 to 1999, and then from 2003 to 2006, but has not
experienced any population growth since. In 2010, there were 2,805 people living in
Colfax.
Housing units in the City of Colfax have steadily increased year to year since 1991, but
appear to be leveling off and remaining steady beginning in 2008. In 2010, there were
1,405 housing units in Colfax. Figure 6-2 compares historical trends for population and
housing units for the City of Colfax, years 1990 through 2010.
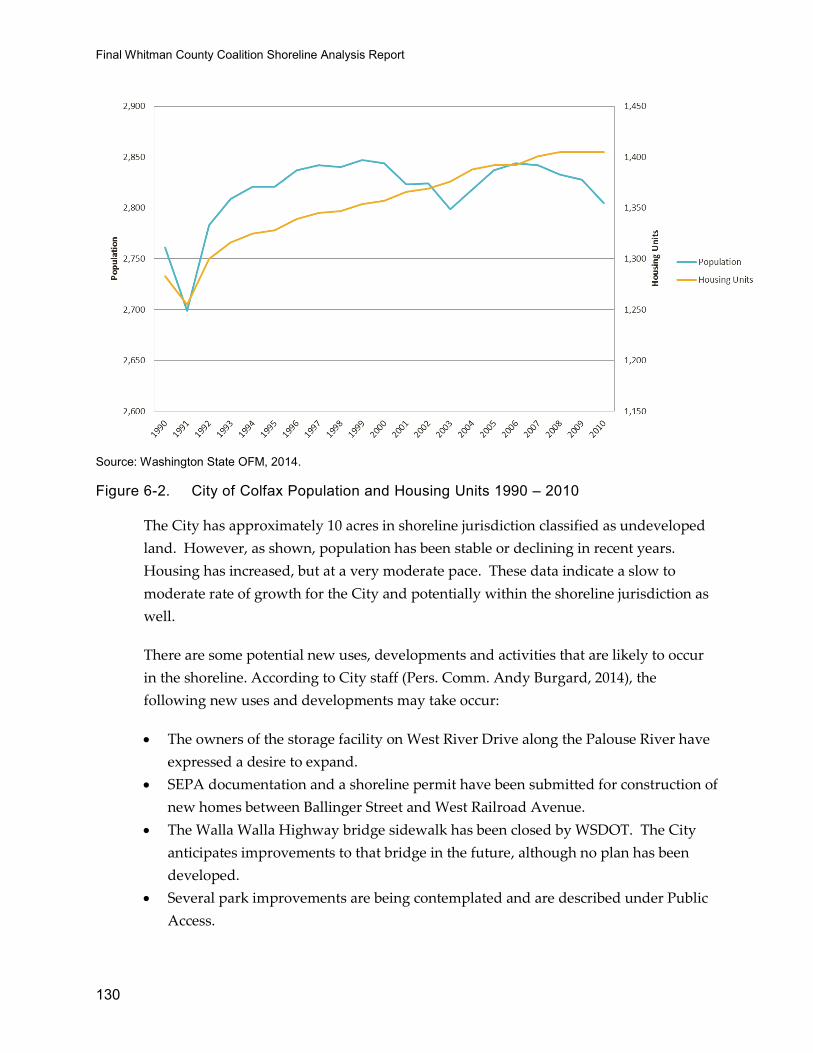
Final Whitman County Coalition Shoreline Analysis Report
130
Source: Washington State OFM, 2014. Figure 6-2. City of Colfax Population and Housing Units 1990 – 2010
The City has approximately 10 acres in shoreline jurisdiction classified as undeveloped
land. However, as shown, population has been stable or declining in recent years.
Housing has increased, but at a very moderate pace. These data indicate a slow to
moderate rate of growth for the City and potentially within the shoreline jurisdiction as
well.
There are some potential new uses, developments and activities that are likely to occur
in the shoreline. According to City staff (Pers. Comm. Andy Burgard, 2014), the
following new uses and developments may take occur:
The owners of the storage facility on West River Drive along the Palouse River have
expressed a desire to expand.
SEPA documentation and a shoreline permit have been submitted for construction of
new homes between Ballinger Street and West Railroad Avenue.
The Walla Walla Highway bridge sidewalk has been closed by WSDOT. The City
anticipates improvements to that bridge in the future, although no plan has been
developed.
Several park improvements are being contemplated and are described under Public
Access.

The Watershed Company and BERK August 2014
131
Water-oriented Use
Water-oriented uses within Colfax are limited. None of the rivers through the City are
commercially navigable. Because of the levee system, activities such as boating, fishing
and swimming are not possible in the leveed areas. Agricultural uses in the northeast
part of town may be considered water-oriented. There are approximately 197 shoreline
acres in agricultural use.
The City’s shoreline public access sites are considered water-oriented. There are
approximately 35 acres of identified parks, open space and recreational activities within
the City’s shorelines (see Public Access below). Water-enjoyment amenities include
trails, ball parks, and viewpoints. Some of the commercial uses adjacent to the shoreline
may be considered water-enjoyment uses.
The City’s wastewater treatment plant is considered water-related and its outflow is
considered water-dependent. Other utility outfalls would also be considered water-
oriented.
Transportation and Utilities
There is significant transportation infrastructure within the City’s shorelines. There are
1.68 miles of rail and 1.19 miles of roads within City of Colfax shoreline jurisdiction.
About 50 percent of the roads are classified as rural local access. The remaining roads
are classified as major roads, including approximately 0.5 mile of US Highway 195
(crosses the Palouse River in the Colfax-Residential and Colfax –Industrial/Commercial
reaches) and a stretch of US Highway 26 (crosses the Palouse River in the Colfax –
Industrial/Commercial reach) where it meets US Highway 195.
There are three bridges within shoreline jurisdiction of the Palouse River in the City of
Colfax, including the two highway bridges identified above and one abandoned rail
bridge in the Colfax-Residential and Colfax – Industrial/Commercial reaches.
Public Access
Current Parks and Public Open Space
The following shoreline public access sites and trails are located within Colfax’s
shorelines:
Colfax Golf and Country Club is a nine-hole public course with fairways, water
hazards, sand traps, and chipping and putting areas. The Club has a pro shop and a
full service bar.
Eels Park features a fountain, restrooms, a half-basketball court, and a playground.

Final Whitman County Coalition Shoreline Analysis Report
132
McDonald Park is an athletic compound along the Palouse River. It has a regulation
baseball field, a softball field, two multipurpose fields, and a soccer field. There is a
press building with restrooms, an office, meeting rooms, and concession stands. The
park is surrounded by a lighted path for walking/jogging.
Schmuck Park offers a large covered picnic area, day use facilities, a playground, a
sand volleyball court, a horse shoe pit, and a tennis court.
Good Park is located on SR 195 at the south end of town.
Future Public Access
Several improvements are being considered at shoreline public access sites in the City.
These include the flowing:
At Good Park, the City is considering a pedestrian bridge across the South Fork and
a restroom.
The City is considering a restroom at the Codger Pole.
At Schmuck Park, the City is considering improving, and potentially moving, the
pool. The pool is 50 years old and in need of maintenance. (Andy Burgard, City of
Colfax, personal communication)
Historic and Archeological Sites
The Colfax Main Street Historic District is within the shoreline reaches of the City of
Colfax. There are also 58 structures that are fifty years or older within shoreline
jurisdiction. Forty-two of these structures are concentrated within the Colfax – Flume
Commercial reach.
6.2.3 Town of Malden
Land Use Pattern
The Town of Malden is located on Pine Creek roughly two miles south of the County
boundary. It has a current population of 204. The shoreline jurisdiction includes 58
acres along slightly more than a mile of Pine Creek. The entire shoreline jurisdiction is
classified as being in agriculture use.
Existing and Planned Land Uses
Zoning in Malden’s shorelines is not available, which is a data gap. Appendix D shows
the current land use and ownership profile for each shoreline reach.
The current shoreline environment designation is Urban. According to the current
(1974) Shoreline Management Master Program, the Urban designation is meant to
provide “optimum utilization of shorelines within urbanized areas by providing for

The Watershed Company and BERK August 2014
133
intensive public use and by managing development so that it enhances and maintains
shorelines for a multiplicity of uses.”
Potential New Development and Uses
There are no known new uses or developments planned for Malden’s shoreline.
Water-oriented Use
Water-oriented uses within Malden are limited. As noted above, land use in the
shoreline is classified as agriculture. There are no other identified water-oriented uses.
Transportation and Utilities
There is little transportation infrastructure within the shoreline of the Town of Malden.
The existing transportation infrastructure includes only the former railbed that is now
designated as the John Wayne Trail. There is one road (A Street) within shoreline
jurisdiction that crosses Pine Creek and connects the north and south parts of town.
Public Access
Current Parks and Public Open Space
There are no recreation sites within the Town. The John Wayne Pioneer Trail provides
public access to shorelines along 2,365 lineal feet of trail. Motorized access, hunting and
any access except by permit from the state parks Rangers is prohibited.
Future Public Access
The Washington State Parks Department is planning to convert nine miles of abandoned
rail bed to trail by 2015, and will construct a trailhead at Malden in a former rail yard
(Prager 2014).
Historic and Archeological Sites
There are no historic or archeological sites within the Town.
6.2.4 Town of Rosalia
Land Use Pattern
Rosalia has a population of 557 and is located along the east bank of Pine Creek, roughly
a mile and a half from the northern County boundary. The shoreline jurisdiction
includes 47 acres along three quarters of a mile of shoreline. From south to north, Pine
Creek flows through agricultural areas, residential and park areas, and then light
industrial areas before leaving town. Shoreline jurisdiction includes some residential
development and some industrial development in the form of grain silos. Current land
uses along the Town’s shoreline are as follows:

Final Whitman County Coalition Shoreline Analysis Report
134
Agriculture classified under current use chapter 84.34 RCW 33%
Open space land classified under chapter 84.34 RCW 31%
Parks 20%
Household, single family units 11%
Recreational activities 3%
Food and kindred products 1%
Aircraft transportation <1%
Existing and Planned Land Uses
Rosalia’s shoreline jurisdiction contains agricultural uses on the east side of Pine Creek.
Significant uses on the west side of the creek include Rosalia City Park, the Rodeo
Grounds, the COAG facility, and the Town’s wastewater treatment facility and pond.
Residential uses are located throughout the Town’s shoreline in a low-density
configuration. There is no current zoning data for Rosalia, which is a data gap.
Ownership data shows no state or federal ownership in shoreline jurisdiction.
Appendix D shows the current land use and ownership profile for each shoreline reach.
The current shoreline environment designation is Urban. According to the current
(1974) Shoreline Management Master Program, the Urban designation is meant to
provide “optimum utilization of shorelines within urbanized areas by providing for
intensive public use and by managing development so that it enhances and maintains
shorelines for a multiplicity of uses.”
Potential New Development and Uses
As a means of providing context for a discussion of future shoreline development and
use, historic population and housing growth trends are presented for Rosalia. The Town
of Rosalia grew in population from 1990 until 2002, but since then has steadily decreased
in population to 1990 numbers. Trending for housing units is similar to that of
population; there was steady growth until 2001, and then decline. In 2010, there were
550 people living in Rosalia and 270 housing units. Figure 6-3 compares historical
trends for population and housing units for the Town of Rosalia, years 1990 through
2010.
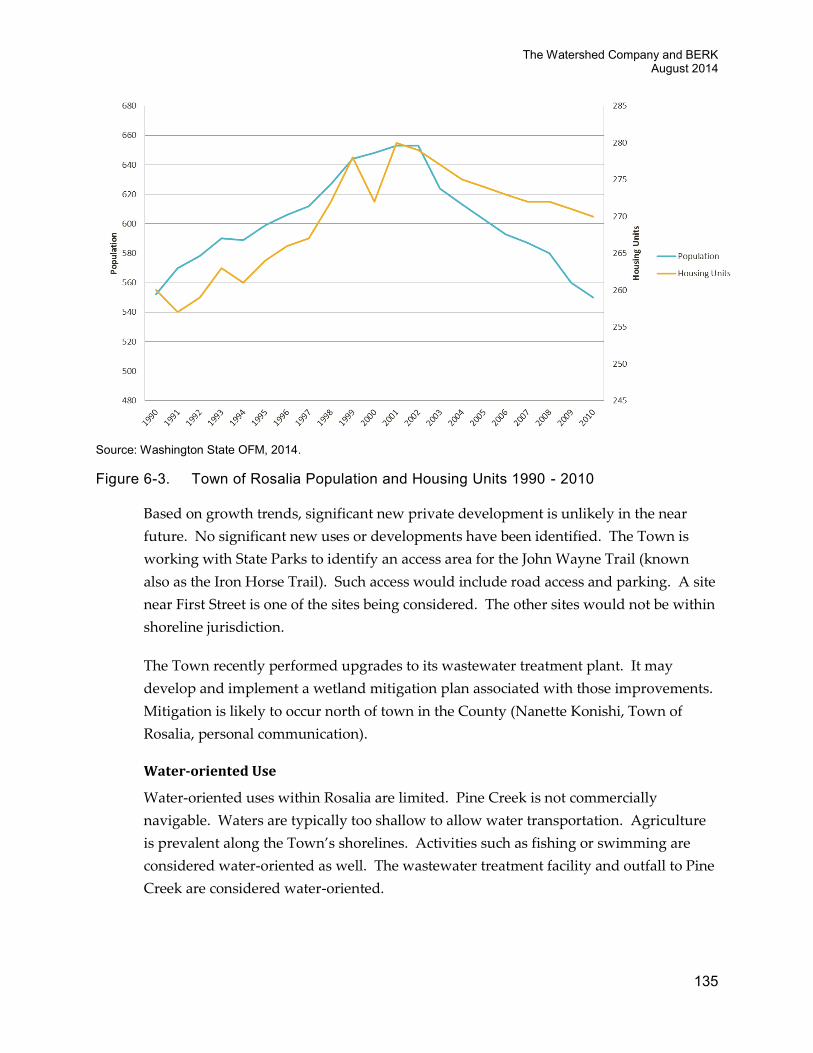
The Watershed Company and BERK August 2014
135
Source: Washington State OFM, 2014. Figure 6-3. Town of Rosalia Population and Housing Units 1990 - 2010
Based on growth trends, significant new private development is unlikely in the near
future. No significant new uses or developments have been identified. The Town is
working with State Parks to identify an access area for the John Wayne Trail (known
also as the Iron Horse Trail). Such access would include road access and parking. A site
near First Street is one of the sites being considered. The other sites would not be within
shoreline jurisdiction.
The Town recently performed upgrades to its wastewater treatment plant. It may
develop and implement a wetland mitigation plan associated with those improvements.
Mitigation is likely to occur north of town in the County (Nanette Konishi, Town of
Rosalia, personal communication).
Water-oriented Use
Water-oriented uses within Rosalia are limited. Pine Creek is not commercially
navigable. Waters are typically too shallow to allow water transportation. Agriculture
is prevalent along the Town’s shorelines. Activities such as fishing or swimming are
considered water-oriented as well. The wastewater treatment facility and outfall to Pine
Creek are considered water-oriented.

Final Whitman County Coalition Shoreline Analysis Report
136
Transportation and Utilities
There is 0.53 mile of abandoned rail within the shoreline reaches of the Town of Rosalia.
100 percent of the rail within the reaches is abandoned. There are 0.22 mile of roads
within the shoreline. All roads are classified as rural local access roads. There is one
bridge within shoreline jurisdiction on a minor road where West 7th Street crosses Pine
Creek in the Rosalia – Residential/Open Space reach.
Public Access
Current Parks and Public Open Space
Rosalia City Park provides access to Pine Creek. It includes a swimming pool, ball
fields, and open space. The John Wayne Trail follows Pine Creek on the east side. The
rail offers visual access to the Creek.
Future Public Access
No future public access sites have been identified.
Historic and Archeological Sites
There are three structures 50 or more years old within the shoreline reaches of the Town
of Rosalia.
6.2.5 City of Palouse
Land Use Pattern
The City of Palouse has a population of 1,021 and is located along the North Fork of the
Palouse River (North Fork), approximately two miles from the Idaho border. The
topography of Palouse is dominated by the Palouse River and its associated floodplain.
The main street and downtown area are built in the floodplain and are subject to
periodic flooding, most recently in 1996. The elevation of the City ranges from 2,400 feet
to 2,660 feet.
The shoreline jurisdiction includes 115 acres along just under two miles of the North
Fork. The river flows from the east through open space, residential areas, the City’s
business district (East Main Street), and back out into the County. Shoreline jurisdiction
includes residential, commercial and recreational uses. Current land uses within the
City’s shoreline include the following:
Undeveloped land 59%
Utilities 21%
Parks 7%
Household, single family units 5%

The Watershed Company and BERK August 2014
137
Recreational activities 3%
Agriculture classified under current use chapter 84.34 RCW 1%
Business services 1%
Miscellaneous manufacturing 1%
Mobile home parks or courts 1%
Other retail trade 1%
Retail trade - automotive, marine craft, aircraft, and accessories <1%
Wholesale trade <1%
As shown, undeveloped land is the most prevalent current land use. The area of
undeveloped land extends along both sides of the North Fork from the eastern
boundary of the City to North Hall Street. Utilities are also a prominent use. That
category includes all of the City’s rights-of-way, which comprise a significant land area.
Parks and residential uses are the next most common uses.
Existing and Planned Land Uses
As noted above, more than half of the City’s shorelines are undeveloped. Much of the
south side of East Main Street is within shoreline jurisdiction. According to the City’s
Comprehensive Plan, land use in the downtown corridor includes light industrial and/or
agricultural-based businesses on the eastern and western borders. In the downtown
area, businesses include a grocery store, several antique stores, an art gallery, a cafe, a
museum, a quilt shop, and a tavern. The downtown corridor also contains residential
housing, three parks, and the Palouse Community Center. There is some land still
available for development, including a lot just west of the Palouse Community Center
and the brownfield site (City of Palouse 2014).
Most of the commercial activity lies in the floodplain and faces the street. The backs of
the buildings face the river. Toward the west end of the City, there are park uses and
industrial uses in the form of grain silos and a rail yard. Zoning in Palouse is a mix of
low-density residential, commercial, light industrial, and agriculture. Ownership Data
shows no state or federal ownership in shoreline. Appendix D shows the current land
use, ownership profile, and current zoning5 for each shoreline reach.
The current shoreline environment designation is Urban. According to the current
(1974) Shoreline Master Program, The Urban designation is meant to provide “optimum
5 The City is currently in the process of updating its Zoning Map. When available, this analysis and the Appendix B zoning map will be updated.

Final Whitman County Coalition Shoreline Analysis Report
138
utilization of shorelines within urbanized areas by providing for intensive public use
and by managing development so that it enhances and maintains shorelines for a
multiplicity of uses.”
Palouse Comprehensive Plan
In 2014, the City of Palouse conducted a re-write of their Comprehensive Plan. The plan
establishes a vision of the community and guidelines for making choices on growth,
land use, protection of community values and other public development issues. Listed
here are the issues of concern, objectives and strategies identified in the plan that relate
to the City’s shoreline:
Economic Development:
The current commercial and industrial areas are located in a floodplain. This means
that improvement and construction in those areas will need to comply with the
Critical Areas Ordinance.
Land Use:
Survey results indicate a strong and consistent desire for the creation of more open
spaces, parks and recreational lands with particular emphasis on land near and
around the river.
Encourage the creation of more open spaces, parks and recreational lands with
particular emphasis on land near and around the river.
⁻ Develop new walking trails including one near the river linking the existing path
at Shady Lane with a path along the north bank of the river.
⁻ Build a bridge connecting Hayton-Greene Park with the south entrance park
⁻ Promote river streamside vegetation and reclamation including planting and
maintaining
⁻ Compatible plants, trees and other vegetation.
⁻ Investigate the feasibility of biking and horseback riding trails.
Environment:
Main Street (including residential, central business, and light industrial uses) is
located in a flood prone area, the floodplain of the Palouse River.

The Watershed Company and BERK August 2014
139
Potential New Development and Uses
As a means of providing context for a discussion of future shoreline development and
use, historic population and housing growth trends are presented for Palouse. The City
of Palouse has seen fairly steady growth in population from 1990 to 2010. Housing unit
growth has matched the population growth trend, year to year as well. In 2010, there
were 998 people living in Palouse and 474 housing units. Figure 6-4 compares historical
trends for population and housing units for the City of Palouse, years 1990 through
2010.
Source: Washington State OFM, 2014. Figure 6-4. City of Palouse Housing and Population Units 1990 - 2010
That upward trend may result in demand for shoreline development. According to City
staff (Joyce Beason, City of Palouse, personal communication), there are potential new
uses and development likely in the shoreline. They include the following:
Reconstruction of a fire-damaged building at 127 East Main Street.
There is an ongoing brownfield clean up at a former gas station at 335 East Main
Street. The City owns the property and has been working with EPA and Ecology on
cleaning the site with the intention to sell the property to a private owner/developer.
There is a vacant used car lot at 320 East Main Street on the north side of the street.
There has been some private interest in developing a mini-storage facility.

Final Whitman County Coalition Shoreline Analysis Report
140
A non-profit in the City is looking for a site to develop a skate park. Two sites on
East Main Street are being considered.
No other future uses or developments have been identified.
Water-oriented Use
Water-oriented uses are limited in Palouse. Those that do occur include the agricultural
activities, as well as the public access sites described under Public Access. As noted
above, most of the businesses along East Main Street are oriented away from the river.
Uses such as restaurants and cafes that offer seating areas or windows with views of the
river are considered water-oriented uses. The river is used for fishing, swimming and
boating (primarily non-motorized).
Transportation and Utilities
There is 0.88 mile of rail within the shoreline of the City of Palouse, most of which is
active. There is 0.71 mile of road infrastructure within the shoreline as well. The road
infrastructure is a mix of rural local access and major roads, including State Highway
272 where it crosses the Palouse River in the City of Palouse – Commercial reach.
There are approximately six bridges within shoreline jurisdiction, including one active
rail bridge in the City of Palouse – Agriculture reach, one minor road bridge in the City
of Palouse – Industrial and City of Palouse – Open Space reaches, one highway bridge
(SR 272) in the City of Palouse – Commercial reach, one minor bridge and one footpath
bridge in the City of Palouse – Commercial reach, and one minor road bridge in the City
of Palouse – Open Space reach.
The City’s wastewater treatment plant is partially in shoreline jurisdiction. The sewage
treatment facility was completed in 1995 and survived the 1996 flood. The facility
includes an in-house lab for some testing. In 2006 the facility was upgraded.
Public Access
Current Parks and Public Open Space
According to the land use data, 10 percent of the City’s shorelines are parks and
recreational activities. There are several access points to the river along the City’s streets
and walking paths. The following park offers physical and visual access to the
shoreline:
Hayton-Greene Park, located along the Palouse River at the west end of Main Street,
includes seven acres offering a variety of recreation activities. It has a public

The Watershed Company and BERK August 2014
141
swimming pool, basketball courts, picnic shelters, outdoor grills, gazebo, and
toddler and youth playground equipment.
Future Public Access
The City’s Comprehensive Plan identifies the following future public access
opportunities:
Install a walking bridge between Hayton-Greene Park and Ancel Jeffers Memorial
Lions Club Park.
Have volunteer and civic groups help build and maintain walking trails along the
Palouse River.
Upgrade War Memorial at Hayton-Greene Park.
Develop a skateboard park in cooperation with volunteer organizations.
Historic and Archeological Sites
There is one historic site and one historic district within the shoreline reaches of the City
of Palouse.
6.2.6 City of Pullman
The South Fork of the Palouse River runs through the City of Pullman and is the only
Shoreline of the State within the City. The shoreline jurisdiction includes 165 acres along
the South Fork Palouse River. The shoreline area flows from the southeast through
recreational, residential and commercial areas, lined with the Bill Chipman Palouse Trail
before passing under North Grand Avenue (SR 27). It then proceeds through largely
industrial and agricultural areas before passing back into the County. Utilities uses are
the most common in the City’s shorelines (44%). Other major land uses in the City’s
shoreline jurisdiction include recreational (15%), residential (13%), trade/services (12%),
and manufacturing (7%). There are 18.7 acres (11%) of shoreline area classified as
undeveloped land.
Land Use Pattern
Existing and Planned Land Uses
The South Fork Palouse River is divided into five reaches within the City of Pullman for
this analysis. Existing land use within the City’s shoreline jurisdiction is a mix of uses.
The most prevalent uses are transportation and utilities based on the presence of roads,
the railroad and Pullman Transit property and other City utilities such as the
wastewater treatment plant. Manufacturing and industrial uses are common uses west
of SR 27. Commercial uses are common from North Grand Avenue east to NE Spring
Street. Parks and open space are also a major component of the City’s shoreline (see

Final Whitman County Coalition Shoreline Analysis Report
142
Public Access below), particularly from North Grand Avenue to the southern city
boundary. Residential areas are mapped intermittently throughout the City, although
there are limited residences in shoreline jurisdiction. There is a mobile home park along
SE Professional Mall Boulevard. The majority of land within shoreline jurisdiction is
mapped as privately owned, with slightly more than 11 acres (7%) owned by
Washington State University. This data does not include City-owned property, which a
substantial portion of the shoreline is within.
Land within shoreline jurisdiction of the South Fork Palouse River is zoned for a variety
of uses. The current land use pattern generally follows zoning. The shorelines along the
northern portion of the South Fork Palouse are generally zoned Heavy Industrial. Much
of the shoreline jurisdiction through the center of town is zoned Central Business
District and General Commercial District. The area west of City Playfield is zoned low-
density multi-family.
The current shoreline environment designation in Pullman is primarily Urban.
However, most of the Parks reach is designated Conservancy. According to the current
(1974) Shoreline Management Master Program, the Urban designation is meant to
provide “optimum utilization of shorelines within urbanized areas by providing for
intensive public use and by managing development so that it enhances and maintains
shorelines for a multiplicity of uses.” The Conservancy designation is meant “to protect,
conserve and manage existing natural resources and valuable historic and cultural areas
in order to ensure a continuous flow of recreational benefits to the public and to achieve
sustained resource utilization.”
Pullman Comprehensive Plan
Pullman last developed and adopted a Comprehensive Plan in 1999. The City is
currently beginning a process of updating that plan. The current Comprehensive Plan
contains policies for establishing a general land use pattern and sets priorities for future
development, housing, and utility and public services delivery.
The Plan recognizes the shorelines as presenting a special opportunity to provide habitat
for wildlife and serve as flood water storage areas. The Plan calls for special efforts to
protect shorelines or mitigate impacts from development. It also calls for expansion of
public access to shorelines. Connections between shoreline and the City’s natural areas
in the form of trails, riverfront walkways, and open space corridors are noted as part of
the City’s vision. The City’s land use goals and policies related to shorelines include the
following:
The Watershed Company and BERK August 2014
143
GOAL LU13: Preserve shoreline areas, while assuring public access to the water.
Policy LU13.1: Protect public access to the shorelines. Review of all private and
public developments should consider and provide for public access as close to the
water as possible, consistent with protection of environmental resources and water
quality.
Policy LU13.2: Protect and enhance public views of the shoreline area from adjacent
upland areas, consistent with the need to protect environmental resources (including
vegetation).
Policy LU13.3: Preserve the natural character of the shoreline. Ensure that public and
private development, including public access and recreational development,
minimizes disturbance of environmental resources and shoreline ecosystems.
Policy LU13.4: Encourage the use of native plant materials in restoration of shoreline
areas or landscaping development within the shoreline area. Protect areas of native
vegetation.
Policy LU13.5: Encourage the design and use of naturally regenerating systems of
erosion control and water quality treatment in shoreline areas.
Policy LU13.6: Ensure that all shoreline uses are located, designed, constructed, and
maintained to minimize adverse impacts to water quality and fish and wildlife
resources.
Policy LU13.7: Encourage development of trails along the city’s streams. All trails
should be designed to protect environmental resources and minimize adverse effects
to water quality.
Potential New Development and Uses
As a means of providing context for a discussion of future shoreline development and
use, historic population and housing growth trends are presented for Pullman. The City
of Pullman has experienced steady, nearly constant growth since 1990. Housing units
have also steadily grown year to year since 1900. The pace of growth for population and
housing units in Pullman has quickened since the early 2000s. In 2010, there were 29,799
people living in Pullman and 11,966 housing units. Figure 6-5 compares historical
trends for population and housing units for the City of Pullman, years 1990 through
2010.

Final Whitman County Coalition Shoreline Analysis Report
144
Source: Washington State OFM, 2014. Figure 6-5. City of Pullman Population and Housing Units 1990 - 2010
There are approximately 18.7 acres of lands designated as undeveloped in the City’s
shoreline. Nearly all of it is located in the Pullman – Parks reach. Most of this area is
zoned General Commercial District. The undeveloped areas are in two primary
locations. The first is near the south end of the City (in the Parks and South Commercial
reaches) and currently used as open space. Much of it is likely to remain undeveloped.
The second area is much smaller. It is located along the left bank near the north end of
the City in a Residential reach, and is zoned Low Density Multi-Family.
Based on conversations with City staff, there are limited likely new developments in
shoreline jurisdiction (Pete Dickinson, City of Pullman, personal communication).
Those that are possible include a property near the intersection of SE Johnson Road and
SE Bishop Boulevard, on the west side of the River, south of the Village Center Cinemas
which has been rezoned to commercial and multi-family residential. Development on
that property is probable and could include areas in shoreline jurisdiction. There is also
a new park being planned at SE Johnson Road and Old Moscow Avenue, as well as
several parks upgrades (see Public Access, below).
Water-oriented Uses
Water-oriented uses within Pullman are limited. The South Fork Palouse River is not
commercially navigable. Waters are typically too shallow to allow water transportation

The Watershed Company and BERK August 2014
145
or many recreational uses such as swimming or fishing. Industrial uses were historically
located along the shoreline because of flat, level terrain.
The most prevalent water-oriented use is public access. There are approximately 25
acres of identified parks and amusements within the City’s shorelines (see Public Access
below). Water-enjoyment amenities include trails, ball parks, and viewpoints. Some of
the commercial uses that are adjacent to the shoreline have windows that face the river
or outdoor seating areas.
The City’s wastewater treatment plant is considered water-related and its outflow
would be considered water-dependent. Other utility outfalls would also be considered
water-oriented.
Transportation and Utilities
In general, there is a moderate amount of transportation infrastructure within the
shoreline of the City of Pullman. The majority of the infrastructure for transportation is
active rail. There are 2.5 miles of rail within shoreline reaches of the City.
There are 2.3 miles of road infrastructure within shoreline reaches of the City of
Pullman. The roads are a mix of urban major collector, urban minor collector, and major
roads including State Route 27 and State Route 270.
State Route 27 crosses the South Fork Palouse River in the Pullman –
Commercial/Business District reach.
State Route 270 crosses the South Fork Palouse River in the Pullman – Parks reach
and Pullman – Commercial/Business District reach.
There are approximately eight bridges within shoreline jurisdiction, including two
bridges on state highways, five minor road bridges, and one active rail bridge.
According to the City’s Comprehensive Plan (1999), the City’s wastewater treatment
plant, located along the South Fork Palouse, in the north of the City, has a peak capacity
of 8.6 million gallons per day (mgd), with an average flow of 3.29 mgd. The system
includes more than 62 miles of collection pipes.
Pullman’s storm drainage system is typical of most cities. It consists of natural and
constructed conveyances, including detention ponds and underground settlement
vaults, biofiltration swales, ditches, catch basins, pipes, and natural watercourses such as
Missouri Flat Creek, Dry Fork Creek, Paradise Creek, and the South Fork of the Palouse
River. Storm drain systems are required by the City for all new land use developments.

Final Whitman County Coalition Shoreline Analysis Report
146
The design goals for storm water systems in the City are based on current Washington
State stormwater handling guidelines that require protection of adjacent properties;
limitations on the rate of storm water runoff and the peak runoff volume; and provision
of some level of treatment, such as settling in a detention pond or biofiltration in a
grassy swale.
Public Access
Current Parks and Public Open Spaces
The City has several parks and open spaces and trails along the South Fork Palouse
River. Table 6-5 summarizes the City’s public access lands and facilities, which are
described in more detail below.
Table 6-5. City of Pullman Open Space and Public Access Summary
Shoreline Reach
Open Space Acres
(Percent of Reach)
# of Parks Campground Trail
(Lineal Feet) Boat
Launches Moorage
Pullman – Commercial/ Business District
3.0(11.5) 1 0
Grand Avenue Greenway (2,186)
0 0
Pullman – Parks 14.6 (30.5) 4 0
Grand Avenue Greenway (1,295)
0 0
Pullman - Residential 3.7 (13. 8) 1 0
Bill Chipman Palouse Trail (436)
0 0
Pullman – South Commercial 0 0 0
Bill Chipman Palouse Trail (156)
0 0
The following shoreline public access sites and trails are located within Pullman’s
shoreline jurisdiction:
Bill Chipman Palouse Trail is a 7-mile trail from Pullman to Moscow, Idaho. It is
used for biking, in-line skating, and walking.
Grand Avenue Greenway is a segment of the 8-mile Pullman Loop Trail, which
circles Pullman's College Hill neighborhood and the Washington State University
campus. The trail begins downtown at the Pufferbelly Depot, where three railroad
tracks converge, and follows the tracks to NW Terre View Drive. The route provides
a view of Missouri Flat Creek and easy access to the Terre View Trail.
The Watershed Company and BERK August 2014
147
Spring Street Skate Park is 2.75 acres. The park includes a skateboard facility,
public restrooms, and a link to the Bill Chipman Palouse Trail.
City Playfields are 8.66 acres in size. There are three softball fields, a jogging track,
exercise stations, volleyball standards, a batting cage, picnic tables, drinking
fountains and restrooms.
Reaney Park is a 1.64-acre park south of NE Morton Street. It contains a public
swimming pool and playground. The park is separated from the river by the BNSF
railroad.
Community P-Patch is a public 3-acre community garden was founded on the old
Koppel Farm estate on SE Derby Street. It has 110 plots that are utilized by
members. The garden property is partially within shoreline jurisdiction. (City of
Pullman 2014)
Future Public Access
The City’s Parks and Recreation 2014-2018 Five Year Plan (2014) establishes objectives for
the provision of parks and open space in general and for shoreline access in particular.
The Plan notes that the “shoreline of the South Fork of the Palouse River holds special
significance to the community, and the city should place a priority upon acquiring
parcels of land along the shoreline, as they become available.” The Parks and Recreation
Plan also contains the following goals and policies related to future public access:
Policy P2.1: Pursue funding sources for the acquisition and improvement of
shoreline parcels within the city.
Policy P2.2: Develop the river park area from City Playfield to Grand Avenue to
preserve the shoreline and provide recreational opportunities.
Policy P2.5: Require buildings to be set back from stream channels to provide open
space for riparian areas.
The City has identified several new parks and park improvements likely to occur in the
near future. The City has permitted construction of Mary’s Park at the intersection of
NE Johnson Road and Old Moscow Road. The site is 5 acres and will have a
playground, shelter, parking lot and RV facilities. Most of the infrastructure would be
outside of shoreline jurisdiction. The City also plans improvements to Reaney Park.
Plans include expanding the pool deck south toward the river during the summer of
2014.

Final Whitman County Coalition Shoreline Analysis Report
148
Historic and Archeological Sites
There are two sites on the State Register of Historic Sites within the shoreline reaches of
the City of Pullman:
The Cordova Theater in Pullman is on the National Register of Historic Places. It is a
Mission/Spanish Revival style theater built in Pullman in 1927.
Hutchison Studio was the photo studio of Ralph Raymond Hutchison. As a
professional photographer, Hutchison operated studios in Endicott and Pullman,
Washington and Moscow, Idaho. He was the photographer for the WSU Yearbook
and his collection of photographs, now housed at WSU Libraries, documents the
campus of WSU and rural Washington communities between the 1920s and 1950s.
There are 37 structures that are 50 or more years old within the shoreline reaches of the
City of Pullman. The structures are concentrated in the Commercial/Business District
and the Parks shoreline reaches.
6.2.7 City of Tekoa
Land Use Pattern
Tekoa has a population of 791 and is located at the confluence of Hangman Creek and
Little Hangman Creek which enters from the east. Tekoa’s shoreline jurisdiction
includes approximately 126 acres along both creeks. Most of Tekoa’s shoreline
jurisdiction contains open space and agriculture. It also contains some residential
development along Water Street and some industrial development along South Ramsey
Street. Tekoa’s wastewater treatment facility is also located in the shoreline, in the
northwest section of town. Current land uses along the City’s shoreline are as follows:
Undeveloped land 37%
Open space land classified under chapter 84.34 RCW 19%
Recreational activities 16%
Agriculture classified under current use chapter 84.34 RCW 15%
Household, single family units 7%
Utilities 2%
Agriculture related activities 2%
Miscellaneous services 2%
Other retail trade <1%
Parks <1%
Retail trade - automotive, marine craft, aircraft, and
accessories
<1%

The Watershed Company and BERK August 2014
149
Existing and Planned Land Uses
All land within the shoreline jurisdiction is privately owned. Land within shoreline
jurisdiction of Hangman Creek is zoned for a variety of uses. Residential zoning is the
most common in shoreline jurisdiction (46%). There is some industrial and commercial
zoning (<2%). Nearly half (48%) of the shoreline does not have zoning data; this is a
data gap. Ownership data shows no state or federal ownership in shoreline jurisdiction.
Appendix D shows the current land use, ownership profile, and available zoning for
each shoreline reach.
The current shoreline environment designation is Urban. According to the current
(1974) Shoreline Management Master Program, the Urban designation is meant to
provide “optimum utilization of shorelines within urbanized areas by providing for
intensive public use and by managing development so that it enhances and maintains
shorelines for a multiplicity of uses.”
Potential New Development and Uses
As a means of providing context for a discussion of future shoreline development and
use, historic population and housing growth trends are presented for Tekoa. The City of
Tekoa has been declining in population since 2001. There was a significant jump in
population from 1993 to 1994, but the population has in general remained between 780
and 820 people. The number of housing units grew rapidly from 1999 to 2000, but has
since leveled off. Figure 6-6 compares historical trends for population and housing units
for the City of Tekoa, years 1990 through 2010.
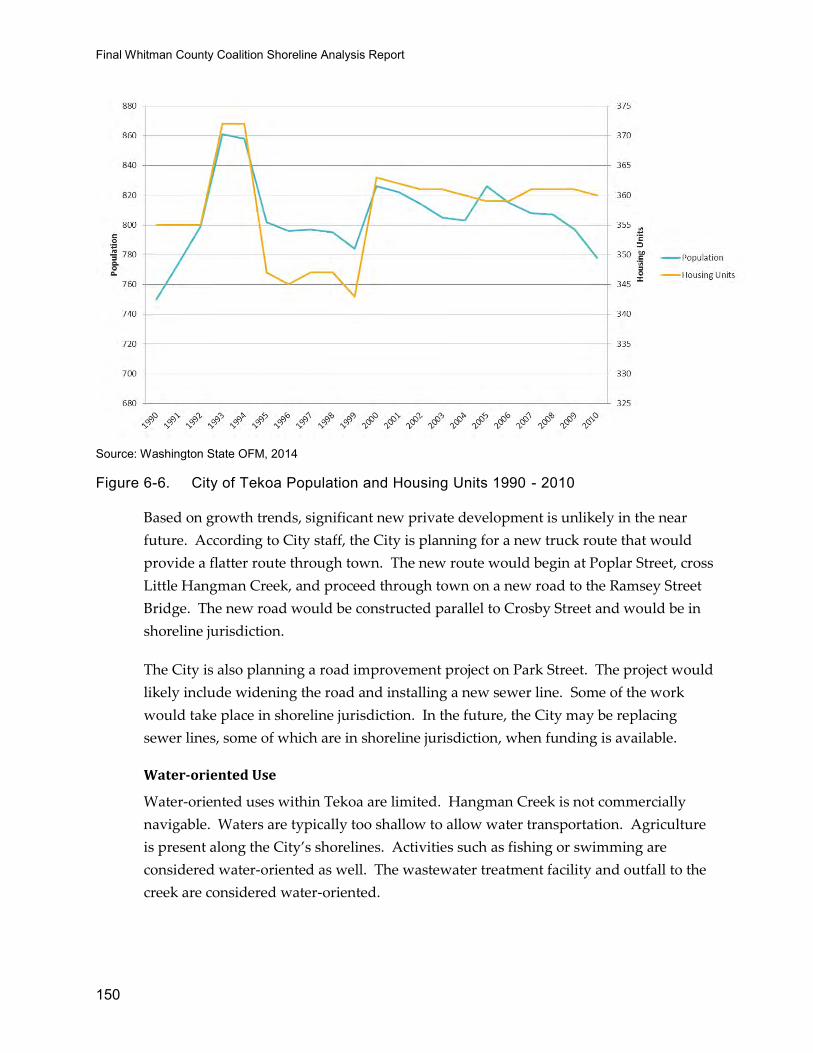
Final Whitman County Coalition Shoreline Analysis Report
150
Source: Washington State OFM, 2014 Figure 6-6. City of Tekoa Population and Housing Units 1990 - 2010
Based on growth trends, significant new private development is unlikely in the near
future. According to City staff, the City is planning for a new truck route that would
provide a flatter route through town. The new route would begin at Poplar Street, cross
Little Hangman Creek, and proceed through town on a new road to the Ramsey Street
Bridge. The new road would be constructed parallel to Crosby Street and would be in
shoreline jurisdiction.
The City is also planning a road improvement project on Park Street. The project would
likely include widening the road and installing a new sewer line. Some of the work
would take place in shoreline jurisdiction. In the future, the City may be replacing
sewer lines, some of which are in shoreline jurisdiction, when funding is available.
Water-oriented Use
Water-oriented uses within Tekoa are limited. Hangman Creek is not commercially
navigable. Waters are typically too shallow to allow water transportation. Agriculture
is present along the City’s shorelines. Activities such as fishing or swimming are
considered water-oriented as well. The wastewater treatment facility and outfall to the
creek are considered water-oriented.

The Watershed Company and BERK August 2014
151
Transportation and Utilities
There is 0.53 mile of abandoned rail within the shoreline reaches of the City of Rosalia.
There is 0.22 mile of roads within the shoreline; all roads are classified as rural local
access roads. There is one bridge within shoreline jurisdiction on a minor road where
West Seventh Street crosses Pine Creek in the Rosalia – Residential/Open Space reach.
Public Access
Current Parks and Public Open Space
While there is undeveloped open space in shoreline jurisdiction, developed public access
is limited. There is a picnic shelter along the Creek near Ramsey Street, and Rosalia City
Park provides access to Pine Creek. It includes a swimming pool, ball fields and open
space. The John Wayne Trail offers visual access to the creek.
Future Public Access
No future public access sites have been identified.
Historic and Archeological Sites
There are 17 structures that are fifty or more years old within the shoreline reaches of the
City of Tekoa.
7 SHORELINE MANAGEMENT RECOMMENDATIONS
The following are recommended actions for translating inventory and characterization
findings into the draft SMP policies, regulations, environment designations, and
restoration strategies for areas within shoreline jurisdiction. In addition to the following
analysis-specific recommendations, the updated SMP(s) will incorporate all other
requirements of the Shoreline Management Act (RCW 90.58) and the Shoreline Master
Program Guidelines (WAC 173-26).
7.1 Environment Designations
As outlined in WAC 173-26-191(1)(d), “Shoreline management must address a wide
range of physical conditions and development settings along shoreline areas. Effective
shoreline management requires that the shoreline master program prescribe different
sets of environmental protection measures, allowable use provisions, and development
standards for each of these shoreline segments.” In WAC 173-26-211(2)(a), the
Final Whitman County Coalition Shoreline Analysis Report
152
Guidelines further direct development and assignment of environment designations
based on “existing use pattern, the biological and physical character of the shoreline,
and the goals and aspirations of the community as expressed through comprehensive
plans…”
The County’s current Shoreline Management Master Plan utilizes a system of four
environment designations: Natural, Conservancy, Rural, and Urban. Urban is applied
to all of the Cities and Towns, except that Pullman also includes some land area
designated Conservancy. Urban also applies to the intense Port and park developments
on the Snake River. Most of the remainder of the County is in a Rural designation,
although there are some Conservancy areas on the Palouse River extending
approximately 12 miles upstream of the Snake River, on the Rock Lake system, and a
short section of Union Flat Creek. Short sections of Natural are mapped on Rock Lake
and on the Palouse River. The shoreline environment designation map has not been
modified since it was originally developed in 1974, and thus the environment
designation assignments no longer provide the best fit with the existing biological and
land use character or the community’s vision as expressed in local planning documents
and ordinances.
The Guidelines recommend use of six unique environments: Aquatic, Natural, Urban
Conservancy, Rural Conservancy, Shoreline Residential, and High Intensity. Urban
Conservancy, Shoreline Residential, and High Intensity are each intended by the
Guidelines to be applied only in City and Towns, UGAs, and intensely developed rural
areas. However, each jurisdiction may use “alternative” environment designations, as
appropriate, as long as they provide equal or better protection than the standard.
The findings of this Analysis Report would support development of several alternative
designations to supplement the Guidelines system as follows:
Consider development of a specific “Rural Industrial” or “Port” designation to allow
for special consideration of the unique port-related developments on the Snake
River.
Consider development of a “Shoreline Parks” designation that might facilitate
implementation of parks and recreation management plans in both the County and
the Cities.
Consider development of a “Flume” designation in Colfax to simplify development
of unique standards and allowed uses that may be appropriate in this distinct and
highly altered environment.

The Watershed Company and BERK August 2014
153
7.2 General Policies and Regulations
7.2.1 Archaeological and Historic Resources
The findings of this Shoreline Analysis Report do not suggest a need for additional
regulations beyond those mandated by the SMP Guidelines.
7.2.2 Critical Areas
The County and Cities should consider whether their critical areas regulations should be
incorporated into the SMP by reference or through direct inclusion. The latter method is
generally recommended, particularly when the critical areas regulations have not been
updated recently and thus may require considerable revision to meet the most current
scientific standards as mandated by WAC 173-26-201(2)(a). Either method of
incorporation will require modification of the County’s and Cities’ critical areas
regulations to different degrees as they apply in shoreline jurisdiction to meet SMA
criteria. For example:
Any exceptions, such as reasonable use, will need to be removed as the appropriate
SMA process for such action is through the Shoreline Variance.
The County’s critical areas regulations establish recommended buffers for shoreline
streams of 250 feet; the City of Pullman’s regulations require a buffer of 150 feet on
shoreline streams. These regulations will need to be revisited to assess if changes are
needed to recognize existing shoreline conditions and to accommodate water-
oriented and other preferred uses consistent with no net loss of ecological functions
(as required by WAC 173-26-221(2)(a)(ii)). In particular, the existing stream buffers
are not environment designation- or waterbody-based, which indicates that they
may need to be further customized to accomplish these objectives. For example,
development closer than 250 feet is essential (and presently ongoing) at Port
properties on the Snake.
The County’s, Pullman’s and Palouse’s wetlands regulations generally look up-to-
date, although they will still need to be reviewed carefully to ensure consistency
with the latest Ecology guidance.
7.2.3 Flood Hazard Reduction
The Cities and Towns have been particularly hard hit by severe floods in the past.
Consistent with the WAC provisions in the Guidelines, the SMP(s) should provide
flexibility for developing and maintaining flood hazard reduction measures as
needed to continue protection of existing uses. Emphasis should be given to
maintaining existing ecological functions, at a minimum, through Ecology’s no net
loss criteria.
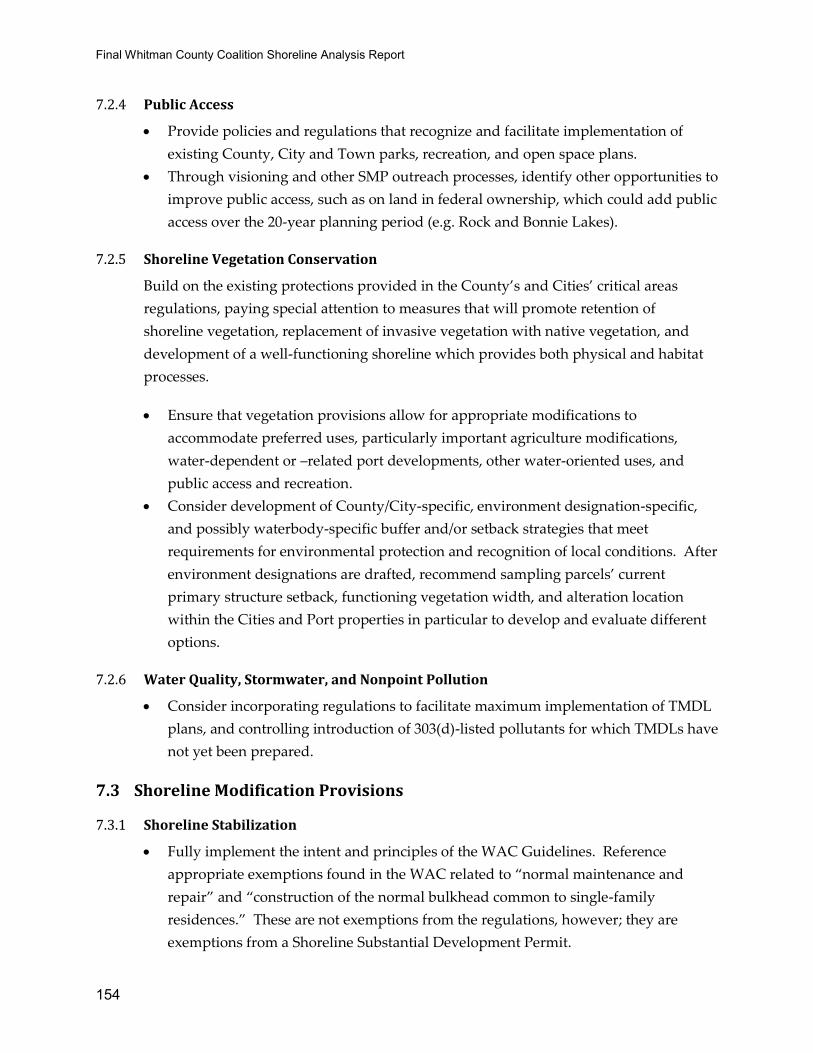
Final Whitman County Coalition Shoreline Analysis Report
154
7.2.4 Public Access
Provide policies and regulations that recognize and facilitate implementation of
existing County, City and Town parks, recreation, and open space plans.
Through visioning and other SMP outreach processes, identify other opportunities to
improve public access, such as on land in federal ownership, which could add public
access over the 20-year planning period (e.g. Rock and Bonnie Lakes).
7.2.5 Shoreline Vegetation Conservation
Build on the existing protections provided in the County’s and Cities’ critical areas
regulations, paying special attention to measures that will promote retention of
shoreline vegetation, replacement of invasive vegetation with native vegetation, and
development of a well-functioning shoreline which provides both physical and habitat
processes.
Ensure that vegetation provisions allow for appropriate modifications to
accommodate preferred uses, particularly important agriculture modifications,
water-dependent or –related port developments, other water-oriented uses, and
public access and recreation.
Consider development of County/City-specific, environment designation-specific,
and possibly waterbody-specific buffer and/or setback strategies that meet
requirements for environmental protection and recognition of local conditions. After
environment designations are drafted, recommend sampling parcels’ current
primary structure setback, functioning vegetation width, and alteration location
within the Cities and Port properties in particular to develop and evaluate different
options.
7.2.6 Water Quality, Stormwater, and Nonpoint Pollution
Consider incorporating regulations to facilitate maximum implementation of TMDL
plans, and controlling introduction of 303(d)-listed pollutants for which TMDLs have
not yet been prepared.
7.3 Shoreline Modification Provisions
7.3.1 Shoreline Stabilization
Fully implement the intent and principles of the WAC Guidelines. Reference
appropriate exemptions found in the WAC related to “normal maintenance and
repair” and “construction of the normal bulkhead common to single-family
residences.” These are not exemptions from the regulations, however; they are
exemptions from a Shoreline Substantial Development Permit.

The Watershed Company and BERK August 2014
155
Give preference to those types of shoreline modifications that have a lesser impact
on ecological functions. Policies and regulations should promote "soft" over "hard"
shoreline modification measures. Consider requiring a Conditional Use Permit for
any new hard shoreline stabilization, at least in certain environment designations.
Incentives should be included in the SMP that would encourage modification of
existing armoring, where feasible, to improve habitat while still maintaining any
necessary site use and protection.
7.3.2 Piers and Docks
There do not appear to be any private residential pier or dock structures in Whitman
County. If that is the case, this section may not be needed and all standards for over-
and in-water structures could be addressed in Boating Facilities.
7.3.3 Fill
Restoration fills can benefit shoreline functions and should be encouraged, including
improvements to shoreline habitats, material to anchor LWD placements, and as
needed to implement shoreline restoration.
7.3.4 Breakwaters, Jetties, Groins and Weirs
Consider prohibiting new breakwaters, jetties, groins, or weirs except where they are
essential to expansion, restoration or maintenance of existing water-dependent uses,
consistent with applicable state and federal regulations and potentially subject to a
Shoreline Conditional Use Permit.
7.3.5 Dredging and Dredge Material Disposal
Except for purposes of shoreline restoration, flood hazard reduction, and
maintenance of existing legal moorage and navigation, consider prohibiting new
dredging activities. Consider limiting upland dredge disposal to industrial areas
consistent with state/federal approval.
7.3.6 Shoreline Habitat and Natural Systems Enhancement Projects
Consider incentives to encourage restoration projects, particularly in areas identified
as having lower function. For example, allow modification of impervious surface
coverage, density, height, or setback requirements when paired with significant
restoration. Emphasize that certain fills, such as streambed gravels or material to
anchor logs, can be an important component of some restoration projects.
Final Whitman County Coalition Shoreline Analysis Report
156
7.4 Shoreline Uses
7.4.1 Agriculture
Maintenance of existing agriculture is commercially and culturally important to
Whitman County. This should be recognized in shoreline policies.
7.4.2 Aquaculture
Ensure that any salmon recovery-related aquaculture activities are facilitated in the
aquatic and appropriate upland environments along the Snake River.
7.4.3 Boating Facilities
Whitman County includes a variety of commercial and public boating facilities,
including port uses and park boat moorage and launching facilities. Regulations for
the over- and in-water components should be developed to provide applicants with
as much predictability as possible, while still allowing for an appropriate amount of
flexibility based on site-specific conditions and use-specific needs.
7.4.4 Commercial Development
There is minimal commercial use in unincorporated Whitman County along the
shorelines. The County should allow existing commercial uses to continue and
identify criteria for where future commercial uses may be appropriate.
Support the Port of Whitman County in retaining existing and attracting new water-
oriented commercial uses in appropriate locations along the shoreline.
Support the Cities’ efforts to provide for commercial development in their centers
along the rivers.
7.4.5 Forest Practices
This use is not found in Whitman County. Recommend prohibiting it.
7.4.6 Industry
Recognize current industrial uses and consider incentives to attract water-oriented
uses in appropriate locations along the shoreline.
Industrial uses along the Snake River are primarily located at the Port of Whitman
County’s on-water facilities. The County should support the Port’s efforts to retain
existing and attract new water-oriented industrial uses in appropriate locations
along the Snake River shoreline.
Recognize and allow existing and new industrial uses, such as grain silos, that serve
the County’s agriculture industry, provided they are developed and operated

The Watershed Company and BERK August 2014
157
consistent with the State’s Shoreline Master Program Guidelines and other County
and State requirements.
Ensure that operation of existing and development of new industrial facilities are
consistent with State Shoreline Master Program Guidelines and achieve no net loss
of shoreline functions.
7.4.7 In-stream Structural Uses
Large-scale in-stream structures intended to produce energy and/or moderate
flooding are found in Whitman County. There are also a number of irrigation
diversion and discharge structures in many waterbodies. Regulations need to
accommodate anticipated new diversion structures, and repair/maintenance and
possible expansion of existing projects.
7.4.8 Mining
A single mining operation is found in shoreline jurisdiction at the Port of Central
Ferry. Develop regulations that will allow maintaining or expanding this use, or
adding new mining uses, in industrial areas. Consider prohibiting all mining
waterward of the OHWM.
7.4.9 Recreational Development
Include provisions for existing and potential recreational uses, including boating,
swimming, and fishing.
Work with local, state and federal parks departments; Army Corps of Engineers; and
Port officials to ensure consistency between shoreline policies and regulations and
long-term parks management plans.
Policies and regulations related to parks management should provide clear
preferences for shoreline restoration consistent with public access needs and uses.
Park development and improvement in the Cities and Towns should recognize the
importance of shoreline resources and should plan for water-oriented uses in
shoreline jurisdiction. Development or improvement plans should balance the
provision of developed recreational areas in the shoreline with the need to protect
and/or enhance shoreline ecological functions.
7.4.10 Residential Development
Residential uses are extremely limited in the unincorporated County. Where
proposed, residential development should proceed in a manner consistent with the
control of pollution and prevention of damage to the shoreline environment.

Final Whitman County Coalition Shoreline Analysis Report
158
In the Cities and Town, recognize current and planned shoreline residential uses
with adequate provision of services and utilities as appropriate to allow for shoreline
ecological protection.
7.4.11 Transportation and Parking
Allow for maintenance and improvements to existing roads, railroads and parking
areas, and for necessary new roads and parking areas where other locations outside
of shoreline jurisdiction are not feasible.
Promote additional trail connections consistent with local and regional plans.
7.4.12 Utilities
Allow for new, expanded, and maintained utilities with criteria for location and
vegetation restoration as appropriate.
7.5 Restoration Plan
A Restoration Plan document will be prepared at a later phase of the Shoreline Master
Program update process, consistent with WAC 173-26-201(2)(f). The Shoreline
Restoration Plan will address the following six subjects (WAC 173-26-201(2)(f)(i-vi)) and
incorporate findings from this Shoreline Analysis Report:
(i) Identify degraded areas, impaired ecological functions, and sites with potential for
ecological restoration;
(ii) Establish overall goals and priorities for restoration of degraded areas and impaired
ecological functions;
(iii) Identify existing and ongoing projects and programs that are currently being implemented,
or are reasonably assured of being implemented (based on an evaluation of funding likely in
the foreseeable future), which are designed to contribute to local restoration goals;
(iv) Identify additional projects and programs needed to achieve local restoration goals, and
implementation strategies including identifying prospective funding sources for those
projects and programs;
(v) Identify timelines and benchmarks for implementing restoration projects and programs and
achieving local restoration goals; and

The Watershed Company and BERK August 2014
159
(vi) Provide for mechanisms or strategies to ensure that restoration projects and programs will
be implemented according to plans and to appropriately review the effectiveness of the
projects and programs in meeting the overall restoration goals.
The Restoration Plan will “include goals, policies and actions for restoration of impaired
shoreline ecological functions [where reasonable and practical]. These master program
provisions should be designed to achieve overall improvements in shoreline ecological
functions over time, when compared to the status upon adoption of the master
program.” The Restoration Plan will mesh opportunities identified in this report with
additional projects, regional or local efforts, and programs of each jurisdiction,
watershed groups, and environmental organizations that contribute or could potentially
contribute to improved ecological functions of the shoreline.

Final Whitman County Coalition Shoreline Analysis Report
160
8 REFERENCES
City of Colfax. 2007. Colfax, Washington Comprehensive Plan – The Future of Colfax. January
2007.
City of Palouse. 2014. City of Palouse Comprehensive Plan. 2014.
City of Pullman. 2014. Parks & Recreation 2014-2018 Five Year Plan.
City of Pullman. 1999. Comprehensive Plan for the City of Pullman.
Golder Associates Inc. and Dally Environmental. 2009. WRIA 34 – Palouse Watershed Detailed
Implementation Plan. Prepared for WRIA 34 Planning Unit.
Google. Electronic Reference. Google Earth. earth.google.com.
HDR and EES. 2007. Palouse Watershed Plan.
Higgins, J. L. 2003. Determination of upstream boundary points on southeastern Washington
streams and rivers under the requirement of the Shoreline Management Act of 1971. U.S.
Geological Survey Water-Resources Investigations Report 03-4042:18.
Kuttel, M. 2002. Salmonid Habitat Limiting Factors Water Resource Inventory Areas 33 (Lower)
and 35 (Middle) Snake Watersheds, and Lower Six Miles of the Palouse. Washington State
Conservation Commission.
Port of Whitman County. 2010. Comprehensive Plan 2010-2015. Colfax, WA.
Prager, M. “Palouse section of old rail line to get master plan for trail.” The Spokesman-Review.
28 Feb. 2014.
Snake River Salmon Recovery Board. 2011. Snake River Salmon Recovery Plan for Southeast
Washington.
Spokane County Conservation District (SCCD). 2005. The Hangman ( Latah ) Creek Water
Resources Management Plan.
U.S. Army Corps of Engineers. 2012. Lower Snake River Draft Programmatic Sediment
Management Plan Environmental Impact Statement -
http://www.nww.usace.army.mil/Portals/28/docs/programsandprojects/psmp/PSMPExecuti
veSummary.pdf
U.S. Army Corps of Engineers. 2014. Corps completes Colfax levee system periodic inspections.
Accessed May 2014 at: http://www.nww.usace.army.mil/Media/NewsReleases/tabid/2614/
Article/482349/corps-completes-colfax-levee-system-periodic-inspections.aspx

The Watershed Company and BERK August 2014
161
Washington Department of Fish and Wildlife. Electronic Reference. Salmonscape.
http://wdfw.wa.gov/mapping/salmonscape/index.html. Accessed April 24, 2014.
Washington Department of Fish and Wildlife. 2008. State of Washington Priority Habitats and
Species List.

Final Whitman County Coalition Shoreline Analysis Report
162
9 LIST OF ACRONYMS AND ABBREVIATIONS
cfs .................................. Cubic Feet per Second
Corps ............................ U.S. Army Corps of Engineers
Ecology ........................ Washington Department of Ecology
ESA ............................... Endangered Species Act
FEMA ........................... Federal Emergency Management Agency
GIS ................................ Geographic information systems
GMA............................. Growth Management Act
HPA .............................. Hydraulic Project Approval
LWD ............................. Large Woody Debris
NLC .............................. National Land Cover
NOAA .......................... National Oceanographic and Atmospheric Administration
NPDES ......................... National Pollutant Discharge Elimination System
NRCS............................ Natural Resources Conservation Service
NWI .............................. National Wetlands Inventory
OHWM ........................ Ordinary High Water Mark
PCB ............................... Polychlorinated biphenyl
PHS ............................... Priority Habitats and Species
RCW ............................. Revised Code of Washington
SMA ............................. Shoreline Management Act
SMP .............................. Shoreline Master Program
TMDL ........................... Total Maximum Daily Load
UGA ............................. Urban Growth Area
USDA ........................... U.S. Department of Agriculture
USFWS ......................... U.S. Fish and Wildlife Service
USGS ............................ U.S. Geological Service
WAC............................. Washington Administrative Code
WDFW ......................... Washington Department of Fish and Wildlife
WDNR ......................... Washington Department of Natural Resources
WRIA ........................... Water Resource Inventory Area

The Watershed Company and BERK August 2014
A P P E N D I X A
WHITMAN COUNTY ASSESSMENT OF SHORELINE JURISDICTION


20 March 2014
Jerry Basler Assistant Planner Whitman County Public Works, Planning Division 310 N. Main Street Colfax WA 99111
Re: Proposed Whitman County Shoreline Jurisdiction
Dear Jerry:
The Watershed Company has developed the attached proposed maps of shoreline jurisdiction, illustrating the minimum jurisdiction option and the additional full floodplain option. The wetland buffers option is not illustrated, but is described below. This information is provided to assist the County in selecting its preferred shoreline jurisdiction option.
EXISTING SHORELINE JURISDICTION PER CURRENT SMP
Under the County’s current Shoreline Master Program (SMP), the following waterbodies are shorelines of the state:
• Snake River • Palouse River (mainstem, north
and south forks) • Rock Creek • Pine Creek • Latah Creek (Hangman Creek) • Union Flat Creek • Across Highway Lake • Alkali Lake • Bonnie Lake
• Crooked Knee Lake • Folsom Lake • Lavista Lake • Rock Lake • Sheep Lake • Snyder Slough • Stevens Lake • Texas Lake • Tule Lake
Existing shoreline jurisdiction includes the shorelands extending 200 feet from the ordinary high water mark and identified associated wetlands, and includes the floodway and 200 feet of floodway-adjacent floodplain where present. The County’s adopted map also does not recognize the expansion of the cities since 1974, or depict the extent of the shorelands.
[email protected] ~ www.watershedco.com

Basler, J. 20 March 2014 Page 2 of 6
PROPOSED SHORELINE JURISDICTION
The first step in updating the map of shoreline jurisdiction is to collect data relevant to the jurisdiction assessment, namely:
1. Waterbodies: National Hydrography Dataset. An overlay of the data with the aerial generally revealed a close match with existing conditions.
2. Shoreline Management Act Suggested Points, Arcs and Polygons: Under contract to Ecology, the United States Geological Survey (USGS) has identified the upstream limits of shoreline streams and rivers based on projected mean annual flow of 20 cubic feet per second (cfs) (Higgins 2003). Ecology also provided a data set of lakes that are 20 acres or greater in size. Data representing lake shorelines was compared to 2013 aerial photos. Verification of the lake size was conducted using a GIS-based area calculator, which confirmed Ecology’s suggested list of lakes that meet the shoreline size threshold.
3. Floodways and Floodplains: FEMA Q3 digital data representing floodways and floodplains was collected through Ecology. Investigation of the Q3 data, published in 1980, showed registration issues between it and more recent geospatial data from reliable sources. As suggested in earlier personal communication with data stewards at FEMA regarding issues with the Q3 data, features in the FEMA Q3 dataset were manually realigned to better reflect the published Flood Insurance Rate Maps (FIRMs) and to agree with USDA 2013 NAIP aerial photos and data from other reliable sources. Realignment was conducted by visual assessment of the Q3 data against FIRMs accessed through FEMA’s online FIRMETTE application.
4. Wetlands: The U.S. Fish and Wildlife Service National Wetlands Inventory data set was used to identify wetlands that are potentially associated with the shoreline. For mapping purposes, all wetlands are shown as potentially being an element of shoreline jurisdiction if they are in or partially in the area 200 feet upland of the OHWM or are in or partially in the floodway or floodplain. Wetlands that extend up a non-shoreline stream outside the boundaries of the floodplain (such as in Steptoe Canyon) are excluded from shoreline jurisdiction mapping. Wetlands outside those parameters may also be shoreline-associated wetlands, but that assessment would need to be made at the site-specific scale at the time of a development application.
MINIMUM JURISDICTION

Basler, J. 20 March 2014 Page 3 of 6
The proposed illustration of the minimum shoreline jurisdiction is provided on the Minimum Shoreline Jurisdiction exhibit. The basic steps are to illustrate 200 feet upland of OHWM, add floodways and floodplains, and then clip jurisdiction to extend the greater of 200 feet from the OHWM or 200 feet of floodplain upland from the floodway (where present). Shoreline-associated wetlands remain a separate feature on the shoreline jurisdiction map because they have lower accuracy and are more subject to variation based on future site-specific delineation and analysis. The minimum upland shoreline jurisdiction area, including the potentially associated wetlands, is approximately 24,257 acres.
Rivers/Streams
Fourmile and Cottonwood Creeks Based on the USGS study, portions of Fourmile Creek (a tributary of the South Fork Palouse River) and Cottonwood Creek (a tributary of Rock Creek) have been added to shoreline jurisdiction. Anecdotal information provided by County staff and area property owners suggested that these streams may not meet the minimum flow required. Aerial photo review and the reported margin of error in the USGS study also supported a need for further analysis of these two systems.
On January 24, 2014, Patricia Olson (Ecology’s Senior Hydrogeologist) provided additional analysis in a memo (attached) that placed the upstream limit of shoreline jurisdiction substantially farther downstream than the original USGS point.
Latah Creek The Ecology-suggested shorelines data do not identify the segment of Latah Creek above its confluence with Rock Creek as a Shoreline of the State. However, because this segment of Latah Creek was previously identified by both the County and Ecology as a Shoreline of the State, stream flow data for Latah Creek were reviewed. USGS currently maintains a gaging station (12422990) at the State Line Road bridge, 2.6 miles southeast of Tekoa. The USGS Water-Data Report 2012 (U.S. Geological Survey 2013) was reviewed for mean annual flow at this station. For the period of record (2008-2012), the report states that mean annual flow at this station was 85.4 cfs. As this stream flow is well above the 20 cfs cutoff, we have included the entire length of Latah Creek in the County as a Shoreline of the State even though the period of record is less than 10 years.
Union Flat Creek Similar to the case of Latah Creek, the Ecology-suggested shorelines data do not identify Union Flat Creek as a Shoreline of the State; however, because this segment of Union Flat Creek was previously identified by both the County and Ecology as a Shoreline of the State, stream flow data for Union Flat Creek were reviewed. Although no known State or federal gaging stations are currently located along Union Flat Creek, a gaging

Basler, J. 20 March 2014 Page 4 of 6
station (13350500) was formerly maintained by USGS near Colfax from 1953 to 1971. For this period of record, mean annual flow at this gaging station was 37.1 cfs (Higgins 2003). As this stream flow is well above the 20 cfs cutoff, the segment of Union Flat Creek up to the former location of the gaging station near Colfax should clearly be included as a Shoreline of the State. The following parties were contacted in an effort to obtain data or local expert opinion, and limited information relevant to this shoreline jurisdiction determination surfaced:
• Washington Department of Transportation: Tammie Williams (Environmental Manager), Tom Baker (Bridge and Structures Engineer), and Jay Christianson (Hydraulics)
• Washington Department of Fish and Wildlife: Jason Kunz (Area Habitat Biologist) and Paul LaRiviere (Instream Flow Biologist)
• Washington Department of Ecology: Mitch Wallace
• Washington State Water Research Center
A 2007 WDFW memo related to a water right transfer noted that Union Flat Creek flows were “less than five cubic-feet per second mean annual flow.” It could not be determined from the memo where this flow characterization applied. Unfortunately, no other known data exist to provide a more precise indication of how much farther upstream the 20 cfs cutoff occurs.
Based on the USGS stream gage record and the lack of any other information, the proposed shoreline jurisdiction maps retain Union Flat Creek in shoreline jurisdiction consistent with the past 40 years of regulation by the County.
Lakes
According to Ecology’s shoreline data, there are 12 suggested “waterbodies (lakes, wetlands, etc)” present in the County that are 20 acres or greater. These lakes are identical to those listed in the County’s current SMP, with the possible exception of “Across Highway Lake.” That lake was not found in the data, nor could it be located in an online search. Ecology’s data include Duck Lake, which was not previously listed in the County’s SMP. It is possible that the lake has had two different names over time.
OTHER JURISDICTION OPTIONS
The information above describes assembly of the minimum shoreline jurisdiction. The County, Cities and Towns may further elect to expand jurisdiction to include 1) all or

Basler, J. 20 March 2014 Page 5 of 6
part of the 100-year floodplain, and/or 2) buffers of associated wetlands1 that would otherwise encompass areas outside of shoreline jurisdiction. Under either of these options, the area of shoreline jurisdiction increases and additional properties or areas of properties would be subject to the SMP and its additional layer of permitting requirements. These options should be considered by each jurisdiction.
Floodplain
The 100-year floodplain option is illustrated by a bright aqua boundary that encompasses the minimum shoreline jurisdiction and the remaining floodplain that is beyond the 200 feet of floodplain adjacent to floodways. The resulting optional jurisdiction is illustrated on the Minimum Shoreline Jurisdiction exhibit. This option increases the total area of jurisdiction by 6,607 acres (a 27% increase), most of which is found along Union Flat and Pine Creeks and the Palouse and Snake Rivers.
Use of this option would allow for maximum integration and consistency of the SMP with Whitman County Municipal Code Chapter 19.50: Flood Management Overlay District, and similar codes for each City and Town.
Wetland Buffers
The attached maps do not depict the expansion of shoreline jurisdiction to include wetland buffers. Classification of associated wetlands, which would ultimately determine the regulatory buffer, has not been conducted and would be done on a site-by-site basis at the time of a development application.
RCW 36.70A.480(6) says “If a local jurisdiction's master program does not include land necessary for buffers for critical areas that occur within shorelines of the state, as authorized by RCW 90.58.030(2)(f), then the local jurisdiction shall continue to regulate those critical areas and their required buffers pursuant to RCW 36.70A.060(2).” Ecology’s SMP Handbook chapter on Shoreline Jurisdiction explains the implications of this RCW as follows:
If the local government chooses not to extend its shoreline jurisdiction under RCW 90.58.030(2)(f)(ii), the CAO will protect the entire critical area and its buffers (see RCW 36.70A.480(6)). The CAO will continue to apply to the entire critical area and its buffers, even after SMP approval. However, the SMP will also apply
1 The RCW actually allows for expansion of jurisdiction to include critical area buffers, not just wetland buffers. However, this generally is limited to wetland buffers in practice. The nature of non-shoreline streams as a mostly perpendicular element to a shoreline waterbody already brings their full buffer into shoreline jurisdiction. Geologically hazardous areas are generally assigned a setback, not a buffer. Critical aquifer recharge areas (CARAs) are not addressed in the SMA or SMP Guidelines, and CARAs further are not assigned a setback or a buffer.

Basler, J. 20 March 2014 Page 6 of 6
to the portion(s) of the critical area and its buffers that lie within shoreline jurisdiction. This means the subject critical area and some or all of its buffers will have “dual coverage” with regulation by both the SMP and the CAO.
Please call if you have any questions.
Sincerely,
Amy Summe Environmental Planner
Enclosures

P. Olson, Jurisdiction Fourmile, Cottonwood Ck 1 1/24/2014
Memo To: Jeremy Sikes, Shoreline Planner, SEA ERO
Jaime Short, Shoreline Planner, SEA,ERO From: Patricia L Olson, Senior Hydrogeologist, SEA, HQ CC: Sara Hunt, ERO SEA Program Manager Brian Lynn, Coastal Zone and Shorelines Unit Manager, SEA, HQ Date: January 24, 2014 Re: Jurisdiction determination request for Four-mile and Cottonwood Creeks, Whitman
County
SMP JURISDICTION DETERMINATION: FOURMILE AND COTTONWOOD CREEKS, WHITMAN COUNTY
Jeremy Sikes requested assistance in determining if Fourmile and Cottonwood Creeks are in SMP jurisdiction. The most recent USGS study that estimates the upper SMP jurisdiction points (Higgins 2003) identifies Cottonwood Creek and Fourmile Creek as SMP streams. Other questions relate to Union Flat Creek and Latah/Hangman Creek and their status.
Summary
Union Flats and Latah/Hangman Creeks are SMP streams. Union Flats MAF is 37.1 cfs at the gaging station and an estimated 29.6 cfs at the SMP jurisdiction point. The MAF for Latah/Hangman Creek is 76.8 as measured at the USGS gage on Washington side of border between Washington and Idaho (Figure 1). Both are on the SMP_ARC GIS layer which has the streams listed in the SMA. They are not on the suggested SMP stream GIS layer which caused some confusion. During the Phase 1 of SMP updates, the SMP jurisdiction area has to be determined. The communities or their consultants need to be reminded to look at both GIS layers.
Three USGS regression equations developed to estimate mean annual flow (MAF) were initially used in this analysis to estimate MAF for Fourmile and Cottonwood Creek:
1) Determination of upstream boundary points on southeastern Washington streams and rivers under the Requirements of the Shoreline Management Act of 1971 (Higgins 2003)
2) NHDPlus v2, Enhanced Runoff Method (EROM) http://www.horizon-systems.com/nhdplus/NHDPlusV2_documentation.php
3) NHDPlus v2, Vogel http://www.horizon-systems.com/nhdplus/NHDPlusV2_documentation.php
The regression equations’ results were compared with long term continuous discharge data from USGS gages (Table 1). The estimates were not consistent. The Higgins (2003) regression equations MAF estimates were closer to MAF from USGS gage data than EROM or Vogel. The latter two regressions appear to overestimate MAF considerably (Table 1).
I used additional analyses because the MAF estimates from the 3 USGS regression methods were not similar enough to support decisions. The additional analyses are described in more detail under the Methods section.

P. Olson, Jurisdiction Fourmile, Cottonwood Ck 2 1/24/2014
Figure 1: This map shows the USGS gages and NOAA US Historical Climate Network precipitation gages used in the analysis. SMA_streams are the layer that has suggested jurisdiction points and SMA_Arcs are the streams listed in the SMA. Both need to be used to identify jurisdiction. The yellow circles show suggested SMP upstream jurisdiction points based on this analysis.
Three USGS regression equations developed to estimate mean annual flow (MAF) were initially used in this analysis to estimate MAF for Fourmile and Cottonwood Creek:
4) Determination of upstream boundary points on southeastern Washington streams and rivers under the Requirements of the Shoreline Management Act of 1971 (Higgins 2003)
5) NHDPlus v2, Enhanced Runoff Method (EROM) http://www.horizon-systems.com/nhdplus/NHDPlusV2_documentation.php
6) NHDPlus v2, Vogel http://www.horizon-systems.com/nhdplus/NHDPlusV2_documentation.php
The regression equations’ results were compared at gaged locations including gages with long term continuous discharge data (Table 1, Figure 1). The estimates were not consistent. The Higgins (2003) regression equations MAF estimates were closer to measured MAF than EROM or Vogel. The latter two regressions appear to overestimate MAF considerably (Table 1).
I used additional analyses because the MAF estimates from the 3 USGS regression methods were not similar enough to support decisions. The additional analyses are described in more detail under the Methods section.
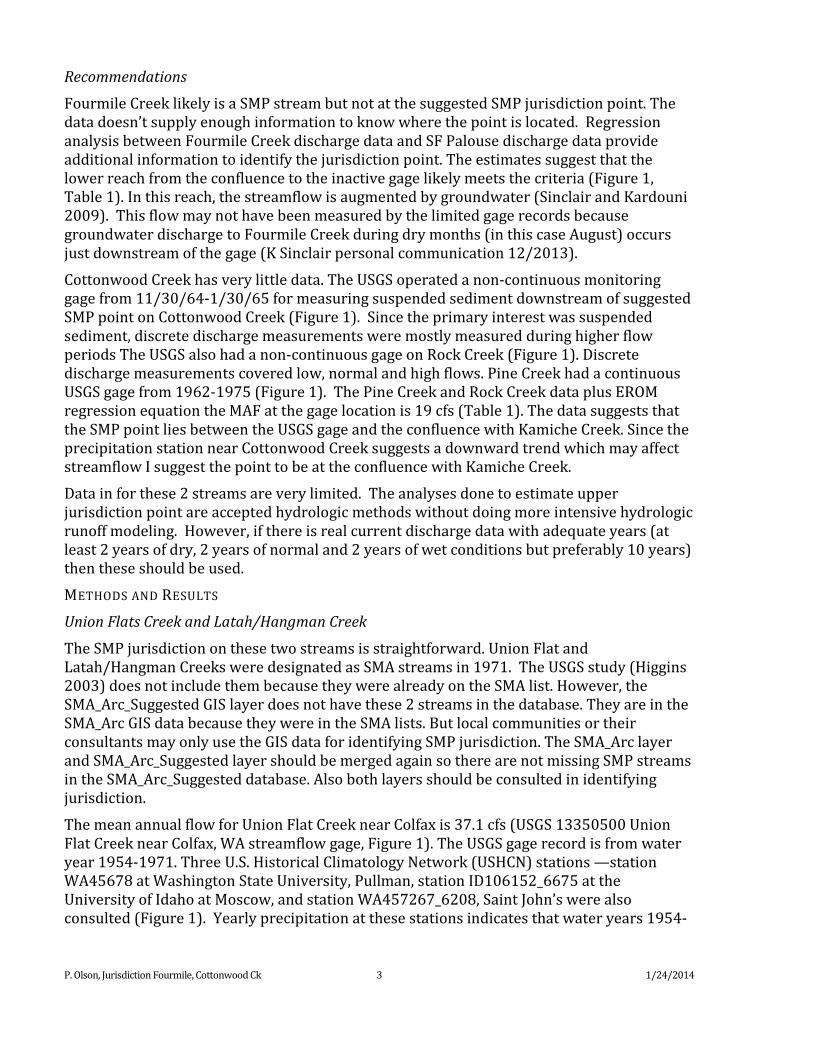
P. Olson, Jurisdiction Fourmile, Cottonwood Ck 3 1/24/2014
Recommendations
Fourmile Creek likely is a SMP stream but not at the suggested SMP jurisdiction point. The data doesn’t supply enough information to know where the point is located. Regression analysis between Fourmile Creek discharge data and SF Palouse discharge data provide additional information to identify the jurisdiction point. The estimates suggest that the lower reach from the confluence to the inactive gage likely meets the criteria (Figure 1, Table 1). In this reach, the streamflow is augmented by groundwater (Sinclair and Kardouni 2009). This flow may not have been measured by the limited gage records because groundwater discharge to Fourmile Creek during dry months (in this case August) occurs just downstream of the gage (K Sinclair personal communication 12/2013).
Cottonwood Creek has very little data. The USGS operated a non-continuous monitoring gage from 11/30/64-1/30/65 for measuring suspended sediment downstream of suggested SMP point on Cottonwood Creek (Figure 1). Since the primary interest was suspended sediment, discrete discharge measurements were mostly measured during higher flow periods The USGS also had a non-continuous gage on Rock Creek (Figure 1). Discrete discharge measurements covered low, normal and high flows. Pine Creek had a continuous USGS gage from 1962-1975 (Figure 1). The Pine Creek and Rock Creek data plus EROM regression equation the MAF at the gage location is 19 cfs (Table 1). The data suggests that the SMP point lies between the USGS gage and the confluence with Kamiche Creek. Since the precipitation station near Cottonwood Creek suggests a downward trend which may affect streamflow I suggest the point to be at the confluence with Kamiche Creek.
Data in for these 2 streams are very limited. The analyses done to estimate upper jurisdiction point are accepted hydrologic methods without doing more intensive hydrologic runoff modeling. However, if there is real current discharge data with adequate years (at least 2 years of dry, 2 years of normal and 2 years of wet conditions but preferably 10 years) then these should be used.
METHODS AND RESULTS
Union Flats Creek and Latah/Hangman Creek
The SMP jurisdiction on these two streams is straightforward. Union Flat and Latah/Hangman Creeks were designated as SMA streams in 1971. The USGS study (Higgins 2003) does not include them because they were already on the SMA list. However, the SMA_Arc_Suggested GIS layer does not have these 2 streams in the database. They are in the SMA_Arc GIS data because they were in the SMA lists. But local communities or their consultants may only use the GIS data for identifying SMP jurisdiction. The SMA_Arc layer and SMA_Arc_Suggested layer should be merged again so there are not missing SMP streams in the SMA_Arc_Suggested database. Also both layers should be consulted in identifying jurisdiction.
The mean annual flow for Union Flat Creek near Colfax is 37.1 cfs (USGS 13350500 Union Flat Creek near Colfax, WA streamflow gage, Figure 1). The USGS gage record is from water year 1954-1971. Three U.S. Historical Climatology Network (USHCN) stations —station WA45678 at Washington State University, Pullman, station ID106152_6675 at the University of Idaho at Moscow, and station WA457267_6208, Saint John’s were also consulted (Figure 1). Yearly precipitation at these stations indicates that water years 1954-

P. Olson, Jurisdiction Fourmile, Cottonwood Ck 4 1/24/2014
71 were greater than the average annual precipitation at Pullman but lower at Moscow and Saint John’s stations (Table 1).
Mean annual flow at Latah/Hangman Creek at the state line between Washington and Idaho is 76.8 (USGS 12422990 Hangman Creek at State Line Road near Tekoa, WA). The gage record is from 2007-2013. An upstream gage in Idaho (USGS 12422950 Hangman Creek near Tensed ID) has a mean annual flow of 85.6 cfs for 1982, 1989-90 (Figure 1).
Fourmile Creek
Fourmile Creek is a tributary to the South Fork Palouse River. The USGS study for identifying upper SMP jurisdiction (Higgins 2003) suggests that the SMP jurisdiction point is at river mile 7.1. A USGS gage (USGS 13349000 Fourmile Creek at Shawnee, WA) was located 0.5 miles upstream from the confluence (Figure 1). The gage operated from 4/1/1934-09/30/1940 with 6 concurrent water years (WY—Oct 01-Sept 30). Using only complete water years (WY 1935-40) the mean annual flow (MAF) was 14.9 cfs.
Fourmile Creek hydrologic characteristics, like other streams in this area, are spiky with the ratio of maximum daily flows to MAF >29. Greater than 82% of total flow occurs from January- April 15 (Figure 2). Fourmile Creek average discharge for January- April 15 is 49 cfs. This type of hydrologic regime can be misleading on identifying the location of 20scfs MAF point if only aerial photos (mostly taken during low flow periods) and or on ground observations made between mid April to early January are used. For example, the SF Palouse River at Pullman MAF is 39.1 cfs. However the mean flow for April and December 31 is 14 cfs (Figure 2).
Since Fourmile Creek has only a short gage record other information was used to evaluate the stream’s MAF in relation to longer records. Other data include additional USGS regression equations (EROM and Vogel), precipitation, and discharge data from nearby USGS continuous, long term gages. Information from studies related to surface and groundwater interactions in this area were considered. Groundwater discharge to Fourmile Creek has been observed below the inactive gage location. Studies for the SF Palouse TMDL show that the reach by Fourmile Creek just downstream of the gage location is a gaining reach during low flow conditions (Sinclair and Kardouni 2009; personal comm. with K. Sinclair 12/13/2013). The Airborne Thermal Infrared Remote Sensing study (Watershed Sciences 2006) shows that the SF Palouse stream temperature during late July 2005 decreases in the Fourmile confluence reach which is a signal for groundwater discharge.
Precipitation data from two USHCN weather stations—NOAA station ID WA45678_1878 at Washington State University, Pullman and NOAA Station ID106152_6675 at the University of Idaho, Moscow were used to determine if the gage record for Fourmile Creek occurred during a wet, normal or dry period (data from USHCN http://cdiac.ornl.gov/epubs/ndp/ushcn/state_WA.html ). The University of Idaho station is approximately 7 miles east of Pullman and is representative of Fourmile Creek’s headwater precipitation (Figure 1).
The precipitation data suggests that the Fourmile Creek discharge data were collected during a dry period (Table 1, Figure 3a, b). For example, the Pullman weather station precipitation data based on water year had an average annual precipitation of 17.4 inches for WY 1935-1940. The long term average annual precipitation is 20.6 inches. During WY

P. Olson, Jurisdiction Fourmile, Cottonwood Ck 5 1/24/2014
1935-1940, the deviation from mean annual precipitation ranged -4.7 to -1.1 inches (Figure 3a).
Because there was not a mix of dry, wet and normal years the Fourmile Creek discharge data is not representative of mean annual flow for SMP jurisdiction purposes. For SF Palouse River and Missouri Flat Creek gages the average discharge during water years 1935-1940 was lower than the long-term MAF by approximately 30% (Table 1). Precipitation records at Pullman don’t indicate any trend in precipitation (Figure 3a). However, precipitation records representative of Fourmile Creek headwaters indicate an upward trend in precipitation (Figure 3b, Table 1). An upward trend in precipitation may lead to increased runoff in Fourmile Creek headwaters. Table 1: Average annual precipitation from the NOAA USHCN gages and MAF at USGS gages are shown for different time periods to identify wet, normal (all years), and dry periods (Figure 1). Three different USGS regression equations were used to estimate MAF (cfs) at the USGS proposed SMP jurisdiction points and at USGS gage locations. The regression estimates are variable between methods but generally Higgins (2003) method is closer to MAF at gages. Cottonwood Creek is separated because it has a somewhat different hydrologic regime that is more like Pine Creek. The acronym na means data not available or not applicable.
Average Precipitation (in) by WY MAF (cfs)
WY Pullman,
WA Moscow,
Id St John’s,
WA SF
Palouse Missouri
Flats Fourmile Union Flat Cottonwood
1935-40 17.4 19.7 18.6 28 6 14.9 na na
1954-1971 22.2 23.1 19.4 36 1 7.4 1 na 37.1 na
1961-1981 20.1 25.4 19.4 43 9.2 na na na
2002-2012 19.9 27.24 18.4 39.6 na na na na
Total record 20.6 23.9 19.7 39.1 8.5 na 37.1 na
Three USGS developed regression estimates for MAF were used to calculate MAF at SMP jurisdiction points
Higgins 2003 26.9 na 20.0 29.6 26.6
EROM 47 na 27 74.5 17
Vogel 47 na 28 82.5 33
Regression equation estimates at USGS gage locations (Figure 1)
USGS gage discharge 39.1 8.5 14.9 37.1 na
Higgins 2003 40.6 5.9 20.5 32.7 26.8
EROM 67 12.2 33 78.2 17.3
Vogel 72 13.2 36 78.3 33.5
Regression with SF Palouse na na 22.6 na na
Cottonwood Creek: Median inches of runoff per square mile extrapolated from Pine and Rock Creek data converted to cfs
Suggested SMP point na na na na 18.2
USGS gage na na na na 18.9
Confluence with Kamiche Ck na na na na 23.4 1 SF Palouse and Missouri Flats record doesn’t include 1952-1960.
Since Fourmile Creek discharge data were collected during a drier precipitation period regression analyses were used to extend the Fourmile Creek data. Two USGS streamflow gaging stations in close proximity to Fourmile Creek were operating during the same period as Fourmile Creek (Figure 1). The 2 stations are USGS 13348000 South Fork Palouse River at Pullman, WA, 40 years of record (1934-02-01 -09/30/42, 01/01/1960-09/30/1981; 05/25/2001 to present); and USGS 13348500 Missouri Flat Creek at Pullman WA, 25 water

P. Olson, Jurisdiction Fourmile, Cottonwood Ck 6 1/24/2014
years of record (02/01/1934-09/30/42-10/03/1979)daily data and 1934-1980 annual data by water year (WY). The discharge data were normalized by converting cfs to inches of runoff per unit area. Normalization allows comparison between different sized watersheds and provides regression equation(s) that can be applied to any stream point based on drainage area above the point.
Even though the sample size (6 years) to compare Fourmile Creek discharge with the 2 other gages is small both gages have good linear relationships with Fourmile Creek (Figure 4). In order to check if the relationship holds for a larger data set, a linear regression analysis was done between the daily mean flow for Fourmile Creek and SF Palouse. There is a significant linear relationship with an adjusted r2=0.91, SEE=3.5 (cfs), p<0.001.
SF Palouse River regression relationship with Fourmile Creek was used to estimate mean annual discharge. SF Palouse data were used because the gage is still operating and the gage has a longer discharge record than Missouri Flat Ck. The results of regression analysis are similar for both gages (Figure 4). Runoff estimated by the regression equation between SF Palouse and Fourmile Creek was converted to mean annual discharge for points along Fourmile Creek using watershed area above the point. The mean annual discharge estimates suggest that the SMP upstream jurisdiction point is located at the USGS gage location (Table 1, Figure 1).
Figure 2: Mean of the average daily discharge at Fourmile Ck (USGS 13349000), Missouri Flats Ck (USGS 13348500) and SF Palouse R (USGS 13348000). The mean values are based on flow from 1935-1940. The hydrographs show that the hydrologic regimes and response to precipitation are similar. Station locations are shown on Figure 1. .
0
50
100
150
200
250
300
350
400
1-O
ct11
-Oct
21-O
ct31
-Oct
10-N
ov20
-Nov
30-N
ov10
-Dec
20-D
ec30
-Dec
9-Ja
n19
-Jan
29-Ja
n8-
Feb
18-F
eb28
-Feb
9-M
ar19
-Mar
29-M
ar8-
Apr
18-A
pr28
-Apr
8-M
ay18
-May
28-M
ay7-
Jun
17-Ju
n27
-Jun
7-Ju
l17
-Jul
27-Ju
l6-
Aug
16-A
ug26
-Aug
5-Se
p15
-Sep
25-S
ep
Mea
n of
ave
rage
dai
ly d
ischa
rge
(cfs
)
Mean of Average Daily Flow: 1935-1940
Fourmile
Missouri Flats
SF Palouse

Figure 3: Graphs show annual precipitation departure from the long-term mean annual precipitation for three NOA USHCN climate stations located near Fourmile Creek, 3a and 3b, and Cottonwood Creek 3c. The black lines are 2 period moving average which smoothes some of the variability making dry and wet periods more visible. The top axis (blue bars) is average annual discharge as inches of runoff per unit area. The precipitation departure bars are red except those that coincide with Fourmile Creek discharge record (1935-40). Those are blue. The Pullman Experimental station (3a) and U of Idaho, Moscow station (3b) graphs show that precipitation was less than normal for the Fourmile Creek discharge record. The Pullman precipitation records don’t show any downward or upward trend in precipitation. However, the U of Idaho, Moscow Station (3b) indicates an increase in precipitation (upward trend). This station is representative of precipitation in the headwaters of Fourmile Creek. Increasing precipitation may cause an increase in streamflow. The Saint John’s station (3c) precipitation is representative of precipitation patterns in lower Cottonwood Creek watershed (Figure 1). There appears to be a slight downward trend in precipitation at this station.
0
2
4
6
8
10
12
14
-10
-5
0
5
10
15'1
893-
94'
'189
6-97
''1
899-
00'
'190
2-03
''1
905-
06'
'190
8-09
''1
911-
12'
'191
4-15
''1
917-
18'
'192
0-21
''1
923-
24'
'192
6-27
''1
929-
30'
'193
2-33
''1
935-
36'
'193
8-39
''1
941-
42'
'194
4-45
''1
947-
48'
'195
0-51
''1
953-
54'
'195
6-57
''1
959-
60'
'196
2-63
''1
965-
66'
'196
8-69
''1
971-
72'
'197
4-75
''1
977-
78'
'198
0-81
''1
983-
84'
'198
6-87
''1
989-
90'
'199
2-93
''1
995-
96'
'199
8-99
''2
001-
02'
'200
4-05
''2
007-
08'
'201
0-11
'
Four
mile
Cre
ek d
ischa
rge
gage
, run
off (
in o
f wat
er)
Prec
ipita
tion
depa
rtur
e (in
ches
)
Pullman Experimental NOAA USHCN station WA456789_1878 : precipitation departure from average precipitation by Water Year
departure from precipitation by WY, inches
Fourmile Creek runoff (inches)
2 per. Mov. Avg. (departure from precipitation by WY, inches)
0
2
4
6
8
10
12
14
-15
-10
-5
0
5
10
15
20
'189
3-94
''1
896-
97'
'189
9-00
''1
902-
03'
'190
5-06
''1
908-
09'
'191
1-12
''1
914-
15'
'191
7-18
''1
920-
21'
'192
3-24
''1
926-
27'
'192
9-30
''1
932-
33'
'193
5-36
''1
938-
39'
'194
1-42
''1
944-
45'
'194
7-48
''1
950-
51'
'195
3-54
''1
956-
57'
'195
9-60
''1
962-
63'
'196
5-66
''1
968-
69'
'197
1-72
''1
974-
75'
'197
7-78
''1
980-
81'
'198
3-84
''1
986-
87'
'198
9-90
''1
992-
93'
'199
5-96
''1
998-
99'
'200
1 -02
''2
004-
05'
'200
7-08
''2
010-
11'
Four
mile
Cre
ek d
ischa
rge
gage
, run
off (
in o
f wat
er)
Prec
ipita
tion
depa
rtur
e (in
ches
)
U of Idaho Moscow NOAA USHCN climate station ID106152_6675 : precipitation departure from average precipitation by Water Year
departure from precipitation by WY, inches
Fourmile Creek runoff (inches)
2 per. Mov. Avg. (departure from precipitation by WY, inches)
0
2
4
6
8
10
12
14
-20
-15
-10
-5
0
5
10
15
20
'189
2-93
''1
895-
96'
'189
8-99
''1
901-
02'
'190
4-05
''1
907-
08'
'191
0-11
''1
913-
14'
'191
6-17
''1
919-
20'
'192
2-23
''1
925-
26'
'192
8-29
''1
931-
32'
'193
4-35
''1
937-
38'
'194
0-41
''1
943-
44'
'194
6-47
''1
949-
50'
'195
2-53
''1
955-
56'
'195
8-59
''1
961-
62'
'196
4-65
''1
967-
68'
'197
0-71
''1
973-
74'
'197
6-77
''1
979-
80'
'198
2-83
''1
985-
86'
'198
8-89
''1
991-
92'
'199
4-95
''1
997-
98'
'200
0-01
''2
003-
04'
'200
6-07
''2
009-
10'
Four
mile
Cre
ek d
ischa
rge
gage
, run
off (
in o
f wat
er)
Prec
ipita
tion
depa
rtur
e (in
ches
)
Saint Johns NOAA USHCN station WA457267_6208: precipitation departure from average precipitation by Water Year
departure from precipitation by WY, inches
Fourmile Creek runoff (inches)
2 per. Mov. Avg. (departure from precipitation by WY, inches)
3a 3b
3c
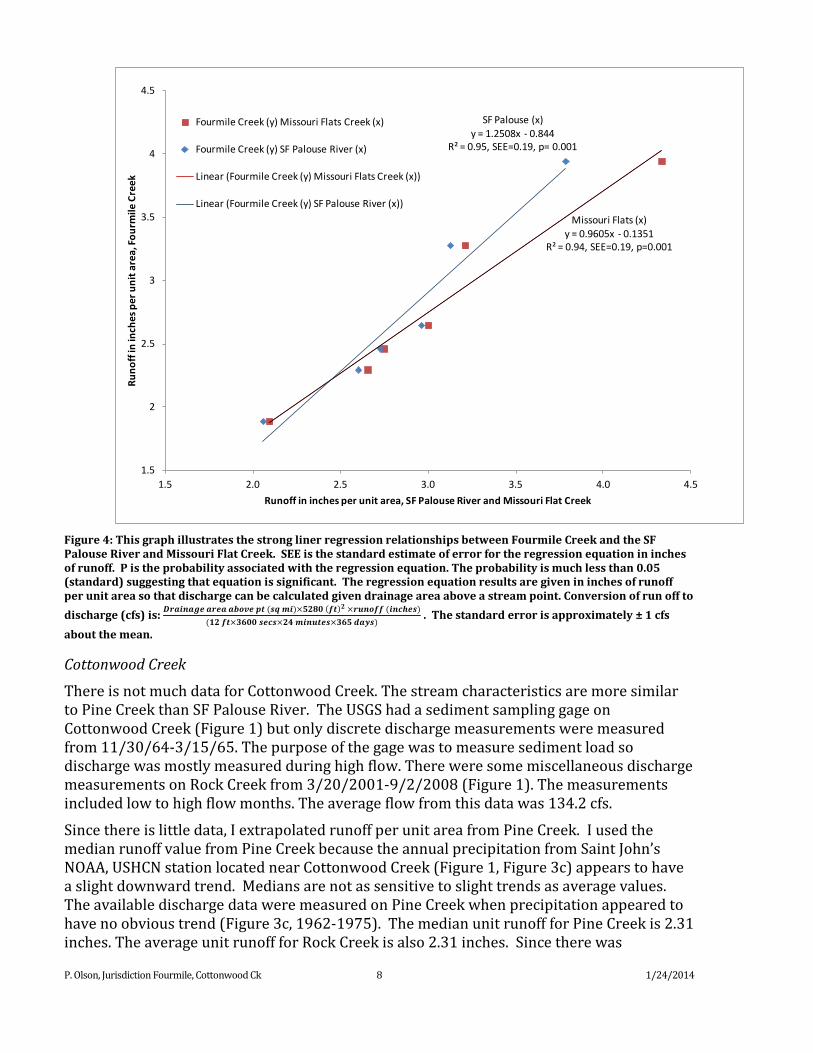
P. Olson, Jurisdiction Fourmile, Cottonwood Ck 8 1/24/2014
Figure 4: This graph illustrates the strong liner regression relationships between Fourmile Creek and the SF Palouse River and Missouri Flat Creek. SEE is the standard estimate of error for the regression equation in inches of runoff. P is the probability associated with the regression equation. The probability is much less than 0.05 (standard) suggesting that equation is significant. The regression equation results are given in inches of runoff per unit area so that discharge can be calculated given drainage area above a stream point. Conversion of run off to discharge (cfs) is: 𝑫𝒓𝒂𝒊𝒏𝒂𝒈𝒆 𝒂𝒓𝒆𝒂 𝒂𝒃𝒐𝒗𝒆 𝒑𝒕 (𝒔𝒒 𝒎𝒊)×𝟓𝟐𝟖𝟎 (𝒇𝒕)𝟐 ×𝒓𝒖𝒏𝒐𝒇𝒇 (𝒊𝒏𝒄𝒉𝒆𝒔)
(𝟏𝟐 𝒇𝒕×𝟑𝟔𝟎𝟎 𝒔𝒆𝒄𝒔×𝟐𝟒 𝒎𝒊𝒏𝒖𝒕𝒆𝒔×𝟑𝟔𝟓 𝒅𝒂𝒚𝒔) . The standard error is approximately ± 1 cfs
about the mean.
Cottonwood Creek
There is not much data for Cottonwood Creek. The stream characteristics are more similar to Pine Creek than SF Palouse River. The USGS had a sediment sampling gage on Cottonwood Creek (Figure 1) but only discrete discharge measurements were measured from 11/30/64-3/15/65. The purpose of the gage was to measure sediment load so discharge was mostly measured during high flow. There were some miscellaneous discharge measurements on Rock Creek from 3/20/2001-9/2/2008 (Figure 1). The measurements included low to high flow months. The average flow from this data was 134.2 cfs.
Since there is little data, I extrapolated runoff per unit area from Pine Creek. I used the median runoff value from Pine Creek because the annual precipitation from Saint John’s NOAA, USHCN station located near Cottonwood Creek (Figure 1, Figure 3c) appears to have a slight downward trend. Medians are not as sensitive to slight trends as average values. The available discharge data were measured on Pine Creek when precipitation appeared to have no obvious trend (Figure 3c, 1962-1975). The median unit runoff for Pine Creek is 2.31 inches. The average unit runoff for Rock Creek is also 2.31 inches. Since there was
Missouri Flats (x)y = 0.9605x - 0.1351
R² = 0.94, SEE=0.19, p=0.001
SF Palouse (x)y = 1.2508x - 0.844
R² = 0.95, SEE=0.19, p= 0.001
1.5
2
2.5
3
3.5
4
4.5
1.5 2.0 2.5 3.0 3.5 4.0 4.5
Runo
ff in
inch
es p
er u
nit a
rea,
Four
mile
Cre
ek
Runoff in inches per unit area, SF Palouse River and Missouri Flat Creek
Fourmile Creek (y) Missouri Flats Creek (x)
Fourmile Creek (y) SF Palouse River (x)
Linear (Fourmile Creek (y) Missouri Flats Creek (x))
Linear (Fourmile Creek (y) SF Palouse River (x))

P. Olson, Jurisdiction Fourmile, Cottonwood Ck 9 1/24/2014
agreement this runoff value was used to estimate a SMP point on Cottonwood Creek (Table 1). The analyses indicate that the 20 cfs point is close to Cottonwood and Kamiche Creek confluence.
REFERENCES
Higgins, J.L., 2003, Determination of upstream boundary points on southeastern Washington streams under the requirements of the Shoreline Management Act of 1971, USGS Water-Resources Investigations Report 03-4042, Tacoma, WA.
Sinclair, K. and J. Kardouni, 2009, Surface-water/groundwater interactions and near-stream groundwater quality along the Palouse River, South Fork Palouse River, and Paradise Creek, Ecology Publication Number 09-03-007 https://fortress.wa.gov/ecy/publications/SummaryPages/0903007.html .
Watershed Sciences, 2006, Airborne Thermal Infrared Remote Sensing Palouse River Basin, WA/ID, Submitted to: Washington Department of Ecology Environmental Assessment Program and City of Moscow, Water Department, Moscow, ID.


The Watershed Company and BERK August 2014
A P P E N D I X B
SHORELINE INVENTORY MAP FOLIO (ONLINE AT WWW.WHITMANCOUNTYSMPUPDATE.COM OR ON DVD)


The Watershed Company and BERK August 2014
A P P E N D I X C
SHORELINE INVENTORY DATA SOURCES


Table C-1. Shoreline Inventory Elements and Information Sources.
Inventory Element
Information Gathered Data Source(s) Assumptions/Limitations
Physical Setting
Surficial Geology (Map 12)
Geologic classifications
WA Department of Natural Resources, Division of Geology and Earth Resources, Surface Geology
Based on broad-scale geologic classifications Useful for broad-scale assessment of geologic conditions Not to be used in place of site-specific studies
Soils (Map 13) Soil types USDA NRCS (SSURGO)
Based on broad-scale soil mapping Useful for broad-scale assessment of soil conditions Not to be used in place of site-specific studies
Land Use/Development
Land Use Patterns
Current land use (Map 2) Washington Department of Ecology
Gross-scale characterization (e.g., residential, agriculture) Useful in assessing existing intensity and type of
development at broad-scale planning level Spot-checks of mapped use with the aerial photos showed
a high level of accuracy Data may not be up-to-date
Future land use (Map 3) County/City/Town zoning
Useful to anticipate future land use changes at broad-scale planning level
Some of the original map files provided were PDFs or CAD – converted by TWC to GIS format
Data/map was not made available for Rosalia and Malden
Water-oriented uses (Map 5)
County assessor Port of Whitman County Aerial photos County/City/Town and public input
Map was generated by compiling known Port-owned properties and public access features, as well as shoreline modifications such as dams
Mapping will be further refined as part of analysis
Ownership (Map 4)
Land ownership for parcels within shoreline jurisdiction
Washington Department of Natural Resources
Port of Whitman County
Land ownership data from DNR is available for publicly managed lands only.
Limited additional data was available for other areas - data gap.
Highways Railroads
WA Department of Transportation

Inventory Element
Information Gathered Data Source(s) Assumptions/Limitations
Transportation (all maps) Other Roads County
Stormwater/ Sewer facilities NA NA Data not available - data gap
Water Supply NA NA Data not available - data gap
Impervious Surfaces (Map 7)
High-, medium-, and low-intensity land cover areas from USGS land cover map
US Geological Survey National Land Cover Data (NLCD)
Useful for broad-scale assessment of impervious surfaces only.
Data aggregated to a 30-meter grid
Land Cover (Vegetation) (Map 8)
Land cover Vegetation type
US Geological Survey National Land Cover Data (NLCD)
Data aggregated to a 30-meter grid Useful for broad-scale assessment of vegetation coverage
only Not useful for accurate characterization of fine-scale data
(e.g., parcel level, species composition)
Shoreline Modifications (Map 18)
Levees WA Department of Ecology Modifications were made to the levee locations based on aerial photos (USDA NAIP, 2013).
Overwater structures WA Department of Natural Resources
Overwater structures includes piers, bridges, dams Data may not be up-to-date Not useful for accurate characterization of fine scale data
(e.g., parcel level)

Inventory Element
Information Gathered Data Source(s) Assumptions/Limitations
Public Access Areas (Map 6)
Parks Open space Trails Launches Campgrounds Off-highway vehicle
areas
Recreation and Conservation Office (RCO)
County/City/Town maps and plans (including zoning, Whitman County Parks and Recreation Comprehensive Plan 2004-2009)
Washington State Parks www.traillink.com (digitized by
TWC) Department of Natural Resources Washington/Oregon Bureau of
Land Management
Mapping will be further refined as part of analysis.
Historical/ Archeological/ Cultural Sites (Map 22)
Historical sites Archeologically
significant sites
WA Department of Archaeology and Historic Preservation
Data represent only known sites; additional, presently unknown sites may exist
Critical Areas/Other Ecological Conditions
Geologically hazardous areas (Map 14)
Geohazards Washington Department of
Natural Resources, Geology and Earth Sciences Division
US Geologic Survey
Useful for broad scale assessment of geologically hazardous areas
Requires site-specific review to verify presence/absence of geohazards
Channel migration zone (CMZ) (Map 21)
Channel Migration Zone data was not available for shorelines within Whitman County. Instead, the 100-year floodplain is being used as a proxy for the CMZ extent, with modifications made by TWC per WAC 173-26-221(3)(b).
Frequently flooded areas (Map 9)
Floodplains Floodways
Federal Emergency Management Agency (FEMA) Q3, 1 May 1980
Floodplain and floodways based on federally established models
Features in the FEMA Q3 (1981) dataset were manually realigned to better reflect the published Flood Insurance Rate Maps (FIRMs) and to agree with other data

Inventory Element
Information Gathered Data Source(s) Assumptions/Limitations
May be used at site scale, although further refinement at site scale may also be desired
Wetlands (Map 10) Potential wetlands
Hydric soils
US Fish and Wildlife Service National Wetland Inventory (NWI)
USDA NRCS (SSURGO)
Useful for broad scale assessment of potential wetlands Original NWI mapping based on interpretation of multi-
spectral imagery and ground truthing Many wetlands are not identified by NWI; mapped wetlands
may not meet wetland criteria Not to be used in place of site-specific studies
Surface Water System (Map 11)
Streams, lakes Seeps, waterfalls,
and other hydrologic features
Gages and other monitoring points
USGS National Hydrography Dataset
Data may not reflect changes to surface water flow due to modifications of topography surface or other factors.
Data is prepared at large map scale. Features may not be accurately depicted at smaller scales.
WDFW Priority Habitats & Species (Maps 15-17)
Priority fish Priority wildlife Priority habitats
WA Department of Fish and Wildlife
WDFW maps do not capture every priority species location or habitat, particularly for rare species or species that use shoreline habitats seasonally or intermittently
Absence of mapping information does not indicate absence of a particular species
The number of documented species may reflect the relative amount of past survey efforts
New data will need to be obtained at the time of project application
Other wildlife and habitat areas
Bird habitat conservation areas
Ecologically important areas
US Bureau of Land Management Data is prepared at statewide map scale. Features may not
be accurately depicted at smaller scales. Data may not be up-to-date
Aquifer Recharge Areas NA NA Data not available - data gap

Inventory Element
Information Gathered Data Source(s) Assumptions/Limitations
Water quality impairment (Map 19)
303(d) waters and regulated sites WA Department of Ecology
Water quality impairments are based on monitoring at specific locations
Impairments may extend beyond the mapped area
Environmental Cleanup Sites (Map 20)
Cleanup sites Leaking
underground storage tanks
WA Department of Ecology Data is prepared at statewide map scale. Features may not be accurately depicted at smaller scales.
Restoration opportunities (Future map in Analysis Report and Restoration Plan)
Site-specific and general projects
Watershed Plans Subbasin Plans Tribes Whitman Conservation District Palouse Conservation District Pine Creek Conservation District Palouse-Rock Lake Conservation
District Palouse-Clearwater
Environmental Institute County/City/Town and public input


The Watershed Company and BERK August 2014
A P P E N D I X D
SUMMARY OF SHORELINE INVENTORY BY REACH


Appendix D. Summary of Shoreline Inventory by Reach.1
Reach Unit Area (Acres)
Shoreline Length (Feet)
Dominant Land Use Patterns (% of reach, only categories ≥1% reported)
Ownership (% of reach)
Land Cover (% of reach, only categories ≥1% reported)
Shoreline Modification (# of overwater structures [OWS]/% levees)
Floodplain and Floodway Area (% of reach)
Critical Areas (% of reach or type of occurrence, # of occurrences) & Water Quality (Cat. 4 and 5 listings reported)
Alkali Lake 39.6 5,570
Zoning: Agricultural-100 Federal-100
(Bureau of Reclamation)
Emergent Herbaceous Wetlands- 23.9 Open Water- 2.9
Shrub/Scrub- 71.2 Woody Wetlands- 1.4
0 OWS, 0% levees none
Wetlands: 41.0%
Priority Habitats and Species: Regions- Bald Eagle, 100% Mule Deer, 100%
Water Quality Listings: none
Current Land Use: Agriculture- 100 (not classified under
current use law)
Crooked Knee Lake
98.4 13,800
Zoning: Agricultural-100
State- 85.9 (Department of
Natural Resources- 80.5
Parks and Recreation
Commission-5.4)
Developed, Open Space-2.6 Emergent Herbaceous Wetlands- 46.9
Evergreen Forest- 6.5 Open Water- 15.4 Shrub/Scrub- 23.7
Woody Wetlands- 4.8
0 OWS, 0% levees Floodplain- 24.6
Wetlands: 58.3% Priority Habitats and Species: Regions- Prairies and Steppe, 39.5% Waterfowl Concentrations, 60.5% Water Quality Listings: none
Current Land Use: Agriculture- 100 (not classified under
current use law)
Duck Lake 34.1 5,568
Zoning: Agricultural-100
No data
Developed, Open Space- 8.2 Emergent Herbaceous Wetlands-36.9
Evergreen Forest- 10.6 Open Water- 4.9
Shrub/Scrub- 39.4
0 OWS, 0% levees Floodplain-2.4
Wetlands: 34.8% Priority Habitats and Species: Regions- Mule Deer, 100% Prairies and Steppe, 100% Water Quality Listings: none
Current Land Use: Agriculture- 100 (not classified under
current use law)
Folsom Lake 130.6 21,284
Zoning: Agricultural-100 State-100 (State
Parks and Recreation
Commission)
Cultivated Crops-14.3 Emergent Herbaceous Wetlands-38.2
Open Water- 3.4 Shrub/Scrub- 44.1
0 OWS, 0% levees Floodplain- 12.2
Wetlands: 53.3% Priority Habitats and Species: Regions- Prairies and Steppe, 89.7% Waterfowl Concentrations, 10.3% Water Quality Listings: none
Current Land Use: Agriculture- 100 (not classified under
current use law)
Lavista Lake 48.8 4,163
Zoning: Agricultural-100
No data
Emergent Herbaceous Wetlands-22.7 Evergreen Forest- 46.3
Shrub/Scrub- 28.2 Woody Wetlands- 2.0
0 OWS, 0% levees Floodplain- 63.1%
Wetlands: 74.1% Priority Habitats and Species: Regions- Bald Eagle, 99.5% Mule Deer, 100% Water Quality Listings: none
Current Land Use: Agriculture- 100 (not classified under
current use law)
1 Data sources, assumptions, and limitations summarized in Appendix C.

Reach Unit Area (Acres)
Shoreline Length (Feet)
Dominant Land Use Patterns (% of reach, only categories ≥1% reported)
Ownership (% of reach)
Land Cover (% of reach, only categories ≥1% reported)
Shoreline Modification (# of overwater structures [OWS]/% levees)
Floodplain and Floodway Area (% of reach)
Critical Areas (% of reach or type of occurrence, # of occurrences) & Water Quality (Cat. 4 and 5 listings reported)
Rock Lake 466.9 100,330
Zoning: Agricultural-100
Federal- 39.4 (Bureau of
Reclamation)
Emergent Herbaceous Wetlands- 4.8 Evergreen Forest- 22.4
Herbaceous- 3.5 Open Water-10.9 Shrub/Scrub- 50.1
Woody Wetlands- 1.3
3 OWS, 0% levees Floodplain- 12.5%
Wetlands: 13.5% Priority Habitats and Species: Regions- Bald Eagle, 95.5% Cliffs/Bluffs, 30.6% Mule Deer, 100% Rocky Mountain Elk, 0.9% Waterfowl Concentrations, 13.0% Occurrences- Bald eagle, nest (1) Prairie falcon, nest (4) Water Quality Listings: Category 5, Dieldrin
Current Land Use: Agriculture- 88.95 not classified under current use law, 5.26 classified under
current use chapter 84.34 RCW Open space land classified under
chapter 84.34 RCW- 5.80
Snyder Slough 139 18,309
Zoning: Agricultural-100
No data
Emergent Herbaceous Wetlands, 22.9 Evergreen Forest, 2.1
Open Water, 12.1 Shrub/Scrub, 56.7
Woody Wetlands, 6.3
0 OWS, 0% levees Floodplain- 18.1%
Wetlands: 69.4% Priority Habitats and Species: Regions- Prairies and Steppe, 100% Water Quality Listings: none
Current Land Use: Agriculture- 100 (not classified under
current use law)
Stevens Lake 123.8 8,578
Zoning: Agricultural-100
No data
Emergent Herbaceous Wetlands, 28.8
Evergreen Forest, 17.8 Herbaceous, 33.3 Shrub/Scrub, 19.2
0 OWS, 0% levees Floodplain- 11.0%
Wetlands: 73.3% Priority Habitats and Species: Regions- Mule Deer, 100% Prairies and Steppe, 98.5% Occurrences- Prairie falcon, nest (1) Water Quality Listings: none
Current Land Use: Agriculture- 100 (not classified under
current use law)
Texas Lake 194.5 6,465
Zoning: Agricultural-100
No data
Cultivated Crops, 16.0 Developed, Open Space, 11.8
Emergent Herbaceous Wetlands, 42.0 Evergreen Forest, 5.8
Herbaceous, 1.7 Shrub/Scrub, 22.6
0 OWS, 0% levees Floodplain- 13.9%
Wetlands: 24.6% Priority Habitats and Species: Regions- Mule Deer, 100% Waterfowl Concentrations, 24.3% Water Quality Listings: none
Current Land Use: Agriculture- 100 (not classified under
current use law)

Reach Unit Area (Acres)
Shoreline Length (Feet)
Dominant Land Use Patterns (% of reach, only categories ≥1% reported)
Ownership (% of reach)
Land Cover (% of reach, only categories ≥1% reported)
Shoreline Modification (# of overwater structures [OWS]/% levees)
Floodplain and Floodway Area (% of reach)
Critical Areas (% of reach or type of occurrence, # of occurrences) & Water Quality (Cat. 4 and 5 listings reported)
Tule Lake 32.2 6,465
Zoning: Agricultural-100 Federal-26.5
(Bureau of Reclamation)
State-73.5 (Department of
Natural Resources)
Emergent Herbaceous Wetlands, 36.6 Shrub/Scrub, 33.4
Woody Wetlands, 30.0 0 OWS, 0% levees Floodplain- 23.4%
Wetlands: 55.4% Priority Habitats and Species: Regions- Bald Eagle, 100% Mule Deer, 100% Water Quality Listings: none
Current Land Use: Agriculture- 26.5 not classified under current use law, 73.5 classified under
current use chapter 84.34 RCW
Bonnie Lake 104.8 13,934
Zoning: Agricultural-100
No data
Cultivated Crops, 4.8 Deciduous Forest, 1.3 Evergreen Forest, 32.7
Herbaceous, 46.2 Open Water, 1.2
Shrub/Scrub, 13.5
0 OWS, 0% levees Floodplain- 44.1%
Wetlands: 55.1% Priority Habitats and Species: Regions- Bald Eagle, 46.8% Cliffs/Bluffs, 17.0% Rocky Mountain Elk, 100% Wetlands 46.8% Water Quality Listings: none
Current Land Use: Agriculture- 100 (not classified under
current use law)
Sheep Lake 76.6 9,214
Zoning: Agricultural-100
No data
Developed, Open Space, 1.3 Emergent Herbaceous Wetlands, 10.5
Open Water, 10.5 Shrub/Scrub, 77.7
0 OWS, 0% levees Floodplain- 6.6%
Wetlands: 78.6% Priority Habitats and Species: Regions- American White Pelican, 2.9% Prairies and Steppe, 97.1% Waterfowl Concentrations, 2.9% Water Quality Listings: none
Current Land Use: Agriculture- 100 (not classified under
current use law)
Hangman Creek-
Agriculture 371.5 39,934
Zoning: Agricultural- 99.7
State-1.9 (Department of
Natural Resources)
Cultivated Crops, 73.1 Developed, Open Space, 10.0
Emergent, Herbaceous Wetlands, 5.7 Evergreen Forest, 10.1
0 OWS, 0% levees Floodway- 4.2%
Floodplain- 75.4%
Wetlands: 2.1% Priority Habitats and Species: none Water Quality Listings: Category 5, dissolved oxygen Category 4a, bacteria and temperature
Current Land Use: Agriculture classified under current use
chapter 84.34 RCW - 99.4
Pine Creek-Wastewater
Lagoons 14.4 1,271 Zoning:
Agricultural-100 No data
Cultivated Crops, 56.4 Developed, Low Intensity, 13.0 Developed, Open Space, 1.6
Evergreen Forest, 29.0
0 OWS, 0% levees Floodway-36.8%
Floodplain- 79.6
Wetlands: 20.4% Priority Habitats and Species: none

Reach Unit Area (Acres)
Shoreline Length (Feet)
Dominant Land Use Patterns (% of reach, only categories ≥1% reported)
Ownership (% of reach)
Land Cover (% of reach, only categories ≥1% reported)
Shoreline Modification (# of overwater structures [OWS]/% levees)
Floodplain and Floodway Area (% of reach)
Critical Areas (% of reach or type of occurrence, # of occurrences) & Water Quality (Cat. 4 and 5 listings reported)
Current Land Use: Agriculture classified under current use
chapter 84.34 RCW – 100
Water Quality Listings: Category 5, bacteria and dissolved oxygen
Pine Creek-Agriculture
1,320.9 140,975
Zoning: Agricultural-100 State-4.3
(Department of Natural Resources-
1.8, Parks and Recreation
Commission, 2.6)
Cultivated Crops, 78.0 Developed, Open Space, 8.7
Emergent Herbaceous Wetlands, 4.1 Evergreen Forest, 4.6
Hay/Pasture, 1.5 Shrub/Scrub, 1.5
0 OWS, 0% levees Floodway- 2.4%
Floodplain- 78.9%
Wetlands: 7.2% Priority Habitats and Species: Regions- Mule Deer, 5.3% Water Quality Listings: Category 5, bacteria and dissolved oxygen
Current Land Use: Agriculture- 18.41 not classified under current use law, 81.56 classified under
current use chapter 84.34 RCW
Pine Creek-Scrub/Shrub
369.5 39,429
Zoning: Agricultural-100
No data
Cultivated Crops, 48.6 Developed, Open Space, 4.8
Evergreen Forest, 41.4 Herbaceous, 4.7
0 OWS, 0% levees Floodplain- 41.3%
Wetlands: 7.0% Priority Habitats and Species: Regions- Mule Deer, 62.3% Cliffs/Bluffs, 1.6% Rocky Mountain Elk, 28.6% Water Quality Listings: none
Current Land Use: Agriculture- 84.1 not classified under current use law, 16.0 classified under
current use chapter 84.34 RCW
Cottonwood Creek-PAW
665.0 0
Zoning: Agricultural-100
No data
Cultivated Crops, 20.7 Developed, Open Space, 9.8
Emergent Herbaceous Wetlands, 36.4 Evergreen Forest, 10.3
Hay/Pasture, 7.8 Shrub/Scrub, 14.4
0 OWS, 0% levees Floodplain- 45.6%
Wetlands: 100% Priority Habitats and Species: Regions- Mule Deer, 100% Prairies and Steppe, 27.3% Water Quality Listings: none
Current Land Use: Agriculture- 82.0 not classified under current use law, 18.0 classified under
current use chapter 84.34 RCW
Cottonwood Creek-
Agriculture 123.2 10,800
Zoning: Agricultural- 100
No data Emergent Herbaceous Wetlands, 59.9
Evergreen Forest, 13.8 Shrub/Scrub, 25.6
0 OWS, 0% levees Floodplain- 76.0%
Wetlands: 86.5% Priority Habitats and Species: Regions- Mule Deer, 100% Water Quality Listings: none
Current Land Use: Agriculture- 100 (not classified under
current use law)
Palouse River- Confluence with
Snake 50.2 10,995 Zoning:
Agricultural-100
Federal-100 (Department of
Defense)
Evergreen Forest, 59.5 Open Water, 23.7 Shrub/Scrub, 15.7
0 OWS, 0% levees Floodplain- 60.0% Wetlands: 1.4% Priority Habitats and Species: Regions-

Reach Unit Area (Acres)
Shoreline Length (Feet)
Dominant Land Use Patterns (% of reach, only categories ≥1% reported)
Ownership (% of reach)
Land Cover (% of reach, only categories ≥1% reported)
Shoreline Modification (# of overwater structures [OWS]/% levees)
Floodplain and Floodway Area (% of reach)
Critical Areas (% of reach or type of occurrence, # of occurrences) & Water Quality (Cat. 4 and 5 listings reported)
Current Land Use: Agriculture- 86.3 (not classified under
current use law) Water Areas-13.7
Chukar, 50.0% Mule Deer, 50.1% Waterfowl Concentrations, 50.0% Occurrences- Prairie falcon, nest Water Quality Listings: none
Palouse River- Canyon
105.6 17,708
Zoning: Agricultural-100
Federal-99.9 (Bureau of Land
Manamgnet-30.9, Department of Degense-69.0)
Deciduous Forest, 7.4 Emergent Herbaceous Wetlands, 4.8
Evergreen Forest, 11.6 Open Water, 6.9
Shrub/Scrub, 63.5 Woody Wetlands, 4.9
0 OWS, 0% levees Floodplain- 84.7%
Wetlands: 65.0% Priority Habitats and Species: Regions- Chukar, 1.3% Mule Deer, 100% Ring-necked Pheasant, 48.2% Occurrences- Prairie falcon, biotic detection Water Quality Listings: Category 5, pH
Current Land Use: Agriculture- 35.3 (not classified under
current use law) Open space land classified under
chapter 84.24 RCW- 64.8
Palouse River-Palouse Falls
State Park 65.3 14,481
Zoning: Agricultural-100
State-100 (Parks and Recreation Commission)
Evergreen Forest, 9.9 Open Water, 20.4 Shrub/Scrub, 69.3
0 OWS, 0% levees Floodplain- 59.1%
Wetlands: 25.0% Priority Habitats and Species: Regions- Mule Deer, 100% Occurrences- Peregrine falcon, nest Water Quality Listings: Category 5, pH
Current Land Use: Agriculture- 100 (not classified under
current use law)
Palouse River- Agriculture
1,147.7 244,323
Zoning: Agricultural-100
Federal-8.1 (Bureau of Land Management)
State-1.9
(Department of Natural Resources)
Cultivated Crops, 7.4 Developed, Open Space, 3.1
Emergent Herbaceous Wetlands, 9.6 Evergreen Forest, 16.1
Hay/Pasture, 25.9 Herbaceous, 2.2 Open Water, 1.3
Shrub/Scrub, 30.2 Woody Wetlands, 1.7
8 OWS, 0% levees Floodplain- 68.9%
Wetlands: 24.9% Priority Habitats and Species: Regions- Mule Deer, 100% Waterfowl Concentrations, 10.3% Northwest White-tailed Deer, 31.3% Ring-necked Pheasant, 8.2% Occurrences- Ferruginous hawk, nest Prairie falcon, nest
Water Quality Listings: Category 5- Dissolved oxygen, pH, temperature
Current Land Use: Agriculture- 78.03 not classified under current use law, 21.97 classified under
current use chapter 84.34 RCW
856.8 175,866 Zoning: Agricultural-100
Cultivated Crops, 5.4 Developed, Open Space, 1.7
0 OWS, 0% levees Floodplain- 68.7% Wetlands: 56.8%
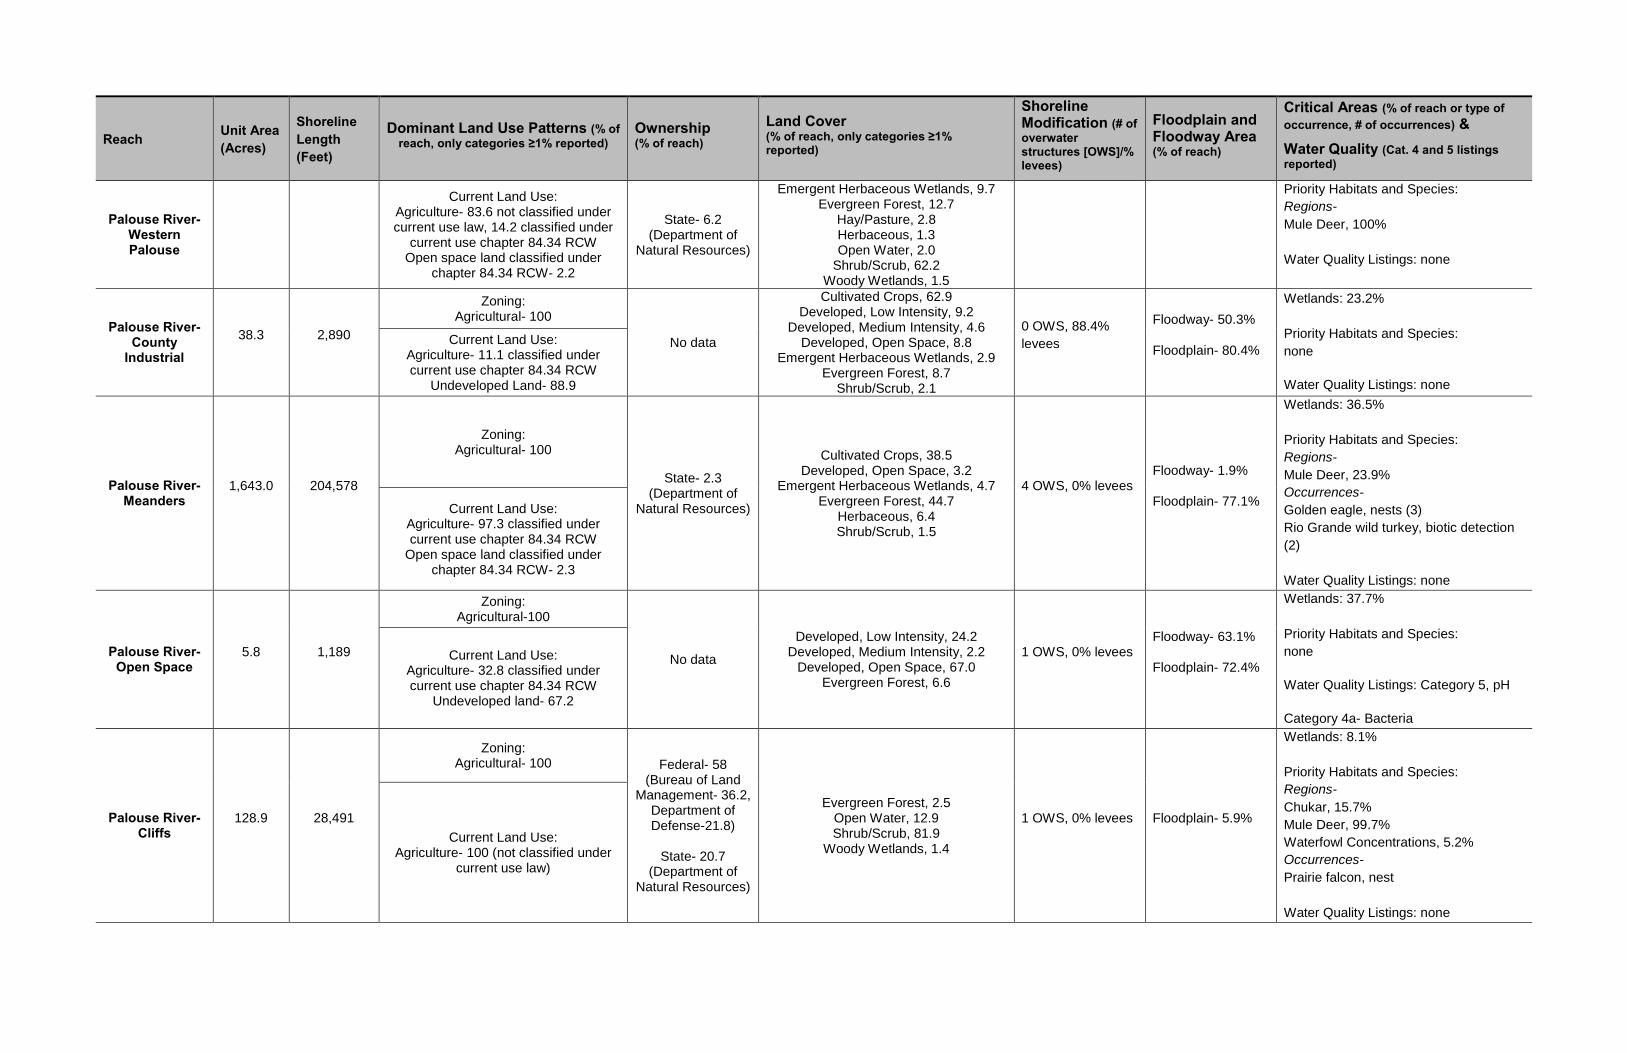
Reach Unit Area (Acres)
Shoreline Length (Feet)
Dominant Land Use Patterns (% of reach, only categories ≥1% reported)
Ownership (% of reach)
Land Cover (% of reach, only categories ≥1% reported)
Shoreline Modification (# of overwater structures [OWS]/% levees)
Floodplain and Floodway Area (% of reach)
Critical Areas (% of reach or type of occurrence, # of occurrences) & Water Quality (Cat. 4 and 5 listings reported)
Palouse River- Western Palouse
Current Land Use: Agriculture- 83.6 not classified under current use law, 14.2 classified under
current use chapter 84.34 RCW Open space land classified under
chapter 84.34 RCW- 2.2
State- 6.2 (Department of
Natural Resources)
Emergent Herbaceous Wetlands, 9.7 Evergreen Forest, 12.7
Hay/Pasture, 2.8 Herbaceous, 1.3 Open Water, 2.0
Shrub/Scrub, 62.2 Woody Wetlands, 1.5
Priority Habitats and Species: Regions- Mule Deer, 100% Water Quality Listings: none
Palouse River- County
Industrial 38.3 2,890
Zoning: Agricultural- 100
No data
Cultivated Crops, 62.9 Developed, Low Intensity, 9.2
Developed, Medium Intensity, 4.6 Developed, Open Space, 8.8
Emergent Herbaceous Wetlands, 2.9 Evergreen Forest, 8.7
Shrub/Scrub, 2.1
0 OWS, 88.4% levees
Floodway- 50.3%
Floodplain- 80.4%
Wetlands: 23.2% Priority Habitats and Species: none
Water Quality Listings: none
Current Land Use: Agriculture- 11.1 classified under current use chapter 84.34 RCW
Undeveloped Land- 88.9
Palouse River- Meanders
1,643.0 204,578
Zoning: Agricultural- 100
State- 2.3 (Department of
Natural Resources)
Cultivated Crops, 38.5 Developed, Open Space, 3.2
Emergent Herbaceous Wetlands, 4.7 Evergreen Forest, 44.7
Herbaceous, 6.4 Shrub/Scrub, 1.5
4 OWS, 0% levees Floodway- 1.9%
Floodplain- 77.1%
Wetlands: 36.5% Priority Habitats and Species: Regions- Mule Deer, 23.9% Occurrences- Golden eagle, nests (3) Rio Grande wild turkey, biotic detection (2) Water Quality Listings: none
Current Land Use: Agriculture- 97.3 classified under current use chapter 84.34 RCW
Open space land classified under chapter 84.34 RCW- 2.3
Palouse River- Open Space
5.8 1,189
Zoning: Agricultural-100
No data
Developed, Low Intensity, 24.2 Developed, Medium Intensity, 2.2
Developed, Open Space, 67.0 Evergreen Forest, 6.6
1 OWS, 0% levees Floodway- 63.1%
Floodplain- 72.4%
Wetlands: 37.7% Priority Habitats and Species: none
Water Quality Listings: Category 5, pH
Category 4a- Bacteria
Current Land Use: Agriculture- 32.8 classified under current use chapter 84.34 RCW
Undeveloped land- 67.2
Palouse River- Cliffs
128.9 28,491
Zoning: Agricultural- 100 Federal- 58
(Bureau of Land Management- 36.2,
Department of Defense-21.8)
State- 20.7
(Department of Natural Resources)
Evergreen Forest, 2.5 Open Water, 12.9 Shrub/Scrub, 81.9
Woody Wetlands, 1.4
1 OWS, 0% levees Floodplain- 5.9%
Wetlands: 8.1% Priority Habitats and Species: Regions- Chukar, 15.7% Mule Deer, 99.7% Waterfowl Concentrations, 5.2% Occurrences- Prairie falcon, nest Water Quality Listings: none
Current Land Use: Agriculture- 100 (not classified under
current use law)

Reach Unit Area (Acres)
Shoreline Length (Feet)
Dominant Land Use Patterns (% of reach, only categories ≥1% reported)
Ownership (% of reach)
Land Cover (% of reach, only categories ≥1% reported)
Shoreline Modification (# of overwater structures [OWS]/% levees)
Floodplain and Floodway Area (% of reach)
Critical Areas (% of reach or type of occurrence, # of occurrences) & Water Quality (Cat. 4 and 5 listings reported)
South Fork Palouse River-
Commercial 0.9 0
Zoning: Agricultural- 57.2 Unknown- 42.8
No data Cultivated Crops, 75.0
Developed, Low Intensity, 20.3 Developed, Open Space, 4.7
0 OWS, 0% levees Floodway- 8.6%
Floodplain- 86.0%
Wetlands: none Priority Habitats and Species: None Water Quality Listings: none
Current Land Use: Household, single family units- 42.8
Undeveloped land- 57.2
South Fork Palouse River-
South Fork River Road
315.1 33,199
Zoning: Agricultural- 89.5 Unknown- 10.5
No data
Cultivated Crops, 24.5 Developed, Low Intensity, 1.7 Developed, Open Space, 10.4
Emergent Herbaceous Wetlands, 9.9 Evergreen Forest, 47.1
Herbaceous, 1.3 Shrub/Scrub, 4.5
7 OWS, 0.1% levees Floodplain- 64.6%
Wetlands: 10.1% Priority Habitats and Species: None Water Quality Listings: Dissolved oxygen, pH, temperature
Current Land Use: Agriculture- 91.3 classified under current use chapter 84.34 RCW
Open space land classified under chapter 84.34 RCW- 8.8
South Fork Palouse River-
Agriculture 598.4 128,313
Zoning: Agricultural- 99.9 State- 4.8
(Washington State University)
Cultivated Crops, 52.4 Deciduous Forest, 1.4
Developed, Low Intensity, 1.0 Developed, Open Space, 8.9
Emergent Herbaceous Wetlands, 10.6 Evergreen Forest, 24.6
14 OWS, 0 % levees
Floodway- 6.3%
Floodplain- 58.1%
Wetlands: 1.3% Priority Habitats and Species: None Water Quality Listings:
Category 4a- 4,4’-DDE, Ammonia-N, Bacteria, Dieldrin, PCB
Current Land Use: Agriculture- 100, classified under current use chapter 84.34 RCW
South Fork Palouse River-
Agriculture/ Residential
33.8 6,915
Zoning: Agricultural- 57.6 Unknown- 42.4
No data
Cultivated Crops, 60.5 Developed, Medium Intensity, 2.0
Developed, Low Intensity, 1.1 Developed, Open Space, 27.3
Evergreen Forest, 9.0
1 OWS, 0% levees Floodway- 47.0%
Floodplain- 83.2%
Wetlands: none Priority Habitats and Species: None Water Quality Listings: Category 5- Dissolved oxygen, temperature
Category 4a- Ammonia-N, Bacteria
Current Land Use: Agriculture- 43.6 classified under current use chapter 84.34 RCW
Household, single family units- 26.0 Undeveloped land- 25.4
Utilities- 4.9
South Fork Palouse River- Pullman UGA
0.1 0
Zoning: Heavy Industrial District-100
No data Developed, Open Space- 93.2 Evergreen Forest- 6.8
0 OWS, 0% levees Floodplain- 1.1%
Wetlands: none Priority Habitats and Species: None Water Quality Listings: None
Current Land Use: Undeveloped Land-100
North Fork Palouse River-
Agriculture 1,281.5 275,509 Zoning:
Agricultural- 99.3
Whitman County-6.1
Cultivated Crops, 31.4 Developed, Open Space, 4.5
Emergent Herbaceous Wetlands, 5.3 Evergreen Forest, 56.2
10 OWS, 0.5% levees
Floodway- 0.8%
Floodplain- 61.3%
Wetlands: 14.5% Priority Habitats and Species:

Reach Unit Area (Acres)
Shoreline Length (Feet)
Dominant Land Use Patterns (% of reach, only categories ≥1% reported)
Ownership (% of reach)
Land Cover (% of reach, only categories ≥1% reported)
Shoreline Modification (# of overwater structures [OWS]/% levees)
Floodplain and Floodway Area (% of reach)
Critical Areas (% of reach or type of occurrence, # of occurrences) & Water Quality (Cat. 4 and 5 listings reported)
Current Land Use: Agriculture- 98.4 classified under current use chapter 84.34 RCW
Undeveloped Land- 1.4
State-0.7 (Department of
Natural Resources)
None Water Quality Listings:
Category 5- Dissolved oxygen, pH, temperature
Category 4a- 4,4’-DDE, Bacteria, PCB
Snake River-Industrial
253.5 52,970
Zoning: Heavy Industrial-100
Federal-100 (Corps)
Developed, High Intensity, 2.3 Developed, Low Intensity, 11.9
Developed, Medium Intensity, 5.9 Developed, Open Space, 9.4
Herbaceous, 23.1 Open Water, 9.6
Shrub/Scrub, 37.2
28 OWS, 0% levees Floodplain- 65.5%
Wetlands: 43.4% (based on hydric soils) Priority Habitats and Species: Regions- Chukar, 50.9% Mule Deer, 51.3% Waterfowl Concentrations, 34.2% Water Quality Listings: Category 5- temperature Category 4a-Dioxin, total dissolved gas Category 4c- invasive exotic species
Current Land Use: Agriculture- 38.02 not classified under
current use law Food and kindred products-19.13
Miscellaneous manufacturing-23.08 Water areas-19.77
Snake River-Cliffs
81.1 18,641
Zoning: Agricultural-100
Federal-100 (Corps)
Open Water- 25.1 Shrub/Scrub- 74.9
1 OWS, 0% levees Floodplain- 68.2%
Wetlands: 3.3% Priority Habitats and Species: Regions- Chukar, 76.0% Mule Deer, 76.3% Waterfowl Concentrations, 24.0% Water Quality Listings: none
Current Land Use: Agriculture- 72.7 not classified under
current use law Water areas- 27.3
Snake River-Steptoe Canyon
11.6 1,015
Zoning: Agricultural-100
Federal-100 (Corps)
Herbaceous- 51.5 Open Water-4.5
Shrub/Scrub-44.0
0 OWS, 0% levees Floodplain- 77.1%
Wetlands: 60.6% Priority Habitats and Species: Regions- Chukar, 78.7% Mule Deer, 78.8% Waterfowl Concentrations, 21.3% Water Quality Listings: none
Current Land Use: Agriculture- 100 (not classified under
current use law)
Snake River-Railroad
1,470.7 320,778 Zoning: Agricultural- 98.9
Federal-95.4 (Corps-87.4,
Bureau of Land Management-8.0)
State-3.5 (Department of
Developed, Low Intensity- 2.5 Herbaceous-11.0 Open Water-20.6 Shrub/Scrub-62.1
36 OWS, 0% levees Floodplain- 65.4%
Wetlands: 12.0% Priority Habitats and Species: Regions- Chukar, 70.0%

Reach Unit Area (Acres)
Shoreline Length (Feet)
Dominant Land Use Patterns (% of reach, only categories ≥1% reported)
Ownership (% of reach)
Land Cover (% of reach, only categories ≥1% reported)
Shoreline Modification (# of overwater structures [OWS]/% levees)
Floodplain and Floodway Area (% of reach)
Critical Areas (% of reach or type of occurrence, # of occurrences) & Water Quality (Cat. 4 and 5 listings reported)
Current Land Use: Agriculture- 61.3 (classified under current use chapter 84.3 RCW)
Open space land classified under chapter 84.34 RCW- 13.9
Water areas-24.7
Natural Resources-2.3, Washington State Univeristy-
1.2)
Mule Deer, 70.2% Waterfowl Concentrations, 30.0% Ring-necked Pheasant 1.0% Occurrences- Pacific lamprey, biotic detection (1) Prairie falcon, nest (5) Water Quality Listings: Category 5- 2,3,7,8-TCDD;4,4’-DDE; dieldrin; dioxin; dissolved oxygen; PCB; pH; temperature, total chlordane
Category 4a-dioxin, total dissolved gas
Category 4c-invasive exotic species
Snake River- Parks/Open
Space 398.4 90,451
Zoning: Agricultural-97.7
Federal-95.6 (Corps-94.3,
Bureau of Land Management-1.3)
State-2.1
(Washington State University)
Developed, Low Intensity- 1.5 Developed, Open Space-3.8
Emergent Herbaceous Wetlands-5.5 Evergreen Forest- 4.2
Hay/Pasture- 28.5 Herbaceous- 19.8 Open Water-12.4 Shrub/Scrub-18.6
Woody Wetlands-2.4
44 OWS, 0% levees Floodplain- 59.4%
Wetlands: 24.6% Priority Habitats and Species: Regions- Chukar, 27.6% Mule Deer, 34.0% Waterfowl Concentrations, 64.8% Ring-necked Pheasant, 27.1% Occurrences- Bald eagle, nest (1) Great blue heron, colony (1) Western toad, biotic detection (11) Water Quality Listings:
Category 5- 2,3,7,8-TCDD;4,4’-DDE; dieldrin; dioxin; dissolved oxygen; PCB; pH; temperature, total chlordane
Category 4c-invasive exotic species
Current Land Use: Agriculture- 48.9 (not classified under
current use law) Open space land classified under
chapter 84.34 RCW- 17.5 Food and kindred products-3.8
Miscellaneous manufacturing-2.1 Water areas-30.5
Rock Creek-Pine Creek Confluence
294.6 5,105
Zoning: Agricultural-100
Federal-15.0 (Bureau of
Reclamation)
Cultivated Crops- 22.8 Deciduous Forest-3.2
Developed, Open Space- 1.9 Evergreen Forest- 18.2
Hay/Pasture- 11.2 Herbaceous-5.7
Shrub/Scrub-36.1
0 OWS, 0% levees Floodplain- 68.9%
Wetlands: 94.3 Priority Habitats and Species: Regions- Bald Eagle, 3.6% Cliffs/Bluffs, 2.5% Mule Deer, 81.1% Rocky Mountain Elk, 98.6% Water Quality Listings: none
Current Land Use: Agriculture- 100 (not classified under
current use law)

Reach Unit Area (Acres)
Shoreline Length (Feet)
Dominant Land Use Patterns (% of reach, only categories ≥1% reported)
Ownership (% of reach)
Land Cover (% of reach, only categories ≥1% reported)
Shoreline Modification (# of overwater structures [OWS]/% levees)
Floodplain and Floodway Area (% of reach)
Critical Areas (% of reach or type of occurrence, # of occurrences) & Water Quality (Cat. 4 and 5 listings reported)
Rock Creek- Lake Outlet
241.8 16,849
Zoning: Agricultural-100
Federal-0.1 (Bureau of Land Management)
Emergent Herbaceous Wetlands-26.9 Evergreen Forest-32.8
Herbaceous-9.0 Open Water-7.0
Shrub/Scrub-14.9 Woody Wetlands-8.7
0 OWS, 0% levees Floodplain- 66.8%
Wetlands:71.4 Priority Habitats and Species: Regions- Mule Deer, 100% Water Quality Listings: none
Current Land Use: Agriculture- 100 (not classified under
current use law)
Rock Creek- Cottonwood Confluence/
PAW
584.8 69,268
Zoning: Agricultural- 100
Federal-37.6 (Bureau of Land Management)
State-10.8
(Department of Fish and Wildlife)
Emergent Herbaceous Wetlands-47.2 Evergreen Forest-12.9
Herbaceouse-3.1 Shrub/Scrub-35.6
0 OWS, 0% levees Floodplain- 57.8%
Wetlands: 80.2% Priority Habitats and Species: Regions- Mule Deer, 100%
Water Quality Listings: none
Current Land Use: Agriculture- 99.4 (not classified under
current use law)
Rock Creek- Imbler Creek
302.6 30,038
Zoning: Agricultural-100
Federal-100 (Bureau of Land Management)
Emergent Herbaceous Wetlands-49.2 Evergreen Forest-12.7
Shrub/Scrub-37.3
0 OWS, 0% levees Floodplain- 70.2%
Wetlands: 15.4 Priority Habitats and Species: Regions- Prairies and Steppe, 31.7% Ring-necked Pheasant, 63.3% Mule Deer, 100% Occurrences- Western Long-eared bat, biotic detection (2) Yuma myotis, biotic detection (2) Water Quality Listings: none
Current Land Use: Agriculture- 34.4 (not classified under
current use law) Open space land classified under
chapter 84.84 RCW- 65.6
Rock Creek-Escure Ranch
489.6 68,743
Zoning: Agricultural-100
Federal-100 (Bureau of Land Management)
Emergent Herbaceous Wetlands-26.9 Evergreen Forest-25.8
Herbaceous-7.1 Shrub/Scrub- 39.5
0 OWS, 0% levees Floodplain- 57.3%
Wetlands: 54.2% Priority Habitats and Species: Regions- Mule Deer, 100% Occurrences- Little brown myotis, biotic detection (64) Long-legged myotis, biotic detection (42) Prairie falcon, nest (1) Western Long-eared bat, biotic detection (71) Yuma myotis, biotic detection (287) Water Quality Listings: none
Current Land Use: Agriculture- 23.4 (not classified under
current use law) Open space land classified under
chapter 84.84 RCW- 76.6
Rock Creek-Agriculture
Zoning: Agricultural-100 No data Developed, Open Space-7.2
Emergent Herbaceous Wetlands- 28.6 Wetlands: 83.6%

Reach Unit Area (Acres)
Shoreline Length (Feet)
Dominant Land Use Patterns (% of reach, only categories ≥1% reported)
Ownership (% of reach)
Land Cover (% of reach, only categories ≥1% reported)
Shoreline Modification (# of overwater structures [OWS]/% levees)
Floodplain and Floodway Area (% of reach)
Critical Areas (% of reach or type of occurrence, # of occurrences) & Water Quality (Cat. 4 and 5 listings reported)
423.2 39,502
Current Land Use: Agriculture- 62.2 (not classified under
current use law) Agriculture classified under current use
chapter 84.81 RCW- 37.8
Evergreen Forest- 13.5 Hay/Pasture- 39.4 Shrub/Scrub-10.3 0 OWS, 0% levees Floodplain- 41.1%
Priority Habitats and Species: Regions- Mule Deer, 100%
Water Quality Listings: none
Union Flat Creek-
Scablands 404.2 89,648
Zoning: Agricultural-100
State-14.4 (Department of
Natural Resources)
Cultivated Crops-1.0 Developed, Open Space-2.0
Emergent Herbaceous Wetlands-8.3 Hay/Pasure-6.0
Shrub/Scrub-82.3
0 OWS, 0% levees Floodplain- 56.9%
Wetlands: 25.8% Priority Habitats and Species: Regions- Mule Deer, 100%
Water Quality Listings: none
Current Land Use: Agriculture- 100 (not classified under
current use law)
Union Flat Creek-
Agriculture 855.6 116,104
Zoning: Agricultural-100
State-4.2 (Department of
Natural Resources)
Cultivated Crops-93.2 Developed, Open Space-4.6
Shrub/Scrub-1.6
0 OWS, 0% levees Floodplain- 85.5%
Wetlands: 19.8% Priority Habitats and Species: Regions- Mule Deer, 59.6%
Water Quality Listings: none
Current Land Use: Agriculture- 2.04 (not classified under
current use law) Agriculture classified under chapter
84.84 RCW- 98.0
Union Flat Creek-
Agriculture Riparian
921.6 100,860
Zoning: Agricultural-100
Whitman County-6.9
State-9.0 (Dept. of Natural Resources)
Cultivated Crops-77.2 Developed, Open Space-6.1
Evergreen Forest-12.4 Herbaceous-2.7
0 OWS, 0% levees Floodplain- 72.7%
Wetlands: 1.5% Priority Habitats and Species: None
Water Quality Listings: none
Current Land Use: Agriculture classified under chapter
84.84 RCW- 97.6 Open space land classified under
chapter 84.84 RCW- 2. 5
Fourmile Creek 22.6 2,631
Zoning: Agricultural-100
No data Cultivated Crops- 85.5 Developed, Open Space- 13.8
0 OWS, 0% levees Floodplain- 80.8
Wetlands: none Priority Habitats and Species: None
Water Quality Listings: none
Current Land Use: Agriculture classified under chapter
84.84 RCW- 100

Appendix D. Summary of Shoreline Inventory Results for the Reaches of the South Fork Palouse River within the City of Albion.1
Reach (South Fork Palouse River)
Unit Area (Acres)
Unit Length (Feet)
Dominant Land Use Patterns (% of reach, only categories ≥1% reported)
Ownership (% of reach)
Land Cover (% of reach, only categories ≥1% reported)
Shoreline Modification (# of overwater structures [OWS]/% levees)
Floodplain and Floodway Area (% of reach)
Critical Areas (% of reach or type of occurrence, # of occurrences) & Water Quality (Cat. 4 and 5 listings reported)
Albion Residential
25.7 1,564
Zoning: Proposed Commercial- 9.2
Residential 2- 60.7 Residential 3- 29.4
No data
Cultivated Crops-18.6 Developed, Low Intensity-16.7 Developed, Open Space-56.8
Evergreen Forest-7.7
1 OWS, 0% levees
Floodway-47.4
Floodplain-93.8
Wetlands: 1.0
Priority Habitats and Species: none
Water Quality Listings: Category 4a, bacteria
Current Land Use %: Agriculture classified under current
use chapter 84.34 RCW- 44.94 Governmental services- 1.95
Household, single family units- 53.11
Albion Agriculture 12.0 1,097
Zoning: No data
No data Cultivated Crops-20.4
Developed, Low Intensity-4.7 Developed, Open Sapce-73.6
1 OWS, 0% levees
Floodway-31.4 Floodplain-62.1
Wetlands: none
Priority Habitats and Species: none Water Quality Listings: Category 4a, bacteria
Current Land Use%: Agriculture classified under current
use chapter 84.34 RCW- 99.98
Albion Industrial 16.2 2,164
Zoning: Industrial-50.6
No data
Cultivated Crops-7.9 Developed, Low Intenisty-3.7 Developed, Open Space-28.5
Evergreen Forest-58.5
0 OWS, 0% levees
Floodway-18.4 Floodplain-58.2
Wetlands: 4.3
Priority Habitats and Species: none
Water Quality Listings: Category 4a, bacteria
Current Land Use %: Agriculture classified under current
use chapter 84.34 RCW- 93.67 Household, single family units- 6.18
1 Data sources, assumptions, and limitations summarized in Appendix C.

Appendix D. Summary of Shoreline Inventory Results for the City of Colfax.1
Reach Unit Area (Acres)
Unit Length (Feet)
Dominant Land Use Patterns (% of reach, only categories ≥1% reported)
Ownership (% of reach)
Land Cover (% of reach, only categories ≥1% reported)
Shoreline Modification (# of overwater structures [OWS]/% levees)
Floodplain and Floodway Area (% of reach)
Critical Areas (% of reach or type of occurrence, # of occurrences) & Water Quality (Cat. 4 and 5 listings reported)
Colfax Agriculture
197.7 40,292
Zoning: Unclassified- 96.1
Residential 1 (R2)- 3.9 State – 1.0 (Dept of Natural
Resources)
Cultivated Crops- 44.6 Evergreen Forest- 33.7
Emergent Herbaceous Wetlands- 11.4
Developed, Open Space- 6.2 Mixed Forest- 1.3
0 OWS 1.6% levees
Floodway- 0 Floodplain- 66.0
Wetlands: 30.8%
Priority Habitats and Species: none
Water Quality Listings: Category 5, pH and temperature Category 4a, bacteria
Current Land Use: Agriculture classified under current use
chapter 84.34 RCW- 96.6 Undeveloped Land- 2.0
Household, Single Family Units- 1.0
Colfax Flume, Commercial
39.2 6,016
Zoning: Unclassified- 45.2 Commercial- 26.2
Business- 10.8 Residential 1 (R1)- 10.4
Manufacturing- 5.8 Residential 1 (R2)- 1.6
No data
Developed, Medium Intensity- 56.8 Developed, Low Intensity- 20.8 Developed, High Intensity- 17.6 Developed, Open Space- 4.6
7 OWS 100% levees
Floodway- 0 Floodplain- 13.4
Wetlands: 0.6%
Priority Habitats and Species: none Water Quality Listings: Category 5, dissolved oxygen and pH
Current Land Use: Utilities- 41.2
Other Retail Trade- 25.6 Household, Single Family Units- 12.7
Wholesale Trade- 5.7 Open space land classified under chapter
84.34 RCW- 4.5 Miscellaneous Manufacturing- 4.4
Hotels/Motels- 3.6 Undeveloped Land- 1.3
Retail Trade - Building Materials, Hardware, and Farm Equipment- 1.1
Colfax Flume, Residential
12.7 2,653
Zoning: Residential 1 (R1)- 40.2
Unclassified- 37.0 Residential 1 (R2)- 20.1
Business- 2.2 No data Developed, Low Intensity- 39.2 Developed, Open Space- 34.6
Developed, Medium Intensity- 25.4
0 OWS 100% levees
Floodway- 0 Floodplain- 31.3
Wetlands: 0
Priority Habitats and Species: none Water Quality Listings: Category 5, dissolved oxygen and pH
Current Land Use : Household, Single Family Units- 60.3
Utilities- 37.0 Other Retail Trade- 2.7
Colfax Flume, Undeveloped
4.5 985
Zoning: Unclassified- 71.4
Manufacturing- 18.8 Residential 1 (R1)- 6.3
Business- 3.0
No data Scrub/Shrub- 44.8
Developed, Open Space- 29.6 Developed, Low Intensity- 25.5
0 OWS 100% levees
Floodway- 0 Floodplain- 34.7
Wetlands: 0
Priority Habitats and Species: none
1 Data sources, assumptions, and limitations summarized in Appendix C.

Reach Unit Area (Acres)
Unit Length (Feet)
Dominant Land Use Patterns (% of reach, only categories ≥1% reported)
Ownership (% of reach)
Land Cover (% of reach, only categories ≥1% reported)
Shoreline Modification (# of overwater structures [OWS]/% levees)
Floodplain and Floodway Area (% of reach)
Critical Areas (% of reach or type of occurrence, # of occurrences) & Water Quality (Cat. 4 and 5 listings reported)
Current Land Use: Utilities- 69.0
Open space land classified under chapter 84.34 RCW- 12.5
Undeveloped Land- 9.9 Household, Single Family Units- 8.6
Water Quality Listings: Category 5, dissolved oxygen and pH
Colfax Industrial/ Commercial 36.3 4,430
Zoning: Unclassified- 65.9 Commercial- 21.9
Residential 2 (R3)- 9.7 Residential 1 (R2)- 2.4
No data
Developed, Low Intensity- 54.6 Developed, Medium Intensity- 18.2
Developed, Open Space- 17.8 Cultivated Crops- 8.7
4 OWS 97% levees
Floodway- 29.4 Floodplain- 88.6
Wetlands: 15.3%
Priority Habitats and Species: none Water Quality Listings: Category 5, pH Category 4a, bacteria
Current Land Use: Miscellaneous Manufacturing- 33.2
Open space land classified under chapter 84.34 RCW- 24.9
Utilities- 23.4 Other Retail Trade- 9.1 Undeveloped Land- 6.1
Agriculture classified under current use chapter 84.34 RCW- 1.8
Household, Single Family Units- 1.7
Colfax Open Space 6.5 1,081
Zoning: Manufacturing- 85.8 Unclassified- 14.2
No data
Developed, Open Space- 36.9 Scrub/Shrub- 29.5
Developed, Low Intensity- 23.3 Developed, Medium Intensity- 5.6
Herbaceous- 4.7
0 OWS 26.9% levees
Floodway- 0 Floodplain- 60.1
Wetlands: 0
Priority Habitats and Species: none Water Quality Listings: Category 5, dissolved oxygen and pH
Current Land Use: Wholesale Trade- 47.7
Open space land classified under chapter 84.34 RCW- 29.4
Utilities- 8.7 Undeveloped Land- 8.4
Agriculture classified under current use chapter 84.34 RCW- 5.8
Colfax Parks 19.5 4,283
Zoning: Residential 1 (R2)- 51.7
Unclassified- 48.3 No data
Hay/Pasture- 57.7 [mowed grass] Evergreen Forest- 21.4
Developed, Open Space- 10.7 Cultivated Crops- 5.4
Emergent Herbaceous Wetlands- 4.9
0 OWS 0% levees
Floodway- 0 Floodplain- 29.5
Wetlands: 10.8%
Priority Habitats and Species: none Water Quality Listings: None
Current Land Use: Recreational Activities- 74.7
Agriculture classified under current use chapter 84.34 RCW- 25.2
Colfax Residential 48.5 10,241
Zoning: Residential 1 (R2)- 42.1
Unclassified- 17.8 Commercial- 15.1
Residential 2 (R3)- 14.1 Residential 1 (R1)- 10.9
No data
Developed, Low Intensity- 45.2 Developed, Open Space- 25.6
Developed, Medium Intensity- 20.7 Evergreen Forest- 4.6 Cultivated Crops- 3.8
0 OWS 71.3% levees
Floodway- 0 Floodplain- 12.1
Wetlands: 11.3%
Priority Habitats and Species: none

Reach Unit Area (Acres)
Unit Length (Feet)
Dominant Land Use Patterns (% of reach, only categories ≥1% reported)
Ownership (% of reach)
Land Cover (% of reach, only categories ≥1% reported)
Shoreline Modification (# of overwater structures [OWS]/% levees)
Floodplain and Floodway Area (% of reach)
Critical Areas (% of reach or type of occurrence, # of occurrences) & Water Quality (Cat. 4 and 5 listings reported)
Current Land Use: Utilities- 43.0
Household, Single Family Units- 31.4 Open space land classified under chapter
84.34 RCW- 12.0 Educational Services- 4.5 Recreational Activities- 2.1
Parks- 2.0 Other Retail Trade- 1.8 Undeveloped Land- 1.6
Water Quality Listings: Category 5, pH Category 4a, bacteria
Colfax Scrub Shrub/PAW 2.8 0
Zoning: Unclassified- 84.1 Agricultural- 15.9
No data Developed, Open Space- 87.8 Evergreen Forest- 11.7
0 OWS 0% levees
Floodway- 66.1 Floodplain- 66.1
Wetlands: 22.1%
Priority Habitats and Species: none Water Quality Listings: None
Current Land Use: Undeveloped Land- 84.1
Agriculture classified under current use chapter 84.34 RCW- 15.9

Appendix D. Summary of Shoreline Inventory Results for the Reach of Pine Creek within the City of Malden.1
Reach Unit Area (Acres)
Unit Length (Feet)
Dominant Land Use Patterns (% of reach, only categories ≥1%
reported) Ownership (% of reach)
Land Cover (% of reach, only categories ≥1% reported)
Shoreline Modification (# of overwater structures [OWS]/% levees)
Floodplain and Floodway Area (% of reach)
Critical Areas (% of reach or type of occurrence, # of occurrences) & Water Quality (Cat. 4 and 5 listings reported)
Pine Creek- Malden
58.2 6,180
Zoning: No data
No data Cultivated Crops-73.7
Developed, Open Space-4.7 Evergreen Forest-21.5
0 OWS, 0% levees none
Wetlands: 35.0%
Priority Habitats and Species: none
Water Quality Listings: none
Current Land Use %: Agriculture (not classified under
current use law)- 45.97 Agriculture classified under chapter 84.84 RCW- 53.27
1 Data sources, assumptions, and limitations summarized in Appendix C.

Appendix D. Summary of Shoreline Inventory Results for the Reaches of the Palouse River within the City of Palouse.1
Reach Unit Area (Acres)
Unit Length (Feet)
Dominant Land Use Patterns (% of reach, only categories ≥1%
reported) Ownership (% of reach)
Land Cover (% of reach, only categories ≥1% reported)
Shoreline Modification (# of overwater structures [OWS]/% levees)
Floodplain and Floodway Area (% of reach)
Critical Areas (% of reach or type of occurrence, # of occurrences) & Water Quality (Cat. 4 and 5 listings reported)
City of Palouse, Commercial
12.7 1,302
Zoning: Commercial-69.6
Low Density Residential-4.5 Open Space- 25.9
No data
Developed, Low Intensity-11.6 Developed, Medium Intensity- 71.3
Developed, Open Space-16.1 Evergreen Forest- 1.0
3 OWS, 0% levees
Floodway-17.1
Floodplain-59.6
Wetlands: 3.4
Priority Habitats and Species: none
Water Quality Listings: Category 5- dissolved oxygen, pH, temperature Category 4a, bacteria
Current Land Use %: Business Services- 6.57
Household, single family units- 10.75 Mobil home parks or courts- 3.09
Other retail trade- 6.23 Parks- 7.51
Retail trade-automotive, marine craft, aircraft, and accessories- 3.67
Undeveloped land- 10.04 Utilities- 48.86
Wholesale trade- 3.30
City of Palouse, Residential 3.1 0
Zoning: Light Industrial- 1.6
Low Density Residential- 98.3 No data
Developed, Low Intensity-28.0 Developed, Medium Intensity-29.9
Developed, Open Space-42.1
0 OWS, 0% levees
Floodway-4.2 Floodplain-100
Wetlands: none
Priority Habitats and Species: none Water Quality Listings: none
Current Land Use %: Household, single family units-26.44
Parks- 7.78 Utilities- 65.78
City of Palouse, Agriculture 28.2 3,814
Zoning: Agriculture- 57.7
Open Space- 28.7
No data Cultivated Crops-66.4
Developed, Open Space-18.1 Evergreen Forest- 15.6
1 OWS, 0% levees
Floodway-37.5 Floodplain-88.8
Wetlands: 12.6%
Priority Habitats and Species: none
Water Quality Listings: Category 4a, bacteria
Current Land Use %: Agriculture classified under current
use chapter 84.34 RCW- 3.8 Undeveloped land- 92.8
Utilities- 3.4
City of Palouse, Industrial 9.3 1,371
Zoning: Commercial-5.7
Light Industrial- 14.0 Low Density Residential- 2.1
Open Space- 20.1
No data
Developed, Low Intensity-37.3 Developed, Medium Intensity- 45.5
Developed, Open Space-15.4 Evergreen Forest- 1.7
1 OWS, 0% levees
Floodway-11.5 Floodplain-51.9
Wetlands: 6.3%
Priority Habitats and Species: none Water Quality Listings: Category 4a, bacteria
Current Land Use %: Household, single family units- 2.1 Miscellaneous manufacturing- 14.0
Mobil home parks or courts- 5.7 Parks- 9.7
Recreational activities- 10.54 Utilites-58.1
1 Data sources, assumptions, and limitations summarized in Appendix C.

Reach Unit Area (Acres)
Unit Length (Feet)
Dominant Land Use Patterns (% of reach, only categories ≥1%
reported) Ownership (% of reach)
Land Cover (% of reach, only categories ≥1% reported)
Shoreline Modification (# of overwater structures [OWS]/% levees)
Floodplain and Floodway Area (% of reach)
Critical Areas (% of reach or type of occurrence, # of occurrences) & Water Quality (Cat. 4 and 5 listings reported)
City of Palouse, Open Space 62.5 3,884
Zoning: Agriculture- 4.1
Light Industrial- 1.6 Low Density Residential- 9.2
Open Space- 85.1 No data
Cultivated Crops- 22.5 Developed, Low Intensity-7.8
Developed, Medium Intensity- 1.9 Developed, Open Space-33.0
Emergent Herbaceous Wetlands- 1.3
Evergreen Forest- 33.6
0 OWS, 0% levees
Floodway-28.6 Floodplain-50.1
Wetlands: 6.2%
Priority Habitats and Species: none Water Quality Listings: Category 5- dissolved oxygen, pH, temperature Category 4a, bacteria
Current Land Use %: Household, single family units- 4.80
Parks- 10.10 Recreational activities- 4.78 Undeveloped land- 65.22
Utilities- 15.10

Appendix D. Summary of Shoreline Inventory Results for the City of Pullman.1
Reach (South Fork Palouse River)
Unit Area (Acres)
Unit Length (Feet)
Dominant Land Use Patterns (% of reach, only categories ≥1% reported)
Ownership (% of reach)
Land Cover (% of reach, only categories ≥1% reported)
Shoreline Modification (# of overwater structures [OWS]/% levees)
Floodplain and Floodway Area (% of reach)
Critical Areas (% of reach or type of occurrence, # of occurrences) & Water Quality (Cat. 4 and 5 listings reported)
Pullman South Commercial
25.8 2,897
Zoning: General Commercial- 100
WSU- 8.5
Developed, Medium Intensity- 48.0 Developed, Low Intensity- 27.0 Developed, Open Space- 22.5 Developed, High Intensity- 2.3
1 OWS 0% levees
Floodway- 24.7 Floodplain- 51.4
Wetlands: none
Priority Habitats and Species: none
Water Quality Listings: Category 5, dissolved oxygen Category 4a, bacteria
Current Land Use: Utilities- 47.5
Amusements- 11.5 Undeveloped Land- 10.2
Professional Services- 8.1 Retail Trade-Eating and Drinking- 7.5
Miscellaneous Services- 6.2 Hotels/Motels- 5.9
Retail Trade-Apparel and Accessories- 2.1
Pullman Commercial/
Business District 25.8 4,728
Zoning: Central Business- 85.4
General Commercial- 13.3 High-Density Multi-family Residential- 1.3
No data
Developed, Medium Intensity- 57.5 Developed, Low Intensity- 18.8 Developed, High Intensity- 14.4 Developed, Open Space- 9.4
5 OWS 0% levees
Floodway- 27.2 Floodplain- 66.9
Wetlands: none
Priority Habitats and Species: none Water Quality Listings: Category 5, dissolved oxygen and temperature Category 4a, bacteria
Current Land Use: Utilities- 53.2
Other Retail Trade- 15.0 Parks- 11.5
Professional Services- 6.2 Governmental Services- 5.9
Railroad/transit transportation- 3.1 Retail Trade - Building Materials, Hardware,
and Farm Equipment- 3.0 Retail Trade – automotive, marine craft,
aircraft and accessories- 1.2
Pullman Industrial 39.3 7,046
Zoning: Heavy Industrial- 97.0
General Commercial- 1.6 No data
Developed, Low Intensity- 37.1 Developed, Medium Intensity- 34.3
Developed, Open Space- 24.5 Developed, High Intensity- 3.4
0 OWS 0% levees
Floodway- 41.0 Floodplain- 84.0
Wetlands: none
Priority Habitats and Species: none Water Quality Listings: Category 5, dissolved oxygen and temperature Category 4a, bacteria and ammonia-N
Current Land Use : Utilities- 67.5
Miscellaneous Manufacturing- 30.6 Household, Single Family Units- 1.6
Pullman Parks 47.8 9,055
Zoning: General Commercial- 58.0
Low-Density Multi-family Residential- 29.6 High-Density Multi-family Residential- 9.9
Washington State University- 2.5 WSU- 15.6 Developed, Open Space- 47.1 Developed, Low Intensity- 32.1
Developed, Medium Intensity- 20.8
5 OWS 0% levees
Floodway- 34.0 Floodplain- 83.6
Wetlands: none
Priority Habitats and Species: none Water Quality Listings: Category 5, dissolved oxygen Category 4a, bacteria
Current Land Use: Parks- 33.6
Undeveloped Land- 24.3 Utilities- 25.8
Mobile Home Parks or Courts- 15.2
1 Data sources, assumptions, and limitations summarized in Appendix C.

Reach (South Fork Palouse River)
Unit Area (Acres)
Unit Length (Feet)
Dominant Land Use Patterns (% of reach, only categories ≥1% reported)
Ownership (% of reach)
Land Cover (% of reach, only categories ≥1% reported)
Shoreline Modification (# of overwater structures [OWS]/% levees)
Floodplain and Floodway Area (% of reach)
Critical Areas (% of reach or type of occurrence, # of occurrences) & Water Quality (Cat. 4 and 5 listings reported)
Pullman Residential 26.8 1,496
Zoning: Low-Density Multi-family Residential- 43.6
Medium-Density Multi-family Residential- 24.4 Manufactured Home Park Overlay- 20.2
Single Family Residential- 6.7 High-Density Multi-family Residential- 4.1
Heavy Industrial District- 1.0 WSU- 0.7
Developed, Open Space- 44.6 Developed, Medium Intensity- 39.3
Developed, Low Intensity- 12.9 Evergreen Forest- 3.2
2 OWS 0% levees
Floodway- 13.9 Floodplain- 59.4
Wetlands: none
Priority Habitats and Species: none Water Quality Listings: Category 5, dissolved oxygen Category 4a, bacteria
Current Land Use: Household, Single Family Units- 30.2
Utilities- 19.1 Mobile Home Parks or Courts- 14.4
Undeveloped Land- 13.0 Household, Multi Units- 12.0
Hotels/Motels- 5.9 Parks- 4.0

Appendix D. Summary of Shoreline Inventory Results for the Reaches of Pine Creek within the City of Rosalia.1
Reach Unit Area (Acres)
Unit Length (Feet)
Dominant Land Use Patterns (% of reach, only categories ≥1%
reported) Ownership (% of reach)
Land Cover (% of reach, only categories ≥1% reported)
Shoreline Modification (# of overwater structures [OWS]/% levees)
Floodplain and Floodway Area (% of reach)
Critical Areas (% of reach or type of occurrence, # of occurrences) & Water Quality (Cat. 4 and 5 listings reported)
Pine Creek- Rosalia Airport
0.2 0
Zoning: No data
City of Rosalia-100 Cultivated Crops-100
0 OWS 0% levees none
Wetlands: none
Priority Habitats and Species: none
Water Quality Listings: none
Current Land Use %: Aircraft Transportation-100
Pine Creek- Rosalia
Residential/Open Space
20.0 1,132
Zoning: No data
No data Developed, Low Intensity-19.4
Developed, Medium Intensity-1.6 Developed, Open Space-77.6
0 OWS 0% levees
Floodway-30.7 Floodplain-96.6
Wetlands: none
Priority Habitats and Species: none Water Quality Listings: none
Current Land Use %: Food and kindred products-1.76
Household, single family units-24.82 Open space classified under chapter
84.34 RCW-73.41
Pine Creek- Rosalia City Park 9.5 799
Zoning: No data
No data Cultivated Crops-37.5
Developed, Low Intensity-8.9 Developed, Open Space-53.5
0 OWS 0% levees
Floodway-27.9 Floodplain-79.9
Wetlands: none
Priority Habitats and Species: none
Water Quality Listings: none Current Land Use %:
Parks-100
Pine Creek- Rosalia
Agriculture 17.3 1,741
Zoning: No data
No data Cultivated Crops-45.8
Developed, Medium Intensity-6.3 Developed, Open Space-47.9
0 OWS 0% levees
Floodway-45.1 Floodplain-76.6
Wetlands: none
Priority Habitats and Species: none Water Quality Listings: Category 5 for bacteria and dissolved oxygen
Current Land Use %: Agriculture classified under current
use chapter 84.34 RCW-90.59 Recreational activities-9.26
1 Data sources, assumptions, and limitations summarized in Appendix C.
