shoreline response to an offshore wave screen, blairgowrie
TRANSCRIPT
REEF JOURNAL
Vol. 1 No. 1 2009 Page 201
Shoreline Response to an Offshore Wave Screen, Blairgowrie Safe
Boat Harbour, Victoria, Australia
T.R. Atkins and R. Mocke
Maritime Group, Sinclair Knight Merz,
P.O. Box H615,
Perth 6001, Australia
ABSTRACT
A safe boating harbour was constructed in 2001 within Port Philip Bay, Victoria, Australia.
The harbour at Blairgowrie, south of Melbourne, was created by means of a precast concrete,
partial depth, wave screen designed to protect the boating pens from unacceptable wave
conditions during storm events. As predicted during the planning process, on completion of
the boat harbour a shoreline salient has developed. The salient accretion rate has since slowed
considerably, possibly returning the shoreline to new equilibrium condition. The focus of this
paper is on the boat harbour, construction of protective screening and the salient formation.
Finally, a comparison to the far more studied shoreline responses to natural and man made
reefs and breakwaters is also undertaken as part of this paper.
BACKGROUND
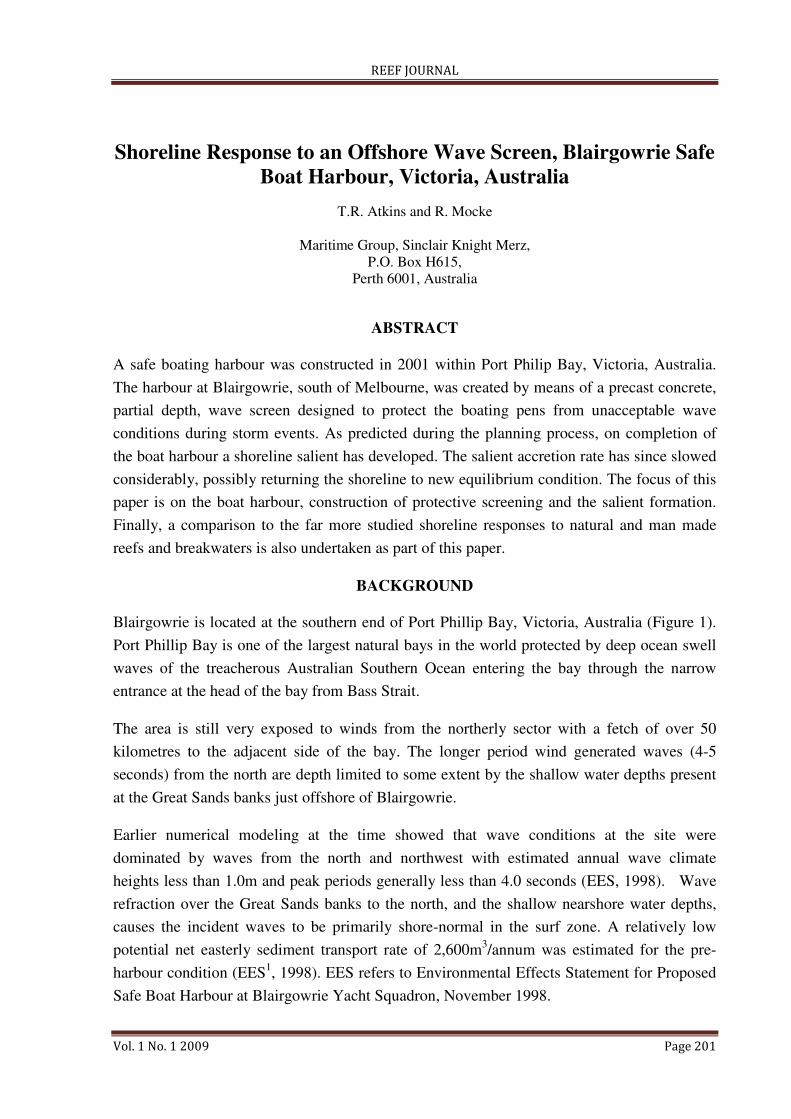
Blairgowrie is located at the southern end of Port Phillip Bay, Victoria, Australia (Figure 1).
Port Phillip Bay is one of the largest natural bays in the world protected by deep ocean swell
waves of the treacherous Australian Southern Ocean entering the bay through the narrow
entrance at the head of the bay from Bass Strait.
The area is still very exposed to winds from the northerly sector with a fetch of over 50
kilometres to the adjacent side of the bay. The longer period wind generated waves (4-5
seconds) from the north are depth limited to some extent by the shallow water depths present
at the Great Sands banks just offshore of Blairgowrie.
Earlier numerical modeling at the time showed that wave conditions at the site were
dominated by waves from the north and northwest with estimated annual wave climate
heights less than 1.0m and peak periods generally less than 4.0 seconds (EES, 1998). Wave
refraction over the Great Sands banks to the north, and the shallow nearshore water depths,
causes the incident waves to be primarily shore-normal in the surf zone. A relatively low
potential net easterly sediment transport rate of 2,600m3/annum was estimated for the pre-
harbour condition (EES1, 1998). EES refers to Environmental Effects Statement for Proposed
Safe Boat Harbour at Blairgowrie Yacht Squadron, November 1998.
REEF JOURNAL
Vol. 1 No. 1 2009 Page 202
Figure 1. Boat Harbour Location
No safe haven for boat moorings existed along this part of the coastline for at least 30km and
any severe weather conditions from the North would cause ongoing damage to moorings and
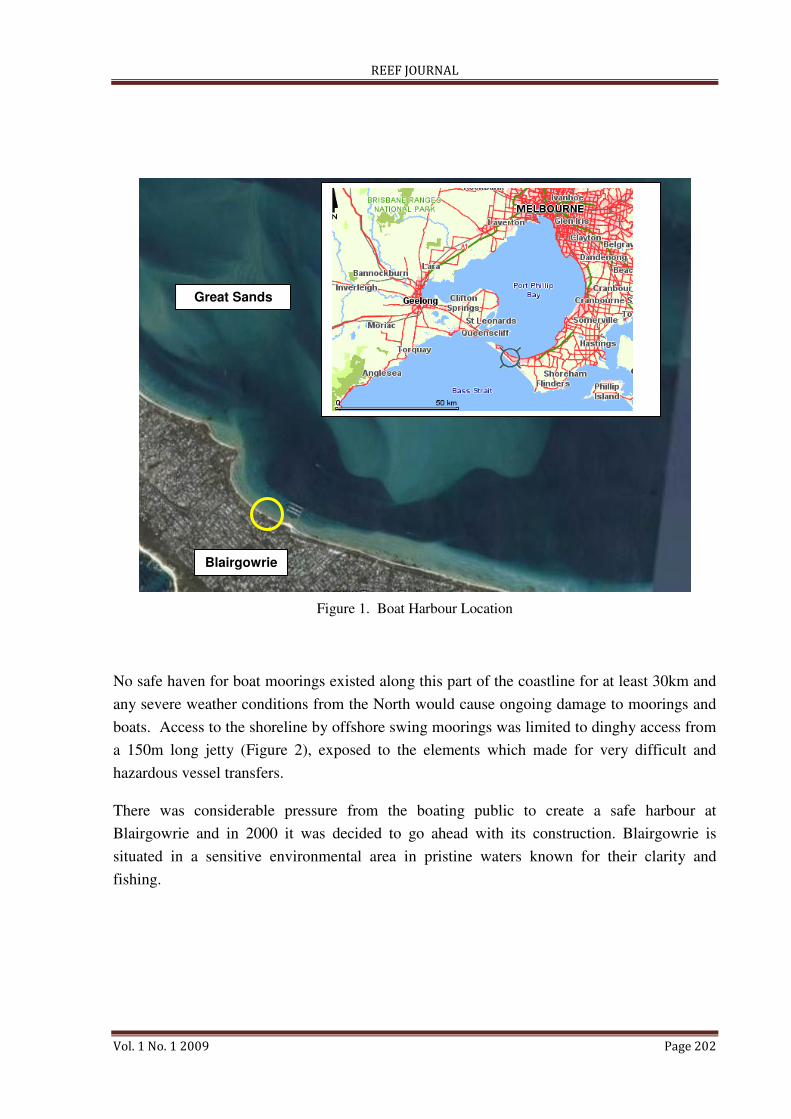
boats. Access to the shoreline by offshore swing moorings was limited to dinghy access from
a 150m long jetty (Figure 2), exposed to the elements which made for very difficult and
hazardous vessel transfers.
There was considerable pressure from the boating public to create a safe harbour at
Blairgowrie and in 2000 it was decided to go ahead with its construction. Blairgowrie is
situated in a sensitive environmental area in pristine waters known for their clarity and
fishing.
Blairgowrie
Great Sands
REEF JOURNAL
Vol. 1 No. 1 2009 Page 203
Figure 2. Blairgowrie, 1998, pre-harbour construction.
HARBOUR CONSTRUCTION
No capital dredging to create the harbour basin was permitted because of the environmental
sensitivity of the location and so the berths needed to be located offshore in naturally deeper
water. It was required that current flows and associated water quality also needed to be
maintained at the pre-harbour conditions, and this, combined with construction difficulties
associated with an offshore breakwater, meant that a rubble mound harbour was not possible
at this location.
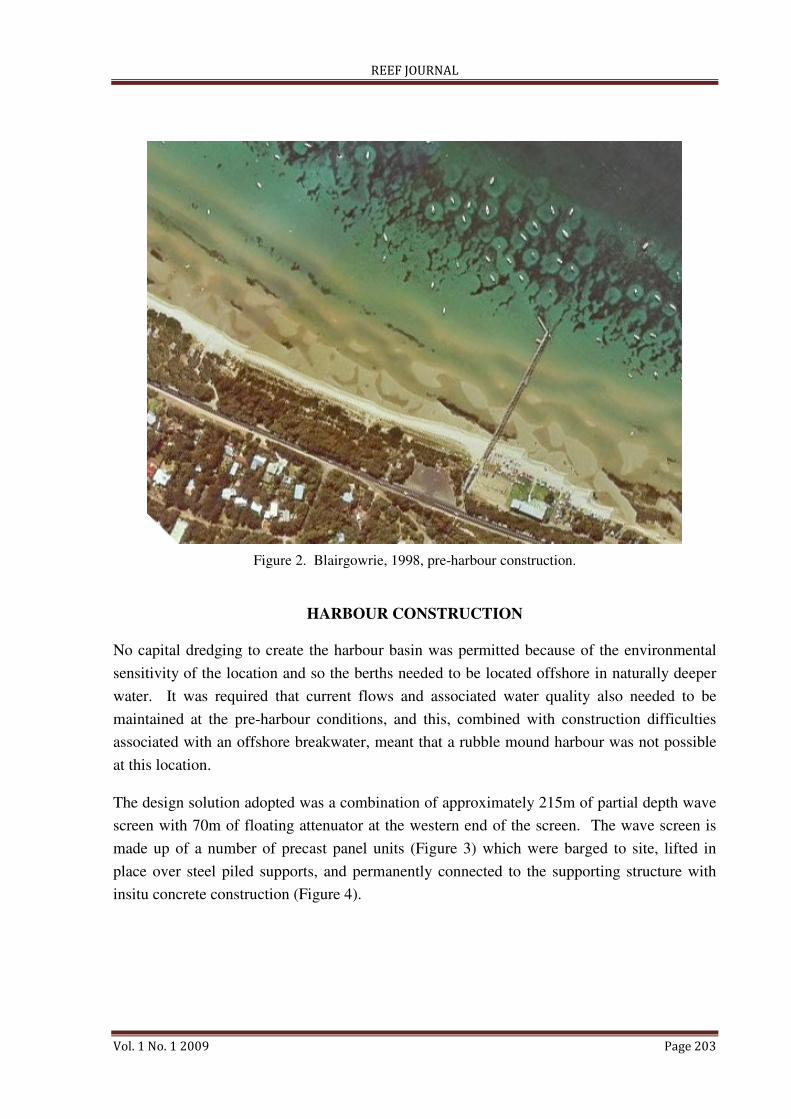
The design solution adopted was a combination of approximately 215m of partial depth wave
screen with 70m of floating attenuator at the western end of the screen. The wave screen is
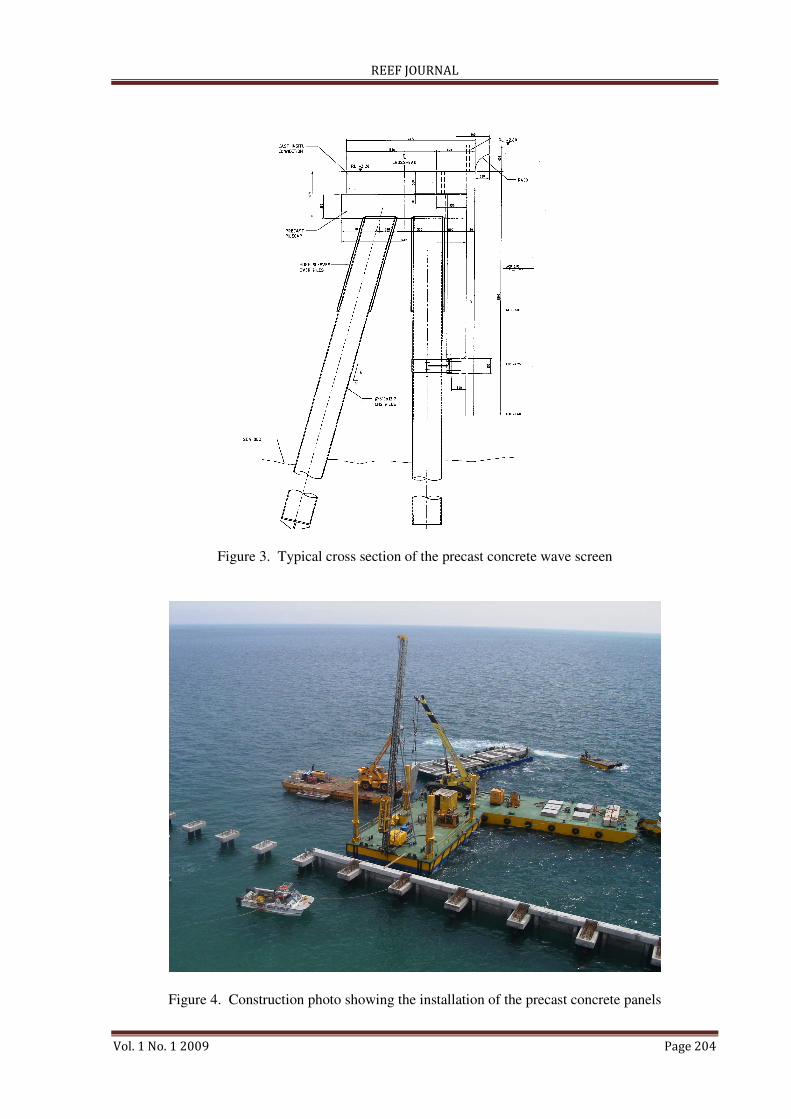
made up of a number of precast panel units (Figure 3) which were barged to site, lifted in
place over steel piled supports, and permanently connected to the supporting structure with
insitu concrete construction (Figure 4).
REEF JOURNAL
Vol. 1 No. 1 2009 Page 204
Figure 3. Typical cross section of the precast concrete wave screen
Figure 4. Construction photo showing the installation of the precast concrete panels
REEF JOURNAL
Vol. 1 No. 1 2009 Page 205
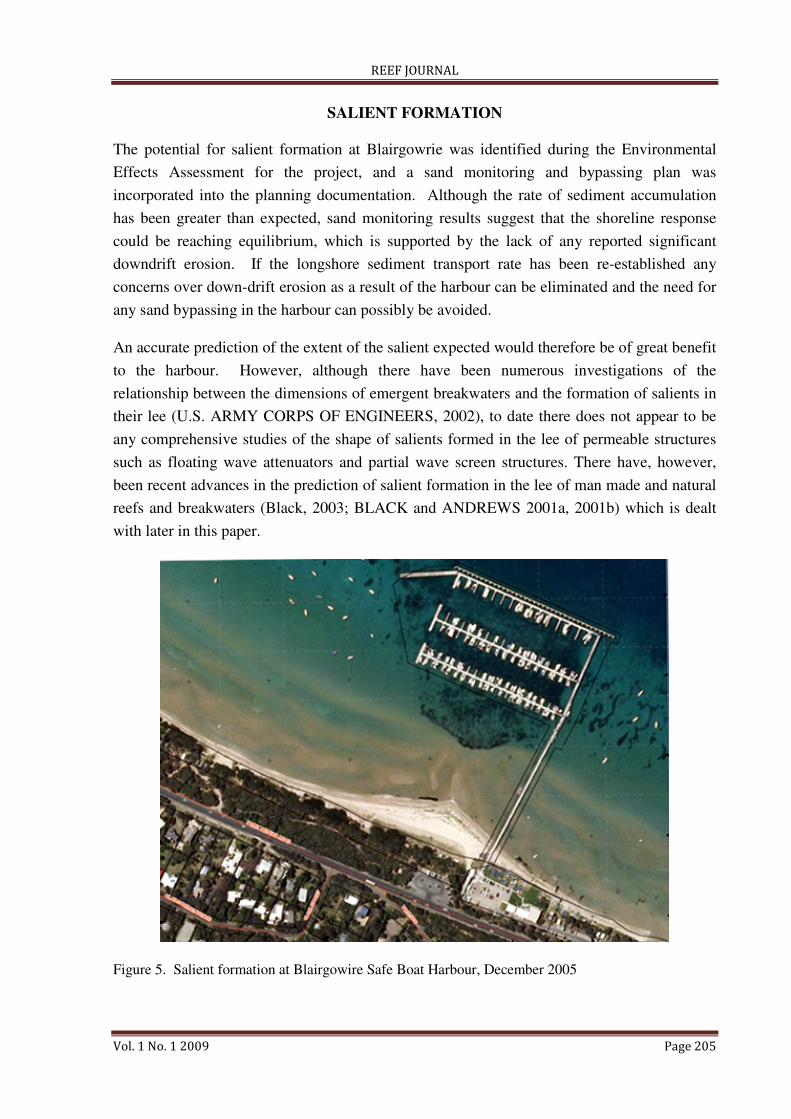
SALIENT FORMATION
The potential for salient formation at Blairgowrie was identified during the Environmental
Effects Assessment for the project, and a sand monitoring and bypassing plan was
incorporated into the planning documentation. Although the rate of sediment accumulation
has been greater than expected, sand monitoring results suggest that the shoreline response
could be reaching equilibrium, which is supported by the lack of any reported significant
downdrift erosion. If the longshore sediment transport rate has been re-established any
concerns over down-drift erosion as a result of the harbour can be eliminated and the need for
any sand bypassing in the harbour can possibly be avoided.
An accurate prediction of the extent of the salient expected would therefore be of great benefit
to the harbour. However, although there have been numerous investigations of the
relationship between the dimensions of emergent breakwaters and the formation of salients in
their lee (U.S. ARMY CORPS OF ENGINEERS, 2002), to date there does not appear to be
any comprehensive studies of the shape of salients formed in the lee of permeable structures
such as floating wave attenuators and partial wave screen structures. There have, however,
been recent advances in the prediction of salient formation in the lee of man made and natural
reefs and breakwaters (Black, 2003; BLACK and ANDREWS 2001a, 2001b) which is dealt
with later in this paper.
Figure 5. Salient formation at Blairgowire Safe Boat Harbour, December 2005
REEF JOURNAL
Vol. 1 No. 1 2009 Page 206
SHORELINE DATA ANALYSIS
Basic monitoring of sand movements at the site has been carried out twice-yearly since
October 1998, in line with the Sand Management Plan developed in response to planning
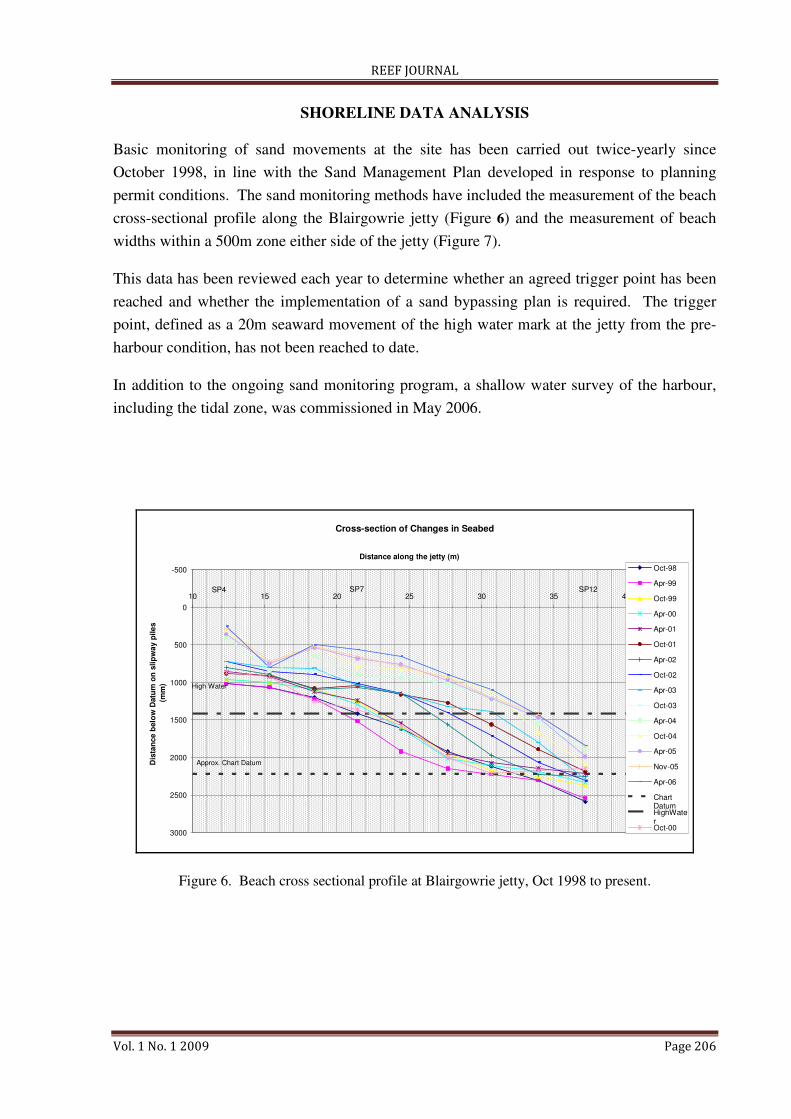
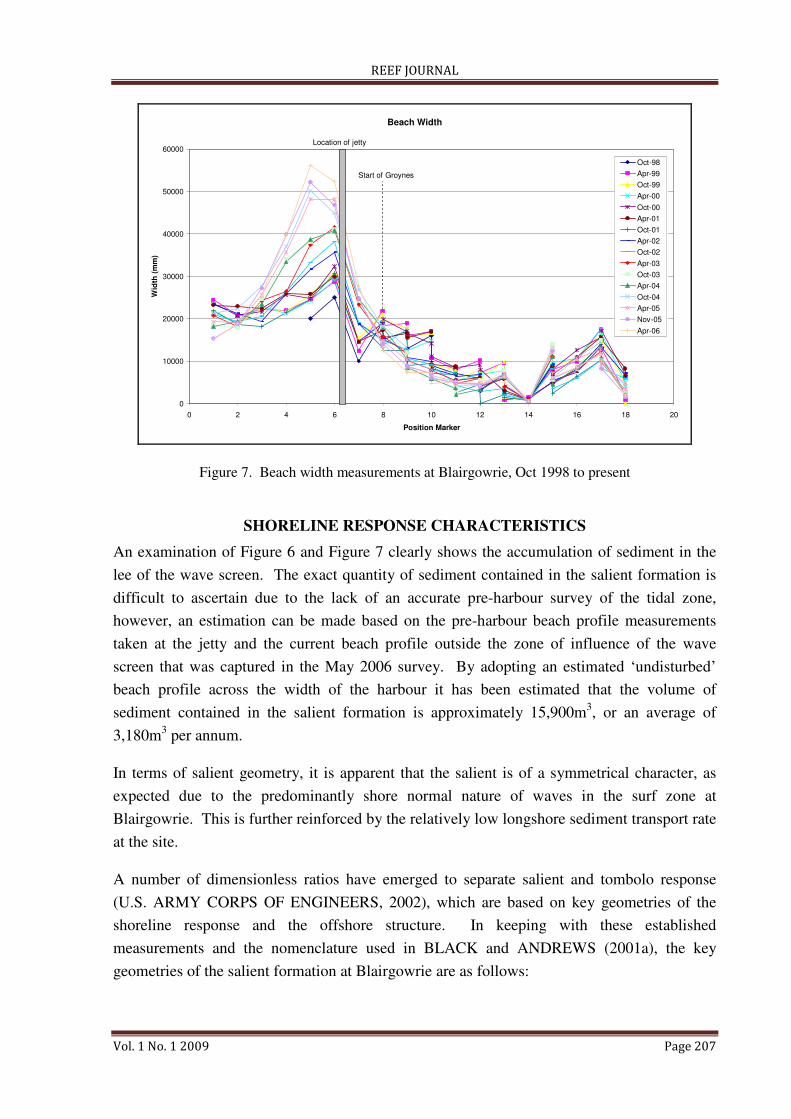
permit conditions. The sand monitoring methods have included the measurement of the beach
cross-sectional profile along the Blairgowrie jetty (Figure 6) and the measurement of beach
widths within a 500m zone either side of the jetty (Figure 7).
This data has been reviewed each year to determine whether an agreed trigger point has been
reached and whether the implementation of a sand bypassing plan is required. The trigger
point, defined as a 20m seaward movement of the high water mark at the jetty from the pre-
harbour condition, has not been reached to date.
In addition to the ongoing sand monitoring program, a shallow water survey of the harbour,
including the tidal zone, was commissioned in May 2006.
Cross-section of Changes in Seabed
-500
0
500
1000
1500
2000
2500
3000
10 15 20 25 30 35 40
Distance along the jetty (m)
Dis
tan
ce
belo
w D
atu
m o
n s
lip
wa
y p
ile
s
(m
m)
Oct-98
Apr-99
Oct-99
Apr-00
Apr-01
Oct-01
Apr-02
Oct-02
Apr-03
Oct-03
Apr-04
Oct-04
Apr-05
Nov-05
Apr-06
ChartDatumHighWaterOct-00
SP4 SP7 SP12
High Water
Approx. Chart Datum
Figure 6. Beach cross sectional profile at Blairgowrie jetty, Oct 1998 to present.
REEF JOURNAL
Vol. 1 No. 1 2009 Page 207
Beach Width
0
10000
20000
30000
40000
50000
60000
0 2 4 6 8 10 12 14 16 18 20
Position Marker
Wid
th (
mm
)Oct-98
Apr-99
Oct-99
Apr-00
Oct-00
Apr-01
Oct-01
Apr-02
Oct-02
Apr-03
Oct-03
Apr-04
Oct-04
Apr-05
Nov-05
Apr-06
Location of jetty
Start of Groynes
Figure 7. Beach width measurements at Blairgowrie, Oct 1998 to present
SHORELINE RESPONSE CHARACTERISTICS
An examination of Figure 6 and Figure 7 clearly shows the accumulation of sediment in the
lee of the wave screen. The exact quantity of sediment contained in the salient formation is
difficult to ascertain due to the lack of an accurate pre-harbour survey of the tidal zone,
however, an estimation can be made based on the pre-harbour beach profile measurements
taken at the jetty and the current beach profile outside the zone of influence of the wave
screen that was captured in the May 2006 survey. By adopting an estimated ‘undisturbed’
beach profile across the width of the harbour it has been estimated that the volume of
sediment contained in the salient formation is approximately 15,900m3, or an average of
3,180m3 per annum.
In terms of salient geometry, it is apparent that the salient is of a symmetrical character, as
expected due to the predominantly shore normal nature of waves in the surf zone at
Blairgowrie. This is further reinforced by the relatively low longshore sediment transport rate
at the site.
A number of dimensionless ratios have emerged to separate salient and tombolo response
(U.S. ARMY CORPS OF ENGINEERS, 2002), which are based on key geometries of the
shoreline response and the offshore structure. In keeping with these established
measurements and the nomenclature used in BLACK and ANDREWS (2001a), the key
geometries of the salient formation at Blairgowrie are as follows:
REEF JOURNAL
Vol. 1 No. 1 2009 Page 208
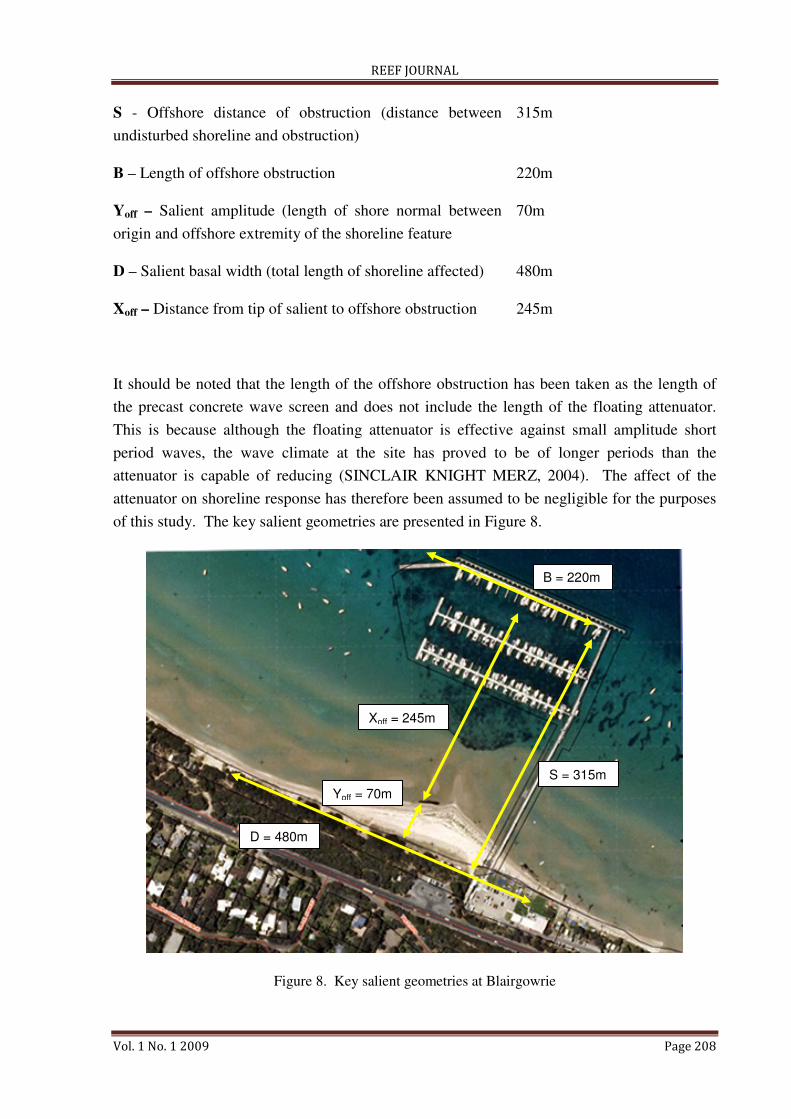
S - Offshore distance of obstruction (distance between
undisturbed shoreline and obstruction)
315m
B – Length of offshore obstruction 220m
Yoff – Salient amplitude (length of shore normal between
origin and offshore extremity of the shoreline feature
70m
D – Salient basal width (total length of shoreline affected) 480m
Xoff – Distance from tip of salient to offshore obstruction 245m
It should be noted that the length of the offshore obstruction has been taken as the length of
the precast concrete wave screen and does not include the length of the floating attenuator.
This is because although the floating attenuator is effective against small amplitude short
period waves, the wave climate at the site has proved to be of longer periods than the
attenuator is capable of reducing (SINCLAIR KNIGHT MERZ, 2004). The affect of the
attenuator on shoreline response has therefore been assumed to be negligible for the purposes
of this study. The key salient geometries are presented in Figure 8.
Figure 8. Key salient geometries at Blairgowrie
D = 480m
S = 315m
Yoff = 70m
Xoff = 245m
B = 220m
REEF JOURNAL
Vol. 1 No. 1 2009 Page 209
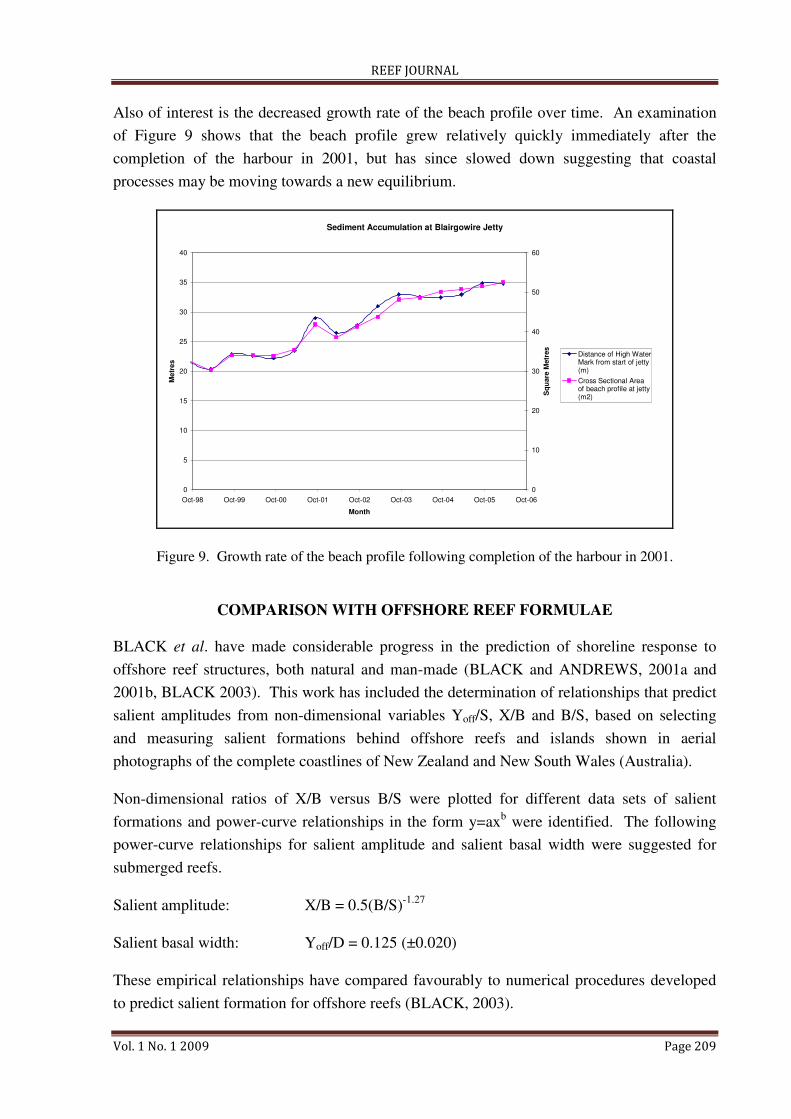
Also of interest is the decreased growth rate of the beach profile over time. An examination
of Figure 9 shows that the beach profile grew relatively quickly immediately after the
completion of the harbour in 2001, but has since slowed down suggesting that coastal
processes may be moving towards a new equilibrium.
Sediment Accumulation at Blairgowire Jetty
0
5
10
15
20
25
30
35
40
Oct-98 Oct-99 Oct-00 Oct-01 Oct-02 Oct-03 Oct-04 Oct-05 Oct-06
Month
Me
tre
s
0
10
20
30
40
50
60
Sq
uare
Metr
es
Distance of High WaterMark from start of jetty(m)
Cross Sectional Areaof beach profile at jetty(m2)
Figure 9. Growth rate of the beach profile following completion of the harbour in 2001.
COMPARISON WITH OFFSHORE REEF FORMULAE
BLACK et al. have made considerable progress in the prediction of shoreline response to
offshore reef structures, both natural and man-made (BLACK and ANDREWS, 2001a and
2001b, BLACK 2003). This work has included the determination of relationships that predict
salient amplitudes from non-dimensional variables Yoff/S, X/B and B/S, based on selecting
and measuring salient formations behind offshore reefs and islands shown in aerial
photographs of the complete coastlines of New Zealand and New South Wales (Australia).
Non-dimensional ratios of X/B versus B/S were plotted for different data sets of salient
formations and power-curve relationships in the form y=axb were identified. The following
power-curve relationships for salient amplitude and salient basal width were suggested for
submerged reefs.
Salient amplitude: X/B = 0.5(B/S)-1.27
Salient basal width: Yoff/D = 0.125 (±0.020)
These empirical relationships have compared favourably to numerical procedures developed
to predict salient formation for offshore reefs (BLACK, 2003).
REEF JOURNAL
Vol. 1 No. 1 2009 Page 210
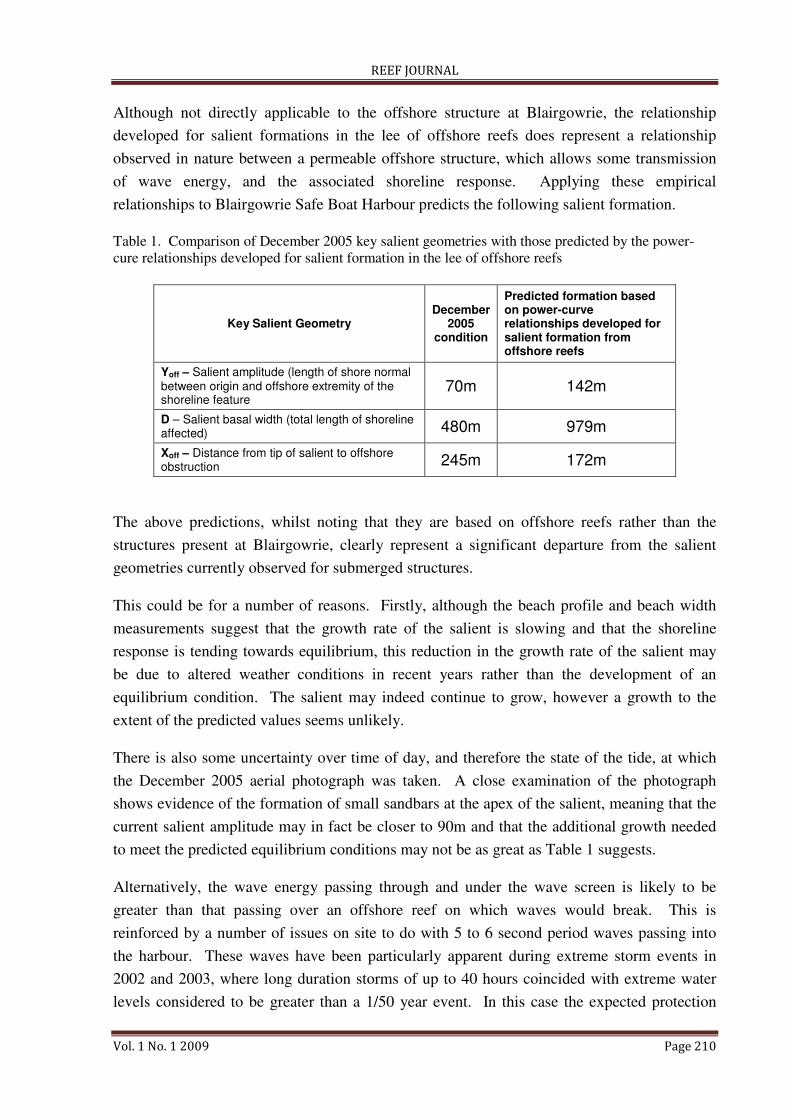
Although not directly applicable to the offshore structure at Blairgowrie, the relationship
developed for salient formations in the lee of offshore reefs does represent a relationship
observed in nature between a permeable offshore structure, which allows some transmission
of wave energy, and the associated shoreline response. Applying these empirical
relationships to Blairgowrie Safe Boat Harbour predicts the following salient formation.
Table 1. Comparison of December 2005 key salient geometries with those predicted by the power-
cure relationships developed for salient formation in the lee of offshore reefs
Key Salient Geometry December
2005 condition
Predicted formation based on power-curve relationships developed for salient formation from offshore reefs
Yoff – Salient amplitude (length of shore normal between origin and offshore extremity of the shoreline feature
70m 142m
D – Salient basal width (total length of shoreline affected) 480m 979m
Xoff – Distance from tip of salient to offshore obstruction 245m 172m
The above predictions, whilst noting that they are based on offshore reefs rather than the
structures present at Blairgowrie, clearly represent a significant departure from the salient
geometries currently observed for submerged structures.
This could be for a number of reasons. Firstly, although the beach profile and beach width
measurements suggest that the growth rate of the salient is slowing and that the shoreline
response is tending towards equilibrium, this reduction in the growth rate of the salient may
be due to altered weather conditions in recent years rather than the development of an
equilibrium condition. The salient may indeed continue to grow, however a growth to the
extent of the predicted values seems unlikely.
There is also some uncertainty over time of day, and therefore the state of the tide, at which
the December 2005 aerial photograph was taken. A close examination of the photograph
shows evidence of the formation of small sandbars at the apex of the salient, meaning that the
current salient amplitude may in fact be closer to 90m and that the additional growth needed
to meet the predicted equilibrium conditions may not be as great as Table 1 suggests.
Alternatively, the wave energy passing through and under the wave screen is likely to be
greater than that passing over an offshore reef on which waves would break. This is
reinforced by a number of issues on site to do with 5 to 6 second period waves passing into
the harbour. These waves have been particularly apparent during extreme storm events in
2002 and 2003, where long duration storms of up to 40 hours coincided with extreme water
levels considered to be greater than a 1/50 year event. In this case the expected protection
REEF JOURNAL
Vol. 1 No. 1 2009 Page 211
from relative long period waves by the shallow water of the Great Sands to the north did not
occur, resulting in some nominal damage to the floating pontoon system of the harbour.
Significant scour, somewhat more than predicted, under the wave screen has also been
observed following the completion of construction. This scour under the wave screen, and the
associated increase in long period waves in the harbour as a result, could go some way to
explaining the reduced salient growth rate.
CONCLUSIONS
This paper has compared the observations of salient formation in the lee of the precast
concrete partial depth wavescreen at Blairgowrie with predicted salient growth based on
power-curve relationships derived for salient formation in the lee of offshore reefs by BLACK
and ANDREWS (2001a). Based on this comparison, it appears that the protection offered by
partial depth wave screens, in terms of the transmission of energy into the lee of the structure,
will be less than the protection offered by offshore reefs, particularly shallow offshore reefs
where breaking waves occur. This has limited the amount of salient growth in the lee of the
structure in comparison to that observed for submerged reef structures.
ACKNOWLEDGEMENTS
The authors would like to acknowledge Blairgowrie Yacht Squadron for the use of
information and their permission to present this paper.
REFERENCES
BLACK, K. P., and ANDREWS, C., 2001a. Sandy Shoreline Response to Offshore Obstacles
Part 1: Salient and Tombolo Geometry and Shape. Journal of Coastal Research,
Special Issue 29: 82-93.
BLACK, K. P., and ANDREWS, C., 2001b. Sandy Shoreline Response to Offshore Obstacles
Part 2: Discussion of Formative Mechanisms. Journal of Coastal Research, Special
Issue 29: 94-101.
BLACK, K., 2003. Numerical Prediction of Salient Formation in the Lee of Offshore Reefs.
Proceedings of the 3rd
International Surfing Reef Symposium, Raglan, New Zealand,
June 22-25, 2003. p196-218.
U.S. ARMY CORPS OF ENGINEERS. 2002, Coastal Engineering Manual 1110-2-1100 Part
V Coastal Project Planning and Design, U.S. Army Corps of Engineers, Washington,
D.C. (in 6 volumes).
SINCLAIR KNIGHT MERZ, 2004, Blairgowrie Yacht Squadron – Review of Harbour
Performance.