shorezone summary report - kodiak 2002, 2005€¢ linking habitat use and life-history strategy of...
TRANSCRIPT
SHOREZONE Coastal Habitat Mapping
Data Summary Report
Kodiak Archipelago
September 2007

CORI Project: 06-21 28 September 2007
ShoreZone Mapping Data Summary Kodiak Island
(2002 and 2005 Imagery)
Prepared by:
Coastal & Ocean Resources Inc. Sidney, British Columbia
and Archipelago Marine Research Ltd.
Victoria, British Columbia
Prepared for:
Cook Inlet Regional Citizens’ Advisory Council Kenai, Alaska
COASTAL & OCEAN RESOURCES INC 214 – 9865 W. Saanich Rd., Sidney BC
V8M 5Y8 Canada (250) 655-4035
www.coastalandoceans.com
ARCHIPELAGO MARINE RESEARCH LTD 525 Head Street, Victoria BC
V9A 5S1 Canada (250) 383-4535
www.archipelago.ca

i
TABLE OF CONTENTS Preface: Table of Contents, List of Tables, List of Figures 1 INTRODUCTION 1.1 ShoreZone Coastal Habitat Mapping 1.2 ShoreZone Coastal Habitat Mapping in the Kodiak Archipelago 2 PHYSICAL SHOREZONE DATA SUMMARY 2.1 Shore Types 2.2 Physical Wave Exposure 2.3 Anthropogenic Shore Modifications 2.4 Oil Residence Index 2.5 Physical Illustrations: Shore Types and Geomorphic Features
Shore Type: Rock (BC Classes 1-5) Shore Type: Rock and Sediment (BC Classes 6-20) Shore Type: Sediment (BC Classes 21-30) Shore Type: Organic Shorelines, Marshes, and Estuaries (BC Class 31) Shore Type: Human-Altered Shorelines (BC Classes 32-33) Shore Type: Current-Dominated Channels (BC Class 34) Shore Type: Glaciers (BC Class 35) Geomorphic Features: Deltas, Mudflats, and Tidal Flats Geomorphic Features: Lagoons Anthropogenic Features: Coastal Structures and Seawalls Other Interesting Features: Fish Traps and Drowned Forests
3 BIOLOGICAL SHOREZONE DATA SUMMARY 3.1 BioBands 3.2 Biological Wave Exposure 3.3 Habitat Class APPENDIX A: DATA DICTIONARIES
ii
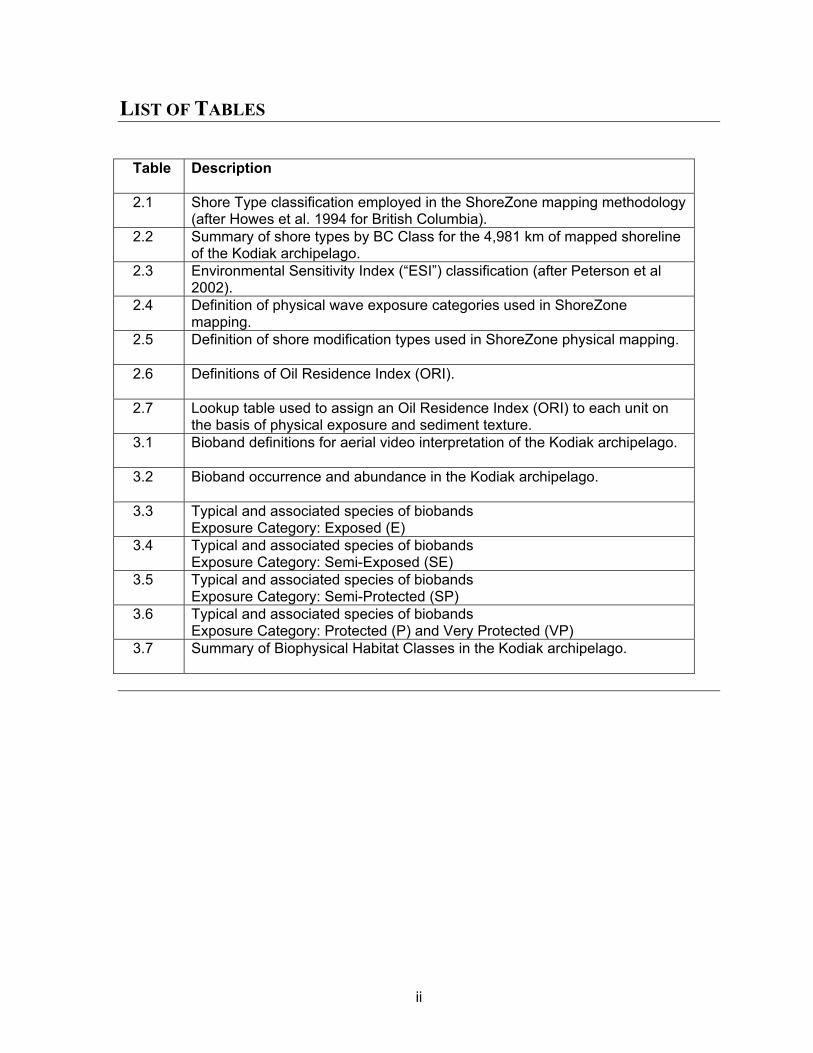
LIST OF TABLES
Table
Description
2.1 Shore Type classification employed in the ShoreZone mapping methodology (after Howes et al. 1994 for British Columbia).
2.2 Summary of shore types by BC Class for the 4,981 km of mapped shoreline of the Kodiak archipelago.
2.3 Environmental Sensitivity Index (“ESI”) classification (after Peterson et al 2002).
2.4 Definition of physical wave exposure categories used in ShoreZone mapping.
2.5 Definition of shore modification types used in ShoreZone physical mapping.
2.6 Definitions of Oil Residence Index (ORI).
2.7 Lookup table used to assign an Oil Residence Index (ORI) to each unit on the basis of physical exposure and sediment texture.
3.1 Bioband definitions for aerial video interpretation of the Kodiak archipelago.
3.2 Bioband occurrence and abundance in the Kodiak archipelago.
3.3 Typical and associated species of biobands Exposure Category: Exposed (E)
3.4 Typical and associated species of biobands Exposure Category: Semi-Exposed (SE)
3.5 Typical and associated species of biobands Exposure Category: Semi-Protected (SP)
3.6 Typical and associated species of biobands Exposure Category: Protected (P) and Very Protected (VP)
3.7 Summary of Biophysical Habitat Classes in the Kodiak archipelago.

iii
LIST OF TABLES IN APPENDIX
Table
Description
A-1 Data dictionary for UNIT table
A-2 Classification of shore types employed in ShoreZone mapping in Alaska (derived from the Howes et al. [1994] “BC Class” system in British Columbia)
A-3 Environmental Sensitivity Index (ESI) Shore Type classification (after Peterson et al 2002)
A-4 Exposure matrix used for estimating observed physical exposure (EXP_OBS)
A-5 Oil Residence Index definition and component look-up matrix
A-6 Look-up table of calculated ORI defined by shore type and exposure
A-7 Data dictionary for BIOUNIT table
A-8 Habitat Class Codes
A-9 Habitat Class Definitions (shaded boxes in the Habitat Class matrix are ‘Not Applicable’ in most regions)
A-10 Data dictionary for across-shore component table (XSHR) (after Howes et al. 1994)
A-11 ‘Form’ Code Dictionary (after Howes et al. 1994)
A-12 ‘Material’ Code Dictionary (after Howes et al. 1994)
A-13 Data dictionary for the BIOBAND table
A-14 Data dictionary for the BIOSLIDE table
A-15 Data dictionary for the GroundStationNumber table
iv
LIST OF FIGURES Figure
Description
1.1 Extent of ShoreZone imagery and coastal habitat mapping in the State of Alaska.
1.2 Schematic to illustrate how digital shorelines are segmented into alongshore units and across-shore components in the ShoreZone mapping system.
1.3 Shoreline of the Kodiak Archipelago mapped using the ShoreZone technique (4,981 km).
2.1 Abundance of principal substrate types (on the basis of grouped BC Classes) in the Kodiak archipelago. Photographic illustrations of shore types are provided in Section 2.5.
2.2 Geomorphology and sediment texture of mixed rock and sediment shorelines (BC classes 6-20) in the Kodiak archipelago.
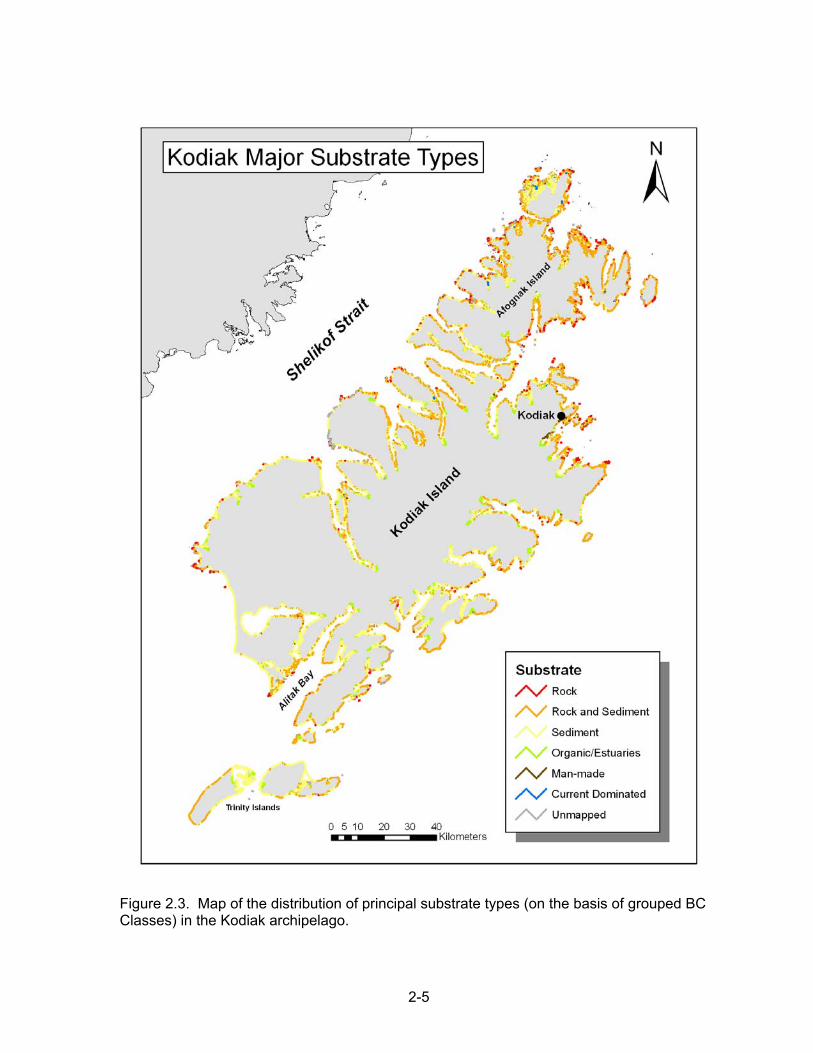
2.3 Map of the distribution of principal substrate types (on the basis of grouped BC Classes) in the Kodiak archipelago.
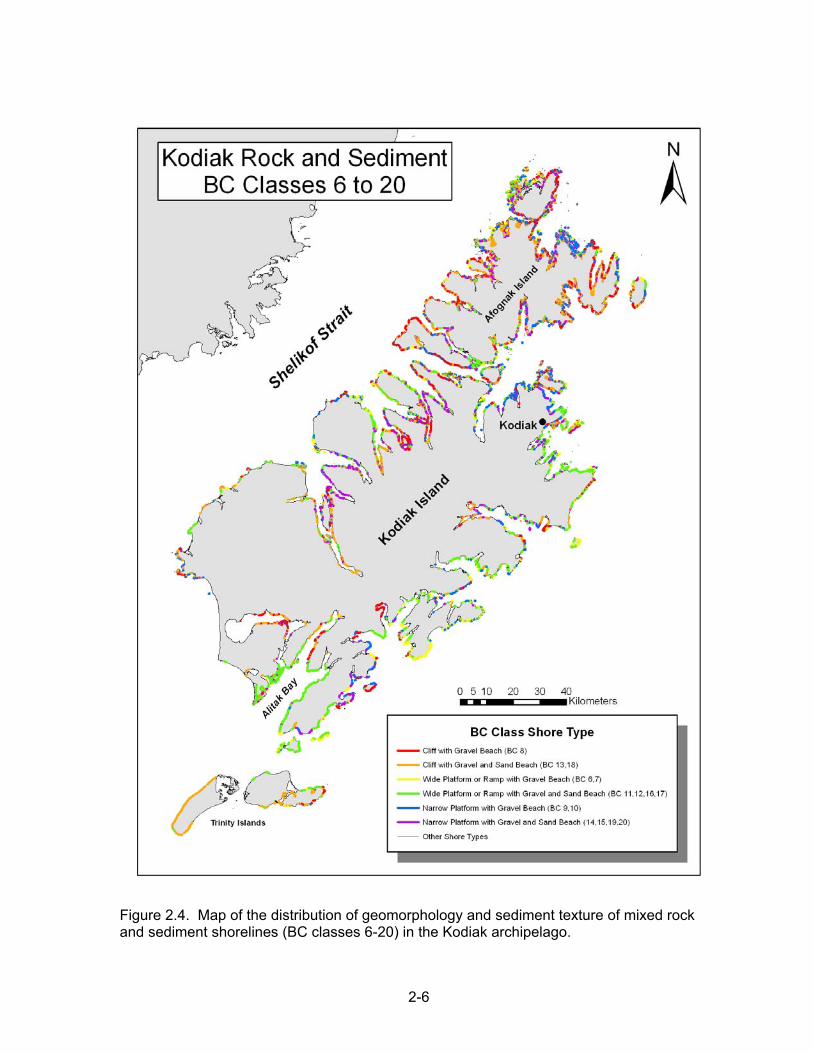
2.4 Map of the distribution of geomorphology and sediment texture of mixed rock and sediment shorelines (BC classes 6-20) in the Kodiak archipelago.
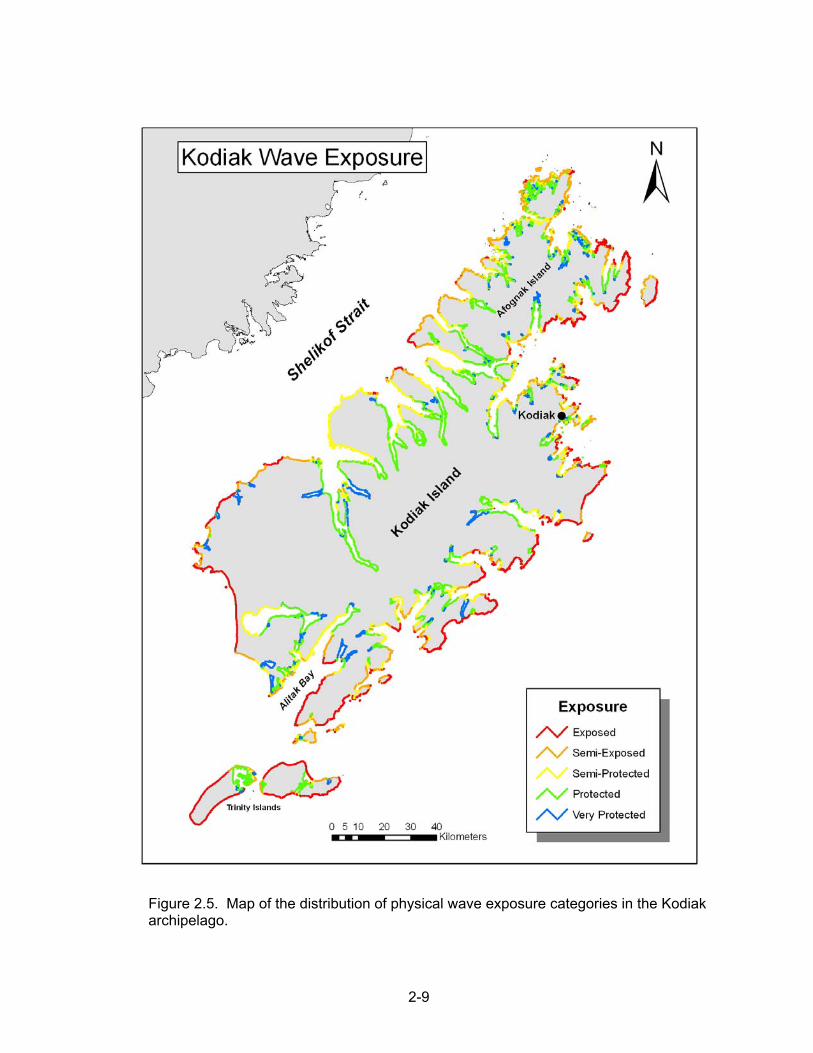
2.5 Map of the distribution of physical wave exposure categories in the Kodiak archipelago.
2.6 Distribution of units with more than 50% human-altered shoreline features in mapped areas of the Kodiak archipelago.
2.7 Map of the distribution of units an Oil Residence Index (ORI) of 5, where persistence of oil on the shoreline is estimated to be months to years.
Section 2.5
Physical Illustrations (full captions not provided here) Shore Type: Rock (BC Classes 1-5) Shore Type: Rock and Sediment (BC Classes 6-20) Shore Type: Sediment (BC Classes 21-30) Shore Type: Organic Shorelines, Marshes, and Estuaries (BC Class 31) Shore Type: Human-Altered Shorelines (BC Classes 32-33) Shore Type: Current-Dominated Channels (BC Class 34) Geomorphic Features: Deltas, Mudflats, and Tidal Flats Geomorphic Features: Lagoons Anthropogenic Features: Coastal Structures and Seawalls Other Interesting Features: Fish Traps and Drowned Forests
3.1
Alongshore biobands of color and texture formed by biological assemblages of species in the intertidal zone. Shown is a steep, rocky shoreline in a semi-exposed area of Deadman Bay, Kodiak Island. (Photo: KDKavi05_06780.jpg)
3.2
Occurrence of biobands in the Kodiak archipelago as a percentage of mapped shoreline length (4,981 km).
3.3
Distribution of Saltmarsh Biobands at the northern end of the Kodiak archipelago.
3.4
Distribution of Saltmarsh Biobands at the southern end of the Kodiak archipelago.
v
LIST OF FIGURES (CONTINUED) Figure
Description
3.5
Distribution of Lower Intertidal Biobands at the northern end of the Kodiak archipelago.
3.6
Distribution of Lower Intertidal Biobands at the southern end of the Kodiak archipelago.
3.7
Distribution of Seagrass Biobands at the northern end of the Kodiak archipelago.
3.8
Distribution of Seagrass Biobands at the southern end of the Kodiak archipelago.
3.9
Distribution of Canopy Kelp Biobands at the northern end of the Kodiak archipelago.
3.10
Distribution of Canopy Kelp Biobands at the southern end of the Kodiak archipelago.
3.11
Exposed bedrock shoreline on Bear Island. The biobands visible here are the Splashzone (VER), Barnacle (BAR), Blue Mussel (BMU), Red Algae (RED) and Bull Kelp (NER). This assemblage of biobands is typical of high exposures, especially in the Shelikof Strait bioarea; Stalked Dark Brown Kelps are not typically seen in this bioarea although they are an indicator band for Exposed areas in the Kodiak Island bioarea on the Gulf of Alaska side of the Kodiak archipelago. (Photo: KDKavi05_4824.jpg)
3.12
Semi-Exposed bedrock cliffs at Kiliuda Bay, Kodiak Island show a typical medium Splash Zone of black Verrucaria and distinct bands of mid-intertidal Barnacle (BAR) and Blue Mussel (BMU). Red Algae (RED) and Stalked Dark Brown Kelps (CHB) occur in the lower intertidal. A few Nereocystis plants occur offshore (patchy NER band). (Photo: KDKavi_10660.jpg)
3.13
Golden brown Fucus (Rockweed band (FUC)) mixed with Barnacle (BAR), Bleached Red Algae (HAL), Blue Mussel (BMU) and Soft Brown Kelps (SBR), blankets this platform in Deadman Bay on Moser Peninsula showing a typical lush Semi-Protected area. (Photo: KDKavi05_06591.jpg)
3.14
The combination of a lush eelgrass bed (ZOS band) with Green Algae (ULV) and Rockweed (FUC) bands and patchy fringing Dune Grass (GRA band) in Sitkalidak Strait, Kodiak Island indicates a typical low energy Protected biological wave exposure. (Photo: KDKavi05_10235.jpg)
3.15
Distribution of Biological Wave Exposure categories in the Kodiak archipelago.
3.16
Example of the immobile, semi-exposed habitat class on Bear Island. The bedrock cliff has a dense cover of biobands, including: Barnacles, Blue Mussel, Red Algae, and Alaria. (Photo: KDKavi05_4823.jpg)
3.17
Partially mobile, semi-exposed shoreline in Uyak Bay, showing dense cover of biota on the stable bedrock platform, with bare, mobile sediment on adjacent beaches. (Photo: KDKavi05_4603.jpg)
3.18
Mobile, semi-exposed beach in Zachar Bay, bare of attached biota. (Photo: KDKavi05_4080.jpg)

vi
LIST OF FIGURES (CONTINUED) Figure
Description
3.19
Estuary habitat class in Portage Bay. Wetland grasses cover a large area in the supratidal, while the delta fan has a sparse cover of Fucus (rockweed) and Zostera (eelgrass) biobands. (Photo: KDKavi05_06914.jpg)
3.20
Current-dominated channel habitat connects a ponded high-tide lagoon to Uyak Bay. (Photo: KDKavi05_4701.jpg)
3.21
Marina and modified shoreline at Old Harbor, an example of anthropogenic habitat classes. (Photo: KDKavi05_09115.jpg)
3.22 Backshore brackish lagoon in Uyak Bay, an example of a shore unit where the lagoon secondary habitat class was mapped. (Photo: KDKavi05_4014.jpg)
3.23 Distribution of Habitat Class categories at the northern end of the Kodiak archipelago.
3.24 Distribution of Habitat Class categories at the southern end of the Kodiak archipelago.
1-1
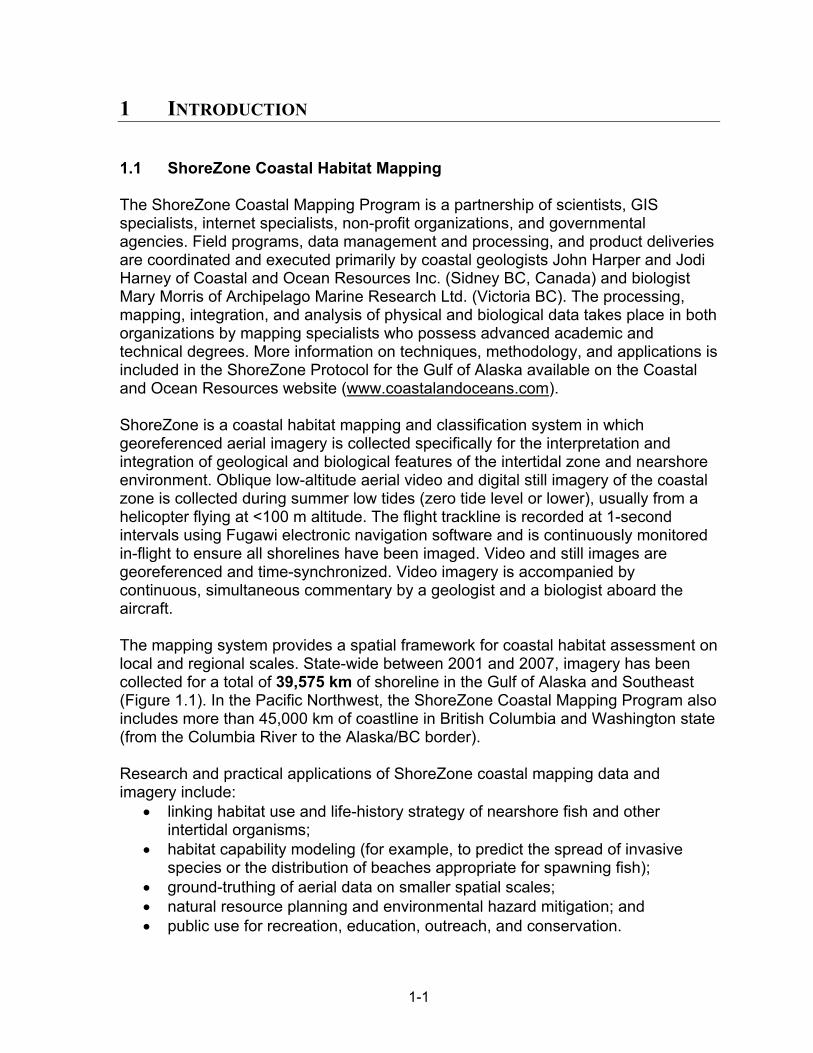
1 INTRODUCTION 1.1 ShoreZone Coastal Habitat Mapping The ShoreZone Coastal Mapping Program is a partnership of scientists, GIS specialists, internet specialists, non-profit organizations, and governmental agencies. Field programs, data management and processing, and product deliveries are coordinated and executed primarily by coastal geologists John Harper and Jodi Harney of Coastal and Ocean Resources Inc. (Sidney BC, Canada) and biologist Mary Morris of Archipelago Marine Research Ltd. (Victoria BC). The processing, mapping, integration, and analysis of physical and biological data takes place in both organizations by mapping specialists who possess advanced academic and technical degrees. More information on techniques, methodology, and applications is included in the ShoreZone Protocol for the Gulf of Alaska available on the Coastal and Ocean Resources website (www.coastalandoceans.com). ShoreZone is a coastal habitat mapping and classification system in which georeferenced aerial imagery is collected specifically for the interpretation and integration of geological and biological features of the intertidal zone and nearshore environment. Oblique low-altitude aerial video and digital still imagery of the coastal zone is collected during summer low tides (zero tide level or lower), usually from a helicopter flying at <100 m altitude. The flight trackline is recorded at 1-second intervals using Fugawi electronic navigation software and is continuously monitored in-flight to ensure all shorelines have been imaged. Video and still images are georeferenced and time-synchronized. Video imagery is accompanied by continuous, simultaneous commentary by a geologist and a biologist aboard the aircraft. The mapping system provides a spatial framework for coastal habitat assessment on local and regional scales. State-wide between 2001 and 2007, imagery has been collected for a total of 39,575 km of shoreline in the Gulf of Alaska and Southeast (Figure 1.1). In the Pacific Northwest, the ShoreZone Coastal Mapping Program also includes more than 45,000 km of coastline in British Columbia and Washington state (from the Columbia River to the Alaska/BC border). Research and practical applications of ShoreZone coastal mapping data and imagery include:
• linking habitat use and life-history strategy of nearshore fish and other intertidal organisms;
• habitat capability modeling (for example, to predict the spread of invasive species or the distribution of beaches appropriate for spawning fish);
• ground-truthing of aerial data on smaller spatial scales; • natural resource planning and environmental hazard mitigation; and • public use for recreation, education, outreach, and conservation.

1-2
1000 0 1000 2000 Kilometers
N
EW
S
ShoreZone Alaska
State of AlaskaImagery collected in 2006; mapping in progress (7,530 km)
Imaging and mapping complete (~20,643 km)Imagery collected in 2007; mapping in progress (11,452 km)
Map date: 09/07
Figure 1.1. Extent of ShoreZone imagery (39,625 km) and coastal habitat mapping in the State of Alaska.
1-3
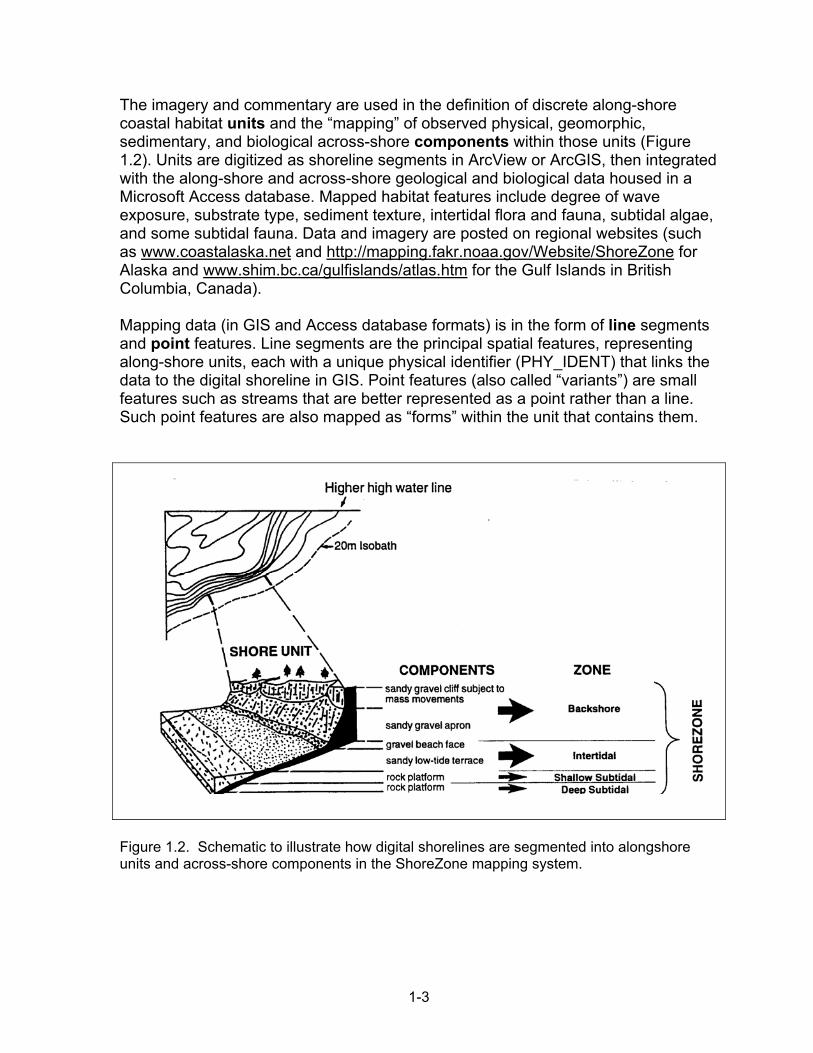
The imagery and commentary are used in the definition of discrete along-shore coastal habitat units and the “mapping” of observed physical, geomorphic, sedimentary, and biological across-shore components within those units (Figure 1.2). Units are digitized as shoreline segments in ArcView or ArcGIS, then integrated with the along-shore and across-shore geological and biological data housed in a Microsoft Access database. Mapped habitat features include degree of wave exposure, substrate type, sediment texture, intertidal flora and fauna, subtidal algae, and some subtidal fauna. Data and imagery are posted on regional websites (such as www.coastalaska.net and http://mapping.fakr.noaa.gov/Website/ShoreZone for Alaska and www.shim.bc.ca/gulfislands/atlas.htm for the Gulf Islands in British Columbia, Canada). Mapping data (in GIS and Access database formats) is in the form of line segments and point features. Line segments are the principal spatial features, representing along-shore units, each with a unique physical identifier (PHY_IDENT) that links the data to the digital shoreline in GIS. Point features (also called “variants”) are small features such as streams that are better represented as a point rather than a line. Such point features are also mapped as “forms” within the unit that contains them.
Figure 1.2. Schematic to illustrate how digital shorelines are segmented into alongshore units and across-shore components in the ShoreZone mapping system.
1-4
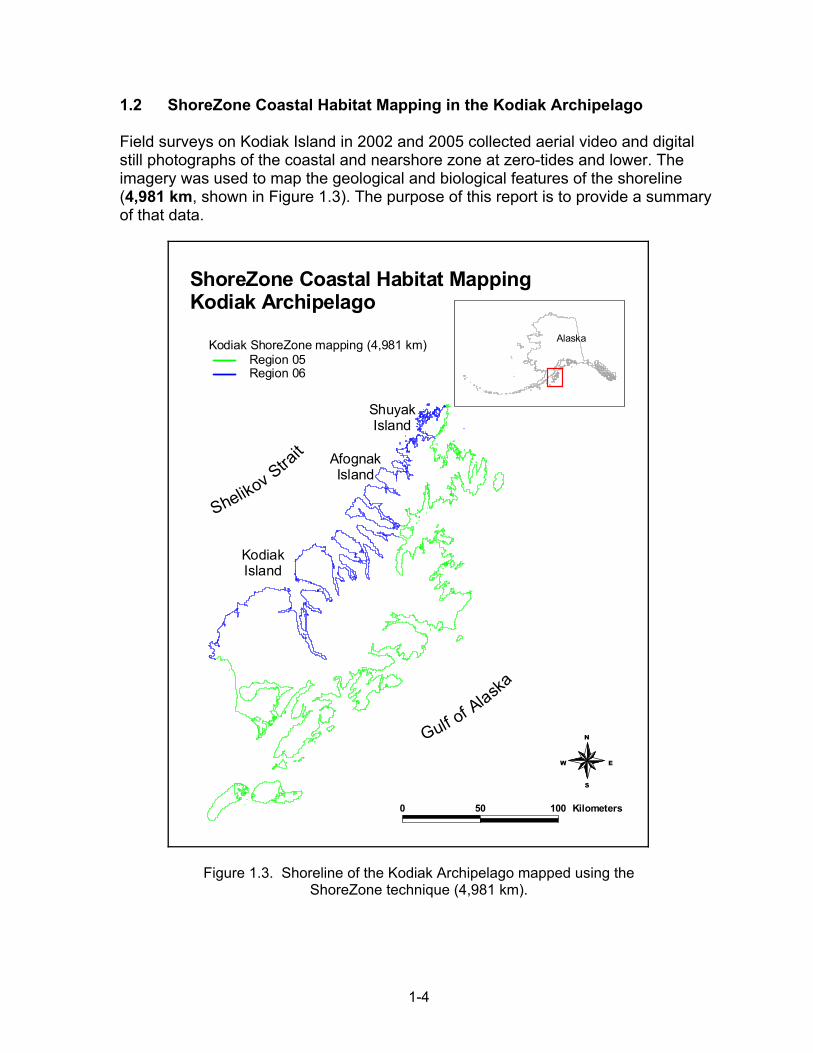
1.2 ShoreZone Coastal Habitat Mapping in the Kodiak Archipelago Field surveys on Kodiak Island in 2002 and 2005 collected aerial video and digital still photographs of the coastal and nearshore zone at zero-tides and lower. The imagery was used to map the geological and biological features of the shoreline (4,981 km, shown in Figure 1.3). The purpose of this report is to provide a summary of that data.
Kodiak ShoreZone mapping (4,981 km)Region 05Region 06
Alaska
Shelikov Strait
Gulf of A
laska
KodiakIsland
AfognakIsland
ShuyakIsland
N
EW
S
0 50 100 Kilometers
ShoreZone Coastal Habitat MappingKodiak Archipelago
Figure 1.3. Shoreline of the Kodiak Archipelago mapped using the ShoreZone technique (4,981 km).

2-1
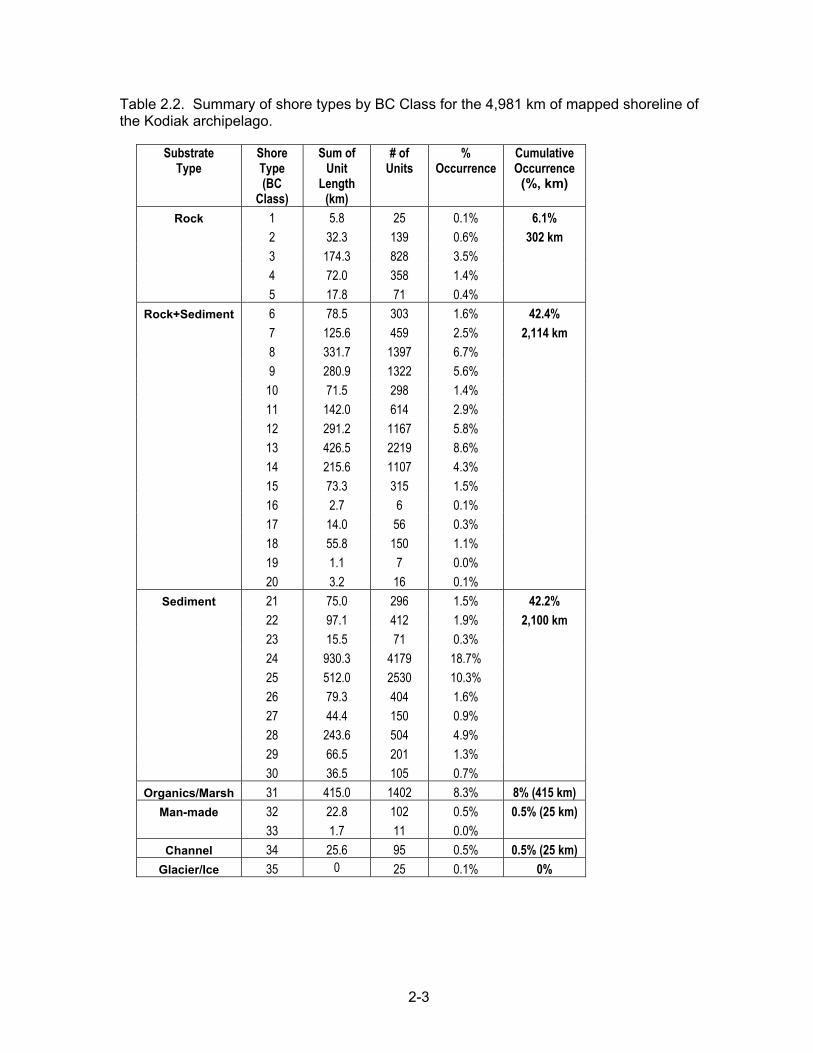
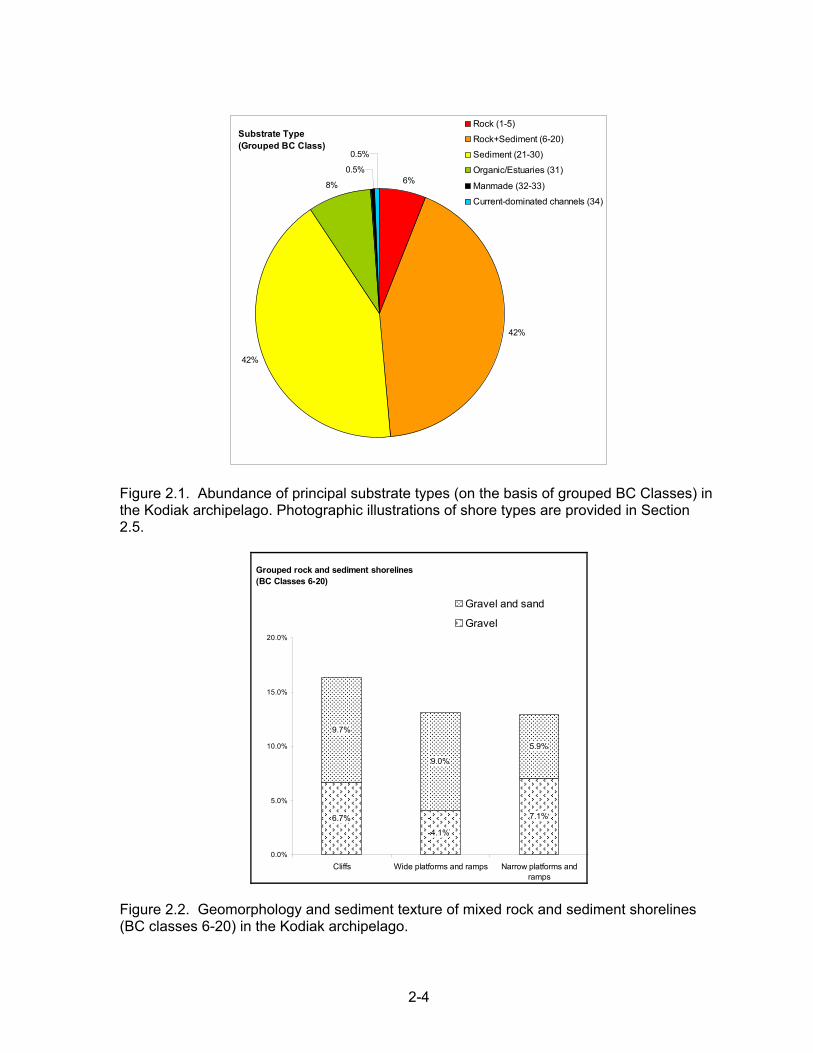
2 PHYSICAL SHOREZONE DATA SUMMARY 2.1 Shore Types The principal characteristics of each along-shore segment are used to assign an overall unit classification or “shore type” that represents the unit as a whole. ShoreZone mapping employs two unit classification systems: coastal shore types defined for British Columbia (“BC Class”) and the “Environmental Sensitivity Index” (ESI) class developed for oil-spill mitigation. The BC Class system is used to describe alongshore coastal units as one of 34 shore types defined on the basis of the principal geomorphic features, substrates, sediment textures, across-shore width, and slope of that section of coastline (Table 2.1; Howes et al. 1994). Coastal classes also characterize units dominated by: organic shorelines such as marshes and estuaries (BC Class 31), man-made features (BC Classes 32 and 33), high-current channels (BC Class 34), and glaciers (BC Class 35). The distribution of BC shore types in the Kodiak Archipelago is shown in Figures 2.1 and 2.3. Glacial shorelines are absent. Mixed rock and sediment shorelines (BC Classes 6-20) comprise 42% of the coastal environment. These shore types are further distinguished on the basic of geomorphology and sediment texture, shown in Figures 2.2 and 2.3). Wide rock ramps and platforms are typical of more exposed areas, while cliffs with pocket beaches and talus slopes are more widely-distributed. The NOAA Environmental Sensitivity Index (ESI) is a shoreline classification system developed in the mid-1970s to categorize coastal regions on the basis of their oil-spill sensitivity. The ESI system uses wave exposure and principal substrate type to assign alongshore coastal units a ranking of 1-10 to indicate the relative degree of sensitivity to oil spills (1=least sensitive, 10=most sensitive). In addition to the relative rank, each unit is also assigned one of 27 possible shore type classes (Table 2.3; Peterson et al. 2002). The ESI system has been used to map most of the coastline in the U.S., including Alaska, and is an integral component of oil-spill contingency planning, emergency response, and coastal resource management.

2-2
Table 2.1. Shore Type classification employed in the ShoreZone mapping methodology (after Howes et al. 1994 for British Columbia).
SUBSTRATE SEDIMENT WIDTH SLOPE COASTAL CLASS NO. STEEP (>20°) n/a WIDE (>30 m) INCLINED (5-20°) Rock Ramp, wide 1
ROCK N/A FLAT (<5°) Rock Platform, wide 2 STEEP (>20°) Rock Cliff 3 NARROW (<30 m) INCLINED (5-20°) Rock Ramp, narrow 4 FLAT(<5°) Rock Platform, narrow 5 STEEP (>20°) n/a WIDE (>30 m) INCLINED (5-20°) Ramp with gravel beach, wide 6 GRAVEL FLAT (<5°) Platform with gravel beach, wide 7 STEEP (>20°) Cliff with gravel beach 8 NARROW (<30 m) INCLINED (5-20°) Ramp with gravel beach 9 FLAT (<5°) Platform with gravel beach 10 STEEP (>20°) n/a WIDE (>30 m) INCLINED (5-20°) Ramp w gravel & sand beach, wide 11
ROCK & SAND & FLAT (<5°) Platform with G&S beach, wide 12 SEDIMENT GRAVEL STEEP (>20°) Cliff with gravel/sand beach 13
NARROW (<30 m) INCLINED (5-20°) Ramp with gravel/sand beach 14 FLAT (<5°) Platform with gravel/sand beach 15 STEEP (>20°) n/a WIDE (>30 m) INCLINED (5-20°) Ramp with sand beach, wide 16 SAND FLAT (<5°) Platform with sand beach, wide 17 STEEP (>20°) Cliff with sand beach 18 NARROW (<30 m) INCLINED (5-20°) Ramp with sand beach, narrow 19 FLAT (<5°) Platform with sand beach, narrow 20 WIDE (>30 m) FLAT (<5°) Gravel flat, wide 21 GRAVEL STEEP (>20°) n/a NARROW (<30 m) INCLINED (5-20°) Gravel beach, narrow 22 FLAT (<5°) Gravel flat or fan 23 STEEP (>20°) n/a SAND WIDE (>30 m) INCLINED (5-20°) n/a & FLAT (<5°) Sand & gravel flat or fan 24
SEDIMENT GRAVEL STEEP >20°) n/a NARROW (<30 m) INCLINED (5-20°) Sand & gravel beach, narrow 25 FLAT (<5°) Sand & gravel flat or fan 26 STEEP (>20°) n/a WIDE (>30m) INCLINED (5-20°) Sand beach 27 FLAT (<5°) Sand flat 28 SAND / MUD FLAT (<5°) Mudflat 29 STEEP (>20°) n/a NARROW (<30m) INCLINED (5-20°) Sand beach 30 FLAT (<5°) n/a n/a ORGANICS n/a n/a Estuaries, marshes 31
ANTHRO- Man-made n/a n/a Man-made, permeable 32 POGENIC n/a Man-made, impermeable 33 CHANNEL Current n/a n/a Channel 34 GLACIER Ice n/a n/a Glacier 35
2-3
Table 2.2. Summary of shore types by BC Class for the 4,981 km of mapped shoreline of the Kodiak archipelago.
Substrate Type
Shore Type (BC
Class)
Sum of Unit
Length (km)
# of Units
% Occurrence
Cumulative Occurrence (%, km)
Rock 1 5.8 25 0.1% 6.1%
2 32.3 139 0.6% 302 km 3 174.3 828 3.5% 4 72.0 358 1.4% 5 17.8 71 0.4%
Rock+Sediment 6 78.5 303 1.6% 42.4% 7 125.6 459 2.5% 2,114 km 8 331.7 1397 6.7% 9 280.9 1322 5.6% 10 71.5 298 1.4% 11 142.0 614 2.9% 12 291.2 1167 5.8% 13 426.5 2219 8.6% 14 215.6 1107 4.3% 15 73.3 315 1.5% 16 2.7 6 0.1% 17 14.0 56 0.3% 18 55.8 150 1.1% 19 1.1 7 0.0% 20 3.2 16 0.1%
Sediment 21 75.0 296 1.5% 42.2% 22 97.1 412 1.9% 2,100 km 23 15.5 71 0.3% 24 930.3 4179 18.7% 25 512.0 2530 10.3% 26 79.3 404 1.6% 27 44.4 150 0.9% 28 243.6 504 4.9% 29 66.5 201 1.3% 30 36.5 105 0.7%
Organics/Marsh 31 415.0 1402 8.3% 8% (415 km) Man-made 32 22.8 102 0.5% 0.5% (25 km)
33 1.7 11 0.0% Channel 34 25.6 95 0.5% 0.5% (25 km)
Glacier/Ice 35 0 25 0.1% 0%
2-4
Substrate Type(Grouped BC Class)
6%
42%
42%
8%
0.5%
0.5%
Rock (1-5)
Rock+Sediment (6-20)
Sediment (21-30)
Organic/Estuaries (31)
Manmade (32-33)
Current-dominated channels (34)
Figure 2.1. Abundance of principal substrate types (on the basis of grouped BC Classes) in the Kodiak archipelago. Photographic illustrations of shore types are provided in Section 2.5.
Grouped rock and sediment shorelines(BC Classes 6-20)
6.7%
4.1%
7.1%
9.7%
9.0%
5.9%
0.0%
5.0%
10.0%
15.0%
20.0%
Cliffs Wide platforms and ramps Narrow platforms andramps
Gravel and sand
Gravel
Figure 2.2. Geomorphology and sediment texture of mixed rock and sediment shorelines (BC classes 6-20) in the Kodiak archipelago.
2-5
Figure 2.3. Map of the distribution of principal substrate types (on the basis of grouped BC Classes) in the Kodiak archipelago.
2-6
Figure 2.4. Map of the distribution of geomorphology and sediment texture of mixed rock and sediment shorelines (BC classes 6-20) in the Kodiak archipelago.

2-7
Table 2.3. Environmental Sensitivity Index (“ESI”) classification (after Peterson et al 2002).
ESI Class Description
1A Exposed rocky shores and banks
1B Exposed, solid, man-made structures
1C Exposed rocky cliffs with boulder talus base
2A Exposed wave-cut platforms in bedrock, mud, or clay
2B Exposed scarps and steep slopes in clay
3A Fine- to medium-grained sand beaches
3B Scarps and steep slopes in sand
3C Tundra cliffs
4 Coarse-grained sand beaches
5 Mixed sand and gravel beaches
6A Gravel beaches (granules and pebbles)
6B Gravel beaches (cobbles and boulders)
6C Rip rap (man-made)
7 Exposed tidal flats
8A Sheltered scarps in bedrock, mud, or clay; sheltered rocky shores (impermeable)
8B Sheltered, solid, man-made structures; sheltered rocky shores (permeable)
8C Sheltered riprap (man-made)
8D Sheltered rocky rubble shores
8E Peat shorelines
9A Sheltered tidal flats
9B Vegetated low banks
9C Hypersaline tidal flats
10A Salt- and brackish-water marshes
10B Freshwater marshes
10C Swamps
10D Scrub-shrub wetlands; mangroves
10E Inundated low-lying tundra
2-8
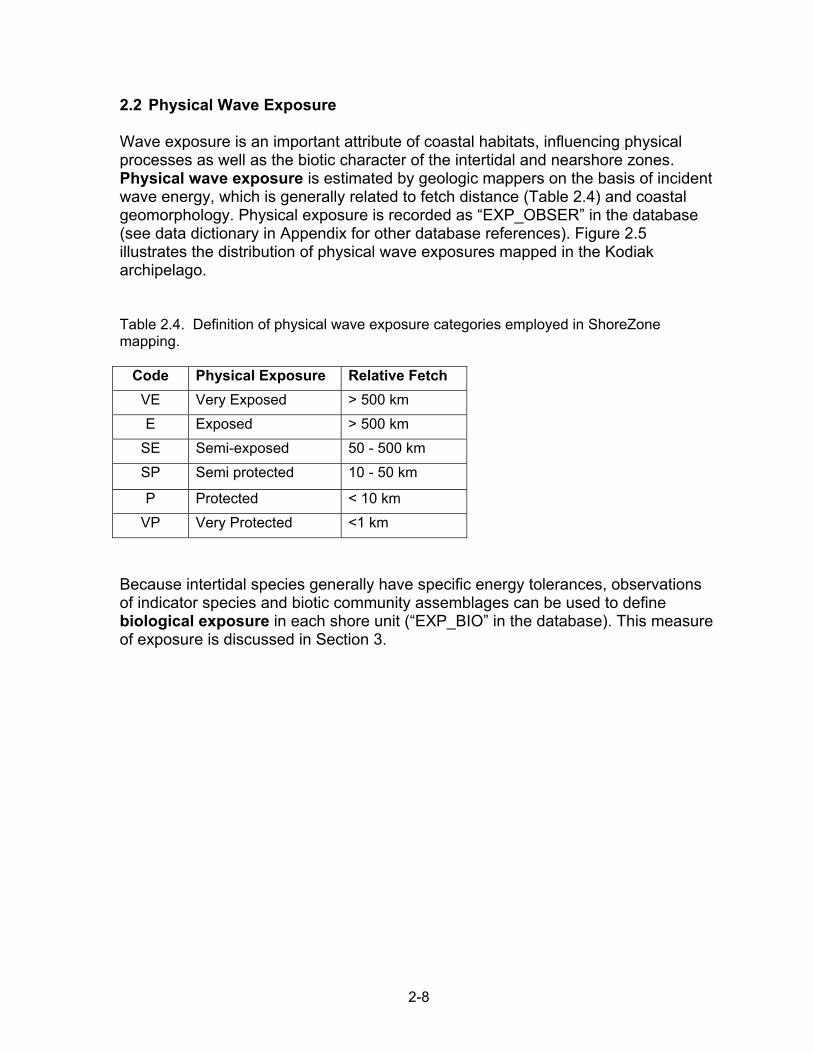
2.2 Physical Wave Exposure Wave exposure is an important attribute of coastal habitats, influencing physical processes as well as the biotic character of the intertidal and nearshore zones. Physical wave exposure is estimated by geologic mappers on the basis of incident wave energy, which is generally related to fetch distance (Table 2.4) and coastal geomorphology. Physical exposure is recorded as “EXP_OBSER” in the database (see data dictionary in Appendix for other database references). Figure 2.5 illustrates the distribution of physical wave exposures mapped in the Kodiak archipelago. Table 2.4. Definition of physical wave exposure categories employed in ShoreZone mapping.
Code Physical Exposure Relative Fetch VE Very Exposed > 500 km E Exposed > 500 km
SE Semi-exposed 50 - 500 km SP Semi protected 10 - 50 km
P Protected < 10 km VP Very Protected <1 km
Because intertidal species generally have specific energy tolerances, observations of indicator species and biotic community assemblages can be used to define biological exposure in each shore unit (“EXP_BIO” in the database). This measure of exposure is discussed in Section 3.
2-9
Figure 2.5. Map of the distribution of physical wave exposure categories in the Kodiak archipelago.

2-10
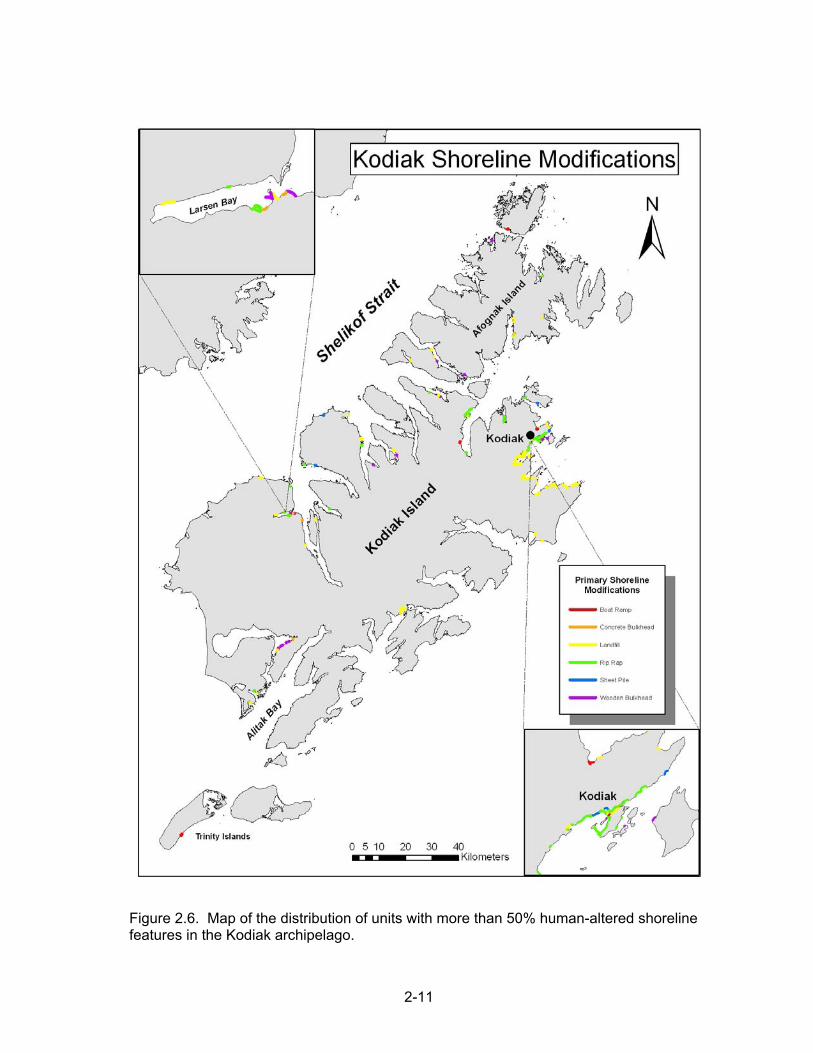
2.3 Anthropogenic Shore Modifications Shore-protection features and coastal access constructions such as seawalls, rip rap, docks, dikes, and wharves are enumerated in ShoreZone mapping data. Very few areas with shore modifications are mapped in the Kodiak Archipelago (25 km of shoreline total, or 0.5% of the coastal environment). The coastal communities of Larsen Bay and Kodiak are areas in which many units are classified as man-modified (having more than 50% of the unit altered by human activities). The type of shore modification (such as boat ramps, bulkheads, and rip rap) is mapped into the database using a two-letter code in the UNIT table, entered in three fields entitled “SHORE_MOD”. The relative proportion of the intertidal zone that is affected by the modification is entered in adjacent data fields in the UNIT table as well. Table 2.5 lists the shore modification codes used in ShoreZone physical mapping. The distribution of units with more than 50% human-altered shoreline features in the Kodiak archipelago is shown in Figure 2.6. The inset boxes provide detail on the type of modification found in the communities of Larsen Bay and Kodiak. Table 2.5. Definition of shore modification types used in ShoreZone physical mapping.
Code Shore Modification Type BR boat ramp CB concrete bulkhead LF landfill SP sheet pile
RR rip rap WB wooden bulkhead
2-11
Figure 2.6. Map of the distribution of units with more than 50% human-altered shoreline features in the Kodiak archipelago.

2-12
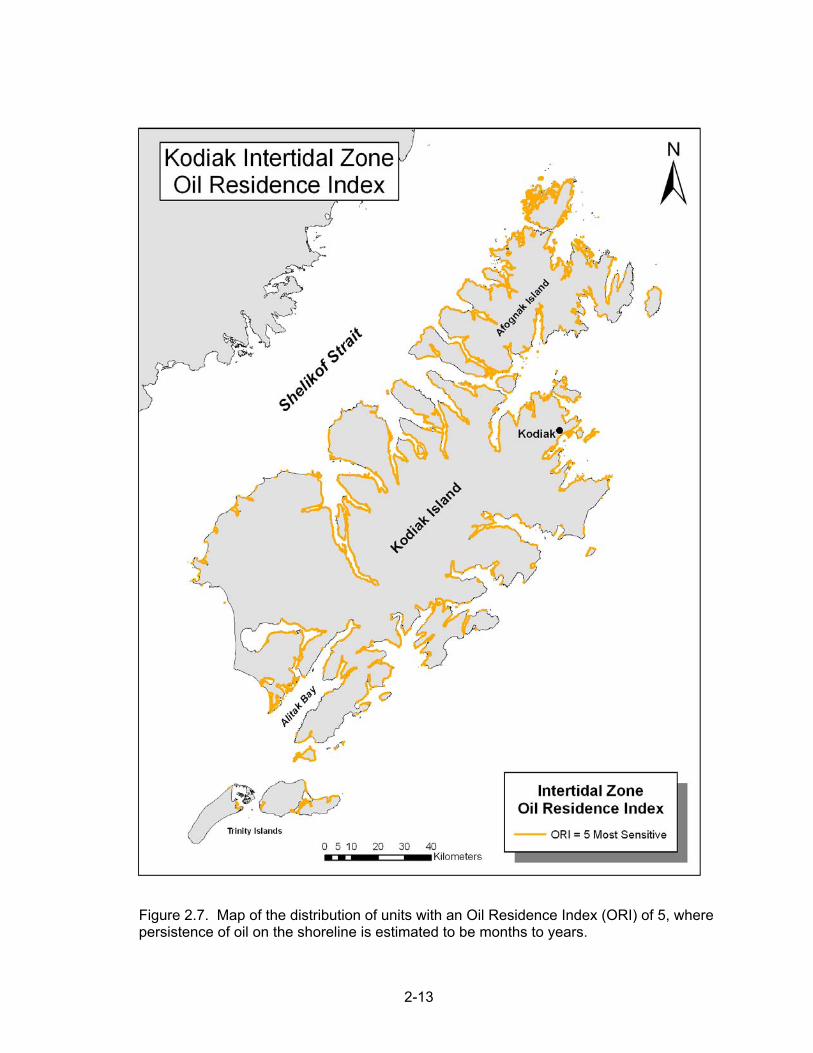
2.4 Oil Residence Index (ORI) ShoreZone coastal mapping data is potentially useful for oil spill contingency planning. In addition to the imagery and biological mapping data, physical attributes of the shoreline can be used to estimate the potential oil residence time on the basis of substrate type and wave exposure level. Substrate permeability is of principal importance in estimating the residence time of oil on the shoreline. Impermeable surfaces such as rock or sheet piling form a barrier and have shorter oil residence times. In contrast, coarse sediments are highly permeable, can trap large volumes of oil, and have lengthy oil residence periods. In general, high-energy shorelines have short oil residence times, owing to the dissipative action of waves. Low-energy shorelines have lengthy oil residence times. The ORI is defined for each across-shore intertidal component (zone). The ORI of the unit is calculated on the basis of those defined for each zone within the unit (Tables 2.6 and 2.7). Figure 2.7 illustrates the distribution of units with an ORI of 5, where persistence of oil on the shoreline is estimated to be months to years. Table 2.6. Definitions of Oil Residence Index (ORI).
Persistence Oil Residence Index Estimated Persistence Short 1 Days to weeks
2 Weeks to months 3 Weeks to months ↓ 4 Months to years
Long 5 Months to years Table 2.7. Lookup table used to assign an Oil Residence Index (ORI) to each unit on the basis of physical exposure and sediment texture. Substrate VE E SE SP P VP Rock 1 1 1 2 3 3 Man-made, impermeable 1 1 1 2 2 2 Boulder 3 3 5 4 4 4 Cobble 2 3 5 4 4 4 Pebble 2 3 5 4 4 4 Sand w/ pebble, cobble, or boulder 1 2 3 4 5 5 Sand w/o pebble, cobble, or boulder 2 2 3 3 4 4 Mud -- -- -- 3 3 3 Organics, vegetation -- -- -- 5 5 5 Man-made, permeable 2 2 3 3 5 5
2-13
Figure 2.7. Map of the distribution of units with an Oil Residence Index (ORI) of 5, where persistence of oil on the shoreline is estimated to be months to years.

2-14
2.5 Physical Illustrations: Shore Types and Geomorphic Features The following pages provide illustrated examples of shore types and geomorphic features mapped in the Kodiak Archipelago. Shore Type: Rock (BC Classes 1-5) Shore Type: Rock and Sediment (BC Classes 6-20) Shore Type: Sediment (BC Classes 21-30) Shore Type: Organic Shorelines, Marshes, and Estuaries (BC Class 31) Shore Type: Human-Altered Shorelines (BC Classes 32-33) Shore Type: Current-Dominated Channels (BC Class 34) Geomorphic Features: Deltas, Mudflats, and Tidal Flats Geomorphic Features: Lagoons Anthropogenic Features: Coastal Structures and Seawalls Other Interesting Features: Fish Traps and Drowned Forests
2-15
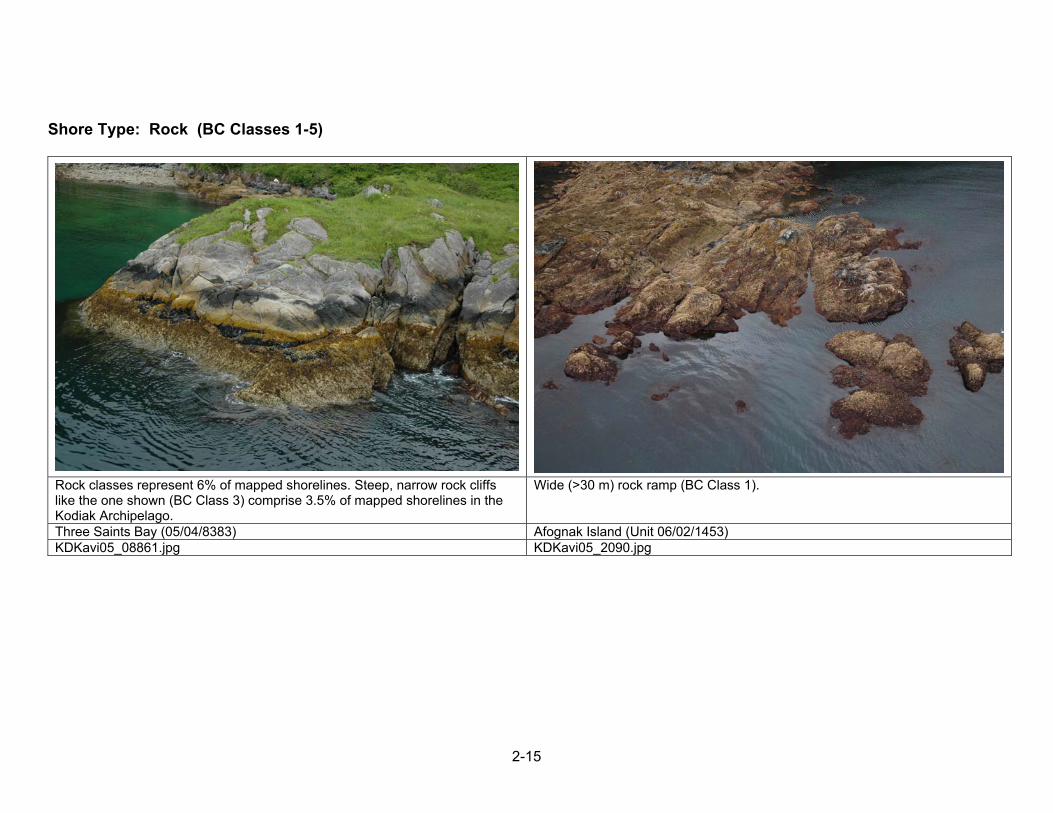
Shore Type: Rock (BC Classes 1-5)
Rock classes represent 6% of mapped shorelines. Steep, narrow rock cliffs like the one shown (BC Class 3) comprise 3.5% of mapped shorelines in the Kodiak Archipelago.
Wide (>30 m) rock ramp (BC Class 1).
Three Saints Bay (05/04/8383) Afognak Island (Unit 06/02/1453) KDKavi05_08861.jpg KDKavi05_2090.jpg

2-16
Shore Type: Rock and Sediment (BC Classes 6-20)
Wide (>30 m) platform (<5° slope) with gravel beach (BC Class 7). Steep cliff (>20°) with narrow (<30 m) gravel beach (BC Class 8). Geese Channel (Unit 05/04/8011) Geese Channel (05/04/8030) KDKavi05_08086.jpg KDKavi05_08160.jpg

2-17
Shore Type: Rock and Sediment (BC Classes 6-20)
Steep cliff (>20°) with narrow (<30 m) gravel beach (BC Class 8). Geomorphic features mapped in this unit include a steep, low cliff (Form “Casl”) with rubble and angular boulders at the base (Materials “Cra/R”), as well as offshore rocky reefs (Form “Fir,” Materials “R”).
Wide rock ramp (>30 m, 5-20° slope) with gravel beach (BC Class 11). Geomorphic features mapped in this unit include the ramp with tidepools covered by a veneer of cobbles and boulders (Form “Pirp,” Materials “Ccb/R”) and a beach face of cobbles overlying pebbles and sand (Form “Bf,” Materials “Cc/Cps”).
Twoheaded Island (Unit 05/04/8153) Village Islands (Unit 06/03/7032) KDKavi05_08504.jpg KDKavi05_3528.jpg

2-18
Shore Type: Sediment (BC Classes 21-30)
Wide sand and gravel flat (>30 m wide, <5° slope) (BC Class 24) Sand and gravel flat with a washover berm (Form “Bsw”), beach face composed
of cobbles, pebbles, and sand (Form “Bf,” Materials “ccps”) (BC Class 24) Ban Island (Unit 06/01/1128) Sitkinak Island (Unit 05/03/114) KDKavi05_1879.jpg KDKavi05_07222.jpg
2-19
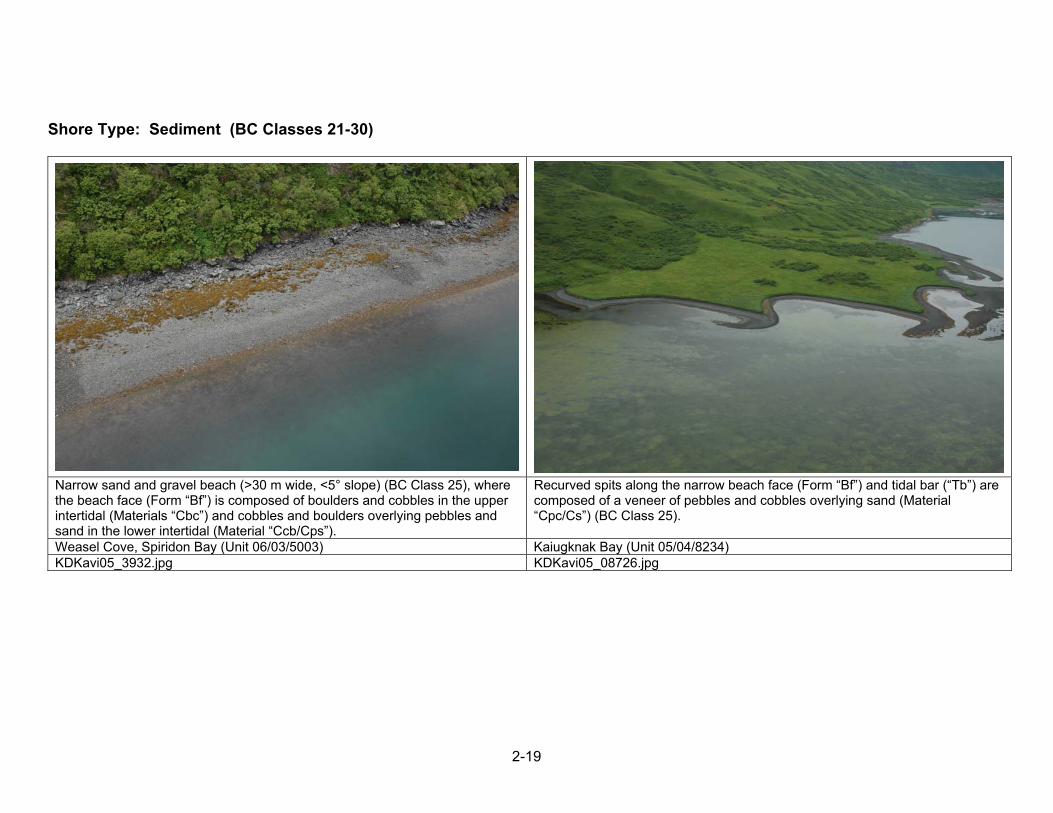
Shore Type: Sediment (BC Classes 21-30)
Narrow sand and gravel beach (>30 m wide, <5° slope) (BC Class 25), where the beach face (Form “Bf”) is composed of boulders and cobbles in the upper intertidal (Materials “Cbc”) and cobbles and boulders overlying pebbles and sand in the lower intertidal (Material “Ccb/Cps”).
Recurved spits along the narrow beach face (Form “Bf”) and tidal bar (“Tb”) are composed of a veneer of pebbles and cobbles overlying sand (Material “Cpc/Cs”) (BC Class 25).
Weasel Cove, Spiridon Bay (Unit 06/03/5003) Kaiugknak Bay (Unit 05/04/8234) KDKavi05_3932.jpg KDKavi05_08726.jpg
2-20
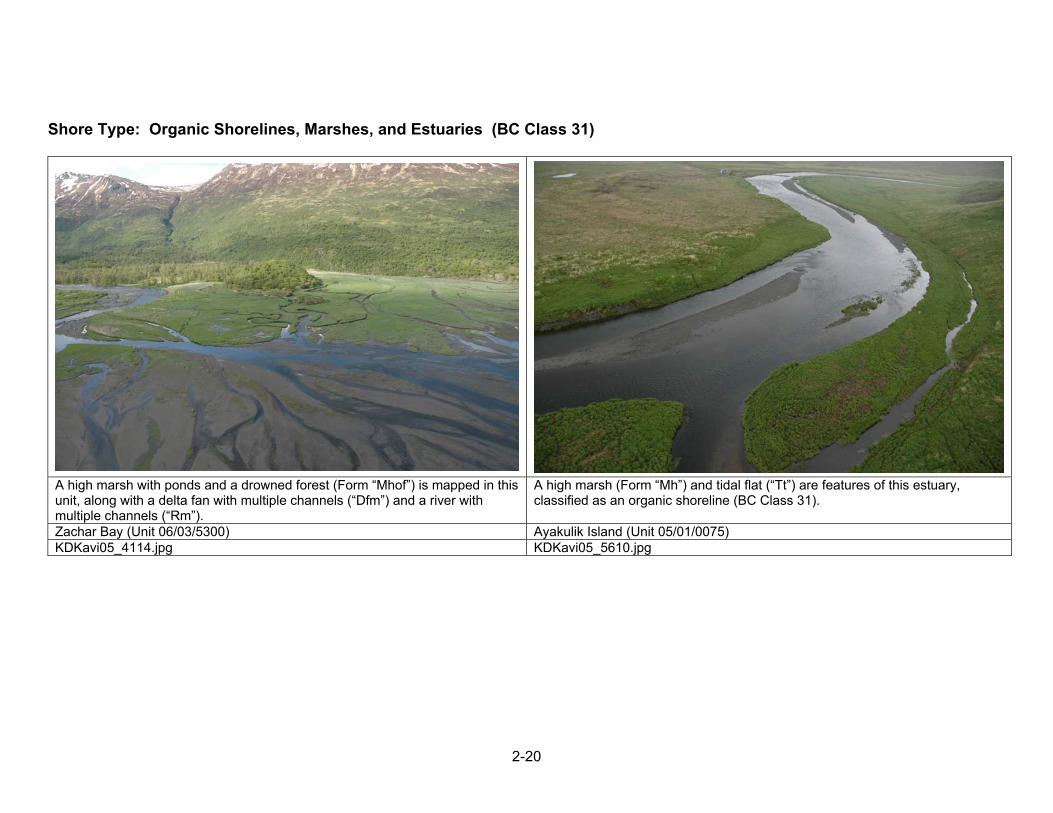
Shore Type: Organic Shorelines, Marshes, and Estuaries (BC Class 31)
A high marsh with ponds and a drowned forest (Form “Mhof”) is mapped in this unit, along with a delta fan with multiple channels (“Dfm”) and a river with multiple channels (“Rm”).
A high marsh (Form “Mh”) and tidal flat (“Tt”) are features of this estuary, classified as an organic shoreline (BC Class 31).
Zachar Bay (Unit 06/03/5300) Ayakulik Island (Unit 05/01/0075) KDKavi05_4114.jpg KDKavi05_5610.jpg
2-21
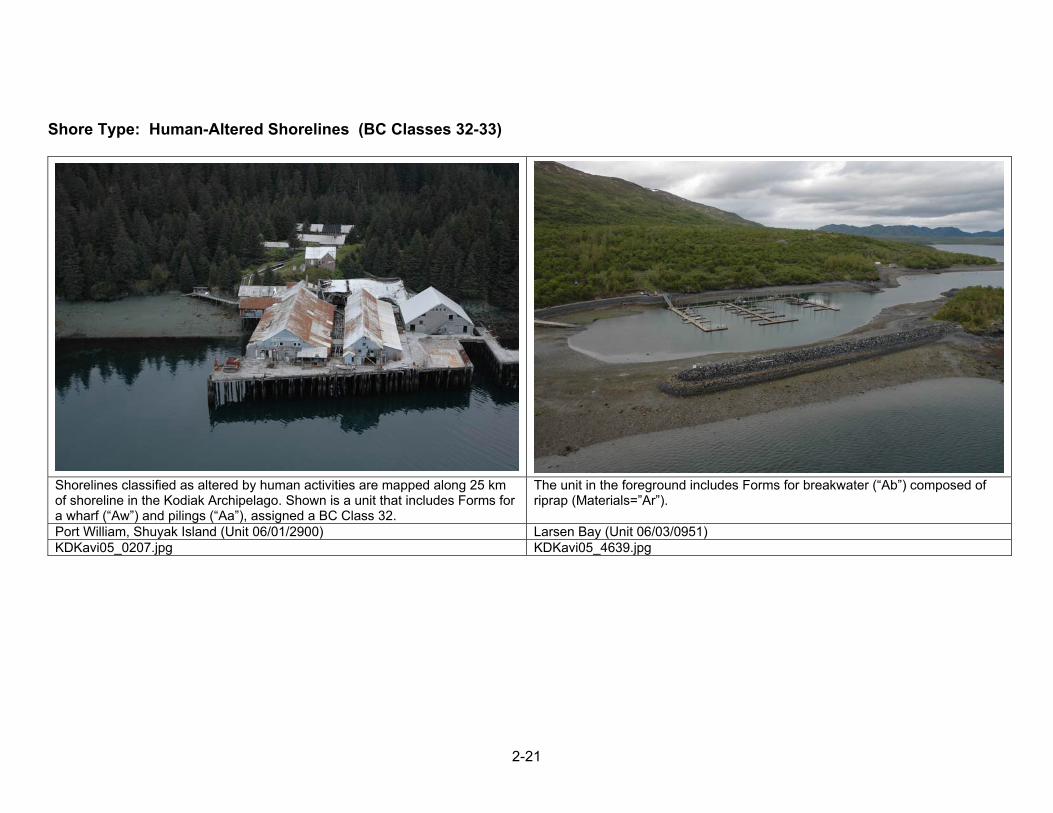
Shore Type: Human-Altered Shorelines (BC Classes 32-33)
Shorelines classified as altered by human activities are mapped along 25 km of shoreline in the Kodiak Archipelago. Shown is a unit that includes Forms for a wharf (“Aw”) and pilings (“Aa”), assigned a BC Class 32.
The unit in the foreground includes Forms for breakwater (“Ab”) composed of riprap (Materials=”Ar”).
Port William, Shuyak Island (Unit 06/01/2900) Larsen Bay (Unit 06/03/0951) KDKavi05_0207.jpg KDKavi05_4639.jpg
2-22
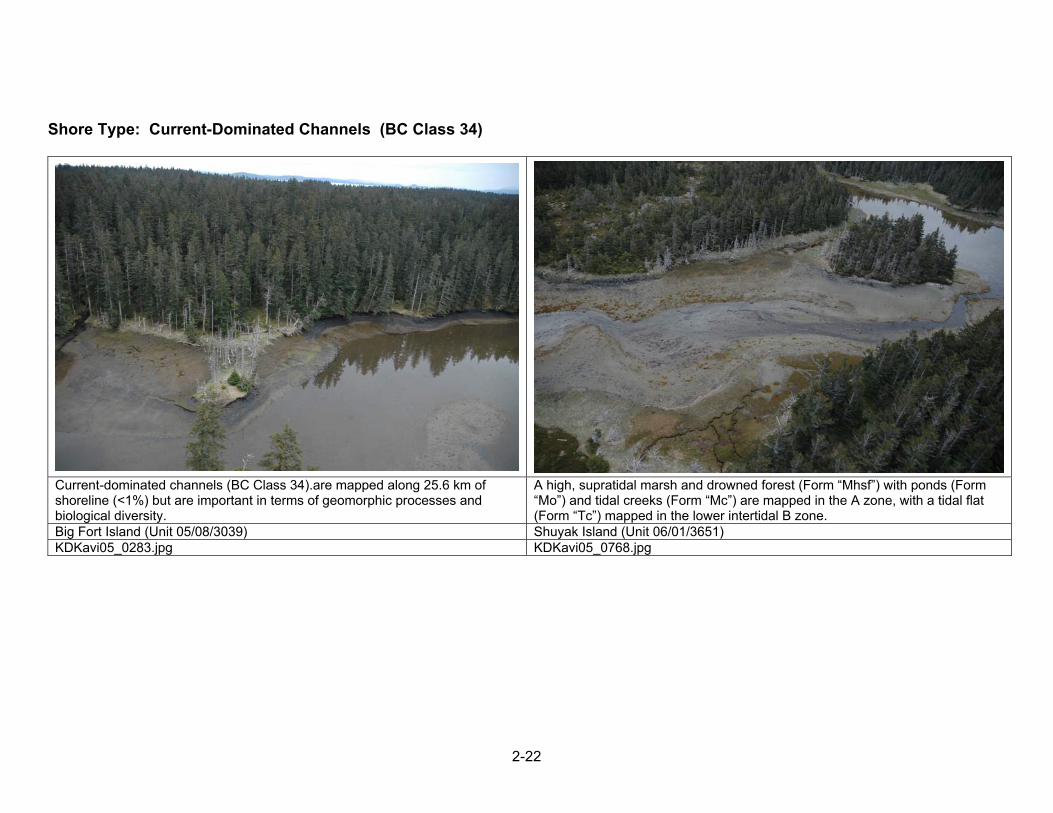
Shore Type: Current-Dominated Channels (BC Class 34)
Current-dominated channels (BC Class 34).are mapped along 25.6 km of shoreline (<1%) but are important in terms of geomorphic processes and biological diversity.
A high, supratidal marsh and drowned forest (Form “Mhsf”) with ponds (Form “Mo”) and tidal creeks (Form “Mc”) are mapped in the A zone, with a tidal flat (Form “Tc”) mapped in the lower intertidal B zone.
Big Fort Island (Unit 05/08/3039) Shuyak Island (Unit 06/01/3651) KDKavi05_0283.jpg KDKavi05_0768.jpg
2-23
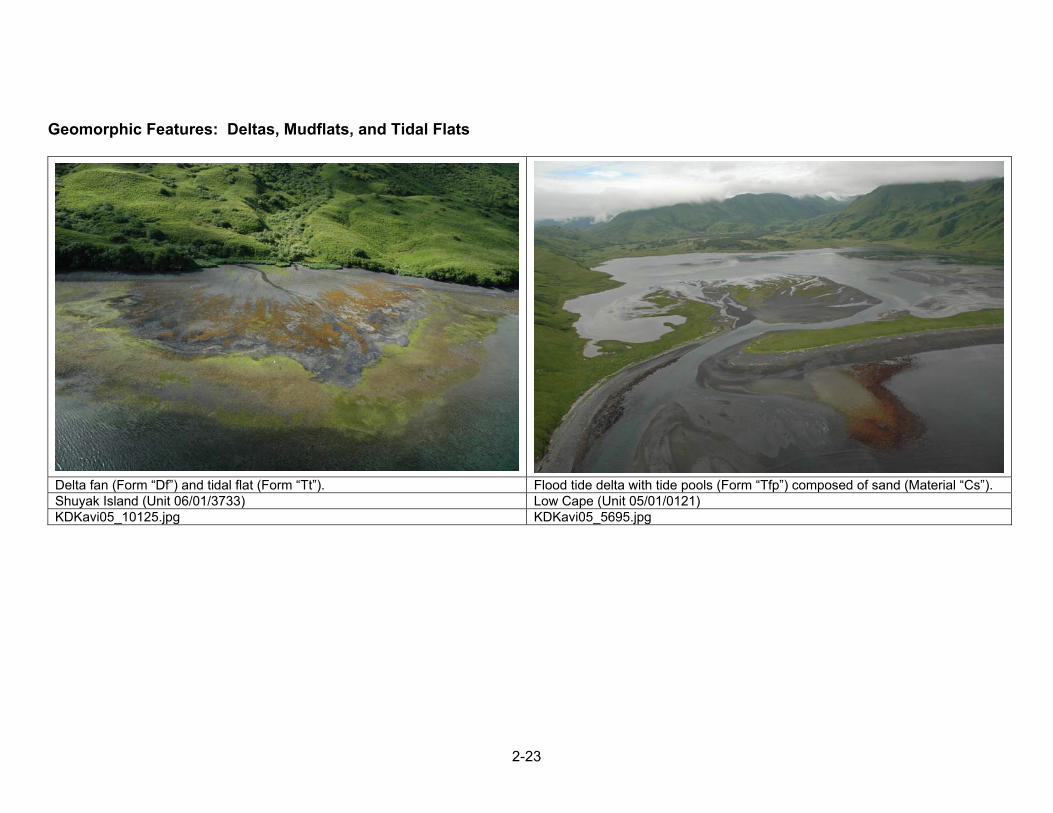
Geomorphic Features: Deltas, Mudflats, and Tidal Flats
Delta fan (Form “Df”) and tidal flat (Form “Tt”). Flood tide delta with tide pools (Form “Tfp”) composed of sand (Material “Cs”). Shuyak Island (Unit 06/01/3733) Low Cape (Unit 05/01/0121) KDKavi05_10125.jpg KDKavi05_5695.jpg
2-24
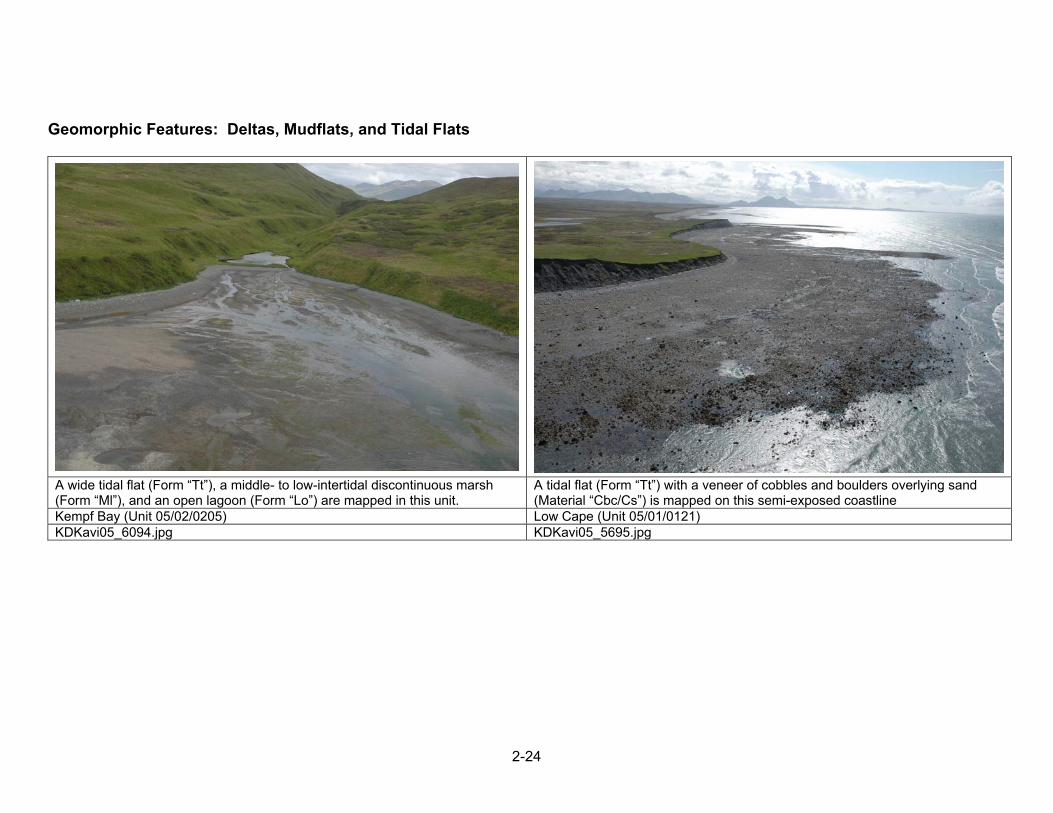
Geomorphic Features: Deltas, Mudflats, and Tidal Flats
A wide tidal flat (Form “Tt”), a middle- to low-intertidal discontinuous marsh (Form “Ml”), and an open lagoon (Form “Lo”) are mapped in this unit.
A tidal flat (Form “Tt”) with a veneer of cobbles and boulders overlying sand (Material “Cbc/Cs”) is mapped on this semi-exposed coastline
Kempf Bay (Unit 05/02/0205) Low Cape (Unit 05/01/0121) KDKavi05_6094.jpg KDKavi05_5695.jpg
2-25
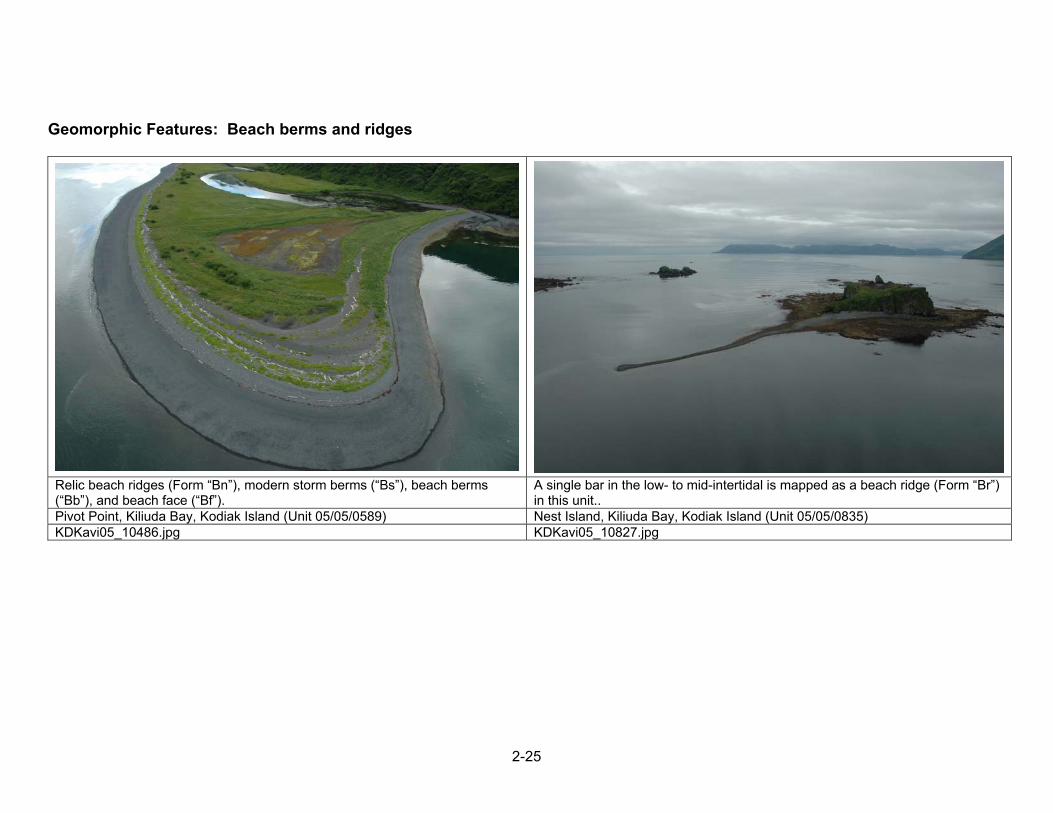
Geomorphic Features: Beach berms and ridges
Relic beach ridges (Form “Bn”), modern storm berms (“Bs”), beach berms (“Bb”), and beach face (“Bf”).
A single bar in the low- to mid-intertidal is mapped as a beach ridge (Form “Br”) in this unit..
Pivot Point, Kiliuda Bay, Kodiak Island (Unit 05/05/0589) Nest Island, Kiliuda Bay, Kodiak Island (Unit 05/05/0835) KDKavi05_10486.jpg KDKavi05_10827.jpg
2-26
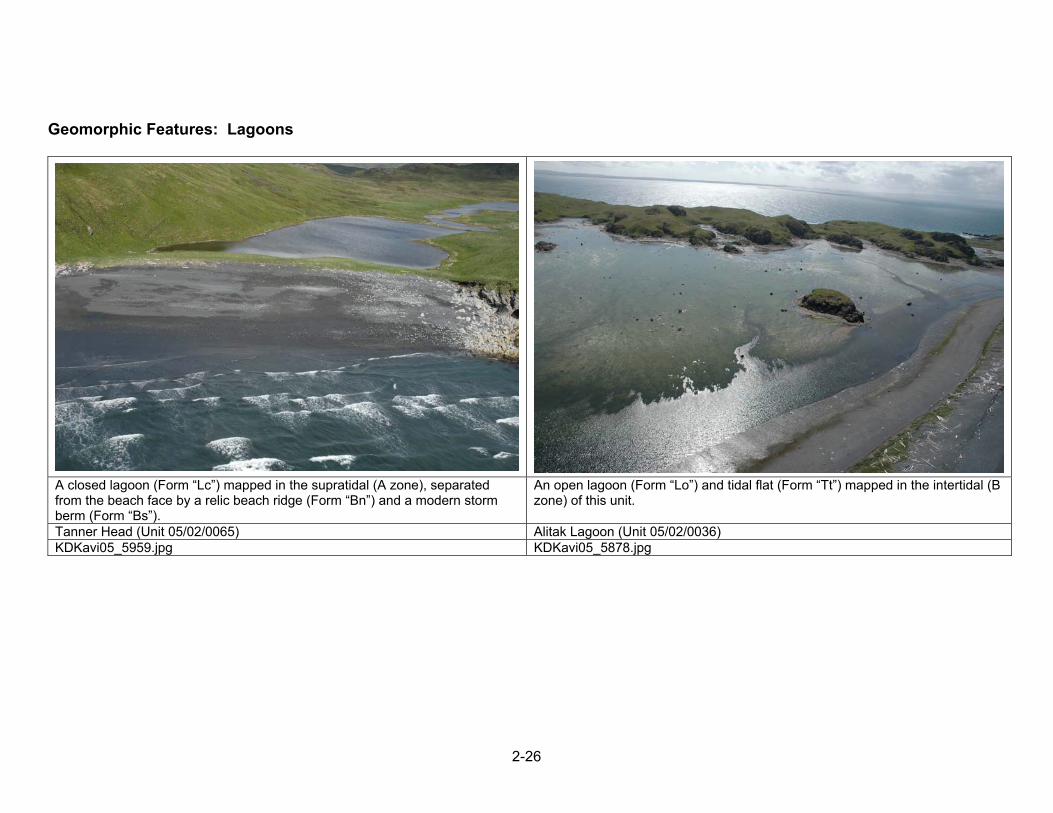
Geomorphic Features: Lagoons
A closed lagoon (Form “Lc”) mapped in the supratidal (A zone), separated from the beach face by a relic beach ridge (Form “Bn”) and a modern storm berm (Form “Bs”).
An open lagoon (Form “Lo”) and tidal flat (Form “Tt”) mapped in the intertidal (B zone) of this unit.
Tanner Head (Unit 05/02/0065) Alitak Lagoon (Unit 05/02/0036) KDKavi05_5959.jpg KDKavi05_5878.jpg

2-27
Anthropogenic Features: Coastal Structures and Shore Modifications
Coastal structures mapped in the unit include a wharf (Aw), seawall (As), and pilings (Aa). Buildings such as this cannery are generally mapped as Form Aw.
This home is mapped as Form “Aw” (wharf) with Materials “Awda” (wood, debris, and metal).
Larsen Bay (Units 06/03/0942 and 0943) Spiridon Bay (Unit 06/03/5156 and 5157) KDKavi05_4634.jpg KDKavi05_3993.jpg
2-28
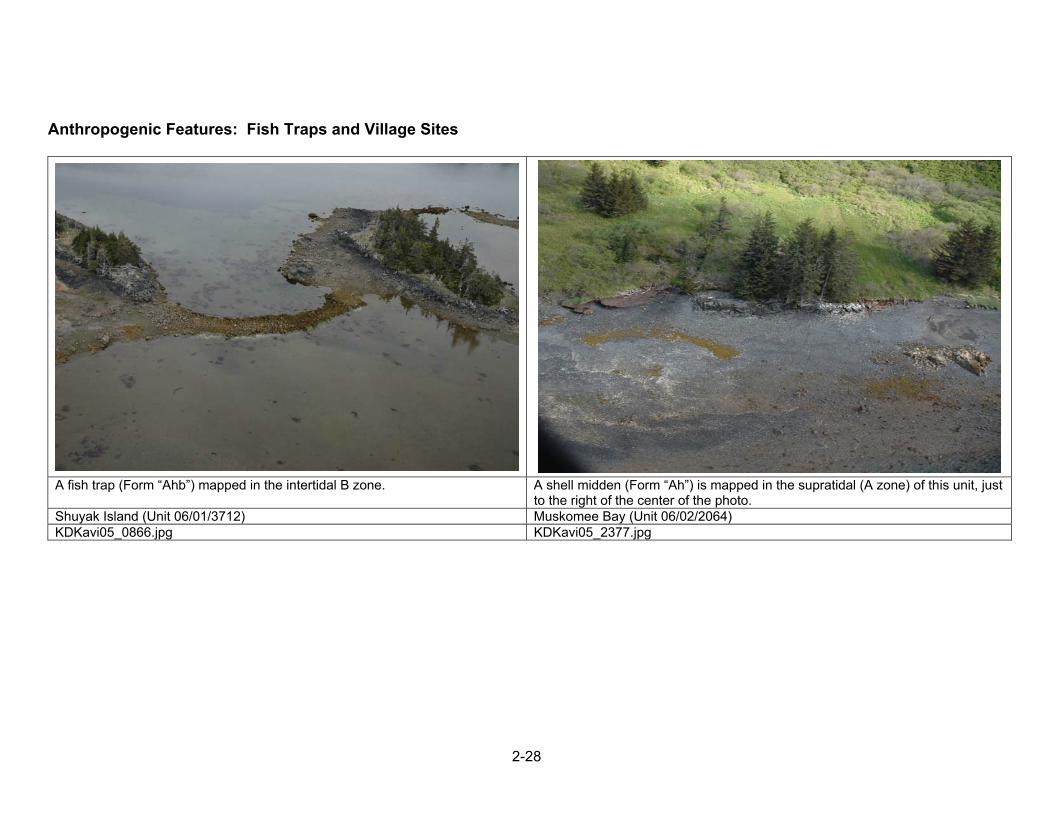
Anthropogenic Features: Fish Traps and Village Sites
A fish trap (Form “Ahb”) mapped in the intertidal B zone. A shell midden (Form “Ah”) is mapped in the supratidal (A zone) of this unit, just
to the right of the center of the photo. Shuyak Island (Unit 06/01/3712) Muskomee Bay (Unit 06/02/2064) KDKavi05_0866.jpg KDKavi05_2377.jpg

2-29
Other Interesting Features: Drowned Forests
Drowned forests are mapped as Form “Mf.” Other geomorphic features mapped in this unit include a beach face (“Bf”) and tidal flat (“Tt”).
The drowned forest in this unit is mapped with a high marsh (“Mhf”), a tidal flat (“Tt”) and an open lagoon (“Lo”).
Big Fort Island (Unit 05/08/3028) Big Fort Island (Unit 05/08/3036) KDKavi05_0270.jpg KDKavi05_0279.jpg
3-1
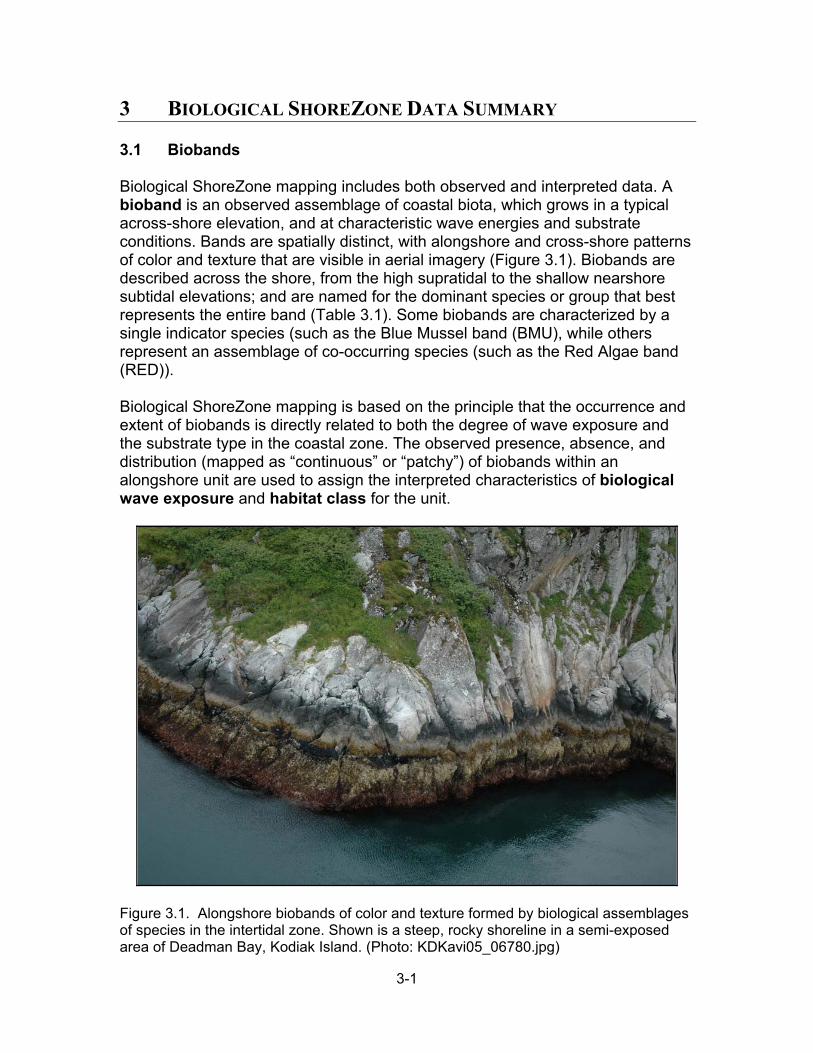
3 BIOLOGICAL SHOREZONE DATA SUMMARY 3.1 Biobands Biological ShoreZone mapping includes both observed and interpreted data. A bioband is an observed assemblage of coastal biota, which grows in a typical across-shore elevation, and at characteristic wave energies and substrate conditions. Bands are spatially distinct, with alongshore and cross-shore patterns of color and texture that are visible in aerial imagery (Figure 3.1). Biobands are described across the shore, from the high supratidal to the shallow nearshore subtidal elevations; and are named for the dominant species or group that best represents the entire band (Table 3.1). Some biobands are characterized by a single indicator species (such as the Blue Mussel band (BMU), while others represent an assemblage of co-occurring species (such as the Red Algae band (RED)). Biological ShoreZone mapping is based on the principle that the occurrence and extent of biobands is directly related to both the degree of wave exposure and the substrate type in the coastal zone. The observed presence, absence, and distribution (mapped as “continuous” or “patchy”) of biobands within an alongshore unit are used to assign the interpreted characteristics of biological wave exposure and habitat class for the unit.
Figure 3.1. Alongshore biobands of color and texture formed by biological assemblages of species in the intertidal zone. Shown is a steep, rocky shoreline in a semi-exposed area of Deadman Bay, Kodiak Island. (Photo: KDKavi05_06780.jpg)

3-2
Table 3.1. Bioband definitions for aerial video interpretation of the Kodiak Archipelago.
Zone Bioband Name Database Label Colour Diagnostic Indicator
Species Exposure *
Splash Zone VER Black or bare rock Encrusting black lichens Width varies with
exposure.
Dune Grass GRA Pale blue-green Leymus mollis P to E
Sedges SED Bright green to yellow-green
Carex sp. VP to SP
Supr
atid
al
Marsh grasses, herbs and sedges
PUC Light or bright green
Puccinellia sp. Other salt-tolerant herbs and grasses
VP to SE
Barnacle BAR Grey-white to pale yellow
Balanus sp. Semibalanus sp. P to E
Rockweed FUC Golden-brown Fucus sp. P to SE
Green Algae ULV Green Ulva sp. Other small green algae P to E
Blue Mussel BMU Black or blue-black Mytilus trossulus P to E
Bleached Red Algae HAL
Olive, golden or yellow-brown
Bleached foliose or filamentous red algae Palmaria sp. Odonthalia sp.
P to SE
Upp
er to
Mid
-Inte
rtida
l
Red Algae RED Dark to bright red or pink (corallines)
Odonthalia sp. Neorhodomela sp. Palmaria sp. Other foliose red algae, and other coralline algae
P to E
Surfgrass SUR Bright green Phyllospadix sp. SP to SE Alaria ALA Dark brown Alaria sp. SP to E
Soft Brown Kelps SBR
Yellow-brown, olive brown or brown.
Saccharina subsimplex Cystoseira sp. VP to SE
Stalked Dark Brown Kelps CHB
Dark chocolate brown
Stalked Laminaria sp. Cymathere sp. Other bladed kelps
SE to E
Low
er In
terti
dal a
nd
Nea
rsho
re S
ubtid
al
Eelgrass ZOS Bright to dark green Zostera marina VP to SP
Dragon Kelp ALF Golden-brown Alaria fistulosa SP to SE Macrocystis ** MAC Golden-brown Macrocystis integrifolia P to SE
Sub-
tidal
Bull Kelp NER Dark brown Nereocystis luetkeana SP to E
* Wave Exposure Codes: VP = Very Protected, P = Protected, SP = Semi-Protected, SE = Semi-Exposed, E = Exposed ** Macrocystis was observed in limited distribution in northwestern Shuyak Island Upper intertidal biota tend to be consistent between different wave exposure categories and geographic areas, so are considered weak indicators of exposure. An example is the ubiquitous Barnacle band (BAR), which is found across all exposure categories. Lower intertidal biobands are often diagnostic of particular wave exposures. For example, the Surfgrass band (SUR) is indicative of semi-exposed settings, while the Eelgrass band (ZOS) is indicative of semi-protected and protected environments.

3-3
As mapping has been completed in different geographic areas, differences in the species assemblages that characterize the lower intertidal biobands have become apparent. These biobands are: Bleached Red Algae (HAL), Red Algae (RED), Soft Brown Kelps (SBR) and Dark Brown Kelps (CHB). These four biobands are also particularly important as biological indicators of wave exposure. To accommodate the region-specific definitions, geographic bioareas with unique indicator and associated species definitions for have been defined for those biobands. The combined 2002 and 2005 biomapping for the Kodiak archipelago has been assigned to two bioareas: Shelikof Strait (KATM) along the northwestern coast and Kodiak Island (KODI) along the southeastern Gulf of Alaska coast. The Shelikof Strait bioarea also includes the Katmai National Park area as well as the Aniakchak National Monument and Preserve coast. In the database, the four lower intertidal biobands in the Kodiak bioarea are identified by the suffix ‘10’ in the bioband name, while Shelikof biobands are designated by the suffix ‘11’. See Appendix A, Table A-7 for a list of other bioareas defined to date in Alaska ShoreZone mapping. Descriptions of Kodiak archipelago biobands, including species assemblages and photographic illustrations, are provided in this section. The occurrence of biobands mapped in Kodiak is summarized in Table 3.2 and Figure 3.2.
3-4
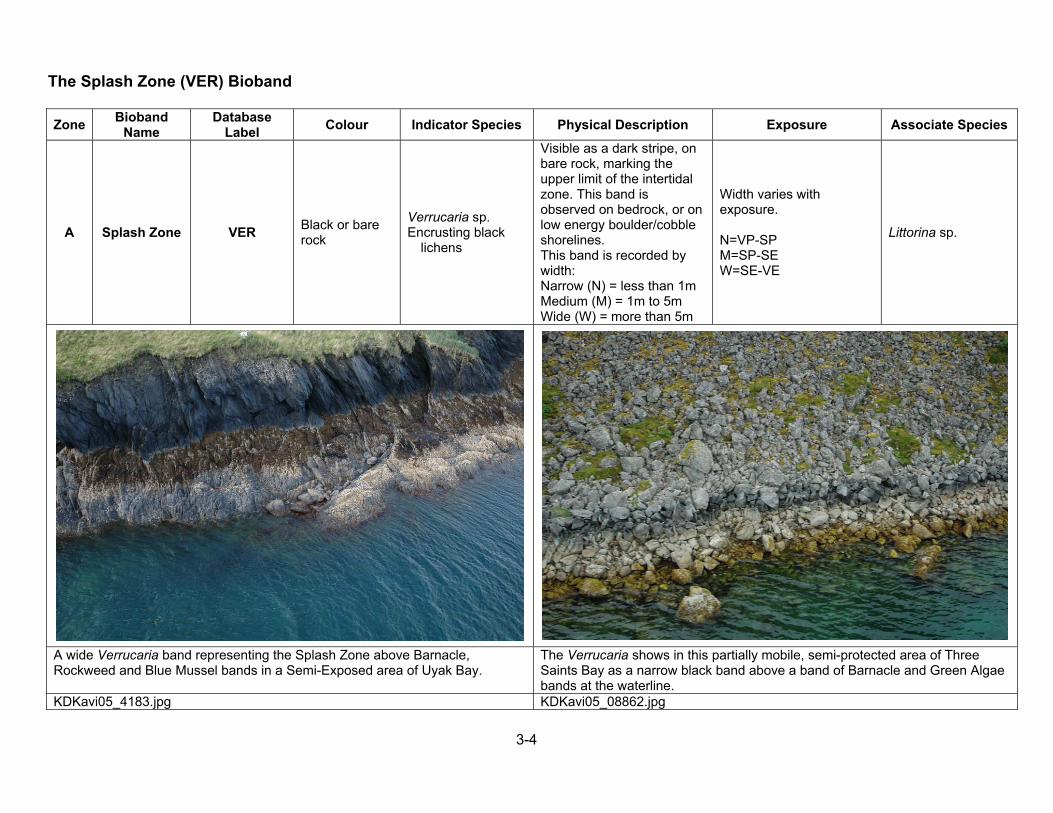
The Splash Zone (VER) Bioband
Zone Bioband Name
Database Label Colour Indicator Species Physical Description Exposure Associate Species
A Splash Zone VER Black or bare rock
Verrucaria sp. Encrusting black
lichens
Visible as a dark stripe, on bare rock, marking the upper limit of the intertidal zone. This band is observed on bedrock, or on low energy boulder/cobble shorelines. This band is recorded by width: Narrow (N) = less than 1m Medium (M) = 1m to 5m Wide (W) = more than 5m
Width varies with exposure. N=VP-SP M=SP-SE W=SE-VE
Littorina sp.
A wide Verrucaria band representing the Splash Zone above Barnacle, Rockweed and Blue Mussel bands in a Semi-Exposed area of Uyak Bay.
The Verrucaria shows in this partially mobile, semi-protected area of Three Saints Bay as a narrow black band above a band of Barnacle and Green Algae bands at the waterline.
KDKavi05_4183.jpg KDKavi05_08862.jpg
3-5
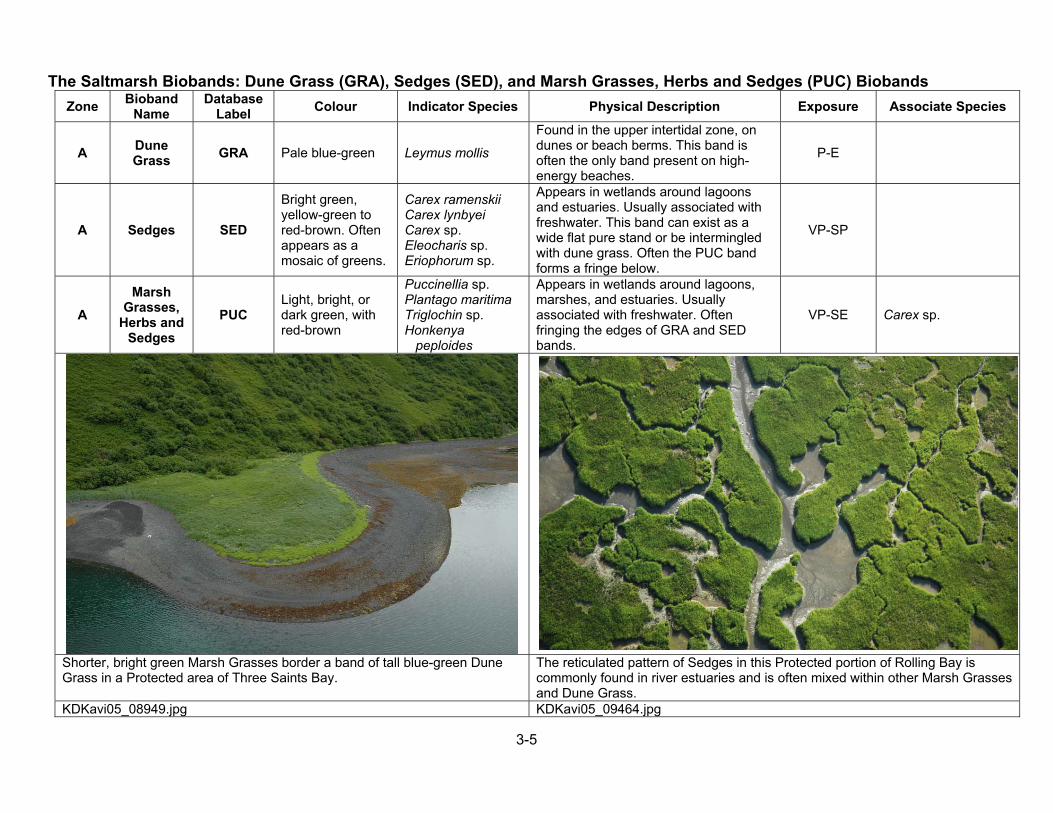
The Saltmarsh Biobands: Dune Grass (GRA), Sedges (SED), and Marsh Grasses, Herbs and Sedges (PUC) Biobands Zone Bioband
Name Database
Label Colour Indicator Species Physical Description Exposure Associate Species
A Dune Grass GRA Pale blue-green Leymus mollis
Found in the upper intertidal zone, on dunes or beach berms. This band is often the only band present on high-energy beaches.
P-E
A Sedges SED
Bright green, yellow-green to red-brown. Often appears as a mosaic of greens.
Carex ramenskii Carex lynbyei Carex sp. Eleocharis sp. Eriophorum sp.
Appears in wetlands around lagoons and estuaries. Usually associated with freshwater. This band can exist as a wide flat pure stand or be intermingled with dune grass. Often the PUC band forms a fringe below.
VP-SP
A Marsh
Grasses, Herbs and
Sedges PUC
Light, bright, or dark green, with red-brown
Puccinellia sp. Plantago maritima Triglochin sp. Honkenya peploides
Appears in wetlands around lagoons, marshes, and estuaries. Usually associated with freshwater. Often fringing the edges of GRA and SED bands.
VP-SE Carex sp.
Shorter, bright green Marsh Grasses border a band of tall blue-green Dune Grass in a Protected area of Three Saints Bay.
The reticulated pattern of Sedges in this Protected portion of Rolling Bay is commonly found in river estuaries and is often mixed within other Marsh Grasses and Dune Grass.
KDKavi05_08949.jpg KDKavi05_09464.jpg
3-6
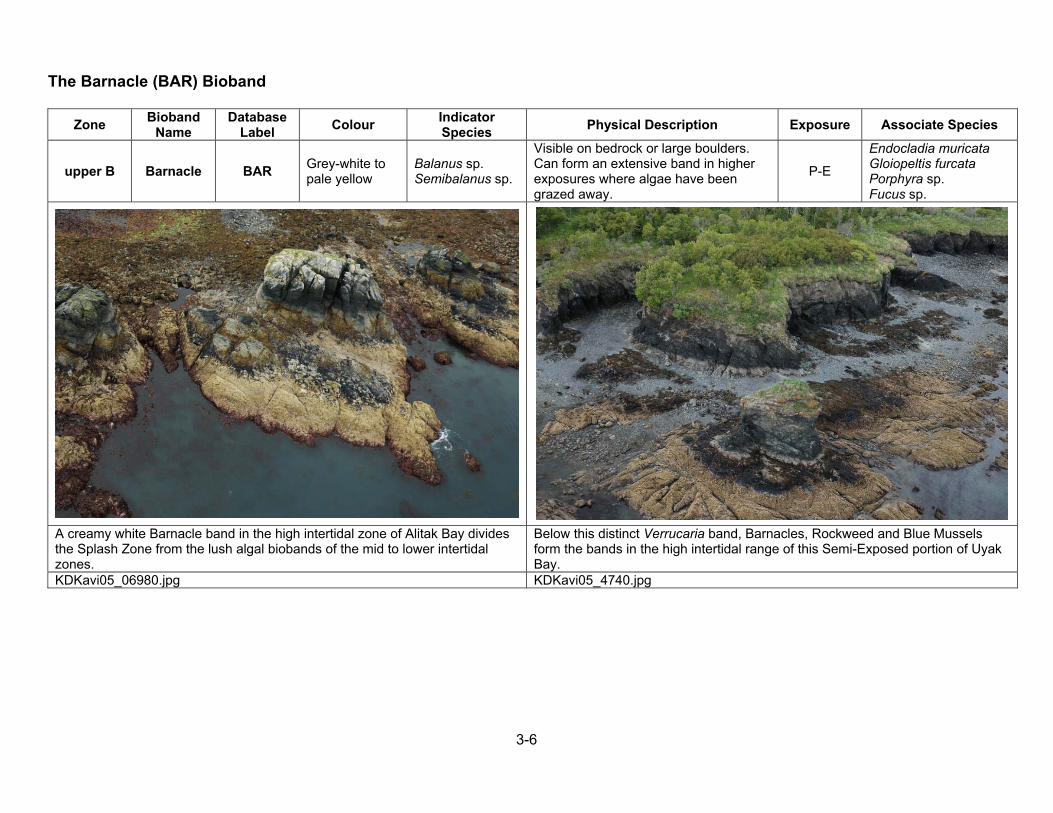
The Barnacle (BAR) Bioband
Zone Bioband Name
Database Label Colour Indicator
Species Physical Description Exposure Associate Species
upper B Barnacle BAR Grey-white to pale yellow
Balanus sp. Semibalanus sp.
Visible on bedrock or large boulders. Can form an extensive band in higher exposures where algae have been grazed away.
P-E
Endocladia muricata Gloiopeltis furcata Porphyra sp. Fucus sp.
A creamy white Barnacle band in the high intertidal zone of Alitak Bay divides the Splash Zone from the lush algal biobands of the mid to lower intertidal zones.
Below this distinct Verrucaria band, Barnacles, Rockweed and Blue Mussels form the bands in the high intertidal range of this Semi-Exposed portion of Uyak Bay.
KDKavi05_06980.jpg KDKavi05_4740.jpg
3-7
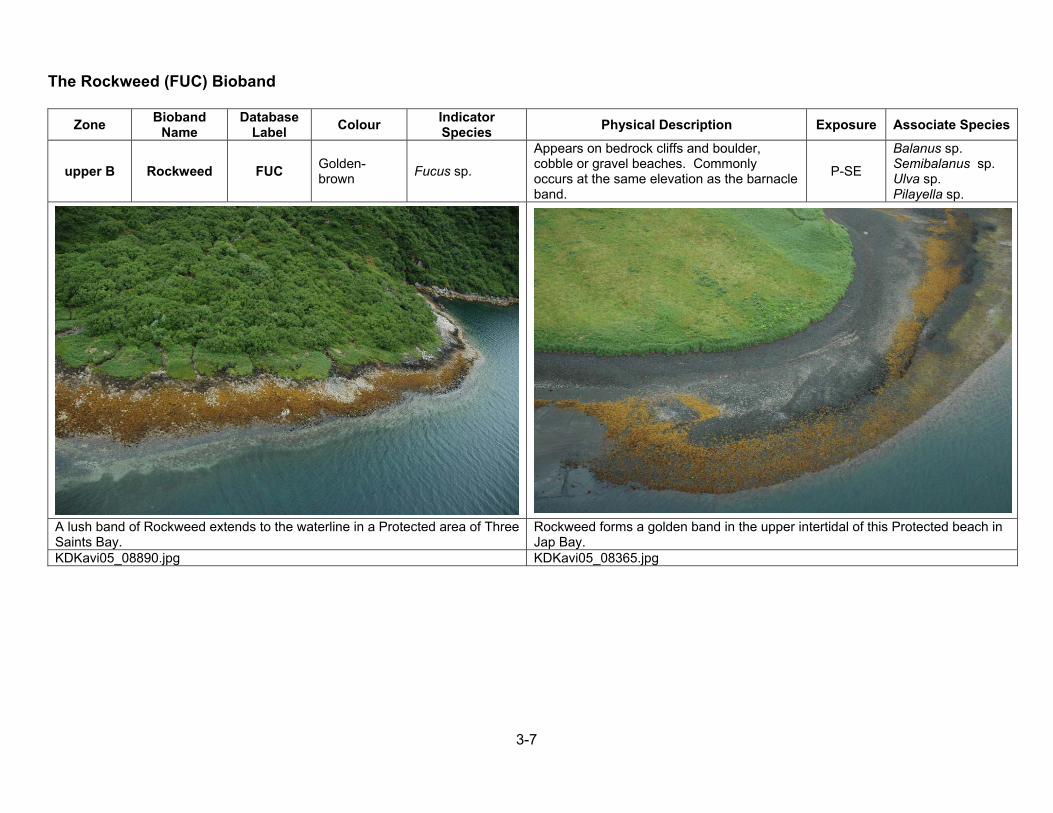
The Rockweed (FUC) Bioband
Zone Bioband Name
Database Label Colour Indicator
Species Physical Description Exposure Associate Species
upper B Rockweed FUC Golden-brown Fucus sp.
Appears on bedrock cliffs and boulder, cobble or gravel beaches. Commonly occurs at the same elevation as the barnacle band.
P-SE
Balanus sp. Semibalanus sp. Ulva sp. Pilayella sp.
A lush band of Rockweed extends to the waterline in a Protected area of Three Saints Bay.
Rockweed forms a golden band in the upper intertidal of this Protected beach in Jap Bay.
KDKavi05_08890.jpg KDKavi05_08365.jpg
3-8
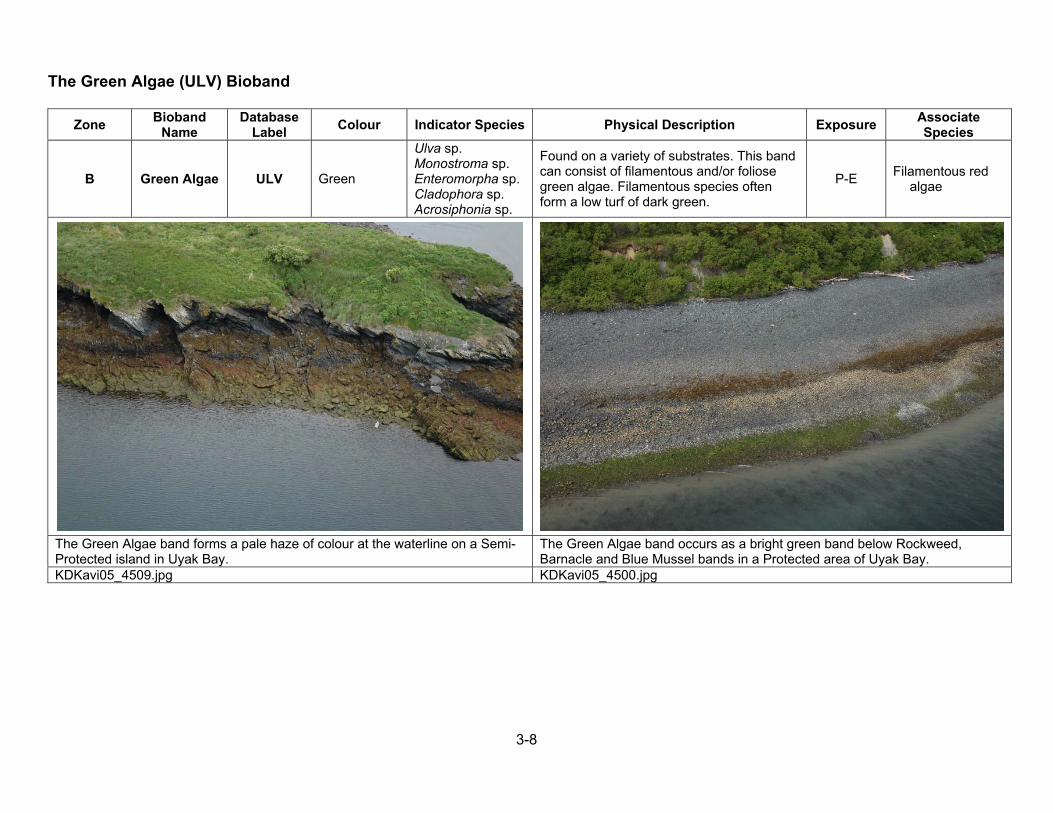
The Green Algae (ULV) Bioband
Zone Bioband Name
Database Label Colour Indicator Species Physical Description Exposure Associate
Species
B Green Algae ULV Green
Ulva sp. Monostroma sp. Enteromorpha sp. Cladophora sp. Acrosiphonia sp.
Found on a variety of substrates. This band can consist of filamentous and/or foliose green algae. Filamentous species often form a low turf of dark green.
P-E Filamentous red algae
The Green Algae band forms a pale haze of colour at the waterline on a Semi-Protected island in Uyak Bay.
The Green Algae band occurs as a bright green band below Rockweed, Barnacle and Blue Mussel bands in a Protected area of Uyak Bay.
KDKavi05_4509.jpg KDKavi05_4500.jpg
3-9
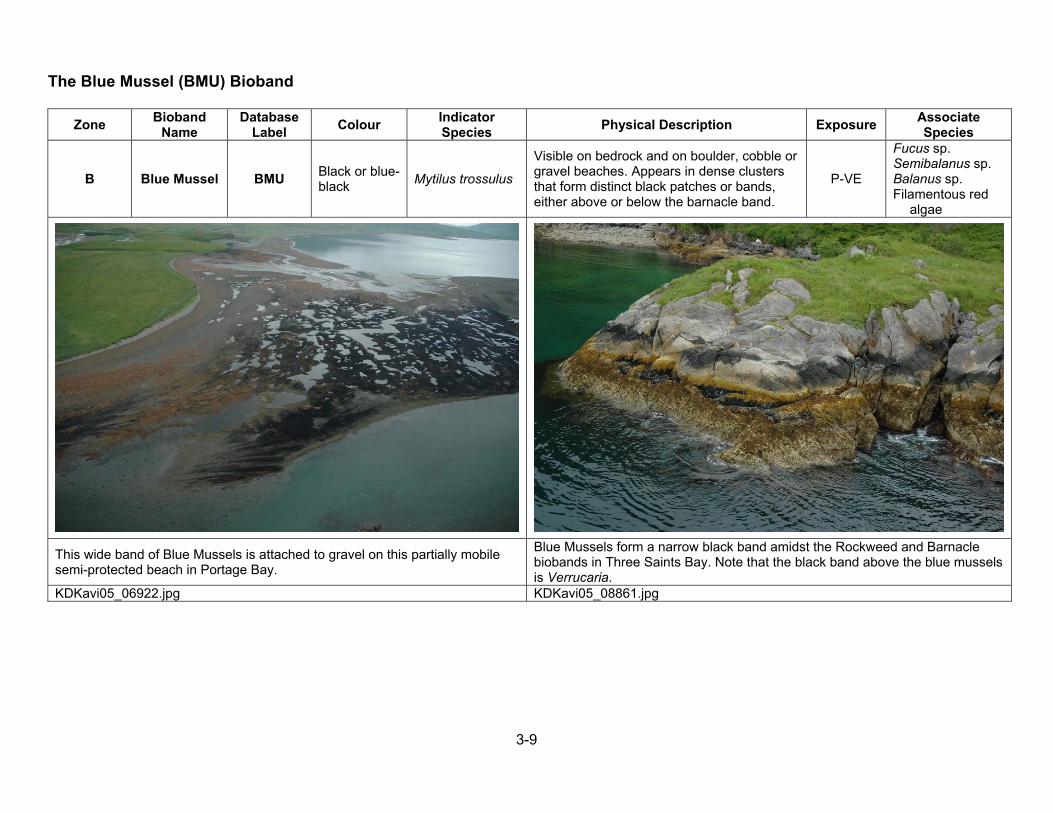
The Blue Mussel (BMU) Bioband
Zone Bioband Name
Database Label Colour Indicator
Species Physical Description Exposure Associate Species
B Blue Mussel BMU Black or blue-black Mytilus trossulus
Visible on bedrock and on boulder, cobble or gravel beaches. Appears in dense clusters that form distinct black patches or bands, either above or below the barnacle band.
P-VE
Fucus sp. Semibalanus sp. Balanus sp. Filamentous red
algae
This wide band of Blue Mussels is attached to gravel on this partially mobile semi-protected beach in Portage Bay.
Blue Mussels form a narrow black band amidst the Rockweed and Barnacle biobands in Three Saints Bay. Note that the black band above the blue mussels is Verrucaria.
KDKavi05_06922.jpg KDKavi05_08861.jpg
3-10
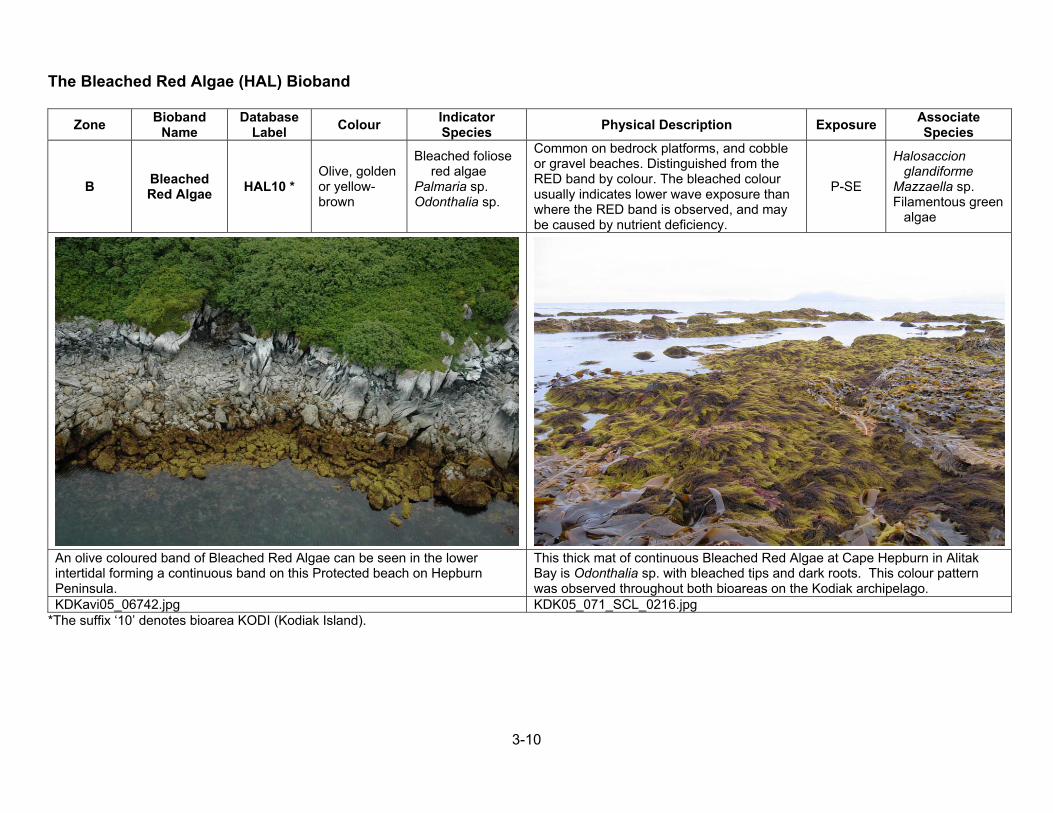
The Bleached Red Algae (HAL) Bioband
Zone Bioband Name
Database Label Colour Indicator
Species Physical Description Exposure Associate Species
B Bleached Red Algae HAL10 *
Olive, golden or yellow-brown
Bleached foliose red algae
Palmaria sp. Odonthalia sp.
Common on bedrock platforms, and cobble or gravel beaches. Distinguished from the RED band by colour. The bleached colour usually indicates lower wave exposure than where the RED band is observed, and may be caused by nutrient deficiency.
P-SE
Halosaccion glandiforme
Mazzaella sp. Filamentous green
algae
An olive coloured band of Bleached Red Algae can be seen in the lower intertidal forming a continuous band on this Protected beach on Hepburn Peninsula.
This thick mat of continuous Bleached Red Algae at Cape Hepburn in Alitak Bay is Odonthalia sp. with bleached tips and dark roots. This colour pattern was observed throughout both bioareas on the Kodiak archipelago.
KDKavi05_06742.jpg KDK05_071_SCL_0216.jpg *The suffix ‘10’ denotes bioarea KODI (Kodiak Island).
3-11
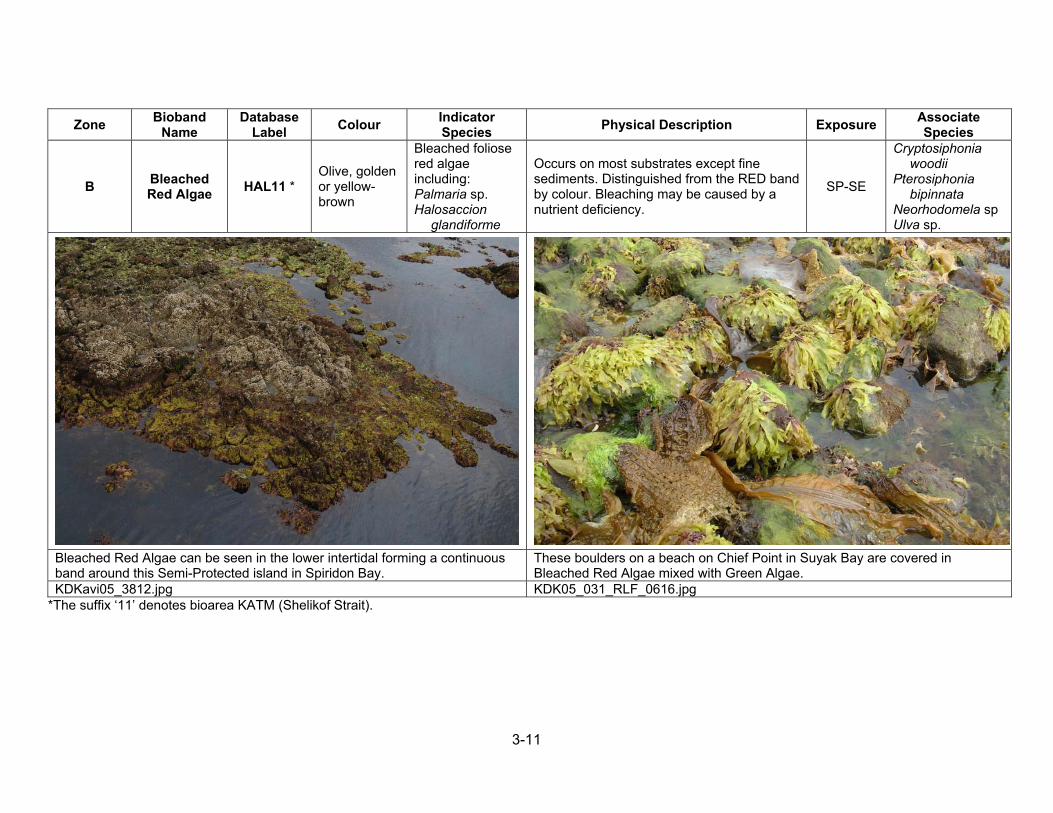
Zone Bioband Name
Database Label Colour Indicator
Species Physical Description Exposure Associate Species
B Bleached Red Algae HAL11 *
Olive, golden or yellow-brown
Bleached foliose red algae including: Palmaria sp. Halosaccion
glandiforme
Occurs on most substrates except fine sediments. Distinguished from the RED band by colour. Bleaching may be caused by a nutrient deficiency.
SP-SE
Cryptosiphonia woodii
Pterosiphonia bipinnata
Neorhodomela sp Ulva sp.
Bleached Red Algae can be seen in the lower intertidal forming a continuous band around this Semi-Protected island in Spiridon Bay.
These boulders on a beach on Chief Point in Suyak Bay are covered in Bleached Red Algae mixed with Green Algae.
KDKavi05_3812.jpg KDK05_031_RLF_0616.jpg *The suffix ‘11’ denotes bioarea KATM (Shelikof Strait).
3-12
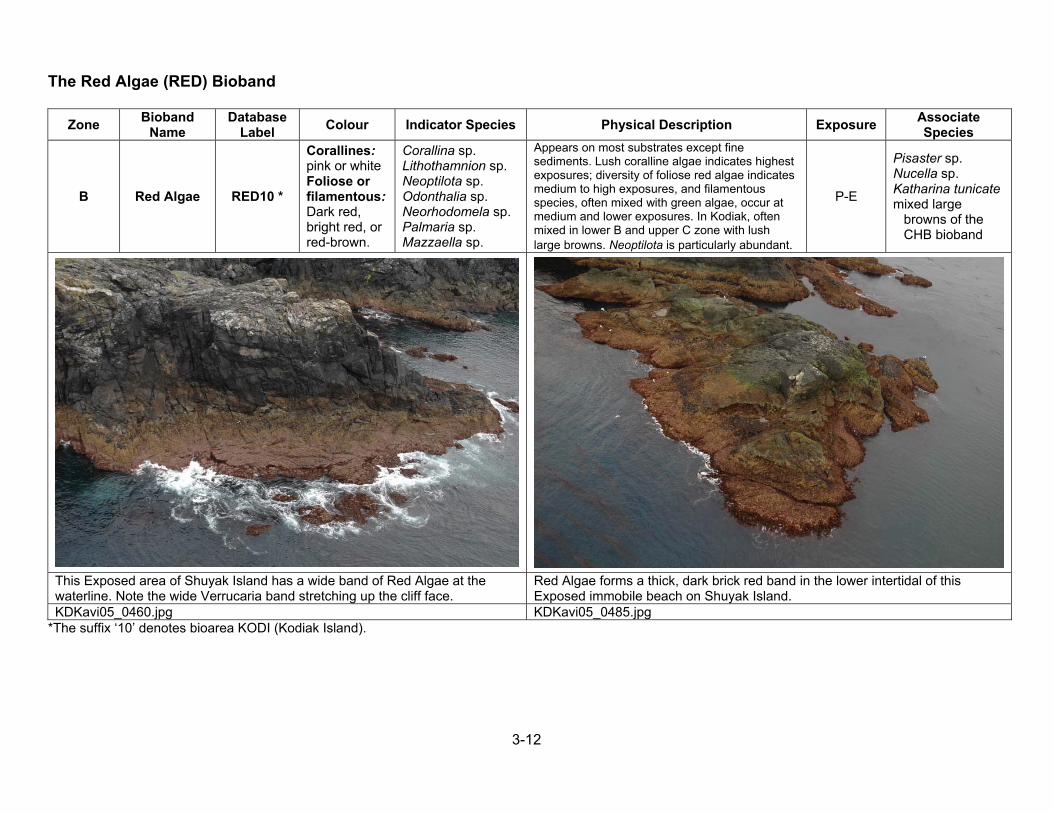
The Red Algae (RED) Bioband
Zone Bioband Name
Database Label Colour Indicator Species Physical Description Exposure Associate
Species
B Red Algae RED10 *
Corallines: pink or white Foliose or filamentous: Dark red, bright red, or red-brown.
Corallina sp. Lithothamnion sp. Neoptilota sp. Odonthalia sp. Neorhodomela sp. Palmaria sp. Mazzaella sp.
Appears on most substrates except fine sediments. Lush coralline algae indicates highest exposures; diversity of foliose red algae indicates medium to high exposures, and filamentous species, often mixed with green algae, occur at medium and lower exposures. In Kodiak, often mixed in lower B and upper C zone with lush large browns. Neoptilota is particularly abundant.
P-E
Pisaster sp. Nucella sp. Katharina tunicate mixed large
browns of the CHB bioband
This Exposed area of Shuyak Island has a wide band of Red Algae at the waterline. Note the wide Verrucaria band stretching up the cliff face.
Red Algae forms a thick, dark brick red band in the lower intertidal of this Exposed immobile beach on Shuyak Island.
KDKavi05_0460.jpg KDKavi05_0485.jpg *The suffix ‘10’ denotes bioarea KODI (Kodiak Island).

3-13
Zone Bioband
Name Database
Label Colour Indicator Species Physical Description Exposure Associate Species
B Red Algae RED11 *
Coralline: pink or white Foliose or filamentous: Dark red, bright red or red-brown.
Lithothamnion sp. Cryptosiphonia
woodii Pterosiphonia
bipinnata Odonthalia floccosa Palmaria sp. Porphyra sp. Mazzaella sp.
Occurs on most substrates except fine sediments. Lush coralline algae indicate high exposures; foliose red algae indicate moderate exposures, and filamentous species, often mixed with green algae, indicate moderate to low wave exposures.
SP-E
Alaria sp. Fucus sp. Semibalanus
cariosus Katharina tunicata Littorina sitkana
Red Algae form a thicker band on this immobile Semi-exposed rock platform than on the more mobile beach face behind the point, on Uganik Island.
Lush Red Algae forms a narrow band below a thick Barnacle band in an exposed area of Bear Island.
KDKavi05_2811.jpg KDKavi05_4824.jpg *The suffix ‘11’ denotes bioarea KATM (Shelikof Strait).
3-14
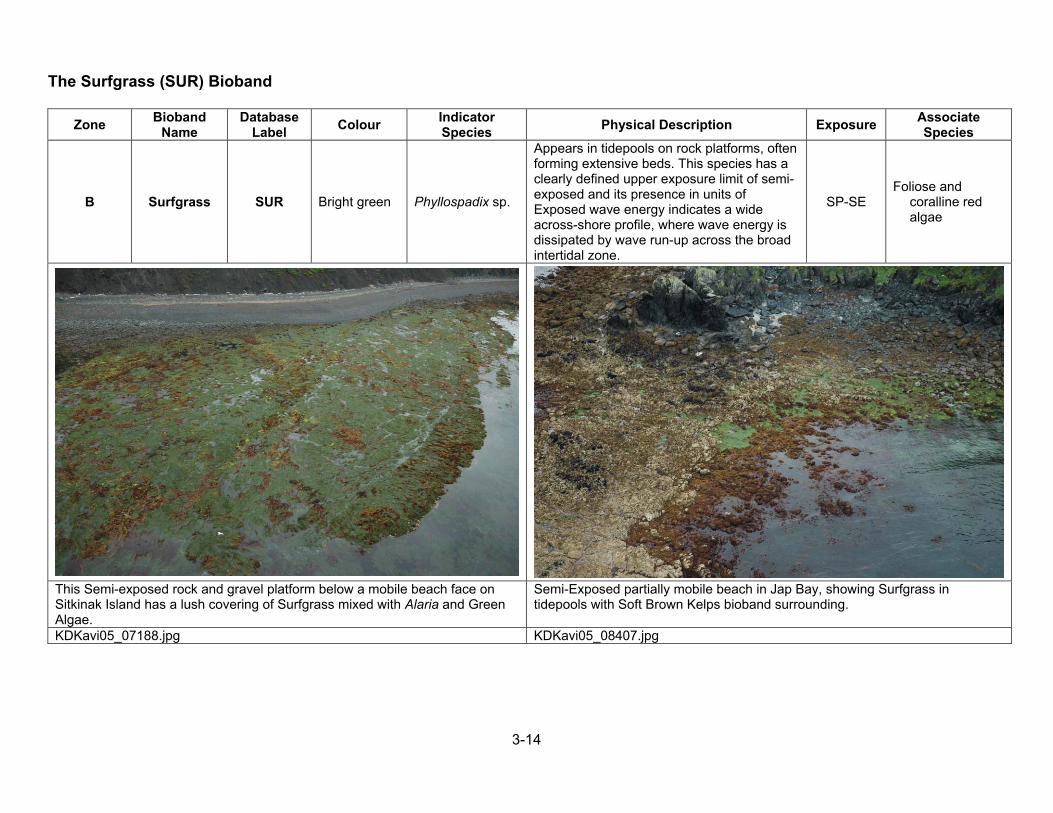
The Surfgrass (SUR) Bioband
Zone Bioband Name
Database Label Colour Indicator
Species Physical Description Exposure Associate Species
B Surfgrass SUR Bright green Phyllospadix sp.
Appears in tidepools on rock platforms, often forming extensive beds. This species has a clearly defined upper exposure limit of semi-exposed and its presence in units of Exposed wave energy indicates a wide across-shore profile, where wave energy is dissipated by wave run-up across the broad intertidal zone.
SP-SE Foliose and
coralline red algae
This Semi-exposed rock and gravel platform below a mobile beach face on Sitkinak Island has a lush covering of Surfgrass mixed with Alaria and Green Algae.
Semi-Exposed partially mobile beach in Jap Bay, showing Surfgrass in tidepools with Soft Brown Kelps bioband surrounding.
KDKavi05_07188.jpg KDKavi05_08407.jpg

3-15
The Alaria (ALA) Bioband
Zone Bioband Name
Database Label Colour Indicator
Species Physical Description Exposure Associate Species
B & C Alaria ALA Dark brown or red-brown
Alaria marginata Alaria sp.
Common on bedrock cliffs and platforms, and on boulder/cobble beaches. This often single-species band has a distinct ribbon-like texture, and may appear iridescent in some imagery.
SP-E Foliose red algae Laminaria sp.
A Semi-Exposed bay on Aiaktalik Island, with a thick, continuous, mono-specific bed of Alaria.
Alaria draped over lower intertidal rocks and attached to boulders in an otherwise sandy subtidal on a Semi-exposed partially mobile beach in Portage Bay.
KDKavi05_07971.jpg KDKavi05_06955.jpg

3-16
The Soft Brown Kelps (SBR) Bioband
Zone Bioband Name
Database Label Colour Indicator
Species Physical Description Exposure Associate Species
B & C Soft Brown Kelps SBR10 *
Yellow-brown, olive brown or brown.
Saccharina subsimplex
Cystoseira sp.
This band is defined by non-floating large browns and can form lush bands in semi-protected areas. The kelp fronds have a ruffled appearance and can be encrusted with diatoms and bryozoans giving the blades a 'dusty' appearance.
VP-SP
Alaria sp. Cymathere sp. Saccharina sessile
(bullate)
Soft Brown Kelps mixed with Green Algae, Red Algae, and Alaria forma a band spanning the lower intertidal and subtidal on this Semi-Protected, partially mobile beach on Shuyak Island.
This lush subtidal Soft Brown Kelps band in Back Bay has a dusty appearance due to accumulated silt and diatoms, possibly due to the influence of the nearby Afognak River.
KDKavi05_0337.jpg KDK02-24-22.jpg *The suffix ‘10’ denotes bioarea KODI (Kodiak Island).
3-17
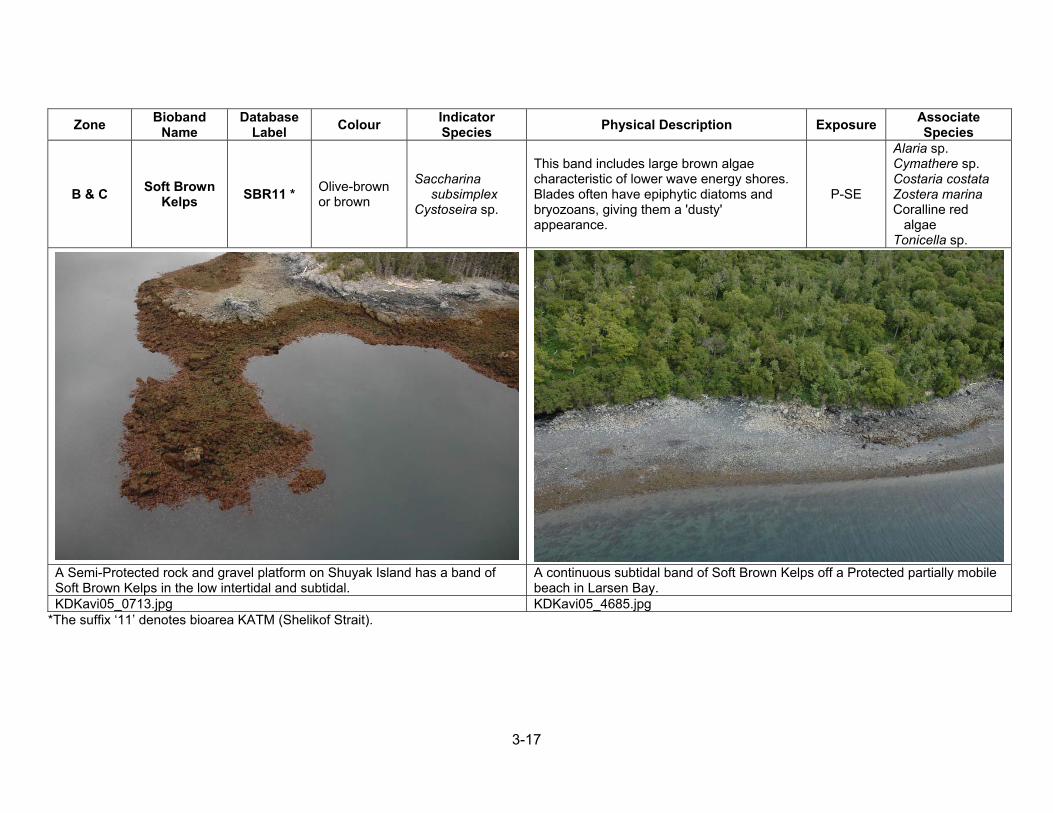
Zone Bioband Name
Database Label Colour Indicator
Species Physical Description Exposure Associate Species
B & C Soft Brown Kelps SBR11 * Olive-brown
or brown
Saccharina subsimplex
Cystoseira sp.
This band includes large brown algae characteristic of lower wave energy shores. Blades often have epiphytic diatoms and bryozoans, giving them a 'dusty' appearance.
P-SE
Alaria sp. Cymathere sp. Costaria costata Zostera marina Coralline red
algae Tonicella sp.
A Semi-Protected rock and gravel platform on Shuyak Island has a band of Soft Brown Kelps in the low intertidal and subtidal.
A continuous subtidal band of Soft Brown Kelps off a Protected partially mobile beach in Larsen Bay.
KDKavi05_0713.jpg KDKavi05_4685.jpg *The suffix ‘11’ denotes bioarea KATM (Shelikof Strait).

3-18
The Stalked Dark Brown Kelps (CHB) Bioband
Zone Bioband Name
Database Label Colour Indicator Species Physical Description Exposure Associate
Species
B & C Stalked Dark Brown Kelps CHB10 *
Dark chocolate brown
Laminaria setchelli Saccharina
subsimplex Laminaria
yezoensis Lessoniopsis
littoralis Saccharina sessile
(smooth)
Found at higher wave exposures, these stalked kelps grow in the lower intertidal. Blades are leathery, shiny, and smooth. A mixture of species occurs at the moderate wave exposures, while single-species stands of Lessoniopsis occur at high exposures. The southwestern coast of Kodiak island seems to be lacking most of the CHB species.
SE-E
Cymathere sp. Pleurophycus sp. Costaria sp. Alaria sp. Neoptilota sp.
Three Pillar Point has a thick band of Stalked Dark Brown Kelps at the waterline with Barnacle and Green Algae biobands on the beach above.
This high Semi-Exposed platform near Cape Kostromitinof has a lush band of Stalked Dark Brown Kelps mixed with Alaria in the lower intertidal. A dense band of Bull Kelp is visible in the nearshore.
KDK02-11-31.jpg KDK02-26-15.jpg *The suffix ‘10’ denotes bioarea KODI (Kodiak Island).
3-19
Zone Bioband
Name Database
Label Colour Indicator Species Physical Description Exposure Associate Species
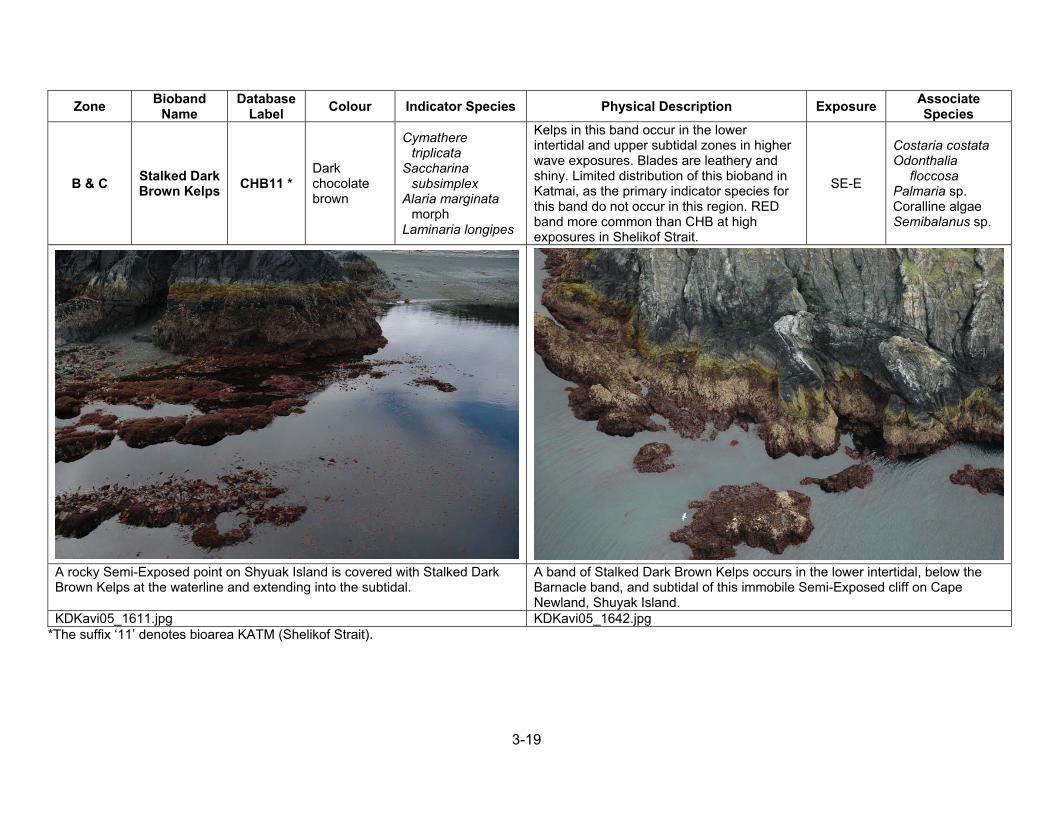
B & C Stalked Dark Brown Kelps CHB11 *
Dark chocolate brown
Cymathere triplicata
Saccharina subsimplex
Alaria marginata morph
Laminaria longipes
Kelps in this band occur in the lower intertidal and upper subtidal zones in higher wave exposures. Blades are leathery and shiny. Limited distribution of this bioband in Katmai, as the primary indicator species for this band do not occur in this region. RED band more common than CHB at high exposures in Shelikof Strait.
SE-E
Costaria costata Odonthalia
floccosa Palmaria sp. Coralline algae Semibalanus sp.
A rocky Semi-Exposed point on Shyuak Island is covered with Stalked Dark Brown Kelps at the waterline and extending into the subtidal.
A band of Stalked Dark Brown Kelps occurs in the lower intertidal, below the Barnacle band, and subtidal of this immobile Semi-Exposed cliff on Cape Newland, Shuyak Island.
KDKavi05_1611.jpg KDKavi05_1642.jpg *The suffix ‘11’ denotes bioarea KATM (Shelikof Strait).
3-20
The Eelgrass (ZOS) Bioband
Zone Bioband Name
Database Label Colour Indicator
Species Physical Description Exposure Associate Species
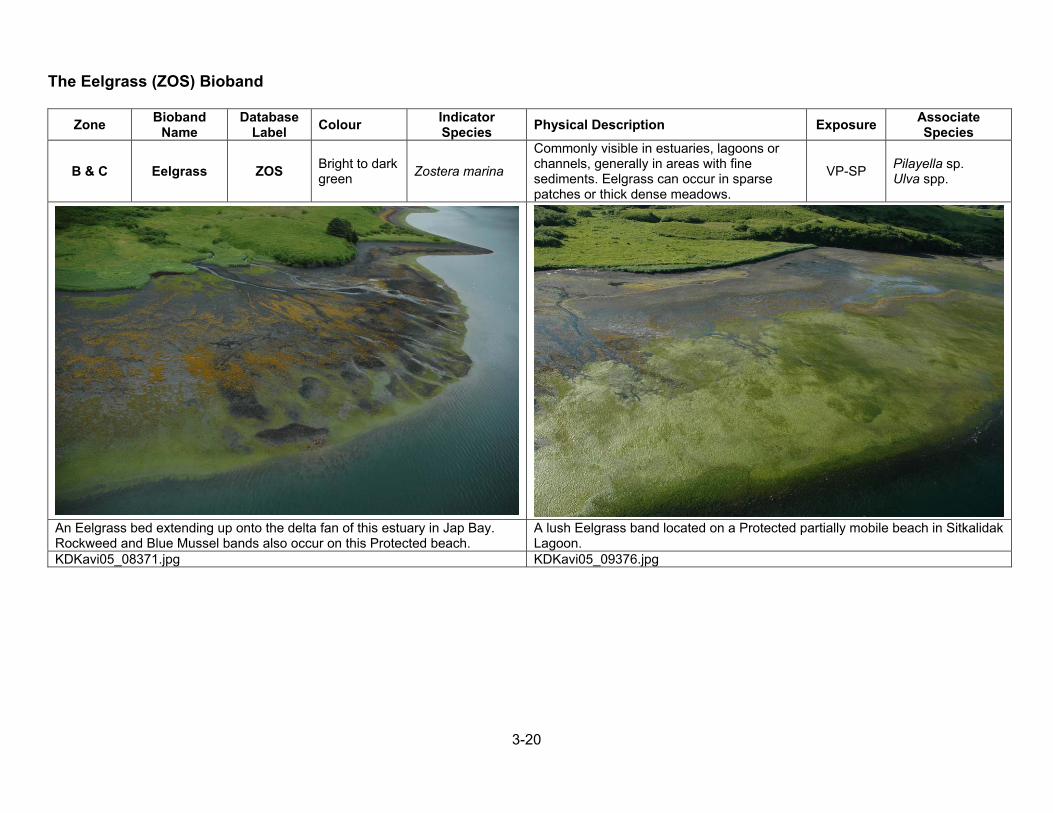
B & C Eelgrass ZOS Bright to dark green Zostera marina
Commonly visible in estuaries, lagoons or channels, generally in areas with fine sediments. Eelgrass can occur in sparse patches or thick dense meadows.
VP-SP Pilayella sp. Ulva spp.
An Eelgrass bed extending up onto the delta fan of this estuary in Jap Bay. Rockweed and Blue Mussel bands also occur on this Protected beach.
A lush Eelgrass band located on a Protected partially mobile beach in Sitkalidak Lagoon.
KDKavi05_08371.jpg KDKavi05_09376.jpg

3-21
The Dragon Kelp (ALF) Bioband
Zone Bioband Name
Database Label Colour Indicator
Species Physical Description Exposure Associate Species
C Dragon Kelp ALF Golden-brown Alaria fistulosa
Canopy-forming alga with very long blade and hollow floating midrib, found in nearshore habitats. If associated with NER, it occurs inshore of the bull kelp.
SP-E Alaria sp. Nereocystis
luetkeana
The Dragon Kelp forms a large dense canopy off this Semi-Exposed point in Wonder Bay, Shuyak Island.
The long, floating fronds of Dragon Kelp can be seen here in the nearshore subtidal of Wonder Bay on Shuyak Island.
KDKavi05_1261.jpg KDKavi05_1264.jpg

3-22
The Macrocystis (MAC) Bioband
Zone Bioband Name
Database Label Colour Indicator
Species Physical Description Exposure Associate Species
C Macrocystis MAC Golden-brown
Macrocystis integrifolia
Canopy-forming giant kelp, long stipes with multiple floats and fronds. If associated with NER, it occurs inshore of the bull kelp.
SP-SE
Nereocystis luetkeana
Alaria fistulosa
A large, dense bed of Macrocystis off a Semi-Protected partially mobile beach on Shuyak Island.
A small bed of Macrocystis off a Semi-Protected partially mobile beach on Shuyak Island.
KDKavi05_1421.jpg KDKavi05_1422.jpg *Note: Macrocystis is of very limited distribution in the Kodiak archipelago and most was observed in one bay on the southwest side of Shuyak Island, where these example photos were taken.
3-23
The Bull Kelp (NER) Bioband
Zone Bioband Name
Database Label Colour Indicator
Species Physical Description Exposure Associate Species
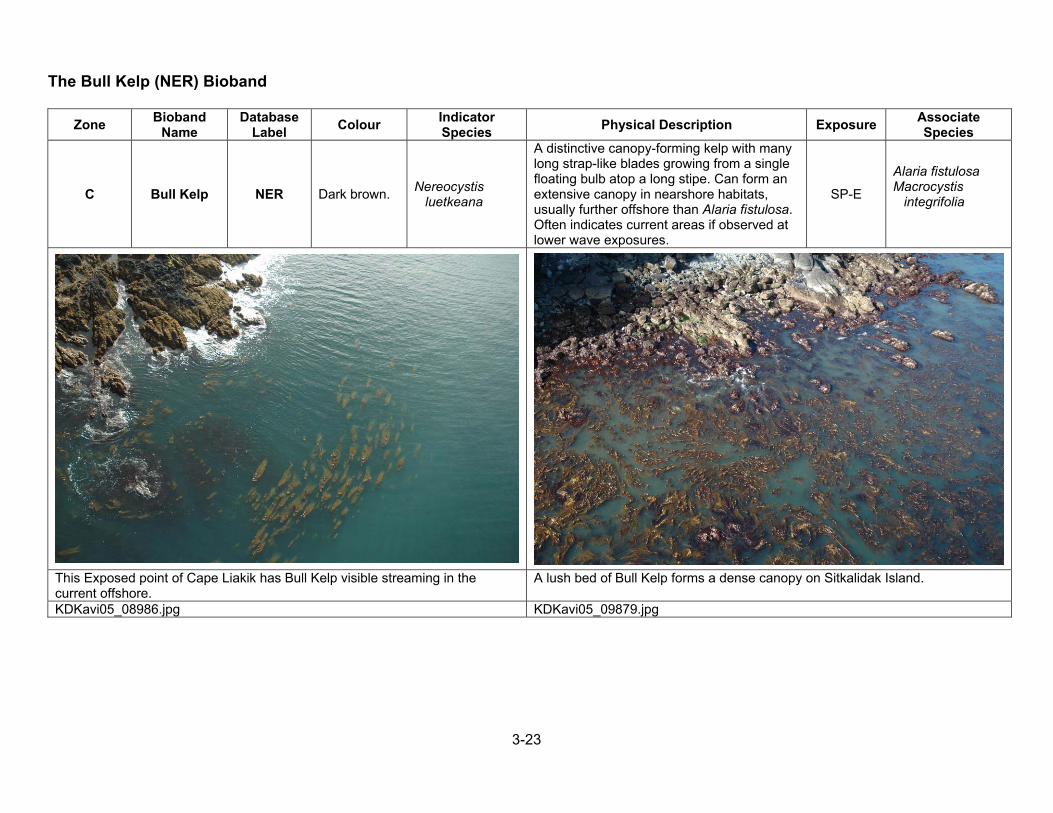
C Bull Kelp NER Dark brown. Nereocystis luetkeana
A distinctive canopy-forming kelp with many long strap-like blades growing from a single floating bulb atop a long stipe. Can form an extensive canopy in nearshore habitats, usually further offshore than Alaria fistulosa. Often indicates current areas if observed at lower wave exposures.
SP-E
Alaria fistulosa Macrocystis
integrifolia
This Exposed point of Cape Liakik has Bull Kelp visible streaming in the current offshore.
A lush bed of Bull Kelp forms a dense canopy on Sitkalidak Island.
KDKavi05_08986.jpg KDKavi05_09879.jpg
3-24
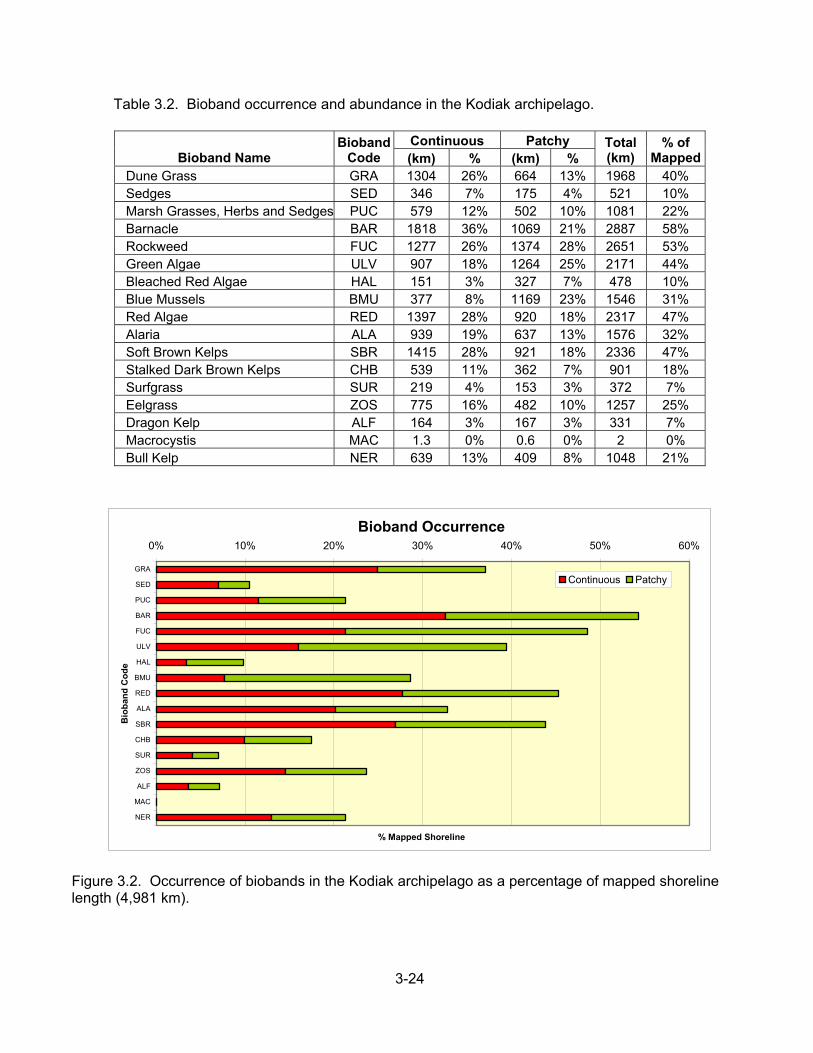
Table 3.2. Bioband occurrence and abundance in the Kodiak archipelago.
Continuous Patchy Bioband Name
Bioband Code (km) % (km) %
Total (km)
% of Mapped
Dune Grass GRA 1304 26% 664 13% 1968 40% Sedges SED 346 7% 175 4% 521 10% Marsh Grasses, Herbs and Sedges PUC 579 12% 502 10% 1081 22% Barnacle BAR 1818 36% 1069 21% 2887 58% Rockweed FUC 1277 26% 1374 28% 2651 53% Green Algae ULV 907 18% 1264 25% 2171 44% Bleached Red Algae HAL 151 3% 327 7% 478 10% Blue Mussels BMU 377 8% 1169 23% 1546 31% Red Algae RED 1397 28% 920 18% 2317 47% Alaria ALA 939 19% 637 13% 1576 32% Soft Brown Kelps SBR 1415 28% 921 18% 2336 47% Stalked Dark Brown Kelps CHB 539 11% 362 7% 901 18% Surfgrass SUR 219 4% 153 3% 372 7% Eelgrass ZOS 775 16% 482 10% 1257 25% Dragon Kelp ALF 164 3% 167 3% 331 7% Macrocystis MAC 1.3 0% 0.6 0% 2 0% Bull Kelp NER 639 13% 409 8% 1048 21%
Bioband Occurrence0% 10% 20% 30% 40% 50% 60%
GRA
SED
PUC
BAR
FUC
ULV
HAL
BMU
RED
ALA
SBR
CHB
SUR
ZOS
ALF
MAC
NER
Bio
band
Cod
e
% Mapped Shoreline
Continuous Patchy
Figure 3.2. Occurrence of biobands in the Kodiak archipelago as a percentage of mapped shoreline length (4,981 km).
3-25
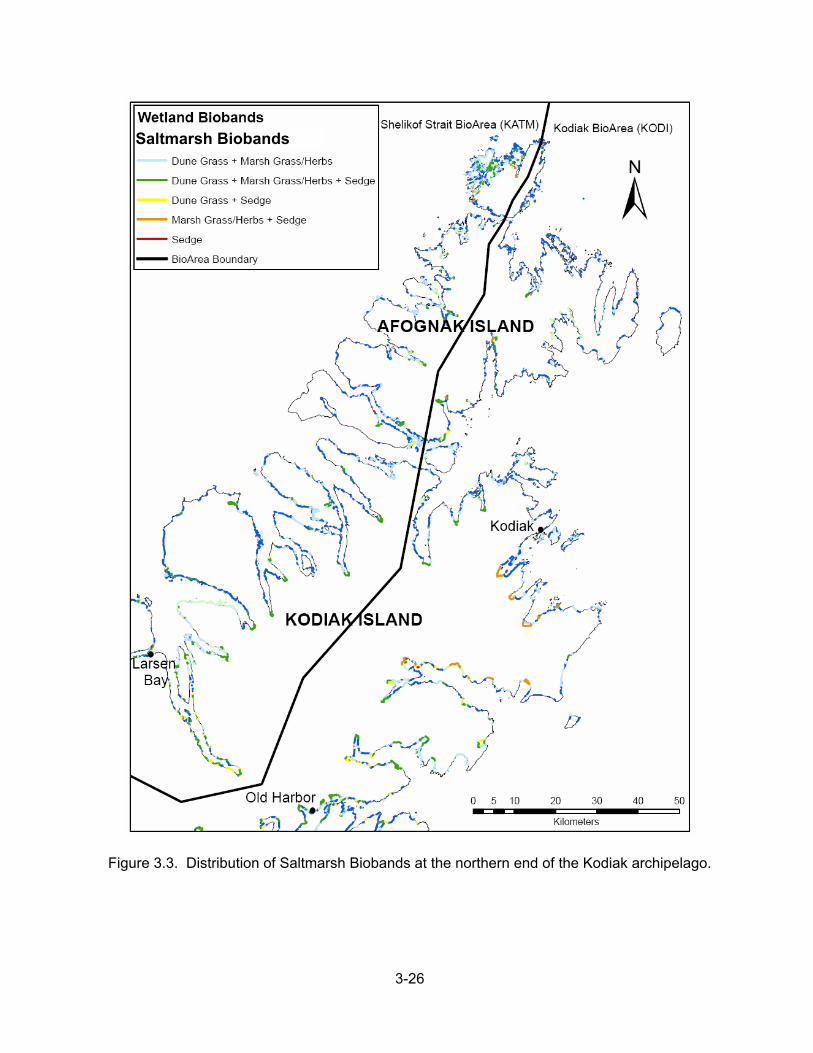
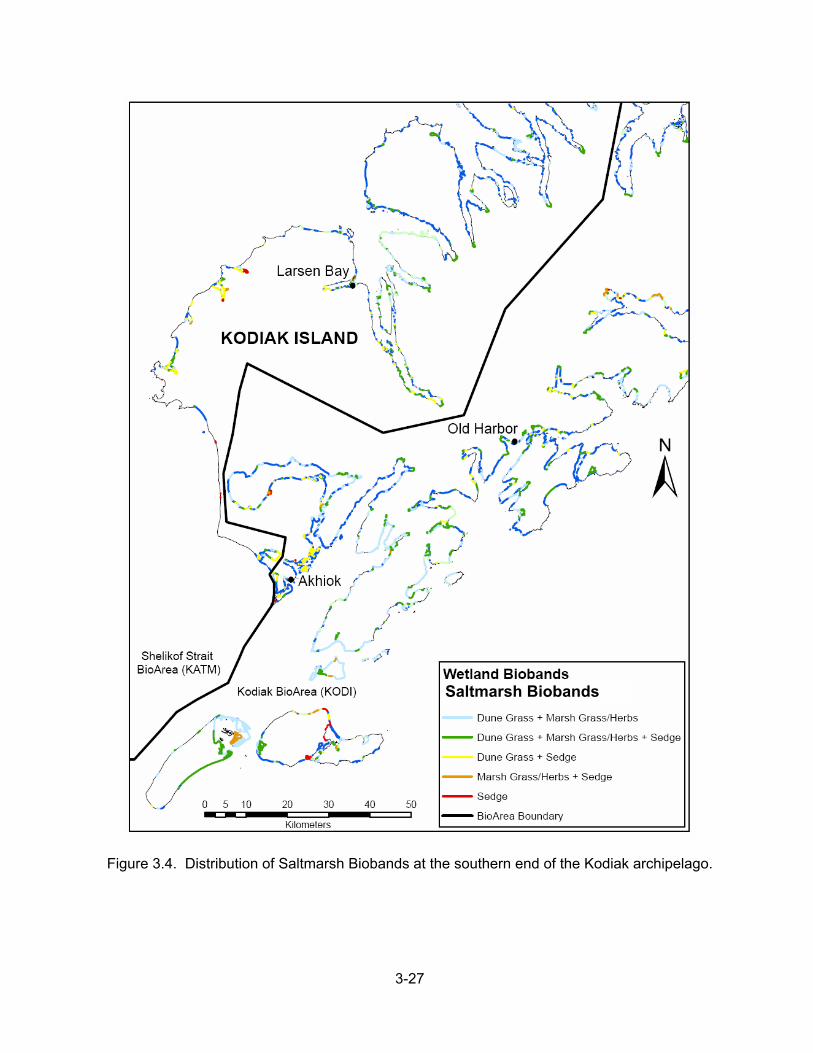
Distribution of Biobands The distributions of select biobands are mapped below in Figures 3.3 – 3.10 to illustrate regional differences observed in the Kodiak Archipelago. Combinations of the various biobands also act as indicators for the different biological wave exposures and habitat classes. Saltmarsh Biobands In biological ShoreZone mapping, combinations of the three biobands of salt-tolerant grasses and herbs (GRA, PUC, and SED) are used to define saltmarsh and estuary habitats. Shorelines where all three biobands co-occur are at the largest wetland complexes. Only the Dune Grass bioband occurs frequently without the other two salt-tolerant herb bands, usually in the log line of beaches, and not necessarily associated with estuaries. Saltmarsh biobands and combinations: 1. GRA – Dune Grass alone – good indicator of dunes on upper beach berms on mobile
beaches, or at narrow fringing salt marsh. 2. GRA + PUC – Dune Grass and Marsh Grasses/Herbs – good indicator of fringing salt
marsh or smaller salt marsh /estuary areas 3. GRA + PUC + SED – Dune Grass and Marsh Grasses/Herbs and Sedge – best
indicator of contiguous salt marsh /estuary areas 4. PUC – Marsh Grasses/Herbs – good indicator of fringing salt marsh or smaller salt
marsh /estuary areas 5. GRA + SED – Dune Grass and Sedge – good indicator of smaller salt marsh/estuary
areas 6. PUC + SED – Marsh Grasses/Herbs and Sedge – good indicator of smaller salt
marsh/estuary areas 7. SED – Sedge alone – good indicator of freshwater input, usually associated with
streams
3-26
Figure 3.3. Distribution of Saltmarsh Biobands at the northern end of the Kodiak archipelago.
Saltmarsh Biobands
3-27
Figure 3.4. Distribution of Saltmarsh Biobands at the southern end of the Kodiak archipelago.
Saltmarsh Biobands
3-28
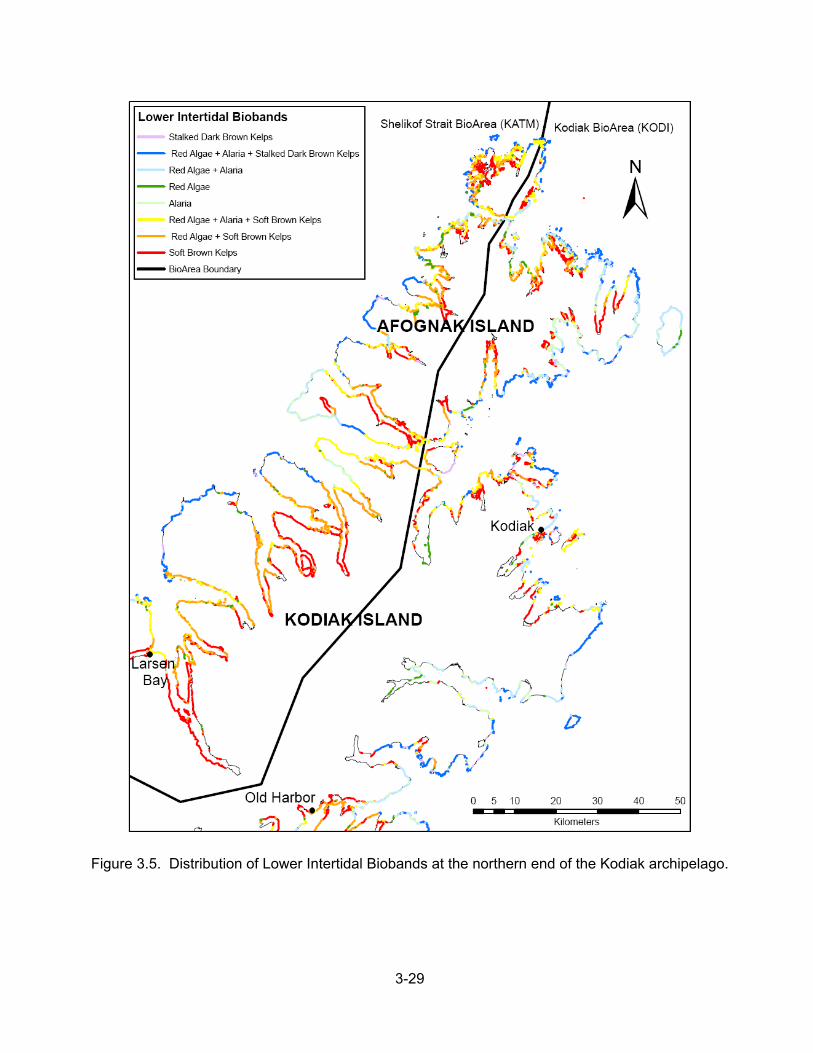
Combinations of Lower Intertidal Biobands The combination of the lower intertidal biobands (RED – Red Algae; ALA – Alaria; SBR – Soft Brown Kelps; and CHB – Stalked Dark Brown Kelps) is the most diagnostic of differences between wave exposures and between regions, and represent the gradation in wave exposure across the area. The bioband combinations mapped in these figures are: 1. CHB – Stalked Dark Brown Kelps – good indicator of Exposed 2. CHB + RED – Stalked Dark Brown Kelps and Red Algae – good indicator of Exposed 3. CHB + ALA + RED – Stalked Dark Brown Kelps and Alaria and Red Algae – good
indicator of Semi-Exposed to low Exposed 4. CHB + ALA – Stalked Dark Brown Kelps and Alaria – good indicator of Semi-Exposed
to low Exposed 5. ALA + RED – Alaria and Red Algae – good indicator of Semi-Exposed to high Semi-
Protected 6. RED – Red Algae – good indicator of Semi-Protected 7. ALA – Alaria – good indicator of Semi-Exposed to high Semi-Protected 8. ALA + SBR – Alaria and Soft Brown Kelps – good indicator of high Semi-Protected 9. ALA + SBR + RED – Alaria and Soft Brown Kelps and Red Algae – good indicator of
high Semi-Protected to low Semi-Exposed 10. SBR + RED – Soft Brown Kelps and Red Algae – good indicator of Semi-Protected 11. SBR – Soft Brown Kelps– good indicator of Semi-Protected
3-29
Figure 3.5. Distribution of Lower Intertidal Biobands at the northern end of the Kodiak archipelago.
3-30
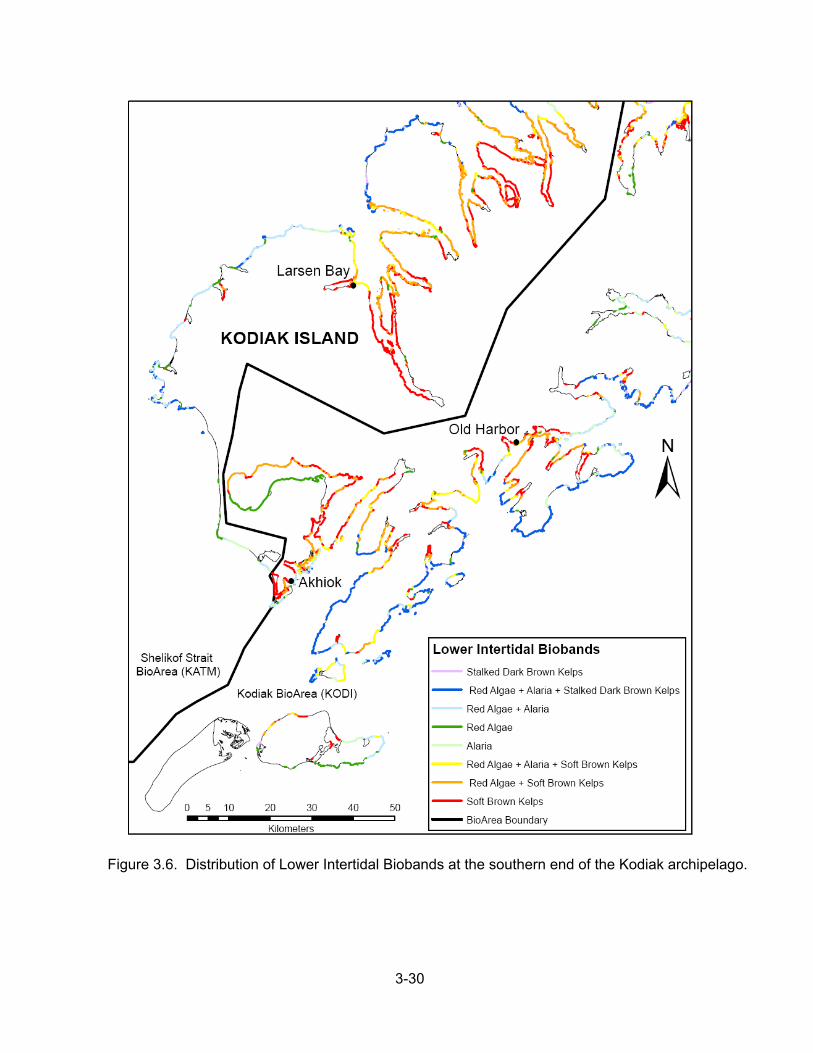
Figure 3.6. Distribution of Lower Intertidal Biobands at the southern end of the Kodiak archipelago.
3-31
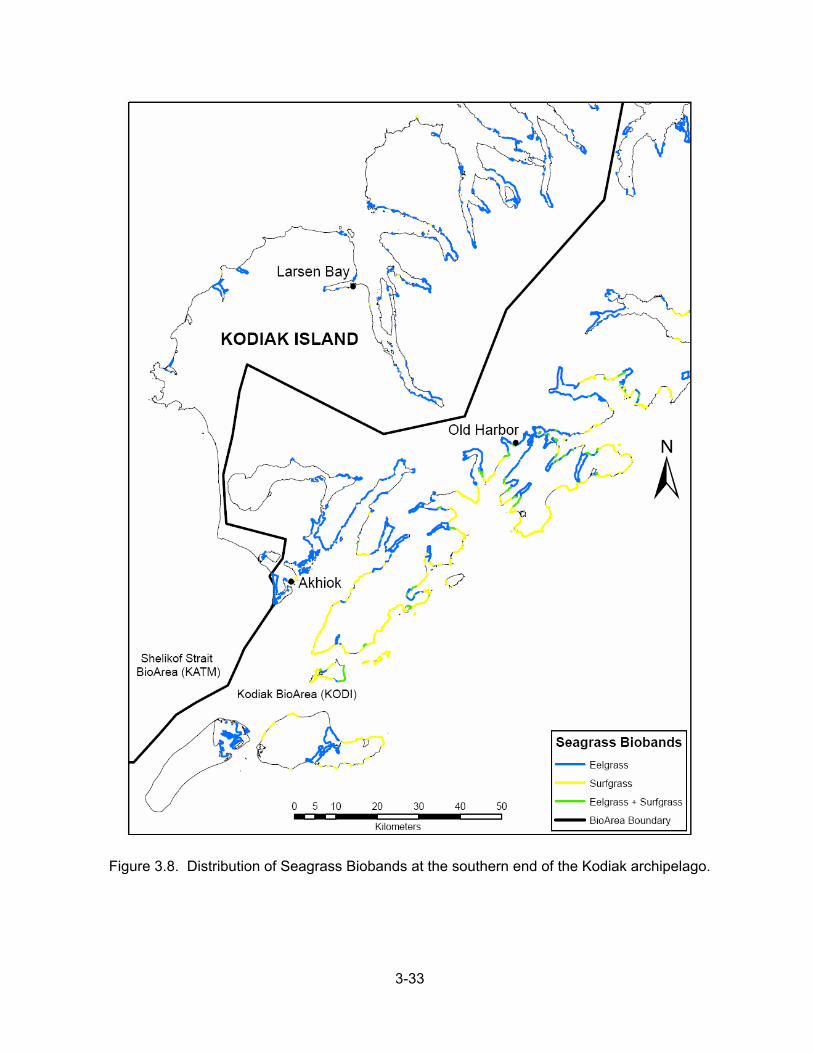
Seagrass Biobands The two species of seagrasses (ZOS – Eelgrass and SUR – Surfgrass) have different energy tolerances. Eelgrass is found in the lower to moderate energy wave exposures on sandy substrate, while Surfgrass is found in moderate to higher energy wave exposures on stable substrate. The regional differences in seagrass distribution in the Kodiak archipelago are striking. While Eelgrass is abundant at lower wave exposures in both bioareas, Surfgrass is only present in the more exposed areas of outer coast in the Kodiak bioareas. Very few units had a co-occurrence of both seagrass bands (Eelgrass and Surfgrass).

3-32
Figure 3.7. Distribution of Seagrass Biobands at the northern end of the Kodiak archipelago.
3-33
Figure 3.8. Distribution of Seagrass Biobands at the southern end of the Kodiak archipelago.
3-34
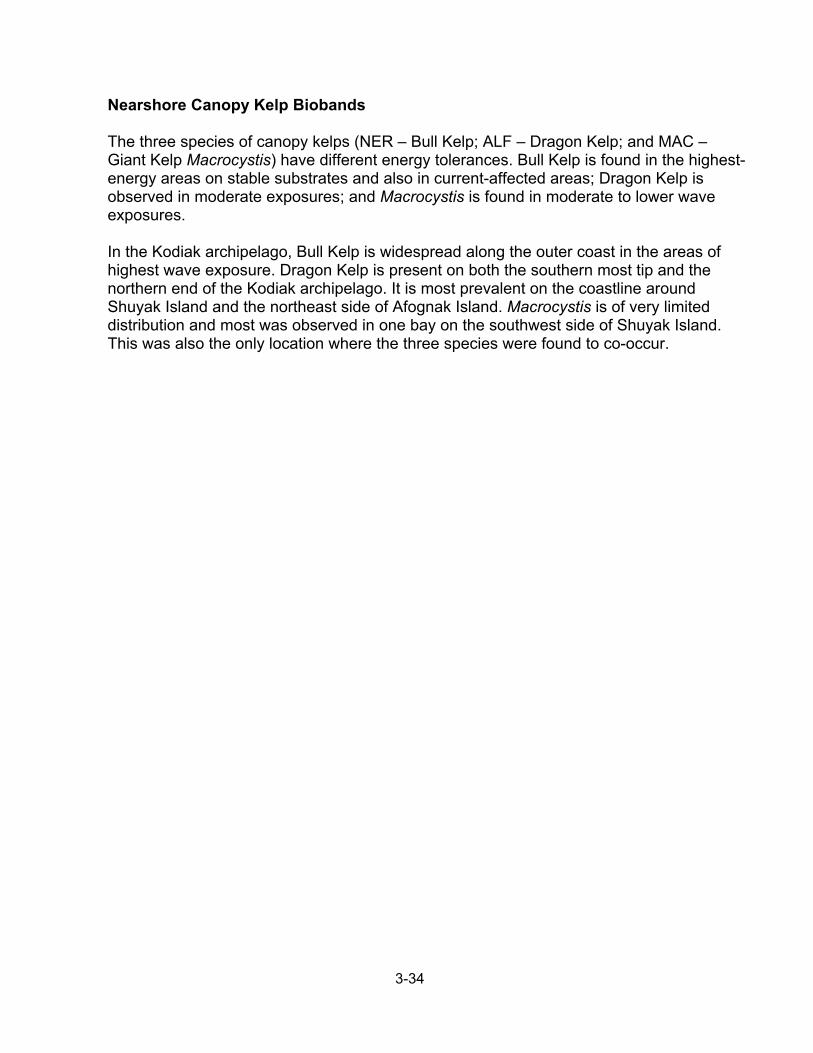
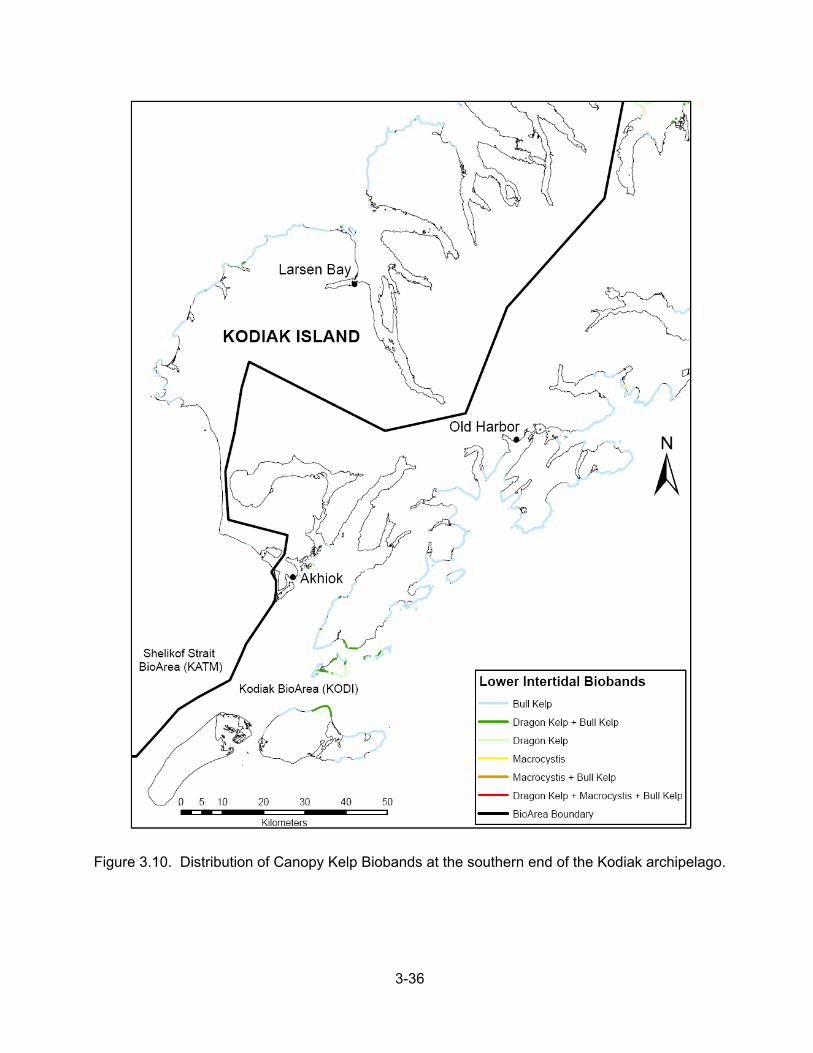
Nearshore Canopy Kelp Biobands The three species of canopy kelps (NER – Bull Kelp; ALF – Dragon Kelp; and MAC – Giant Kelp Macrocystis) have different energy tolerances. Bull Kelp is found in the highest-energy areas on stable substrates and also in current-affected areas; Dragon Kelp is observed in moderate exposures; and Macrocystis is found in moderate to lower wave exposures. In the Kodiak archipelago, Bull Kelp is widespread along the outer coast in the areas of highest wave exposure. Dragon Kelp is present on both the southern most tip and the northern end of the Kodiak archipelago. It is most prevalent on the coastline around Shuyak Island and the northeast side of Afognak Island. Macrocystis is of very limited distribution and most was observed in one bay on the southwest side of Shuyak Island. This was also the only location where the three species were found to co-occur.

3-35
Figure 3.9. Distribution of Canopy Kelp Biobands at the northern end of the Kodiak archipelago.
3-36
Figure 3.10. Distribution of Canopy Kelp Biobands at the southern end of the Kodiak archipelago.
3-37
3.2 Biological Wave Exposure Biological Wave Exposure is a summary attribute that is interpreted during biological mapping from observations of the presence and abundance of biota in each alongshore unit (“EXP_BIO” in the database). It is considered the most representative index of actual wave exposure. Wave exposure categories range from Very Protected (VP) to Very Exposed (VE) and are defined on the basis of a set of indicator species and a “typical” set of biobands. The six categories and codes are the same as those used in the physical ShoreZone mapping to characterize wave exposure of an alongshore unit on the basis of fetch window estimates and coastal geomorphology (“EXP_OBSER” in the UNIT table of the database). Wave energy tolerances of the species assemblages that comprise the ShoreZone biobands are known from scientific literature and expert knowledge. Some biobands are observed in all wave exposure categories and are considered “associated species” bands (e.g. the Barnacle band (BAR)), while other biobands are considered “indicators” because they are closely associated with particular wave exposures. For example, the Stalked Dark Brown Kelps band (CHB) is consistently associated with higher wave exposures (Semi-Exposed to Exposed). Species and biobands listed for each wave exposure category are considered “typical” but not “obligate.” That is, not all species occur in every unit classified with a particular biological wave exposure. The combination of biobands, indicator species, and interpretation by biological mappers determines the wave exposure category for each unit. Typical indicator and associated species and biobands are summarized for each Biological Wave Exposure category from mapped areas in Kodiak with example illustrations in Tables 3.3 through 3.6 and in Figures 3.11 through 3.14. A summary map of the distribution of biological wave exposure in the 2002 and 2005 mapped areas of Kodiak is shown in Figure 3.15. The “Very Exposed” category has not been applied in biological mapping of Kodiak although it has been mapped on the Outer Kenai coast, in Kenai Fjords National Park, and on the southwest coast of Moresby Island, British Columbia. An extensive shore station survey was completed in Kodiak in May and June 2005. The information collected from the 113 stations surveyed was used in this report to add qualitative descriptions to bioband definitions and to fill out the list of species associated with each bioband.
3-38
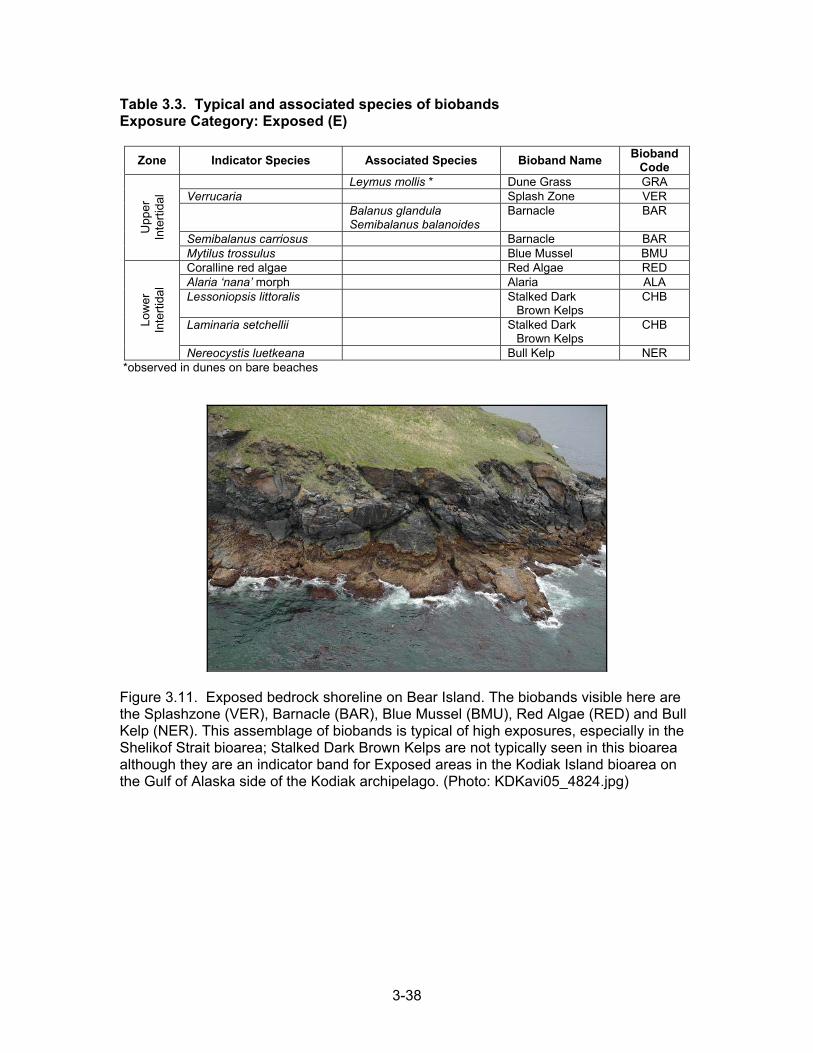
Table 3.3. Typical and associated species of biobands Exposure Category: Exposed (E)
Zone Indicator Species Associated Species Bioband Name Bioband Code
Leymus mollis * Dune Grass GRA Verrucaria Splash Zone VER Balanus glandula
Semibalanus balanoides Barnacle BAR
Semibalanus carriosus Barnacle BAR
Upp
er
Inte
rtida
l
Mytilus trossulus Blue Mussel BMU Coralline red algae Red Algae RED Alaria ‘nana’ morph Alaria ALA Lessoniopsis littoralis Stalked Dark
Brown Kelps CHB
Laminaria setchellii Stalked Dark Brown Kelps
CHB Low
er
Inte
rtida
l
Nereocystis luetkeana Bull Kelp NER *observed in dunes on bare beaches
Figure 3.11. Exposed bedrock shoreline on Bear Island. The biobands visible here are the Splashzone (VER), Barnacle (BAR), Blue Mussel (BMU), Red Algae (RED) and Bull Kelp (NER). This assemblage of biobands is typical of high exposures, especially in the Shelikof Strait bioarea; Stalked Dark Brown Kelps are not typically seen in this bioarea although they are an indicator band for Exposed areas in the Kodiak Island bioarea on the Gulf of Alaska side of the Kodiak archipelago. (Photo: KDKavi05_4824.jpg)
3-39
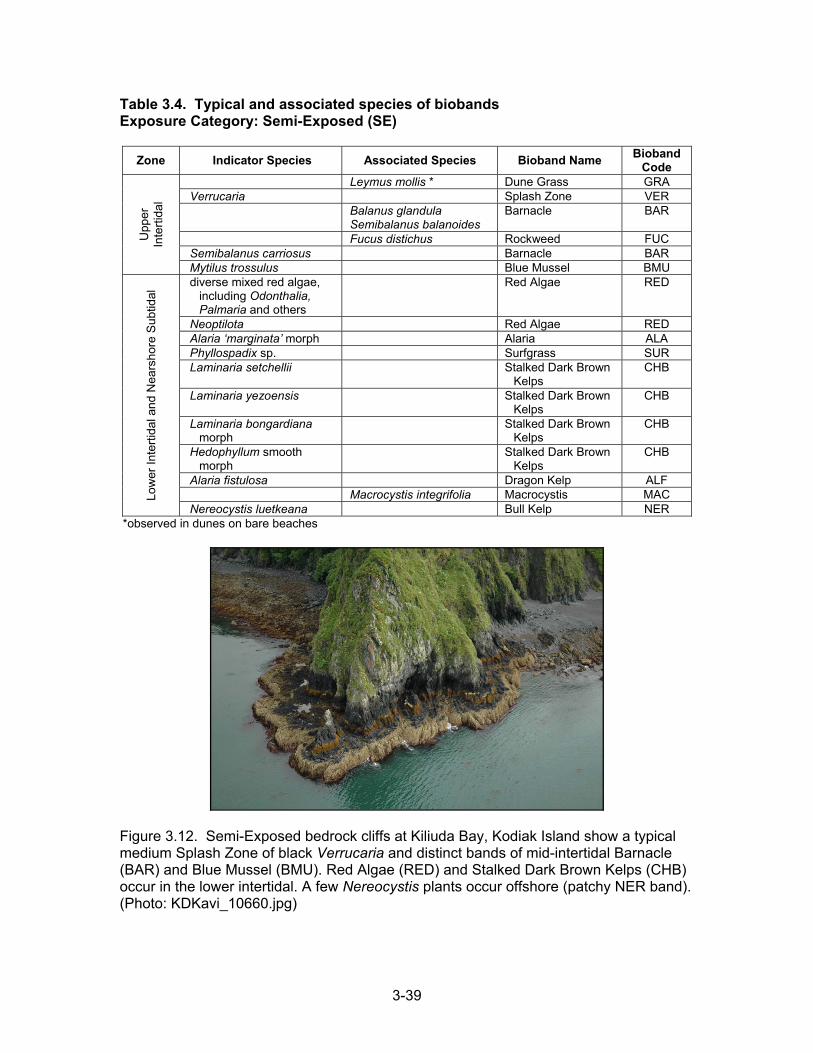
Table 3.4. Typical and associated species of biobands Exposure Category: Semi-Exposed (SE)
Zone Indicator Species Associated Species Bioband Name Bioband
Code Leymus mollis * Dune Grass GRA
Verrucaria Splash Zone VER Balanus glandula
Semibalanus balanoides Barnacle BAR
Fucus distichus Rockweed FUC Semibalanus carriosus Barnacle BAR
Upp
er
Inte
rtida
l
Mytilus trossulus Blue Mussel BMU diverse mixed red algae,
including Odonthalia, Palmaria and others
Red Algae RED
Neoptilota Red Algae RED Alaria ‘marginata’ morph Alaria ALA Phyllospadix sp. Surfgrass SUR Laminaria setchellii Stalked Dark Brown
Kelps CHB
Laminaria yezoensis Stalked Dark Brown Kelps
CHB
Laminaria bongardiana morph
Stalked Dark Brown Kelps
CHB
Hedophyllum smooth morph
Stalked Dark Brown Kelps
CHB
Alaria fistulosa Dragon Kelp ALF Macrocystis integrifolia Macrocystis MAC Lo
wer
Inte
rtida
l and
Nea
rsho
re S
ubtid
al
Nereocystis luetkeana Bull Kelp NER *observed in dunes on bare beaches
Figure 3.12. Semi-Exposed bedrock cliffs at Kiliuda Bay, Kodiak Island show a typical medium Splash Zone of black Verrucaria and distinct bands of mid-intertidal Barnacle (BAR) and Blue Mussel (BMU). Red Algae (RED) and Stalked Dark Brown Kelps (CHB) occur in the lower intertidal. A few Nereocystis plants occur offshore (patchy NER band). (Photo: KDKavi_10660.jpg)

3-40
Table 3.5. Typical and associated species of biobands Exposure Category: Semi-Protected (SP)
Zone Indicator species Associated Species Bioband Name Bioband
Code Leymus mollis * Dune Grass GRA Carex spp. * Sedges SED Puccinellia * Marsh Grasses,
Herbs and Sedges PUC
Triglochin * Marsh Grasses, Herbs and Sedges
PUC
Plantago maritima * Marsh Grasses, Herbs and Sedges
PUC
Upp
er
Inte
rtida
l
Verrucaria Splash Zone VER Balanus glandula
Semibalanus balanoides Barnacle BAR
Semibalanus carriosus Barnacle BAR Fucus distichus Rockweed FUC Mytilus trossulus Blue Mussels BMU Ulva and other foliose
green algae Green Algae ULV
Palmeria sp. (bleached) Bleached Red Algae
HAL
Mixed red algae including Odonthalia
Red Algae RED
Alaria ‘marginata’ morph Alaria ALA Zostera marina Eelgrass ZOS Cystoseira sp. Soft Brown Kelps SBR Cymathere sp. Soft Brown Kelps SBR Saccharina latissima Soft Brown Kelps SBR
Low
er In
terti
dal a
nd N
ears
hore
Sub
tidal
Nereocystis luetkeana Bull Kelp NER *associated with Wetland/ Estuary areas at this wave exposure
Figure 3.13. Golden brown Fucus (Rockweed band (FUC)) mixed with Barnacle (BAR), Bleached Red Algae (HAL), Blue Mussel (BMU) and Soft Brown Kelps (SBR), blankets this platform in Deadman Bay on Moser Peninsula showing a typical lush Semi-Protected area. (Photo: KDKavi05_06591.jpg)
3-41
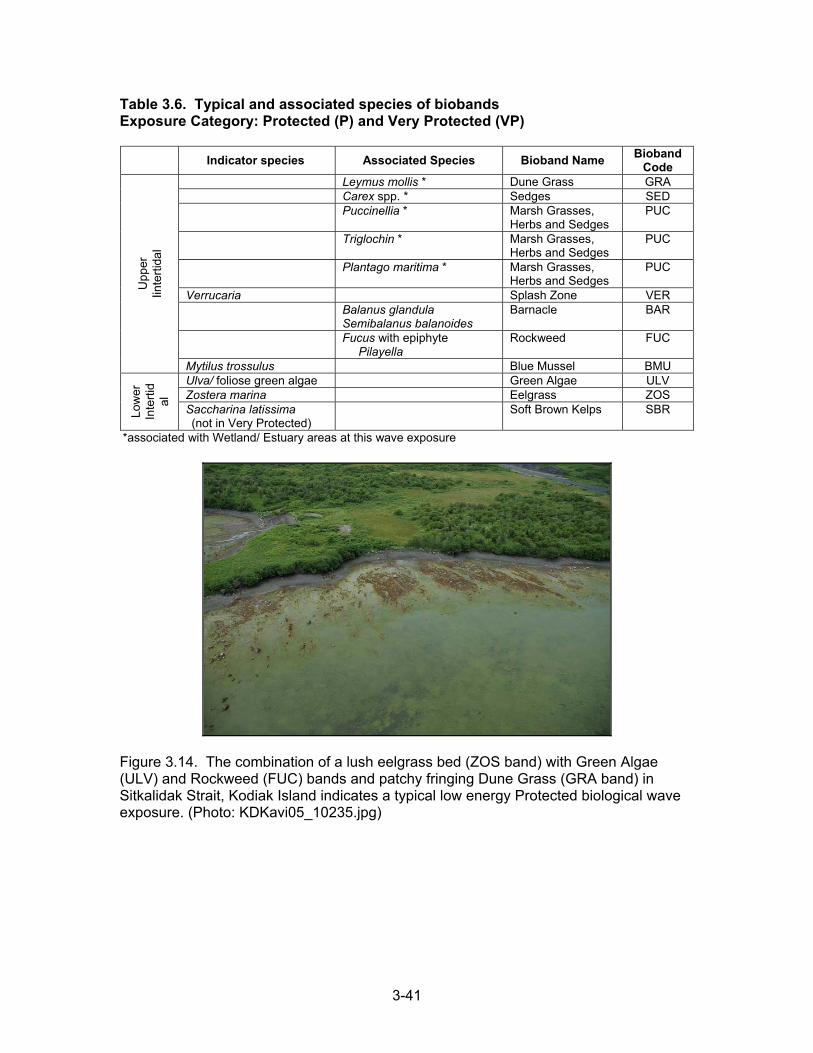
Table 3.6. Typical and associated species of biobands Exposure Category: Protected (P) and Very Protected (VP)
Indicator species Associated Species Bioband Name Bioband
Code Leymus mollis * Dune Grass GRA Carex spp. * Sedges SED Puccinellia * Marsh Grasses,
Herbs and Sedges PUC
Triglochin * Marsh Grasses, Herbs and Sedges
PUC
Plantago maritima * Marsh Grasses, Herbs and Sedges
PUC
Verrucaria Splash Zone VER Balanus glandula
Semibalanus balanoides Barnacle BAR
Fucus with epiphyte Pilayella
Rockweed FUC
Upp
er
Iinte
rtida
l
Mytilus trossulus Blue Mussel BMU Ulva/ foliose green algae Green Algae ULV Zostera marina Eelgrass ZOS
Low
er
Inte
rtid
al
Saccharina latissima (not in Very Protected)
Soft Brown Kelps SBR
*associated with Wetland/ Estuary areas at this wave exposure
Figure 3.14. The combination of a lush eelgrass bed (ZOS band) with Green Algae (ULV) and Rockweed (FUC) bands and patchy fringing Dune Grass (GRA band) in Sitkalidak Strait, Kodiak Island indicates a typical low energy Protected biological wave exposure. (Photo: KDKavi05_10235.jpg)
3-42
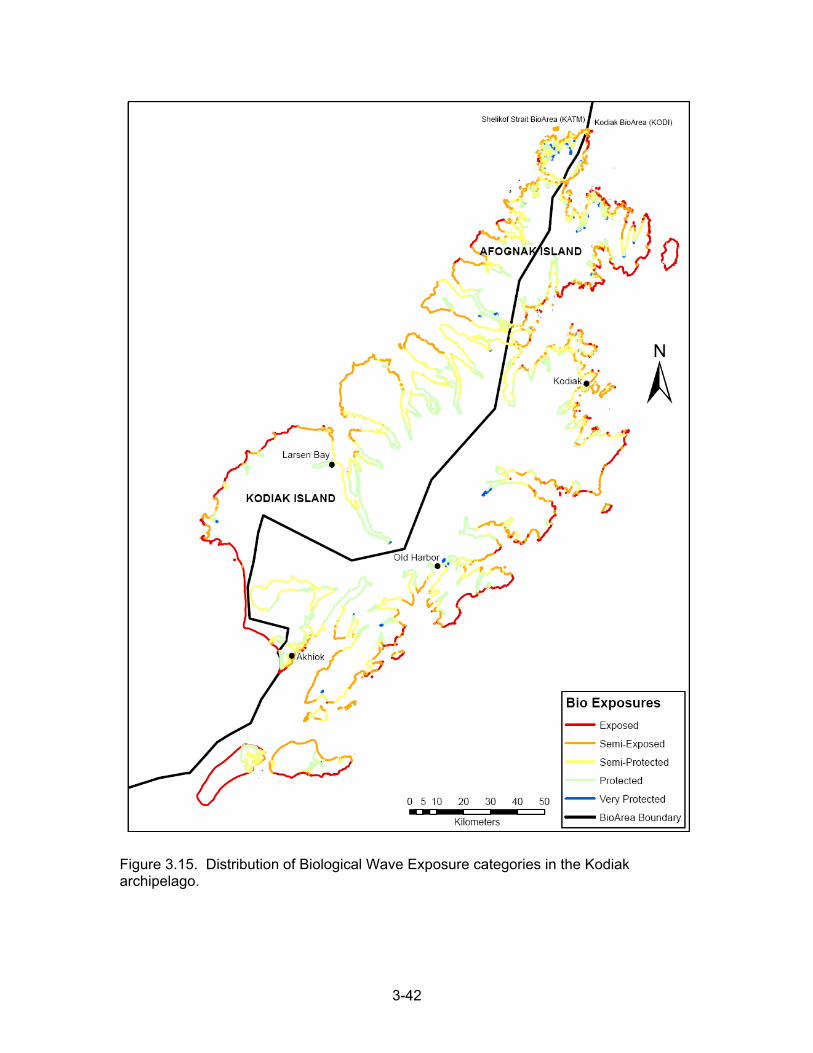
Figure 3.15. Distribution of Biological Wave Exposure categories in the Kodiak archipelago.
3-43
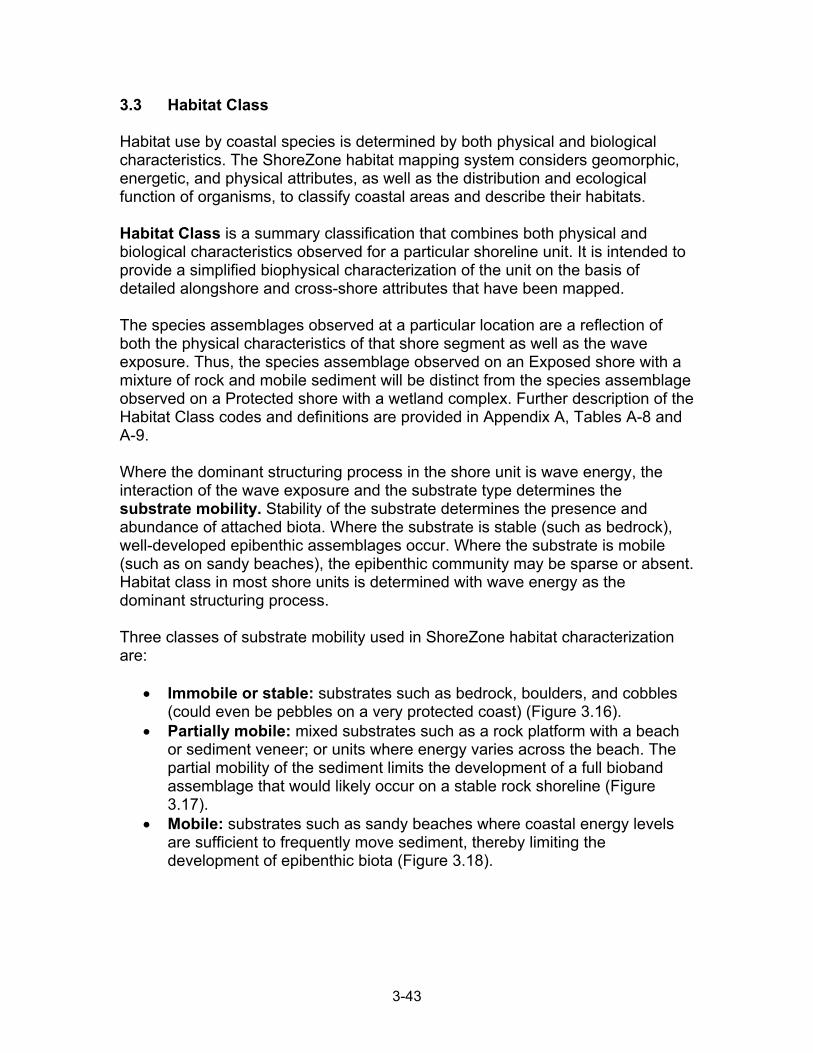
3.3 Habitat Class Habitat use by coastal species is determined by both physical and biological characteristics. The ShoreZone habitat mapping system considers geomorphic, energetic, and physical attributes, as well as the distribution and ecological function of organisms, to classify coastal areas and describe their habitats. Habitat Class is a summary classification that combines both physical and biological characteristics observed for a particular shoreline unit. It is intended to provide a simplified biophysical characterization of the unit on the basis of detailed alongshore and cross-shore attributes that have been mapped. The species assemblages observed at a particular location are a reflection of both the physical characteristics of that shore segment as well as the wave exposure. Thus, the species assemblage observed on an Exposed shore with a mixture of rock and mobile sediment will be distinct from the species assemblage observed on a Protected shore with a wetland complex. Further description of the Habitat Class codes and definitions are provided in Appendix A, Tables A-8 and A-9. Where the dominant structuring process in the shore unit is wave energy, the interaction of the wave exposure and the substrate type determines the substrate mobility. Stability of the substrate determines the presence and abundance of attached biota. Where the substrate is stable (such as bedrock), well-developed epibenthic assemblages occur. Where the substrate is mobile (such as on sandy beaches), the epibenthic community may be sparse or absent. Habitat class in most shore units is determined with wave energy as the dominant structuring process. Three classes of substrate mobility used in ShoreZone habitat characterization are:
• Immobile or stable: substrates such as bedrock, boulders, and cobbles (could even be pebbles on a very protected coast) (Figure 3.16).
• Partially mobile: mixed substrates such as a rock platform with a beach or sediment veneer; or units where energy varies across the beach. The partial mobility of the sediment limits the development of a full bioband assemblage that would likely occur on a stable rock shoreline (Figure 3.17).
• Mobile: substrates such as sandy beaches where coastal energy levels are sufficient to frequently move sediment, thereby limiting the development of epibenthic biota (Figure 3.18).
3-44
Less common Habitat Classes are those determined by dominant structuring processes other than wave energy (Appendix A, Table A-9). These other habitat classes have only limited occurrence along the coast and, except for the anthropogenic shorelines, are also highly valued habitats. These habitat types are:
• Estuary types with wetlands and marsh vegetation along low energy sediment shores influenced by freshwater (Figure 3.19).
• Current-Dominated channels where high tidal currents create anomalous assemblages of biota. Usually associated with lower wave exposure conditions in adjacent shore units (Figure 3.20).
• Anthropogenic Features where the shoreline has been modified or disturbed. Examples include wharves or areas of rip rap or fill (Figure 3.21).
• Lagoon units have enclosed or constricted area of brackish or salty water, often found in the supratidal; however, sometimes large shallow lagoons form the subtidal zone to multiple units (Figure 3.22). Lagoons were mapped only as ‘secondary habitat classes’.
The occurrence of fifteen generalized Habitat Classes is summarized for mapped areas of Kodiak archipelago in Table 3.7. Nearly half of the mapped area was Partially Mobile, Protected, or Semi-Protected wave exposures (40%) and nearly one fifth of Kodiak was classified as Mobile (19%). Because Kodiak has a relatively sparse population, less than 1% of the shoreline was mapped with Anthropogenic Features. Higher wave exposure habitats made up about a third of the mapped area (36%). Summary maps of the distribution of Habitat Classes mapped in Kodiak are shown in Figures 3.23 and 3.24.

3-45
Figure 3.16. Example of the immobile, semi-exposed habitat class on Bear Island. The bedrock cliff has a dense cover of biobands, including: Barnacles, Blue Mussel, Red Algae, and Alaria. (Photo: KDKavi05_4823.jpg)
Figure 3.17. Partially mobile, semi-exposed shoreline in Uyak Bay, showing dense cover of biota on the stable bedrock platform, with bare, mobile sediment on adjacent beaches. (Photo: KDKavi05_4603.jpg)

3-46
Figure 3.18. Mobile, semi-exposed beach in Zachar Bay, bare of attached biota. (Photo: KDKavi05_4080.jpg)
Figure 3.19. Estuary habitat class in Portage Bay. Wetland grasses cover a large area in the supratidal, while the delta fan has a sparse cover of Fucus (rockweed) and Zostera (eelgrass) biobands. (Photo: KDKavi05_06914.jpg)
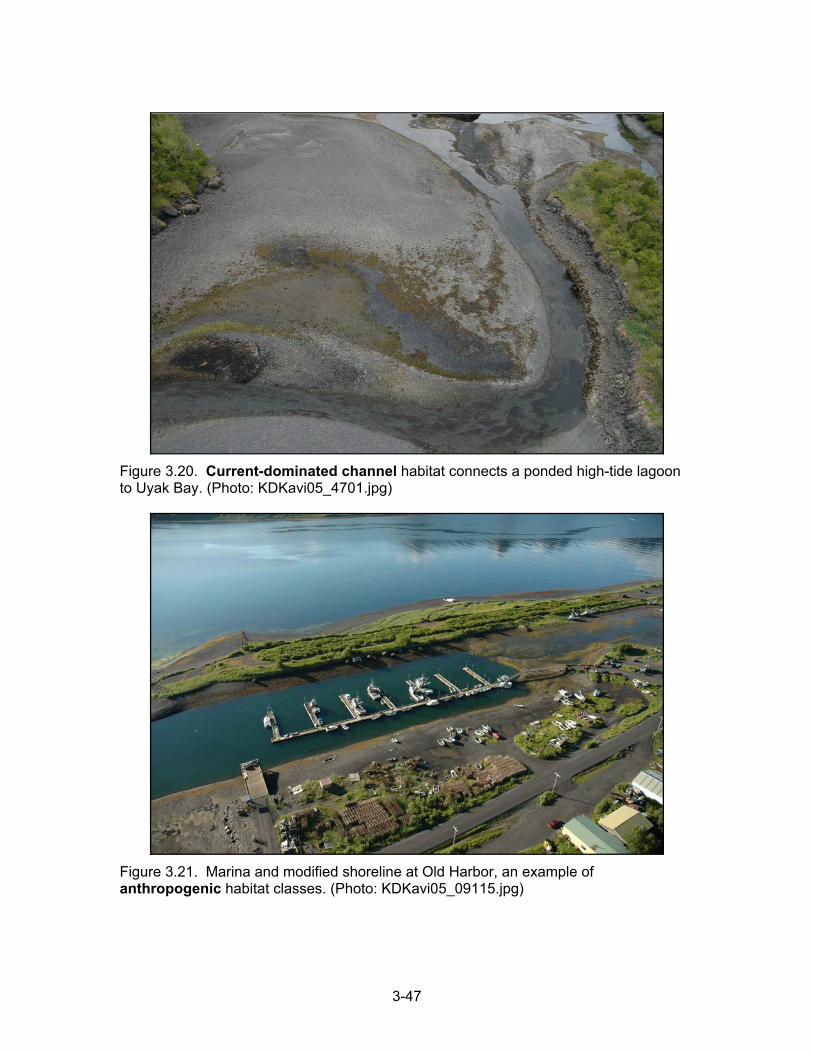
3-47
Figure 3.20. Current-dominated channel habitat connects a ponded high-tide lagoon to Uyak Bay. (Photo: KDKavi05_4701.jpg)
Figure 3.21. Marina and modified shoreline at Old Harbor, an example of anthropogenic habitat classes. (Photo: KDKavi05_09115.jpg)

3-48
Figure 3.22. Backshore brackish lagoon in Uyak Bay, an example of a shore unit where the lagoon secondary habitat class was mapped. (Photo: KDKavi05_4014.jpg)
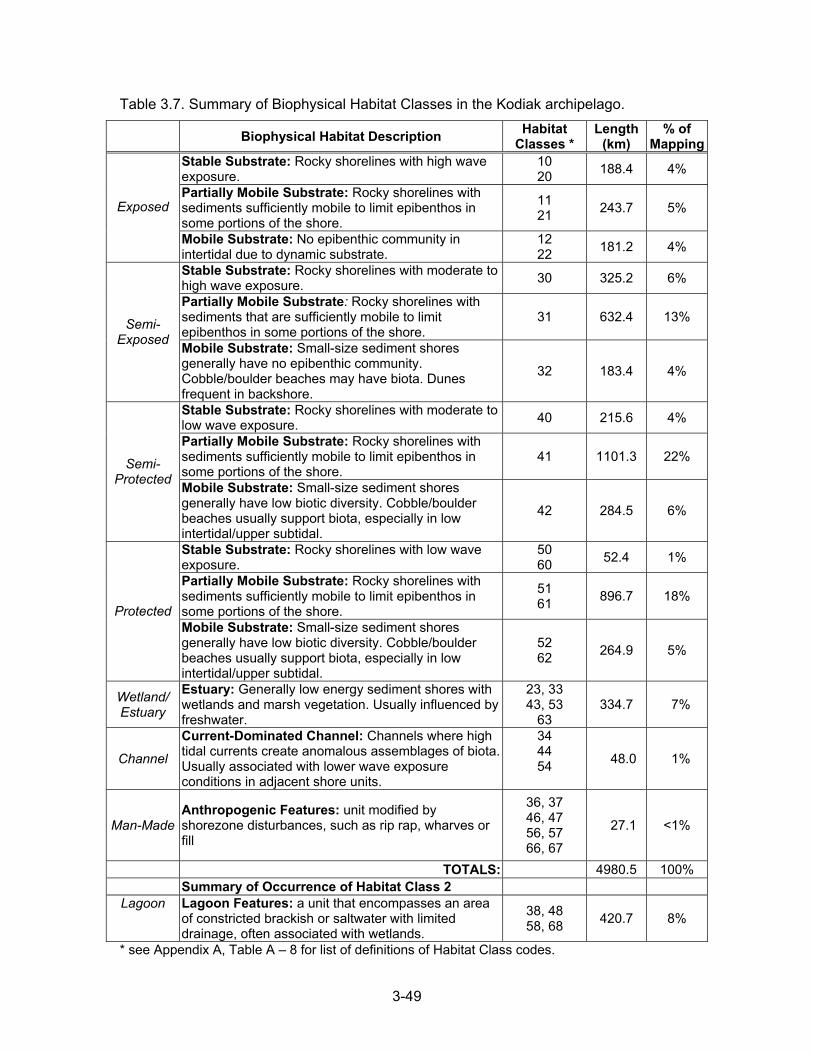
3-49
Table 3.7. Summary of Biophysical Habitat Classes in the Kodiak archipelago.
Biophysical Habitat Description Habitat Classes *
Length (km)
% of Mapping
Stable Substrate: Rocky shorelines with high wave exposure.
10 20 188.4 4%
Partially Mobile Substrate: Rocky shorelines with sediments sufficiently mobile to limit epibenthos in some portions of the shore.
11 21 243.7 5% Exposed
Mobile Substrate: No epibenthic community in intertidal due to dynamic substrate.
12 22 181.2 4%
Stable Substrate: Rocky shorelines with moderate to high wave exposure. 30 325.2 6%
Partially Mobile Substrate: Rocky shorelines with sediments that are sufficiently mobile to limit epibenthos in some portions of the shore.
31 632.4 13% Semi-Exposed Mobile Substrate: Small-size sediment shores
generally have no epibenthic community. Cobble/boulder beaches may have biota. Dunes frequent in backshore.
32 183.4 4%
Stable Substrate: Rocky shorelines with moderate to low wave exposure. 40 215.6 4%
Partially Mobile Substrate: Rocky shorelines with sediments sufficiently mobile to limit epibenthos in some portions of the shore.
41 1101.3 22% Semi-Protected Mobile Substrate: Small-size sediment shores
generally have low biotic diversity. Cobble/boulder beaches usually support biota, especially in low intertidal/upper subtidal.
42 284.5 6%
Stable Substrate: Rocky shorelines with low wave exposure.
50 60 52.4 1%
Partially Mobile Substrate: Rocky shorelines with sediments sufficiently mobile to limit epibenthos in some portions of the shore.
51 61 896.7 18%
Protected Mobile Substrate: Small-size sediment shores generally have low biotic diversity. Cobble/boulder beaches usually support biota, especially in low intertidal/upper subtidal.
52 62 264.9 5%
Wetland/ Estuary
Estuary: Generally low energy sediment shores with wetlands and marsh vegetation. Usually influenced by freshwater.
23, 33 43, 53
63 334.7 7%
Channel
Current-Dominated Channel: Channels where high tidal currents create anomalous assemblages of biota. Usually associated with lower wave exposure conditions in adjacent shore units.
34 44 54
48.0 1%
Man-Made Anthropogenic Features: unit modified by shorezone disturbances, such as rip rap, wharves or fill
36, 37 46, 47 56, 57 66, 67
27.1 <1%
TOTALS: 4980.5 100% Summary of Occurrence of Habitat Class 2
Lagoon Lagoon Features: a unit that encompasses an area of constricted brackish or saltwater with limited drainage, often associated with wetlands.
38, 48 58, 68 420.7 8%
* see Appendix A, Table A – 8 for list of definitions of Habitat Class codes.

3-50
Figure 3.23. Distribution of Habitat Class categories at the northern end of the Kodiak archipelago.

3-51
Figure 3.24. Distribution of Habitat Class categories at the southern end of the Kodiak archipelago.

Appendix
APPENDIX A DATA DICTIONARY

A-1
Table A-1. Data dictionary for UNIT table
Field Names Type Description UnitRecID N unique numerical number for each record
PHY_IDENT T unique alphanumeric identifier made up of the REGION, AREA, PHY_UNIT and SUBUNIT numbers (RR/AA/UUUU/SS)
REGION T coastal region number AREAS T coastal area number
PHY_UNIT T physical shore unit number; the unit is the primary alongshore subdivision during the mapping
SUBUNIT T subunit number: “0” for main Unit and “1,2,3…” for variants or point features
TYPE T a description of Unit type: a (L)line-type unit, or a (P)oint variant
BC_CLASS N a number indicating the BC “coastal class” or “shoreline type” (see Table A-2)
ESI T a number code for the ESI coastal classification system (see Table A-3)
LENGTH_M N the unit alongshore length in M, calculated using GIS software
GEO_MAPPER T last name of geology mapper GEO_EDITOR T last name of individual responsible for reviewing and editing GEO_MAP_DATE D/T date of original geological mapping
GEO_SOURCE T data sources for geological interpretation: (V)ideotape, (P)hoto-aerial, (T)opo maps, (C)harts, (O)ther
SCALE T scale of base maps used to delineate units VIDEOTAPE T the videotape identifier number
HR T the “burned-in” tape time from the GPS that appears on the video image; "X" indicates no screen time was available
MIN T the “burned-in” tape time from the GPS that appears on the video image; "X" indicates no screen time was available
SEC T the “burned-in” tape time from the GPS that appears on the video image; "X" indicates no screen time was available
MAP_NO I page number from the DeLorme Alaska Atlas where the Unit is plotted
CHART T NOAA chart number(s) for the Unit
EXP_OBSER T an estimate of the wave exposure as observed by geomorphologist during mapping based on Table A-4
EXP_CLASS T a numeric code for best exposure estimate where EXP_BIO is better than ESP_OBS (see Table A-4)
ORI I a code indicating the potential oil residence index, see Tables A-5 and A-6
SED_SOURCE T a code indicating the estimated sediment source for the unit, (B)ackshore, (A)longshore, (F)luvial, (O)ffshore
SED_ABUND T a code indicating the relative sediment abundance within the shore-unit, (A)bundant, (M)oderate, (S)carce
SED_DIR T one of the eight cardinal points of the compass indicating dominant sediment transport direction
CHNG_TYPE T a code indicating the stability of the shore unit, (A)ccretional, (E)rosional, (S)table
CHNG_RATE N the rate of change of the shoreline within the unit in m/yr (continued on following page)

A-2
Table A-1 (continued). Data dictionary for UNIT table
SHORENAME T the name of a prominent geographic feature near the unit; used to facilitate searches
UNIT_COMMENTS T a text field used for miscellaneous comments and notes during the mapping
SHORE_PROB T comment on nature of the shore problem, usually the difference between electronic shoreline and observed shoreline
SM1_TYPE T the primary type of seawall occurring within the unit where: BR = boat ramp; CB = concrete bulkhead; LF = landfill; SP= sheet pile; RR = rip rap and WB = wooden bulkhead
SM% N the estimated % occurrence of the primary seawall type in tenths (i.e., “2” = 20% occurrence within the unit)
SM1_M N the calculated length in meters of the primary seawall type
SM2_TYPE T
the secondary type of seawall occurring within the unit where: BR = boat ramp; CB = concrete bulkhead; LF = landfill; SP = sheet pile; RR = rip rap and WB = wooden bulkhead
SM2% N the estimated % occurrence of the secondary seawall type in tenths (i.e., “2” = 20% occurrence within the unit)
SM2_ M N the calculated length in meters of the secondary seawall type
SM3_TYPE T the tertiary type of seawall occurring within the unit where: BR = boat ramp; CB = concrete bulkhead; LF = landfill; RR = rip rap and WB = wooden bulkhead
SM3% N the estimated % occurrence of the tertiary seawall type in tenths (i.e., “2” = 20% occurrence within the unit)
SM3_ M N the calculated length in meters of the tertiary seawall type SMOD_TOTAL N the total % occurrence of seawall in the unit, in tenths
RAMPS N
the number of boat ramps that occur within the shore zone of the unit or subunit. Ramps must impact some portion of the shore-zone and generally be constructed of concrete, wood or aggregate. Public boat ramps are shown as variants
PIERS_DOCK N the number of piers or wharves that occur within the unit. Piers or docks must extend at least 10m into the shore zone. Category does not include anchored floats
REC_SLIPS N the estimated number of recreational (or small) slips associated with the piers/docks of the unit based on small boat length (~<50’)
DEEPSEA_SLIP N the estimated number of slips for ocean-going vessels (~>100’)
ITZ N the sum of the across-shore width of all the intertidal components (B-Zone) within the unit
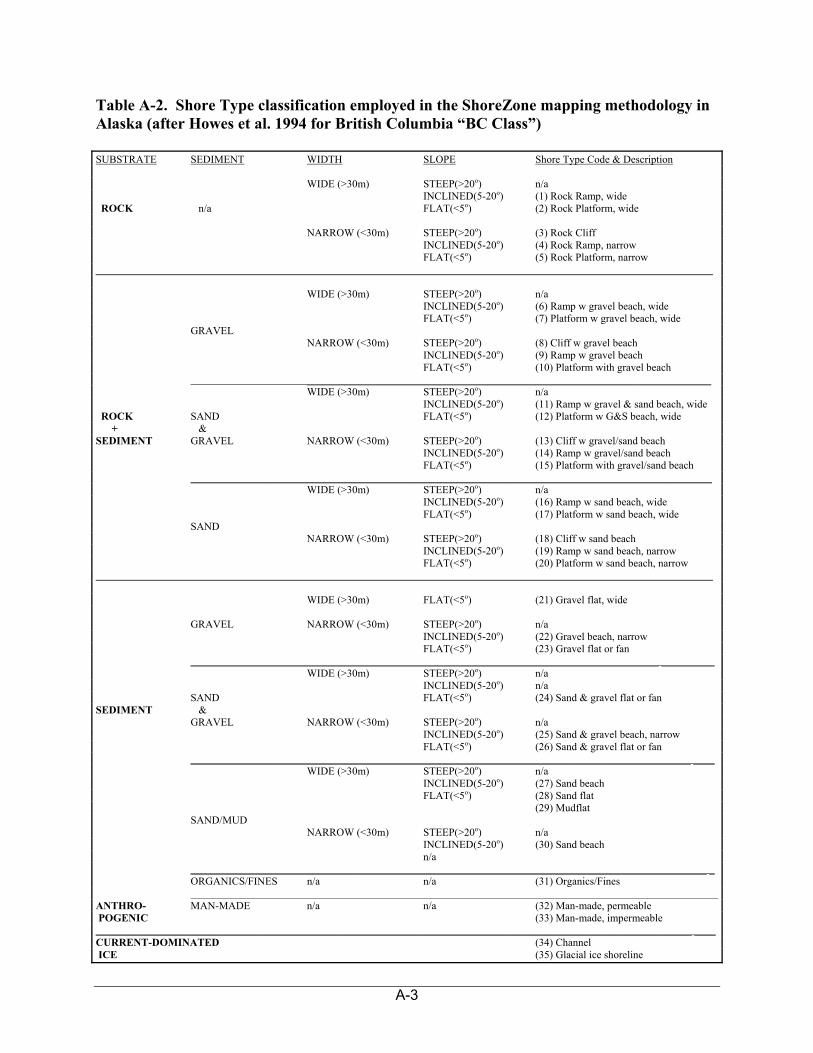
A-3
Table A-2. Shore Type classification employed in the ShoreZone mapping methodology in Alaska (after Howes et al. 1994 for British Columbia “BC Class”) SUBSTRATE SEDIMENT WIDTH SLOPE Shore Type Code & Description WIDE (>30m) STEEP(>20o) n/a INCLINED(5-20o) (1) Rock Ramp, wide ROCK n/a FLAT(<5o) (2) Rock Platform, wide NARROW (<30m) STEEP(>20o) (3) Rock Cliff INCLINED(5-20o) (4) Rock Ramp, narrow FLAT(<5o) (5) Rock Platform, narrow ____________________________________________________________________________________________________________________ WIDE (>30m) STEEP(>20o) n/a INCLINED(5-20o) (6) Ramp w gravel beach, wide FLAT(<5o) (7) Platform w gravel beach, wide GRAVEL NARROW (<30m) STEEP(>20o) (8) Cliff w gravel beach INCLINED(5-20o) (9) Ramp w gravel beach FLAT(<5o) (10) Platform with gravel beach ____________________________________________________________________________ WIDE (>30m) STEEP(>20o) n/a INCLINED(5-20o) (11) Ramp w gravel & sand beach, wide ROCK SAND FLAT(<5o) (12) Platform w G&S beach, wide + & SEDIMENT GRAVEL NARROW (<30m) STEEP(>20o) (13) Cliff w gravel/sand beach INCLINED(5-20o) (14) Ramp w gravel/sand beach FLAT(<5o) (15) Platform with gravel/sand beach __________________________________________________________________________________________________ WIDE (>30m) STEEP(>20o) n/a INCLINED(5-20o) (16) Ramp w sand beach, wide FLAT(<5o) (17) Platform w sand beach, wide SAND NARROW (<30m) STEEP(>20o) (18) Cliff w sand beach INCLINED(5-20o) (19) Ramp w sand beach, narrow FLAT(<5o) (20) Platform w sand beach, narrow ____________________________________________________________________________________________________________________ WIDE (>30m) FLAT(<5o) (21) Gravel flat, wide GRAVEL NARROW (<30m) STEEP(>20o) n/a INCLINED(5-20o) (22) Gravel beach, narrow FLAT(<5o) (23) Gravel flat or fan ________________________________________________________________________________________ __________ WIDE (>30m) STEEP(>20o) n/a INCLINED(5-20o) n/a SAND FLAT(<5o) (24) Sand & gravel flat or fan SEDIMENT & GRAVEL NARROW (<30m) STEEP(>20o) n/a INCLINED(5-20o) (25) Sand & gravel beach, narrow FLAT(<5o) (26) Sand & gravel flat or fan ______________________________________________________________________________________________ ____ WIDE (>30m) STEEP(>20o) n/a INCLINED(5-20o) (27) Sand beach FLAT(<5o) (28) Sand flat (29) Mudflat SAND/MUD NARROW (<30m) STEEP(>20o) n/a INCLINED(5-20o) (30) Sand beach n/a _________________________________________________________________________________________________ _ ORGANICS/FINES n/a n/a (31) Organics/Fines ANTHRO- MAN-MADE n/a n/a (32) Man-made, permeable POGENIC (33) Man-made, impermeable ________________________________________________________________________________________________________________ ____ CURRENT-DOMINATED (34) Channel ICE (35) Glacial ice shoreline

A-4
Table A-3 ESI Shore Type classification (after Peterson et al 2002)
ESI No.
Description
1A Exposed rocky shores; Exposed rocky banks 1B Exposed, solid man-made structures 1C Exposed rocky cliffs with boulder talus base 2A Exposed wave-cut platforms in bedrock, mud, or clay 2B Exposed scarps and steep slopes in clay 3A Fine- to medium-grained sand beaches 3B Scarps and steep slopes in sand 3C Tundra cliffs 4 Coarse-grained sand beaches 5 Mixed sand and gravel beaches
6A Gravel beaches; Gravel Beaches (granules and pebbles 6B Rip rap; Gravel Beaches (cobbles and boulders) 6C Rip rap 7 Exposed tidal flats
8A Sheltered scarps in bedrock, mud, or clay; Sheltered rocky shores (impermeable)
8B Sheltered, solid man-made structures; Sheltered rocky shores (permeable)
8C Sheltered rip rap 8D Sheltered rocky rubble shores 8E Peat shorelines 9A Sheltered tidal flats 9B Vegetated low banks 9C Hypersaline tidal flats
10A Salt- and brackish-water marshes 10B Freshwater marshes 10C Swamps 10D Scrub-shrub wetlands; Mangroves 10E Inundated low-lying tundra
Table A-4 Exposure matrix used for estimating observed physical exposure (EXP_OBS)
Maximum Modified Effective Fetch (km) Fetch (km) <1 1 - 10 10 - 50 50 - 500 >500
<1 very protected n/a n/a n/a n/a <10 protected protected n/a n/a n/a
10 – 50 n/a semi-protected semi-protected n/a n/a 50 – 500 n/a semi-exposed semi-exposed semi-exposed n/a
>500 n/a n/a semi-exposed exposed exposed Codes for exposures: very protected VP
protected P semi-protected SP semi-exposed SE exposed E very exposed VE
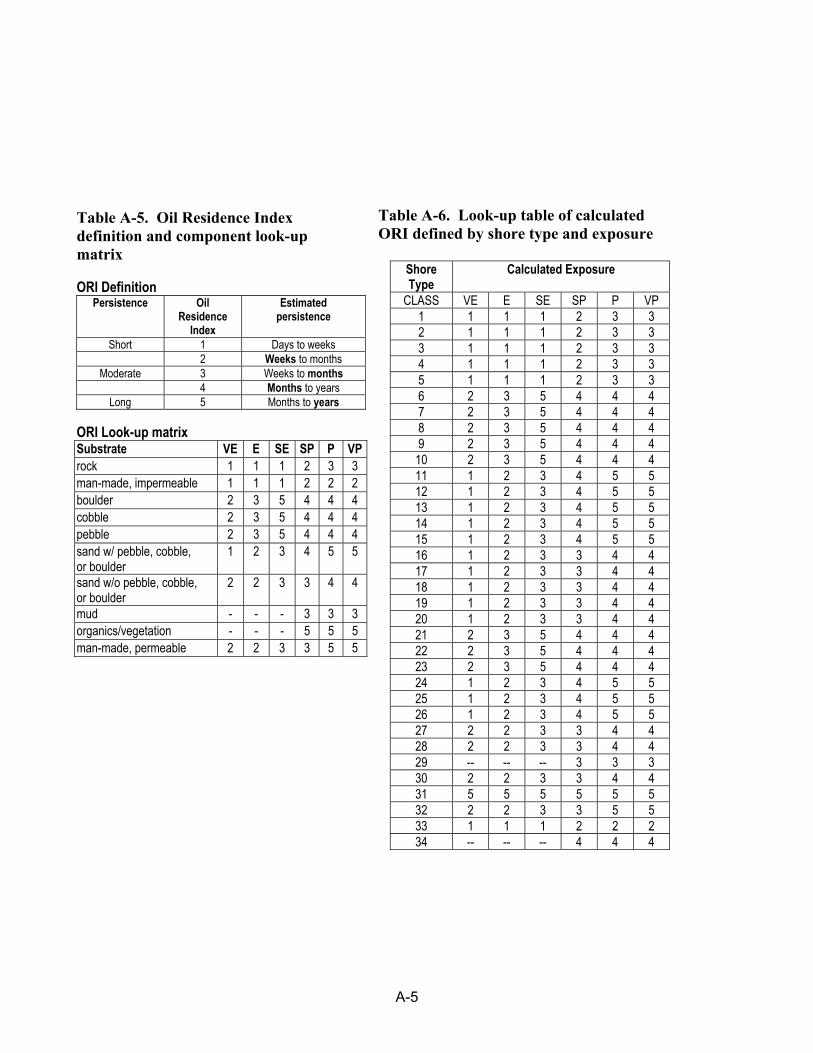
A-5
Table A-5. Oil Residence Index definition and component look-up matrix ORI Definition
Persistence
Oil Residence
Index
Estimated persistence
Short 1 Days to weeks 2 Weeks to months
Moderate 3 Weeks to months 4 Months to years
Long 5 Months to years
Table A-6. Look-up table of calculated ORI defined by shore type and exposure
Shore Type
Calculated Exposure
CLASS VE E SE SP P VP 1 1 1 1 2 3 3 2 1 1 1 2 3 3 3 1 1 1 2 3 3 4 1 1 1 2 3 3 5 1 1 1 2 3 3 6 2 3 5 4 4 4 7 2 3 5 4 4 4 8 2 3 5 4 4 4 9 2 3 5 4 4 4 10 2 3 5 4 4 4 11 1 2 3 4 5 5 12 1 2 3 4 5 5 13 1 2 3 4 5 5 14 1 2 3 4 5 5 15 1 2 3 4 5 5 16 1 2 3 3 4 4 17 1 2 3 3 4 4 18 1 2 3 3 4 4 19 1 2 3 3 4 4 20 1 2 3 3 4 4 21 2 3 5 4 4 4 22 2 3 5 4 4 4 23 2 3 5 4 4 4 24 1 2 3 4 5 5 25 1 2 3 4 5 5 26 1 2 3 4 5 5 27 2 2 3 3 4 4 28 2 2 3 3 4 4 29 -- -- -- 3 3 3 30 2 2 3 3 4 4 31 5 5 5 5 5 5 32 2 2 3 3 5 5 33 1 1 1 2 2 2 34 -- -- -- 4 4 4
ORI Look-up matrix Substrate VE E SE SP P VP rock 1 1 1 2 3 3 man-made, impermeable 1 1 1 2 2 2 boulder 2 3 5 4 4 4 cobble 2 3 5 4 4 4 pebble 2 3 5 4 4 4 sand w/ pebble, cobble, or boulder
1 2 3 4 5 5
sand w/o pebble, cobble, or boulder
2 2 3 3 4 4
mud - - - 3 3 3 organics/vegetation - - - 5 5 5 man-made, permeable 2 2 3 3 5 5
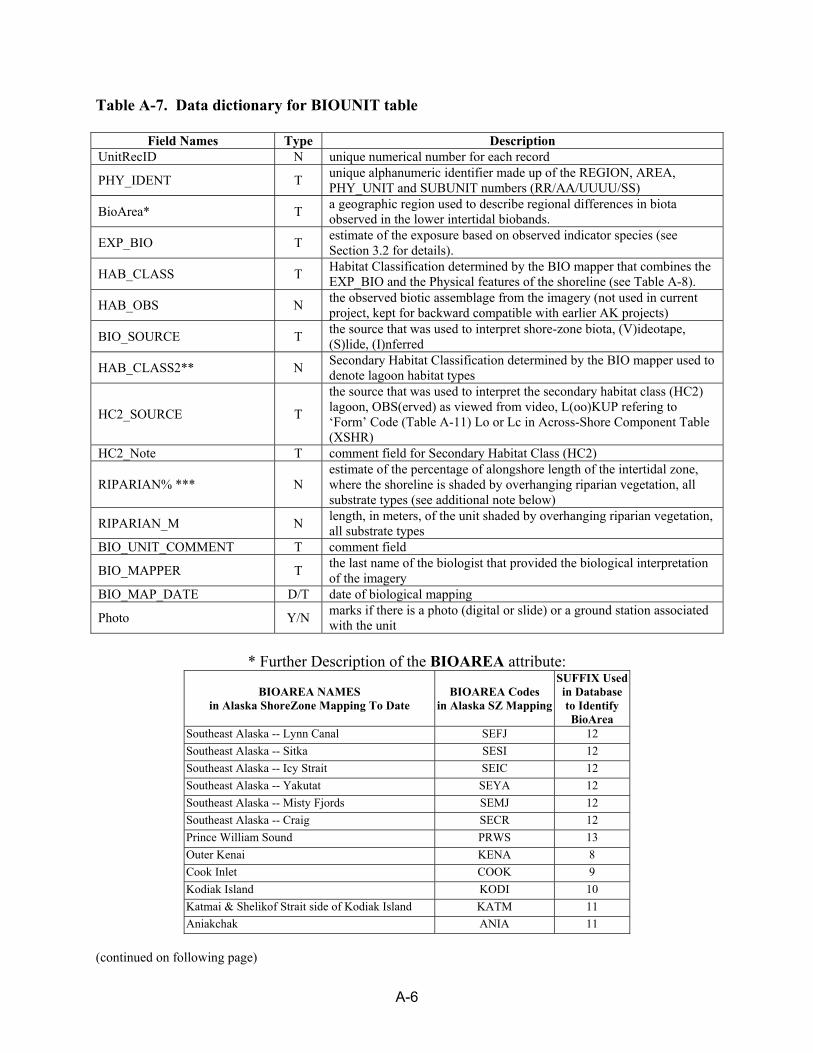
A-6
Table A-7. Data dictionary for BIOUNIT table
Field Names Type Description UnitRecID N unique numerical number for each record
PHY_IDENT T unique alphanumeric identifier made up of the REGION, AREA, PHY_UNIT and SUBUNIT numbers (RR/AA/UUUU/SS)
BioArea* T a geographic region used to describe regional differences in biota observed in the lower intertidal biobands.
EXP_BIO T estimate of the exposure based on observed indicator species (see Section 3.2 for details).
HAB_CLASS T Habitat Classification determined by the BIO mapper that combines the EXP_BIO and the Physical features of the shoreline (see Table A-8).
HAB_OBS N the observed biotic assemblage from the imagery (not used in current project, kept for backward compatible with earlier AK projects)
BIO_SOURCE T the source that was used to interpret shore-zone biota, (V)ideotape, (S)lide, (I)nferred
HAB_CLASS2** N Secondary Habitat Classification determined by the BIO mapper used to denote lagoon habitat types
HC2_SOURCE T
the source that was used to interpret the secondary habitat class (HC2) lagoon, OBS(erved) as viewed from video, L(oo)KUP refering to ‘Form’ Code (Table A-11) Lo or Lc in Across-Shore Component Table (XSHR)
HC2_Note T comment field for Secondary Habitat Class (HC2)
RIPARIAN% *** N estimate of the percentage of alongshore length of the intertidal zone, where the shoreline is shaded by overhanging riparian vegetation, all substrate types (see additional note below)
RIPARIAN_M N length, in meters, of the unit shaded by overhanging riparian vegetation, all substrate types
BIO_UNIT_COMMENT T comment field
BIO_MAPPER T the last name of the biologist that provided the biological interpretation of the imagery
BIO_MAP_DATE D/T date of biological mapping
Photo Y/N marks if there is a photo (digital or slide) or a ground station associated with the unit
* Further Description of the BIOAREA attribute:
BIOAREA NAMES in Alaska ShoreZone Mapping To Date
BIOAREA Codes in Alaska SZ Mapping
SUFFIX Used in Database to Identify BioArea
Southeast Alaska -- Lynn Canal SEFJ 12 Southeast Alaska -- Sitka SESI 12 Southeast Alaska -- Icy Strait SEIC 12 Southeast Alaska -- Yakutat SEYA 12 Southeast Alaska -- Misty Fjords SEMJ 12 Southeast Alaska -- Craig SECR 12 Prince William Sound PRWS 13 Outer Kenai KENA 8 Cook Inlet COOK 9 Kodiak Island KODI 10 Katmai & Shelikof Strait side of Kodiak Island KATM 11 Aniakchak ANIA 11
(continued on following page)
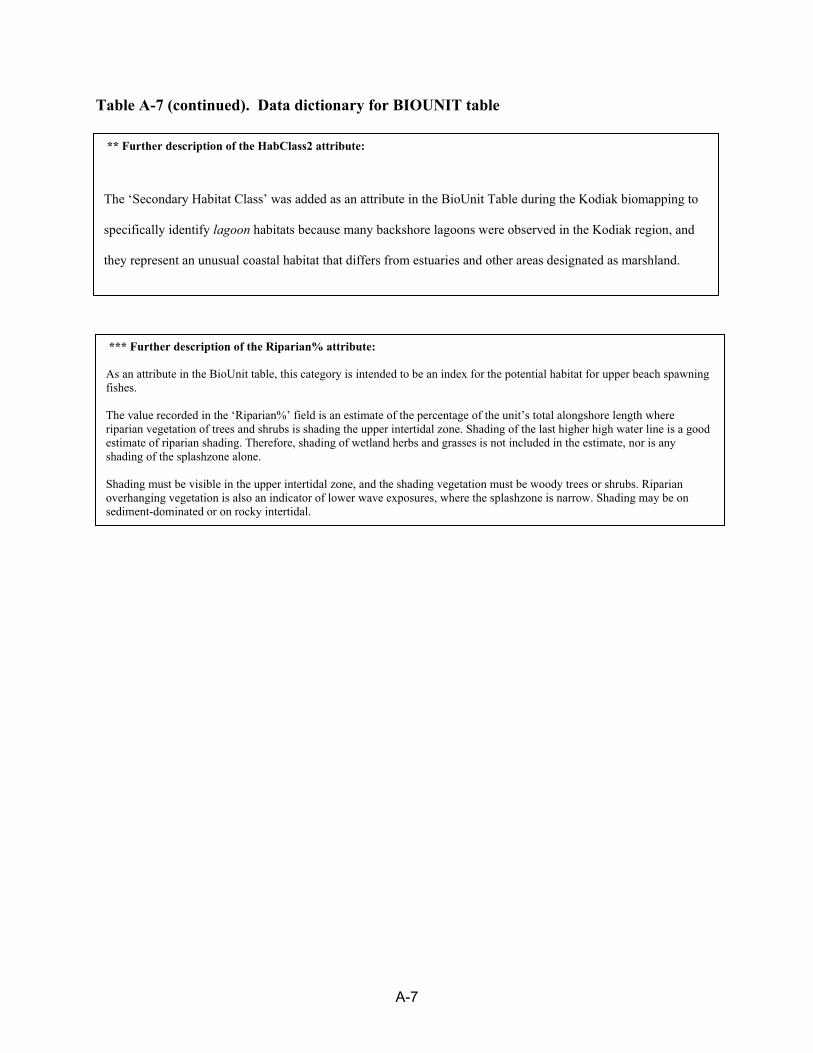
A-7
Table A-7 (continued). Data dictionary for BIOUNIT table
*** Further description of the Riparian% attribute: As an attribute in the BioUnit table, this category is intended to be an index for the potential habitat for upper beach spawning fishes. The value recorded in the ‘Riparian%’ field is an estimate of the percentage of the unit’s total alongshore length where riparian vegetation of trees and shrubs is shading the upper intertidal zone. Shading of the last higher high water line is a good estimate of riparian shading. Therefore, shading of wetland herbs and grasses is not included in the estimate, nor is any shading of the splashzone alone. Shading must be visible in the upper intertidal zone, and the shading vegetation must be woody trees or shrubs. Riparian overhanging vegetation is also an indicator of lower wave exposures, where the splashzone is narrow. Shading may be on sediment-dominated or on rocky intertidal.
** Further description of the HabClass2 attribute:
The ‘Secondary Habitat Class’ was added as an attribute in the BioUnit Table during the Kodiak biomapping to
specifically identify lagoon habitats because many backshore lagoons were observed in the Kodiak region, and
they represent an unusual coastal habitat that differs from estuaries and other areas designated as marshland.
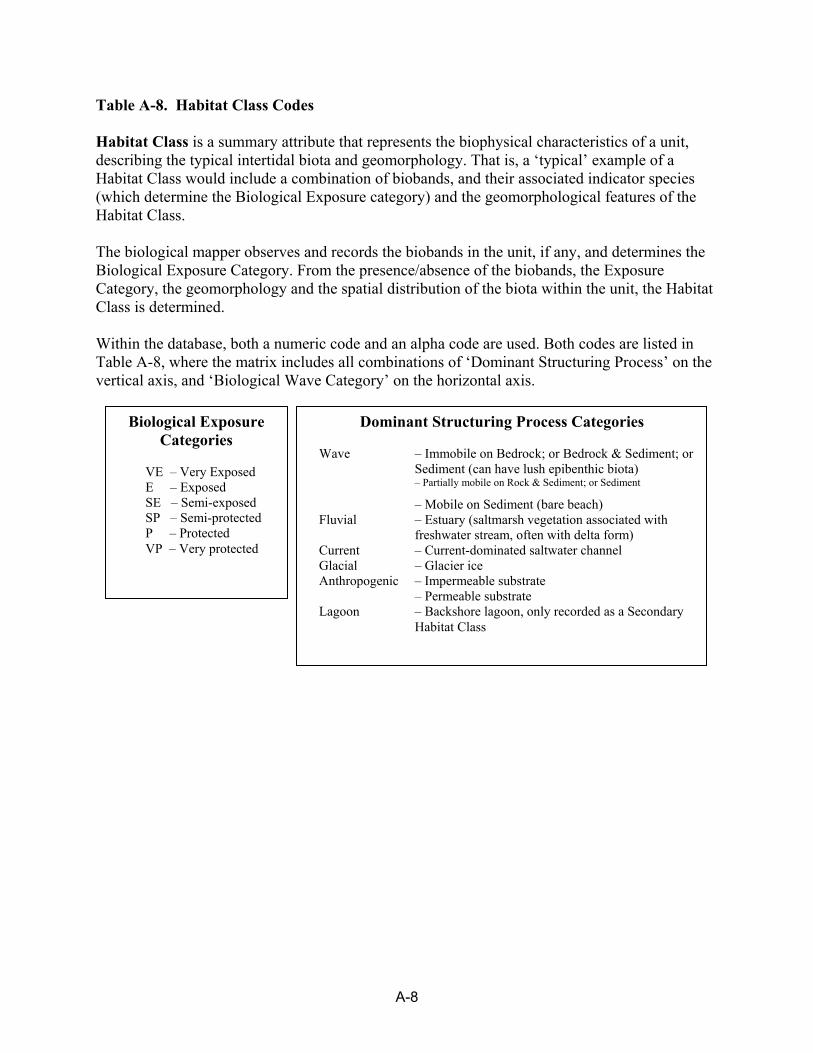
A-8
Dominant Structuring Process Categories
Wave – Immobile on Bedrock; or Bedrock & Sediment; or Sediment (can have lush epibenthic biota)
– Partially mobile on Rock & Sediment; or Sediment
– Mobile on Sediment (bare beach) Fluvial – Estuary (saltmarsh vegetation associated with
freshwater stream, often with delta form) Current – Current-dominated saltwater channel Glacial – Glacier ice Anthropogenic – Impermeable substrate – Permeable substrate Lagoon – Backshore lagoon, only recorded as a Secondary
Habitat Class
Table A-8. Habitat Class Codes Habitat Class is a summary attribute that represents the biophysical characteristics of a unit, describing the typical intertidal biota and geomorphology. That is, a ‘typical’ example of a Habitat Class would include a combination of biobands, and their associated indicator species (which determine the Biological Exposure category) and the geomorphological features of the Habitat Class. The biological mapper observes and records the biobands in the unit, if any, and determines the Biological Exposure Category. From the presence/absence of the biobands, the Exposure Category, the geomorphology and the spatial distribution of the biota within the unit, the Habitat Class is determined. Within the database, both a numeric code and an alpha code are used. Both codes are listed in Table A-8, where the matrix includes all combinations of ‘Dominant Structuring Process’ on the vertical axis, and ‘Biological Wave Category’ on the horizontal axis.
Biological Exposure Categories
VE – Very Exposed E – Exposed SE – Semi-exposed SP – Semi-protected P – Protected VP – Very protected
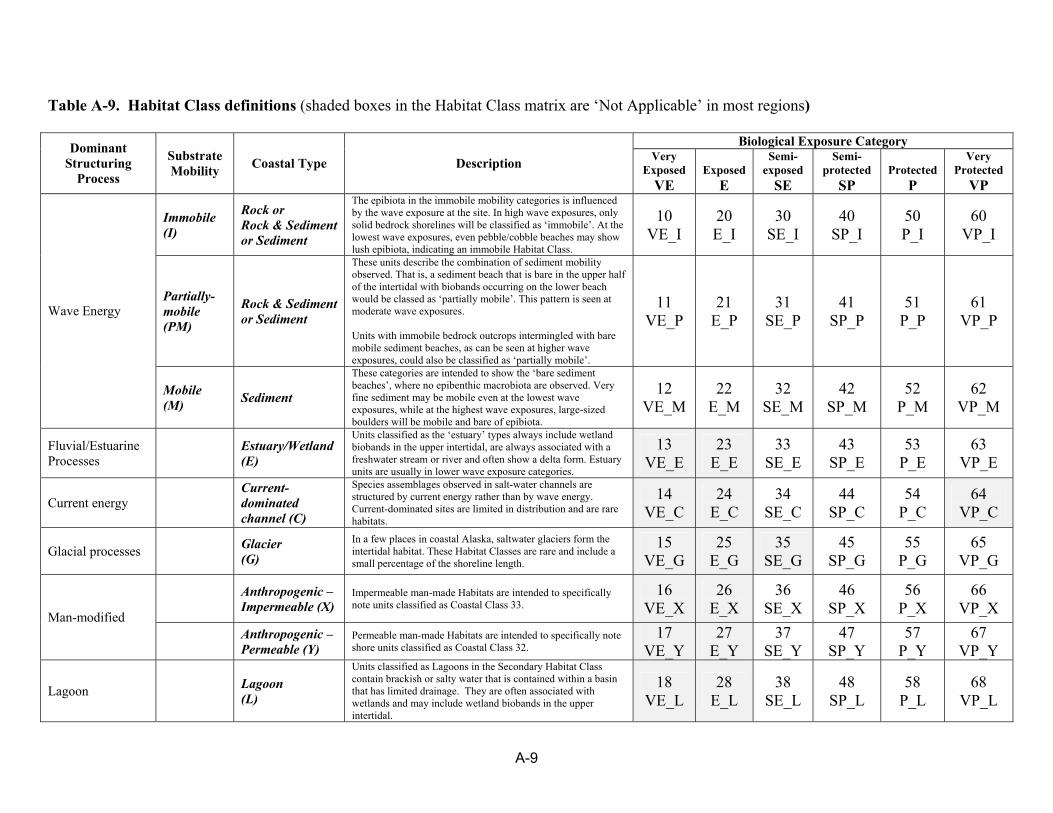
A-9
Table A-9. Habitat Class definitions (shaded boxes in the Habitat Class matrix are ‘Not Applicable’ in most regions)
Biological Exposure Category Dominant Structuring
Process
Substrate Mobility Coastal Type Description Very
Exposed VE
Exposed
E
Semi-exposed
SE
Semi-protected
SP
Protected
P
Very Protected
VP
Immobile (I)
Rock or Rock & Sediment or Sediment
The epibiota in the immobile mobility categories is influenced by the wave exposure at the site. In high wave exposures, only solid bedrock shorelines will be classified as ‘immobile’. At the lowest wave exposures, even pebble/cobble beaches may show lush epibiota, indicating an immobile Habitat Class.
10 VE_I
20 E_I
30 SE_I
40 SP_I
50 P_I
60 VP_I
Partially-mobile (PM)
Rock & Sediment or Sediment
These units describe the combination of sediment mobility observed. That is, a sediment beach that is bare in the upper half of the intertidal with biobands occurring on the lower beach would be classed as ‘partially mobile’. This pattern is seen at moderate wave exposures. Units with immobile bedrock outcrops intermingled with bare mobile sediment beaches, as can be seen at higher wave exposures, could also be classified as ‘partially mobile’.
11 VE_P
21 E_P
31 SE_P
41 SP_P
51 P_P
61 VP_P Wave Energy
Mobile (M) Sediment
These categories are intended to show the ‘bare sediment beaches’, where no epibenthic macrobiota are observed. Very fine sediment may be mobile even at the lowest wave exposures, while at the highest wave exposures, large-sized boulders will be mobile and bare of epibiota.
12 VE_M
22 E_M
32 SE_M
42 SP_M
52 P_M
62 VP_M
Fluvial/Estuarine Processes Estuary/Wetland
(E)
Units classified as the ‘estuary’ types always include wetland biobands in the upper intertidal, are always associated with a freshwater stream or river and often show a delta form. Estuary units are usually in lower wave exposure categories.
13 VE_E
23 E_E
33 SE_E
43 SP_E
53 P_E
63 VP_E
Current energy Current-
dominated channel (C)
Species assemblages observed in salt-water channels are structured by current energy rather than by wave energy. Current-dominated sites are limited in distribution and are rare habitats.
14 VE_C
24 E_C
34 SE_C
44 SP_C
54 P_C
64 VP_C
Glacial processes Glacier
(G) In a few places in coastal Alaska, saltwater glaciers form the intertidal habitat. These Habitat Classes are rare and include a small percentage of the shoreline length.
15 VE_G
25 E_G
35 SE_G
45 SP_G
55 P_G
65 VP_G
Anthropogenic – Impermeable (X)
Impermeable man-made Habitats are intended to specifically note units classified as Coastal Class 33.
16 VE_X
26 E_X
36 SE_X
46 SP_X
56 P_X
66 VP_X Man-modified
Anthropogenic – Permeable (Y)
Permeable man-made Habitats are intended to specifically note shore units classified as Coastal Class 32.
17 VE_Y
27 E_Y
37 SE_Y
47 SP_Y
57 P_Y
67 VP_Y
Lagoon
Lagoon (L)
Units classified as Lagoons in the Secondary Habitat Class contain brackish or salty water that is contained within a basin that has limited drainage. They are often associated with wetlands and may include wetland biobands in the upper intertidal.
18 VE_L
28 E_L
38 SE_L
48 SP_L
58 P_L
68 VP_L
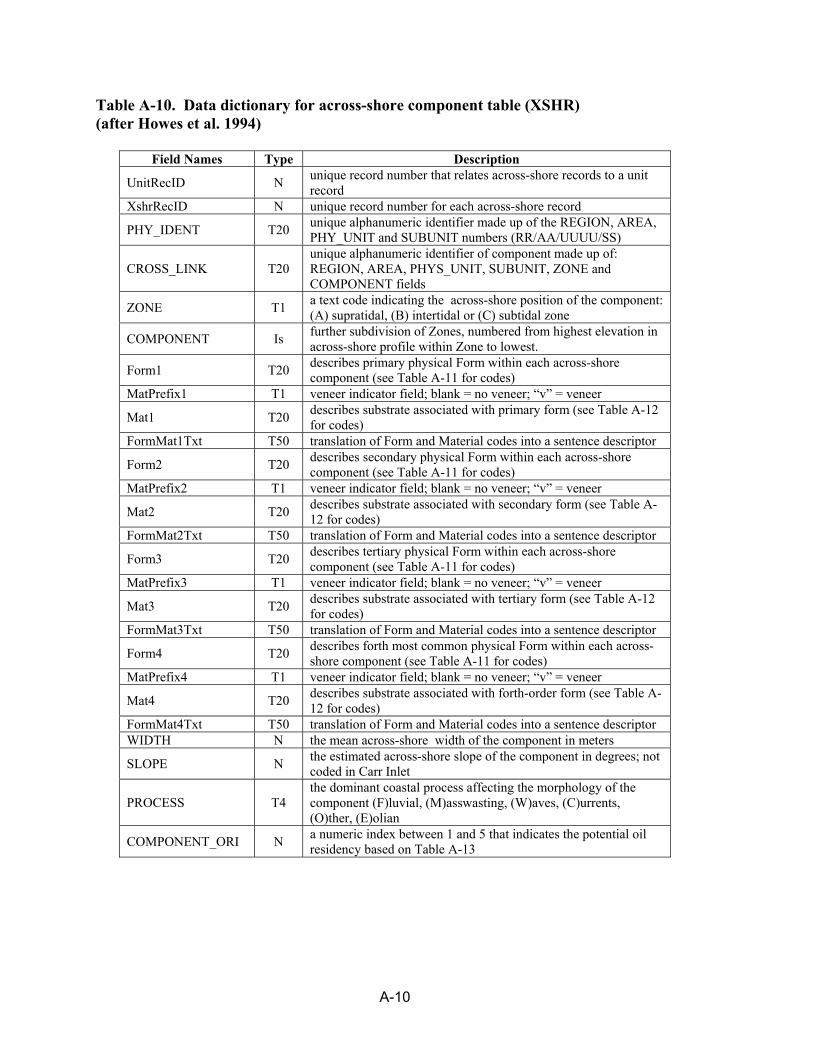
A-10
Table A-10. Data dictionary for across-shore component table (XSHR) (after Howes et al. 1994)
Field Names Type Description
UnitRecID N unique record number that relates across-shore records to a unit record
XshrRecID N unique record number for each across-shore record
PHY_IDENT T20 unique alphanumeric identifier made up of the REGION, AREA, PHY_UNIT and SUBUNIT numbers (RR/AA/UUUU/SS)
CROSS_LINK T20 unique alphanumeric identifier of component made up of: REGION, AREA, PHYS_UNIT, SUBUNIT, ZONE and COMPONENT fields
ZONE T1 a text code indicating the across-shore position of the component: (A) supratidal, (B) intertidal or (C) subtidal zone
COMPONENT Is further subdivision of Zones, numbered from highest elevation in across-shore profile within Zone to lowest.
Form1 T20 describes primary physical Form within each across-shore component (see Table A-11 for codes)
MatPrefix1 T1 veneer indicator field; blank = no veneer; “v” = veneer
Mat1 T20 describes substrate associated with primary form (see Table A-12 for codes)
FormMat1Txt T50 translation of Form and Material codes into a sentence descriptor
Form2 T20 describes secondary physical Form within each across-shore component (see Table A-11 for codes)
MatPrefix2 T1 veneer indicator field; blank = no veneer; “v” = veneer
Mat2 T20 describes substrate associated with secondary form (see Table A-12 for codes)
FormMat2Txt T50 translation of Form and Material codes into a sentence descriptor
Form3 T20 describes tertiary physical Form within each across-shore component (see Table A-11 for codes)
MatPrefix3 T1 veneer indicator field; blank = no veneer; “v” = veneer
Mat3 T20 describes substrate associated with tertiary form (see Table A-12 for codes)
FormMat3Txt T50 translation of Form and Material codes into a sentence descriptor
Form4 T20 describes forth most common physical Form within each across-shore component (see Table A-11 for codes)
MatPrefix4 T1 veneer indicator field; blank = no veneer; “v” = veneer
Mat4 T20 describes substrate associated with forth-order form (see Table A-12 for codes)
FormMat4Txt T50 translation of Form and Material codes into a sentence descriptor WIDTH N the mean across-shore width of the component in meters
SLOPE N the estimated across-shore slope of the component in degrees; not coded in Carr Inlet
PROCESS T4 the dominant coastal process affecting the morphology of the component (F)luvial, (M)asswasting, (W)aves, (C)urrents, (O)ther, (E)olian
COMPONENT_ORI N a numeric index between 1 and 5 that indicates the potential oil residency based on Table A-13
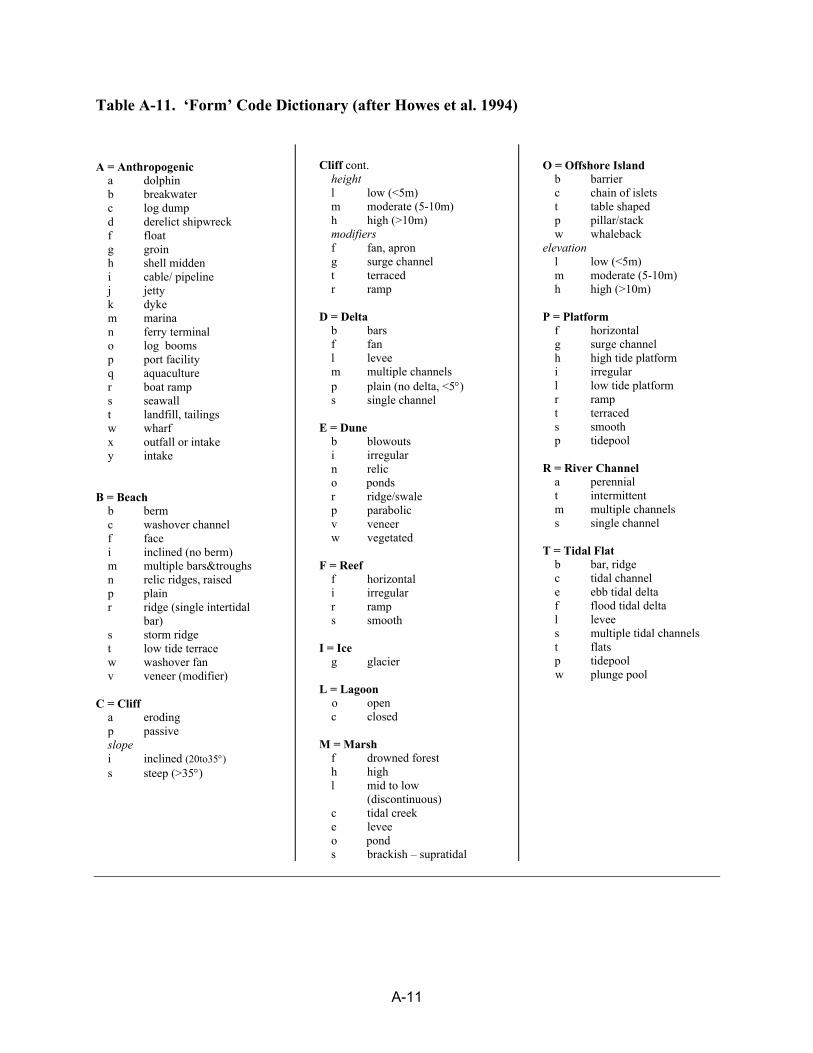
A-11
Table A-11. ‘Form’ Code Dictionary (after Howes et al. 1994)
A = Anthropogenic
a dolphin b breakwater c log dump d derelict shipwreck f float g groin h shell midden i cable/ pipeline j jetty k dyke m marina n ferry terminal o log booms p port facility q aquaculture r boat ramp s seawall t landfill, tailings w wharf x outfall or intake y intake
B = Beach
b berm c washover channel f face i inclined (no berm) m multiple bars&troughs n relic ridges, raised p plain r ridge (single intertidal
bar) s storm ridge t low tide terrace w washover fan v veneer (modifier)
C = Cliff
a eroding p passive slope i inclined (20to35°) s steep (>35°)
Cliff cont.
height l low (<5m) m moderate (5-10m) h high (>10m) modifiers f fan, apron g surge channel t terraced r ramp
D = Delta
b bars f fan l levee m multiple channels p plain (no delta, <5°) s single channel
E = Dune
b blowouts i irregular n relic o ponds r ridge/swale p parabolic v veneer w vegetated
F = Reef
f horizontal i irregular r ramp s smooth
I = Ice
g glacier
L = Lagoon o open c closed
M = Marsh
f drowned forest h high l mid to low
(discontinuous) c tidal creek e levee o pond s brackish – supratidal
O = Offshore Island
b barrier c chain of islets t table shaped p pillar/stack w whaleback
elevation l low (<5m) m moderate (5-10m) h high (>10m)
P = Platform
f horizontal g surge channel h high tide platform i irregular l low tide platform r ramp t terraced s smooth p tidepool
R = River Channel
a perennial t intermittent m multiple channels s single channel
T = Tidal Flat
b bar, ridge c tidal channel e ebb tidal delta f flood tidal delta l levee s multiple tidal channels t flats p tidepool w plunge pool

A-12
Table A-12. ‘Material’ Code Dictionary (after Howes et al. 1994) A = Anthropogenic
a metal (structural) c concrete (loose blocks) d debris (man-made) f fill, undifferentiated mixed o concrete (solid cement blocks) r rubble, rip rap t logs (cut trees) w wood (structural)
B = Biogenic
c coarse shell f fine shell hash g grass on dunes l trees, fallen not cut, dead o organic litter p peat t trees (alive)
C = Clastic
a blocks (angular,>25cm) b boulders (round, subround,>25cm) c cobbles d diamicton (poorly sorted sediment
containing a range of particles in a mud matrix)
f fines or mud (mix of silt, clay) k clay p pebbles r rubble (boulders>1m) s sand x angular fragments (mix block & rubble) v sediment veneer
DESCRIPTION OF SUBSTRATE
Simplified from Wentworth scale GRAVELS
boulder > 25 cm cobble 6 to 25 cm pebble 0.5 to 6 cm granule 0.2 to 0.5 cm
SAND
from very coarse to very fine: all between 0.5 mm to 2 mm FINES (MUD)
from silt to clay: finer than 0.5 mm
The ‘material’ descriptor consists of one primary term code and associated modifiers (e.g. Cash). If only one modifier is used, indicated material comprises 75% of the volume of the layer (e.g. Cs); if more than one modifier, they are ranked in order of relative abundance. A surface layer can be described by prefix ‘v’ for veneer (e.g. vCs/R). Veneer is not used for living vegetation (e.g. Bt/R is used without the ‘v’). Shore Modifications (ranked 0-10 for 0-100% of alongshore unit length) BR boat ramp CB concrete bulkhead LF landfill RR riprap SP sheet pile WB wooden bulkhead

A-13
Table A-13. Data dictionary for the BIOBAND table
Type Description
UnitRecID N unique record number that relates across-shore records to a unit record
XshrRecID N unique record number for each across-shore record
PHY_IDENT T20 unique numeric identifier made up of the REGION, AREA, PHY_UNIT and SUBUNIT numbers (RR/AA/UUUU/SS)
CROSS_LINK T20 unique alphanumeric identifier of component made up of: REGION, AREA, PHYS_UNIT, SUBUNIT, ZONE and COMPONENT fields
Note: all BioBands are coded Patchy (<50% cover) or Continuous (>50% cover) except the VER band, coded by width Narrow (<1m), Medium (1-5m) or Wide (>5m). See Section 3.1 for details.
VER T1 bioband for ‘VERrucaria’ black lichen in supratidal splash zone
PUC T1 bioband for PUCcinellia and other salt tolerant grasses and herbs
GRA T1 bioband code for dune GRAsses of supratidal SED T1 bioband for mixed SEDges of supratidal
BAR T1 bioband for continuous Balanus/Semibalanus BARnacle in upper intertidal
FUC T1 bioband for FUCus-/barnacle of upper intertidal
ULV T1 bioband for mixed filamentous and foliose green algae band, mid intertidal
HAL* T1 bioband for bleached mixed filamentous and foliose red algae
BMU T1 bioband for blue mussels (Mytilus trossulus) of mid-intertidal, protected areas
RED* T1 bioband for mixed filamentous and foliose RED algae of lower intertidal
ALA T1 bioband for stand of large or small morph of Alaria spp.
SBR* T1 bioband for unstalked large-bladed laminarins; in the lower intertidal and nearshore subtidal
CHB* T1 bioband for stalked bladed dark chocolate-brown kelps of lower intertidal/nearshore subtidal
SUR T1 bioband for green SURfgrass of lower intertidal
ZOS T1 bioband for ZOStera (eelgrass) of sheltered areas, lower intertidal and subtidal
ALF T1 nearshore dragon kelp bioband MAC T1 Nearshore canopy kelp Macrocystis bioband NER T1 bioband for nearshore subtidal NEReocystis bull kelp
* Further Description of BIOBAND by BIOAREA (see also Table A – 7 and footnotes)
Different species assemblages in four lower intertidal biobands are observed, and are used to help define geographic regions in ShoreZone as separate BioAreas. In addition to the BIOAREA code assigned to each unit in the BIOUNIT table, the lower intertidal biobands: Bleached Red Algae, Red Algae, Soft Brown Kelps, and Dark Brown Kelps (HAL, RED, SBR and CHB bands) are labeled with a suffix number to specifically match the bioband code to a particular BioArea. More BioAreas are being defined as new coastal areas are being mapped. Details of the species composition in these diagnostic lower intertidal bands are being added as ground station surveys are completed in mapped areas. The Kodiak archipelago includes two Boreas: the Katmai and Shelikof Strait area (BioArea KATM with bioband suffix 11) and the Gulf of Alaska shore of Kodiak (BioArea KODI, bioband suffix 10).
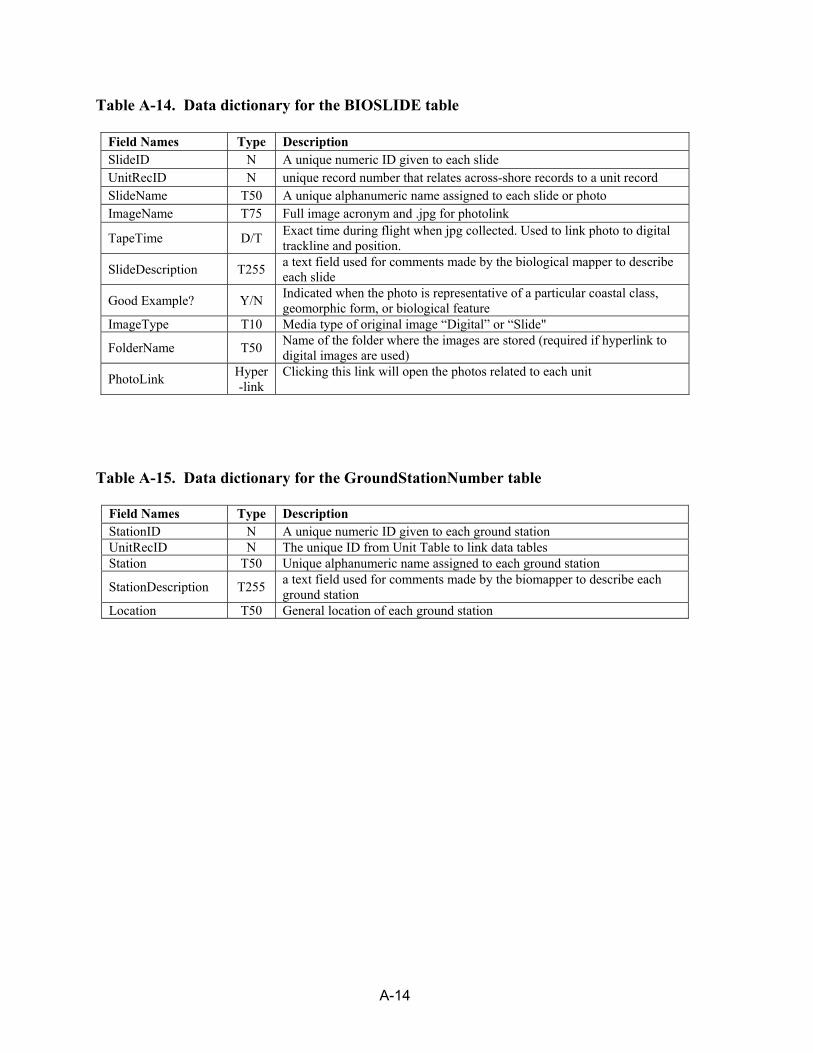
A-14
Table A-14. Data dictionary for the BIOSLIDE table
Field Names Type Description SlideID N A unique numeric ID given to each slide UnitRecID N unique record number that relates across-shore records to a unit record SlideName T50 A unique alphanumeric name assigned to each slide or photo ImageName T75 Full image acronym and .jpg for photolink
TapeTime D/T Exact time during flight when jpg collected. Used to link photo to digital trackline and position.
SlideDescription T255 a text field used for comments made by the biological mapper to describe each slide
Good Example? Y/N Indicated when the photo is representative of a particular coastal class, geomorphic form, or biological feature
ImageType T10 Media type of original image “Digital” or “Slide"
FolderName T50 Name of the folder where the images are stored (required if hyperlink to digital images are used)
PhotoLink Hyper-link
Clicking this link will open the photos related to each unit
Table A-15. Data dictionary for the GroundStationNumber table
Field Names Type Description StationID N A unique numeric ID given to each ground station UnitRecID N The unique ID from Unit Table to link data tables Station T50 Unique alphanumeric name assigned to each ground station
StationDescription T255 a text field used for comments made by the biomapper to describe each ground station
Location T50 General location of each ground station