short-run gain, long-run pain? - citeseer
TRANSCRIPT

WORK ING PAPER S ER I E SNO. 348 / APR I L 2004
FINANCIAL OPENNESS AND GROWTH:SHORT-RUN GAIN,LONG-RUN PAIN?
by Marcel Fratzscher and Matthieu Bussiere

In 2004 all publications
will carry a motif taken
from the €100 banknote.
WORK ING PAPER S ER I E SNO. 348 / APR I L 2004
FINANCIAL OPENNESS
AND GROWTH:SHORT-RUN GAIN,LONG-RUN PAIN?1
by Marcel Fratzscher 2
and Matthieu Bussiere 3
1 Comments from seminar participants at the ECB and an anonymous referee are gratefully acknowledged.The views presented inthe paper are those of the authors and do not necessarily reflect those of the European Central Bank.
2 European Central Bank, Kaiserstrasse 29, D-60311 Frankfurt/Main; email: [email protected] European Central Bank, Kaiserstrasse 29, D-60311 Frankfurt/Main; email: [email protected].
This paper can be downloaded without charge from http://www.ecb.int or from the Social Science Research Network
electronic library at http://ssrn.com/abstract_id=533010.

© European Central Bank, 2004
AddressKaiserstrasse 2960311 Frankfurt am Main, Germany
Postal addressPostfach 16 03 1960066 Frankfurt am Main, Germany
Telephone+49 69 1344 0
Internethttp://www.ecb.int
Fax+49 69 1344 6000
Telex411 144 ecb d
All rights reserved.
Reproduction for educational and non-commercial purposes is permitted providedthat the source is acknowledged.
The views expressed in this paper do notnecessarily reflect those of the EuropeanCentral Bank.
The statement of purpose for the ECBWorking Paper Series is available from theECB website, http://www.ecb.int.
ISSN 1561-0810 (print)ISSN 1725-2806 (online)
3ECB
Working Paper Series No. 348
CONTENT S
Abstract 4
Non-technical summary 5
1 Introduction 7
2 Conceptual issues, data and methodology 10
2.1 Measuring financial openness 10
2.2 Data and definitions 12
2.3 Empirical methodology 14
3 Empirical results 16
3.1 Openness and growth: some stylisedfacts 16
3.2 Openness and growth: is there arelationship? 18
3.3 Which countries benefit fromliberalisation? 20
3.4 The intertemporal trade-off:short-run gain versus long-run pain? 22
3.5 Sensitivity analysis 24
4 Conclusions 28
References 30
Appendix 33
European Central Bank working paper series 34
April 2004

Abstract
No empirical evidence has yet emerged for the existence of a robust positiverelationship between financial openness and economic growth. This paper argues thata key reason for the elusive evidence is the presence of a time-varying relationshipbetween openness and growth over time: countries tend to gain in the short-term,immediately following capital account liberalisation, but may not grow faster or evenexperience temporary growth reversals in the medium- to long-term. The paper findssubstantial empirical evidence for the existence of such an intertemporal trade-off for45 industrialised and emerging market economies. The acceleration of growthimmediately after liberalisation is found to be often driven by an investment boomand a surge in portfolio and debt inflows. By contrast, the quality of domesticinstitutions, the size of FDI inflows and the sequencing of the liberalisation processare found to be important driving forces for growth in the medium to longer term.
JEL: F33, F34, F36, F43Keywords: liberalisation; capital account; economic growth; intertemporal trade-off;
quality of institutions; composition of capital flows; sequencing.
4ECBWorking Paper Series No. 348April 2004

Non-technical summary
The financial crises of the 1990s rekindled the debate on the benefits of financial
liberalisation. Economic theory is ambiguous about the relationship between financial
openness and economic growth. Models based on the paradigm of competitive and efficient
markets tell us that financial openness should foster economic growth and development by
improving the allocation of capital. By contrast, others have stressed that the presence of
market distortions may lead to welfare reducing effects of financial liberalisation. Such
market distortions can take various forms, such as asymmetric information and hidden action
(e.g. Stiglitz 1998), or be related to political economy factors (e.g. Bhagwati 1998).
Despite significant research efforts in recent years, the empirical literature is still very much
divided on whether financial liberalisation benefits economies, and if so what the necessary
prerequisites and conditions are. While some countries have benefited from financial
liberalisation, others have not enjoyed higher economic growth or have even experienced
severe crises and recessions in the years following liberalisation.
The central hypothesis of the paper is that a key reason for the elusive evidence of a robust
openness-growth nexus is the presence of a time-varying relationship between openness and
growth over time. This implies that there may be an intertemporal trade-off in that countries
tend to gain in the short-term, immediately following capital account liberalisation, but may
not grow faster or even experience temporary growth reversals in the medium- to long-term.
The objective and intended contribution of the paper are to test for such an intertemporal
trade-off empirically for a broad set of 45 developing and developed economies. Using a
standard growth model, the paper starts by comparing open and closed economies and
confirms much of the literature's results that open economies indeed do not grow more rapidly
than closed ones. Looking at a broad set of potential explanatory factors, it is found that it is
in particular the quality of domestic political institutions that play a key role in explaining
why some countries benefit from liberalisation whereas others with weaker institutions
experience lower growth.
The paper then takes a different angle from the literature and tests for the presence of a time-
varying relationship between openness and growth over time. The paper distinguishes
between the initial, short-run reaction and the medium- to long-run response of economies to
financial liberalisation. It presents evidence that economies indeed tend to receive an initial
5ECB
Working Paper Series No. 348April 2004

boost and grow faster in the initial five years following financial liberalisation. However, after
this short-run gain, economies tend to grow more slowly in the subsequent years. This
suggests that there is indeed a trade-off over time, i.e. a short-run gain and a medium/long-run
"pain".
More specifically, countries that gain in the initial five-year period after liberalisation are
those that experience an investment boom, have large portfolio investment and debt inflows
and have larger current account deficits. These findings provide support of the McKinnon-Pill
(1997) hypothesis of the presence of an "overborrowing syndrome" after liberalisation.
Moreover, it is found that what promotes growth in the medium- to long-term are the quality
of institutions as well as the composition of capital inflows. Overall, therefore, the findings
imply that the quality of institutions as well as the size and composition of capital inflows are
two key determinants for why some countries benefit from financial liberalisation in the
medium- to long-run.
6ECBWorking Paper Series No. 348April 2004

1 Introduction
Although economic theory, based on models of competitive and efficient markets, tells us that
financial openness should foster economic growth and development, empirical work so far
has not found convincing evidence for the existence of such a link. While some countries
have benefited from financial liberalisation, others have not enjoyed higher economic growth
or have even experienced severe crises and recessions in the years following liberalisation.
The counter-argument to those underlining the benefits of liberalisation based on the efficient-
market paradigm has been to stress the presence of market distortions that may lead to welfare
reducing effects of financial liberalisation. Such market distortions can take various forms,
such as asymmetric information and hidden action (e.g. Stiglitz 1998), or be related to
political economy factors (e.g. Bhagwati 1998).
Some recent theoretical work has argued that the main benefits from liberalisation may not
come from having access to external capital, but primarily from the fact that the process of
opening up leads to a reduction of domestic distortions and locks in reforms (Gourinchas and
Jeanne 2002). The recent empirical literature on the issue has investigated a broad set of
potential factors and distortions, such as the role of financial depth and development, the
quality of domestic institutions, the sequencing of reforms, and the composition of capital
inflows. Despite this effort, however, remarkably little consensus has so far been reached
about the underlying forces that make financial liberalisation raise economic growth.1
This lack of evidence in favour of a robust openness-growth nexus is puzzling in several
regards. In particular, an important caveat is that today’s most developed economies all have
open capital accounts2 and liberalised domestic financial sectors. Moreover, those emerging
markets and transition countries that have opened up, did so relatively recently, mostly
between the late 1980s and the mid-1990s. The key question therefore does not seem to be
whether countries benefit from liberalisation in the (very) long-run, but the timing and the
circumstances under which they benefit.
A key hypothesis that has received little attention in the empirical literature is that there may
be a trade-off over time between openness and growth. The theoretical work by Gourinchas
and Jeanne (2002) implies that financial liberalisation yields only a one-off benefit for
1 See Edison et al. (2002a) and Eichengreen (2002) for recent surveys of this literature. A relatedliterature has emerged that focuses on the link between domestic financial structure and economicgrowth, which is discussed in detail e.g. in Demirguc-Kunt and Levine (2001).
7ECB
Working Paper Series No. 348April 2004

economies in the short-term, which subsequently return to their long-term growth path.
McKinnon and Pill (1997, 1999) argue that, in the short-run, improved access to foreign
capital may lead to "overborrowing", i.e. an investment boom, and thus temporarily higher
growth. However, this initial bubble may be followed by a severe bust, financial crisis and
economic contraction as the boom becomes unsustainable.3 Hence countries opening up their
financial markets may experience a boom and higher growth in the short-run, followed by a
recession and a temporary "bust" in the medium-term, and may reap the full gain from
liberalisation only in the very long-run. The theoretical arguments by McKinnon and Pill
(1997, 1999) therefore imply a short-run gain and either no gain or a medium- to long-run
pain from financial liberalisation.
The objective of the paper is to test for such an intertemporal trade-off empirically for a broad
set of 45 developed countries and emerging market economies. The paper distinguishes
between the initial, short-run reaction and the medium- to long-run response of economies to
financial liberalisation. It presents evidence that economies indeed tend to receive an initial
boost and grow faster in the initial five years following financial liberalisation. However, after
this short-run gain, economies tend to grow more slowly in the subsequent years. This
suggests that there is indeed a trade-off over time, i.e. a short-run gain and a medium/long-run
"pain". Given that most emerging markets liberalised only within the last decade, an
important caveat is, however, that this cost in the medium-term may be only be a temporary
one, and that countries may return to faster growth in the long-run, following the experience
of most developed economies decades earlier. It therefore may be too early to tell whether
developing countries will really gain in the long-run from liberalisation.
The literature has so far given little attention to this potential intertemporal trade-off.
Kaminsky and Schmukler (2003) look at a similar trade-off, though not for economic growth
but for equity markets. They find that the amplitude of boom-bust cycles in equity markets is
higher in the initial period after liberalisation, and that it falls subsequently. In the literature
on openness and growth, the work that analyses a related issue is that of Eichengreen and
Leblang (2003). They argue that the reason for the lack of evidence for a positive relationship
between openness and growth in the literature is its failure to account for financial crises.
They indeed find that countries grow faster when controlling for crises. However, the
difficulty with this argument is one of endogeneity, i.e. that countries may be experiencing
2 Note that what the paper calls "capital account" refers in fact to the financial account according to theIMF's 5th Balance of Payments Manual. However, the paper sticks to the commonly used terminology.3 In McKinnon and Pill (1997, 1999), it is moral hazard that induces excessive investment and risk-taking as investors are insufficiently supervised and expect to be bailed out if investment projects fail.
8ECBWorking Paper Series No. 348April 2004

severe crises because they have liberalised. Hence, as in the McKinnon-Pill argument, the
initial boom in growth may come at the cost of lower growth or recession later on.
Looking at the wider literature on openness and growth, Grilli and Milesi-Ferretti (1995) were
among the first who pointed out the lack of a positive effect of capital account liberalisation -
proxied by the removal of restrictions to capital account transactions as published in the IMF's
Annual Report on Exchange Arrangements and Exchange Restrictions (AREAR) - on growth
for 61 countries between 1966 and 1989. Rodrik (1998) also fails to find a positive openness-
growth nexus for close to 100 countries, using a similar openness measure, although his
approach is a purely cross-sectional one in which he analyses whether countries that had been
open for a relatively longer part of the period 1975-89 also experienced faster economic
growth. The findings of these two influential studies stand in sharp contrast to those of Quinn
(1997), who develops an original measure of openness, also based on AREAR but allowing
for different degrees of openness. He finds that the change in his openness measure is indeed
significant in explaining faster real GDP growth for a set of 58 countries in 1960-89.
After the sharp contrast of these findings, most of the recent papers have essentially attempted
to verify the robustness of the results using different country samples, openness measures,
time periods and empirical methodologies. Eichengreen (2002) points out that a large part of
the different results may come from the fact that Quinn's sample includes more industrialised
countries and relatively fewer observations of the lost decade of the 1980s. Edwards (2001),
Bailliu (2000) and Klein and Olivei (1999) indeed find evidence that openness promotes
growth in industrialised countries, although Edwards' (2001) results also reveal that openness
tends to hurt growth in developing countries. Arteta, Eichengreen and Wyplosz (2001), by
contrast, argue that Edwards' results are sensitive to several exogeneity assumptions and the
choice of the empirical methodology. Moreover, they find some positive effect of openness
on growth only if countries have stable macroeconomic conditions.
Edison et al. (2002b) also do not detect any strong empirical link between openness and
growth although they use a broad variety of different openness measures - both based on the
AREAR and on de facto measures of openness - for a broad set of countries and using three
different methodologies, two cross-sectional ones based on OLS and IV and one based on a
dynamic panel data model using GMM. Finally, Bekaert, Harvey and Lundblad (2001)
analyse a different type of openness by looking at the effects of stock market liberalisation on
growth in a panel framework. They find that equity market liberalisation leads to a 1%
increase in annual GDP growth during the five years after liberalisation.
9ECB
Working Paper Series No. 348April 2004

The intended contribution of this paper is to take a different angle from the literature and to
test for the presence of a time-varying relationship between openness and growth over time,
i.e. the presence of an intertemporal trade-off between growth and financial liberalisation.
Using a standard growth model, the paper starts by comparing open and closed economies
and confirms much of the literature's results that open economies indeed do not grow more
rapidly than closed ones. Looking at a broad set of potential explanatory factors, it is found
that it is in particular the quality of domestic political institutions that play a key role in
explaining why some countries benefit from liberalisation whereas others with weaker
institutions experience lower growth.
Analysing the intertemporal trade-off, it is found that countries indeed tend to grow more
quickly immediately after liberalisation and slower in the medium-term. More specifically,
countries that gain in the initial five-year period after liberalisation are those that experience
an investment boom, have large portfolio investment and debt inflows and have larger current
account deficits. These findings provide support of the McKinnon-Pill hypothesis of the
presence of an "overborrowing syndrome" after liberalisation. Moreover, it is found that what
promotes growth in the medium- to long-term are the quality of institutions as well as the
composition of capital inflows. Overall, therefore, the findings imply that the quality of
institutions as well as the size and composition of capital inflows are two key determinants for
why some countries benefit from financial liberalisation in the medium- to long-run.
The paper proceeds as follows. Section 2 outlines some key conceptual and data issues. The
section includes a discussion of alternative openness measures used in the literature, and in
this paper, for quantifying financial openness. Moreover, the country sample, data and
variable definitions and the empirical methodology are discussed. Section 3 then presents the
empirical findings, first starting with a comparison of open versus closed economies. The
final parts of the section then show and discuss the findings for the intertemporal trade-off of
financial openness for the sample of 45 countries. Section 4 provides conclusions and
discusses some policy implications.
2 Conceptual issues, data and methodology
2.1 Measuring financial opennessA key conceptual issue is the question of how to measure capital account openness. Two
broad approaches can be found in the literature: one based on measuring de jure openness,
and one measuring de facto openness. De jure openness is mostly proxied by the removal of
10ECBWorking Paper Series No. 348April 2004

restrictions to capital account transactions as published in line E.2 of the IMF's AREAR,
although also the OECD Code of Liberalisation of Capital Movements has similar
information, albeit only for OECD countries. The AREAR measure has been utilised in
different forms in the literature. The usual way is to simply define it as a discrete 0-1 variable,
i.e. indicating full openness or closedness. Studies using longer time periods, such as e.g. 5-
year periods, generally use the share of the years in which a country had an open capital
account as the measure of openness. The advantage of these measures is that they allow for a
clear and easy identification of when a country had removed all barriers to capital account
transactions. However, a drawback is that countries may liberalise their capital accounts by
removing individual barriers gradually over time.4
As an alternative, Quinn (1997) exploits the details of the descriptions in the AREAR to
construct an openness measure which can take 9 different degrees of openness - from 0 to 4 in
0.5 point increments. This allows for a much finer categorisation of de jure openness and its
changes. However, a key drawbacks is that this openness measure has been created only for
four years - 1958, 1973, 1982 and 1988 - thus not allowing the identification of in which
years a country undertook those changes.
As an alternative to these de jure measures, the literature has analysed various de facto
proxies of openness. The rationale for looking at actual openness is that a country that is open
de jure may not necessarily experience such inflows. Since the question of interest is whether
capital flows benefit or hurt countries, one may argue that one should define openness in
terms of both legal restrictions and actual capital flows. The literature has looked at various
capital flows as related to FDI, portfolio flows and debt flows (e.g. Kraay 1998).
Moreover, what may matter for whether countries grow faster or slower may not be the flows
per se, but the stock (cumulated flows) of foreign capital into the countries. Some work
therefore builds on the pioneering work by Lane and Milesi-Ferretti (2001) and employs net
foreign asset positions to capture a country's capital stock (e.g. Edison et al. 2002b). However,
in addition to measurement difficulties, one problem with using actual capital flow or stock
data is that there may be a non-linear relationship between the magnitude of capital flows and
economic performance: countries may benefit from modest inflows, but may not do so if
capital inflows become very large, and they may gain if they take some forms, such as FDI,
rather than others.
4 Related measures of openness, but for domestic equity markets and not capital accounts, have beendeveloped by Bekaert and Harvey (1995), Levine and Zervos (1998), Bekaert, Harvey and Lundblad(2001) and Edison and Warnock (2002).
11ECB
Working Paper Series No. 348April 2004

One key difficulty of analysing the link between financial openness and growth is that the
opening process may not be purely exogenous, or at least may be correlated with other
developments in the economy. This problem may be particularly acute for the de facto
openness measures because actual capital inflows are likely to be at least in part the response
of investors to such factors as investment opportunities, the economic and political
environment etc. This potential problem should be less serious for the de jure measure as this
refers to a usually one-off decision to abolish legal restrictions.5
In essence, therefore, the link between de jure openness and growth versus the relationship
between de facto openness and growth can contain two quite distinct questions. From a policy
perspective, both questions are clearly of significant importance. The first leads to the issue of
whether, when and how government should remove barriers to capital account transactions.
The second question requires policy-makers to decide, given that legal barriers have been
removed, how best to "manage" capital flows, i.e. what the desired magnitude, composition,
maturity etc. are. This paper attempts to analyse the role both of de jure and of de facto
openness, though its emphasis is on the former.
2.2 Data and definitionsThe paper analyses the openness-growth nexus for a set of 45 developed countries and
emerging market economies: 11 OECD, 12 Asian, 8 Latin American, 9 European Union (EU)
acceding countries6, plus Bulgaria, Romania, Russia, South Africa and Turkey. The time
period analysed is from 1980 to 2002. Many of the 45 countries opened up their capital
accounts between 1985 and 1995, while most of the OECD countries in the sample liberalised
in the 1960s and 1970s. Thus the important point by Eichengreen (2002) that the results tend
to be sensitive to the chosen country sample also applies to this set of countries, although a
sensitivity analysis is conducted in the empirical part below. Thus, our sample includes
relatively homogeneous countries and excludes in particular Least Developed Economies
(LDCs), partly for data availability reasons, but also because the trade-off issue analysed in
this paper arises only for countries with a relatively more mature financial system.
For the de jure measure of capital account openness, the paper mostly uses the data from
Kaminsky and Schmukler (2003). The Kaminsky-Schmukler dataset allows distinguishing
5 In a few cases, such as in Latin America in the early 1980s and Malaysia temporarily in 1998-99,governments decided to reverse the liberalization and close their capital account. However, these casesare rare, as shown by Olivei and Klein (1999). This could be interpreted as a sign that the politicaldecision to liberalize is exogenous: otherwise, economic crises would lead to liberalization reversalsmore often.6 Only Malta is not included due to data availability.
12ECBWorking Paper Series No. 348April 2004

between three degrees of openness, i.e. between "partially liberalised", "fully liberalised" and
“closed” regimes. Moreover, they create similar measures for the openness of domestic equity
markets and domestic financial markets for 28 countries for the period 1973-99. Most of their
data is based on the IMF's AREAR. What is missing from their dataset, however, are in
particular the acceding countries. This paper adds these countries by using information from
the EBRD's annual transition reports. Due to the transition process from communist systems,
these countries are included only starting in the early to mid-1990s.
For the de facto openness measures, following Edison et al. (2002b) and Kraay (1998), the
paper looks at seven different flow variables, four based on FDI and portfolio flows -
combined FDI and portfolio net flows, combined FDI and portfolio inflows, FDI inflows,
portfolio inflows - two proxies related to the size and composition of foreign debt - total
foreign debt, and short-term foreign debt - and trade openness - defined as the sum of exports
and imports. Moreover two proxies are employed for stock variables - combined FDI and
portfolio net stocks, combined FDI and portfolio in-stocks. Net flows and stocks refer to the
difference between the asset and liabilities sides of the balance of payments (b.o.p.) in a
particular period.7
Stocks are defined as cumulated flows, starting mostly in 1980s, where available. This
measure of the capital stock held by foreigners is clearly a very imperfect one given that it
does not exploit information about the existing capital stock at the beginning of the period and
also ignores valuation changes to the net international investment positions (i.i.p.). However,
the available dataset on net foreign assets by Lane and Milesi-Ferretti (2001) does not include
several of the countries and periods covered by the paper.
Looking at the different flow variables allows analysing the role of the composition of capital
flows, while the liberalisation of different segments and markets in the Kaminsky-Schmukler
dataset enables testing for the importance of the sequencing of liberalisation.
In order to check for the relevance of the quality of institutions, the paper utilises the rich
database of International Country Risk Guide (ICRG) on various political country
characteristics, in particular on the quality of the bureaucracy, corruption, democratic
accountability, government stability, law and order and socio-economic conditions. This data
is available from 1980 to 2002 on a monthly basis. The paper is the first one in the literature
to analyse these factors in detail. Chinn and Ito (2002) also investigate the issue, but their
7 All measures are calculated as a percentage of GDP in a given country and given year, see Appendix.
13ECB
Working Paper Series No. 348April 2004

focus is more on legal restrictions, such as creditor rights and protection, transparency of
accounting reports, and other micro measures, based largely on the seminal work by La Porta
et al. (1998).
Finally, to test also for the role of macroeconomic conditions, the empirical section looks at
various macroeconomic indicators - current account and trade balances, private consumption
and private investment, per capita income as a proxy for the stage of development a country
has reached, government expenditure and inflation. Many of these measures have been
utilised in the literature (e.g. Arteta, Eichengreen and Wyplosz 2001) and are measured as
ratios relative to GDP.
2.3 Empirical methodologyThe starting point of the empirical modelling is a simple growth model that is standard in the
literature (e.g. Barro and Sala-i-Martin 1995). The dependent variable is the growth rate of
real per capita GDP. The control variables are the log of real per capita income at the
beginning of the period, the investment to GDP ratio, the population growth rate, as well as
government expenditure as a ratio of GDP. The paper follows the modelling strategy of the
great majority of studies in the literature and uses this model as benchmark. Subsequently,
other variables of interest and interaction terms are added to the benchmark model, so that the
variables of the benchmark model stay in the model but are complemented by other variables
of interest. The objective is to evaluate the marginal effect of the capital account variables on
output growth, controlling for other possible determinants.
The paper employs a dynamic panel-data approach, which allows us to exploit both the within
and the between information of the data. We use 5-year averages of the variables to reduce the
volatility and to avoid the drawback of having strong cyclical factors in the data. A number of
papers in the literature use the same or a very similar approach (e.g. Edison et al. 2002b,
Eichengreen and Leblang 2003, Bekaert et al. 2001). This transformation entails that for the
45 countries mostly five 5-year periods exist (1980-84, 1985-89, 1990-94, 1995-99, 2000-02),
though Central and Eastern European countries are only included starting in the 1990s. The
openness measure is a dummy variable that takes the value of one if a country's capital
account was open for the majority of the 5-year period and zero otherwise. Several sensitivity
checks have been conducted, and showed that the results were robust to altering the
specification by e.g. including instead the share of the years a country was open during a
period.
14ECBWorking Paper Series No. 348April 2004

As to the estimation technique, one option is to use a fixed-effects estimator, which allows for
country idiosyncratic effects. The autocorrelation and persistence in the data, however,
requires a dynamic estimation of the model. The problem with the fixed-effects estimator is
that the dynamic transformation is likely to introduce an inconsistency of the estimator for
models with few time series observations and a large number of cross-sectional observations
(see Nickell 1981). This is likely to be the case for this model since T=5 and N=45.
The estimation technique used instead is the GMM estimator introduced by Arellano and
Bond (1991). This GMM estimator is a dynamic one that estimates the model in first
differences and uses lagged values of the variables as instruments. The starting point is a
standard specification in levels, where the real per capita growth rate yi,t is persistent, i.e. it is
a function of its own past values. The model includes a set of independent variables Xi,t,
which are assumed to be weakly exogenous, and a country fixed effect µi
ititititi Xyy ���� ����� ,,1,, (1)
After taking first differences, the previous equation yields:
titititi Xyy ,,1,, ��� ��������
(2)
One result of the transformation is that all variables that are time-invariant, such as the
country fixed effects, drop out from the model. A key problem with the model of equation (2)
is the potential endogeneity of the control variables as well as the correlation between the
lagged dependent variable yi,t-1 and the error term ∆εi,t. This problem can be solved by using
higher-order lags of yi,t-1 as instruments for yi,t-1. For the GMM estimator to yield unbiased
and consistent estimators requires the validity of the moment conditions
� � � � 10,, ��������
kXEyE kttiktti �� (3)
To keep a sensible relationship between the number of cross-sectional observations and the
number of overidentifying restrictions, only one lag of the dependent variable is used as
instrument. This implies that � � 02, ���tti yE � for each of the five time series observations,
so that there are four overidentifying restrictions (5 identifying restrictions, and one to
identify τ). The validity of these restrictions can then be tested via a Sargan test, using a χ2
distribution with four degrees of freedom.
15ECB
Working Paper Series No. 348April 2004

3 Empirical results
3.1 Openness and growth: Some stylised factsAs a starting point, it is useful to look at some stylised facts for various macroeconomic and
institutional variables around the time of capital account liberalisation. For this purpose, this
sub-section provides an event study, which is shown in Figure 1. The charts show the
evolution of key economic variables in the ten years preceding and following liberalisation as
an average over all countries in the sample. The choice of the variables presented is motivated
by the choice of the variables in the econometric analysis of the subsequent sections.
A first interesting stylised fact is that real per capita GDP growth in the sample of 45
countries indeed increased immediately following liberalisation - indicated by period t=0 in
the figures - but then falls back roughly to its pre-liberalisation levels thereafter. Second, the
investment to GDP ratio undergoes a similar trend as the growth rate. Third, concerning
capital flow variables, portfolio inflows and short-term debt inflows seem to accelerate
relatively quickly after liberalisation. By contrast, FDI inflows rise more gradually over time.
Fourth, in terms of liberalisation of domestic equity markets and financial markets - a point
related to the sequencing of reforms analysed in more detail in section 3.5 below - an
important stylised fact is that about 40% of the countries had liberalised either their domestic
financial markets, their domestic equity markets or both prior to opening up their capital
account.8 The other countries liberalised these markets either roughly simultaneously or later
than the capital account. Finally, the ICRG total composite index and the political risk index
improve significantly in the years before and after liberalisation.9
A final noteworthy point is that the divergence of the variables - shown by the standard
deviations in the figures - is not only relatively large, but mostly increases significantly after
liberalisation. This rise is particularly strong for the capital flow variables. Overall, these
stylised facts show some interesting results. But they also underline that despite some marked
differences between the pre-liberalisation and post-liberalisation periods, as well as between
the short-term versus long-term post-liberalisation periods, one cannot readily draw a clear-
cut conclusion about the link between openness and growth. The aim of the econometric
analysis is to carefully disentangle these effects.
8 For these variables, the y-axis shows the percentage share of all countries that had liberalized at anyone point in time.9 Note that a higher measure for the institutional variables implies an improvement in institutions.
16ECBWorking Paper Series No. 348April 2004

Figures 1: Event study - Macroeconomic and institutions variables
Real per capita GDP growth (in %)
-5.0
0.0
5.0
10.0
-10 -8 -6 -4 -2 0 2 4 6 8 10
growth +/- 1 std.dev.
FDI inflows to GDP ratio (in %)
-5.0
0.0
5.0
10.0
-10 -8 -6 -4 -2 0 2 4 6 8 10
FDI inflows/GDP +/- 1 std.dev.
Portfolio inflows to GDP ratio (in %)
-5.0
0.0
5.0
10.0
-10 -8 -6 -4 -2 0 2 4 6 8 10
portfolio inflows/GDP +/- 1 std.dev.
Trade openness to GDP ratio (in %)
0.0
40.0
80.0
120.0
160.0
-10 -8 -6 -4 -2 0 2 4 6 8 10
trade openness/GDP +/- 1 std.dev.
Short-term debt to GDP ratio (in %)
0.0
5.0
10.0
15.0
20.0
-10 -8 -6 -4 -2 0 2 4 6 8 10
short-term debt/GDP +/- 1 std.dev.
Investment to GDP ratio (in %)
10.0
20.0
30.0
40.0
-10 -8 -6 -4 -2 0 2 4 6 8 10
investment/GDP +/- 1 std.dev.
Domestic financial sector liberaliation (in %)
0.0
20.0
40.0
60.0
80.0
100.0
-10 -8 -6 -4 -2 0 2 4 6 8 10
domestic financial sector share
Domestic equity market liberalization (in %)
0.0
20.0
40.0
60.0
80.0
100.0
-10 -8 -6 -4 -2 0 2 4 6 8 10
domestic equity market share
ICRG total composite index
50.0
60.0
70.0
80.0
90.0
-10 -8 -6 -4 -2 0 2 4 6 8 10
ICRG total composite index +/- 1 std.dev.
ICRG political risk index
50.0
60.0
70.0
80.0
90.0
-10 -8 -6 -4 -2 0 2 4 6 8 10
ICRG political risk index +/- 1 std.dev.
17ECB
Working Paper Series No. 348April 2004

3.2 Openness and growth: is there a relationship?As a first step of the econometric analysis, this section repeats the analysis typically done in
the literature by testing whether open economies per se grow faster than closed ones. The
benchmark model is therefore
titiLIBtiti XDy ,,,, ���� ���� (4)
with y as the growth rate, DLIB the dummy for capital account openness, and X as a vector of
macroeconomic and institutional controls. The control variables X include not only those
suggested by the standard Barro - Sala-i-Martin growth framework, but also additional
variables of interest, which are then added one by one to the model. The above-described
Arellano-Bond dynamic panel data estimator is employed.
In addition, distinguishing explicitly between short-run liberalisation (DST-LIB) – the
immediate five years after liberalisation – and the long-run liberalisation period (DLT-LIB) –
more than five years after liberalisation of the financial account – yields the following model
titiLIBLT
tiltLIBST
tistti XDDy ,,,,, ����� ������� (5)
Table 1 shows the empirical results for the 45 countries and the period 1980-2002. Consistent
with much of the literature, no significant relationship between openness and growth is found
(model (1)). However, there is a strong positive and significant link between openness and
growth when controlling for financial crises (model (2)). Financial crises are defined as large
currency devaluations, following the methodology used in Bussiere and Fratzscher (2002). In
other words, financial openness is conducive to growth if one controls for crises.10
This finding is in line with those by Eichengreen and Leblang (2003). However, the problem
with interpreting these results is that the occurrence of financial crises can not be assumed to
be exogenous to financial liberalisation. Leblang (2001) and Bordo, Eichengreen, Klingenbiel
and Martinez Peria (2001) show that financial crises are more frequent among closed
economies. However, the results found here as well as in Eichengreen and Leblang (2003)
imply that financial crises tend to be more severe in open economies in terms of lost growth.
10 The coefficients on the control variables are correctly signed and significant at the 5% level. Ahigher initial income per head implies a lower growth rate (catching up effect), higher investment is (asexpected) associated with higher growth, the positive sign of government expenditure suggests thepresence of a Keynesian effect in the short-run while the political risk indicator (for which an increaserepresents an improvement) has a positive effect on growth.
18ECBWorking Paper Series No. 348April 2004

Table 1: Effects of liberalisation on growth: Benchmark results
Distinguishing between the effects of financial liberalisation on short-term versus long-term
growth, as in equation (5), reveals that economies tend to grow significantly faster in the
immediate five years after liberalisation - both with and without controlling for crises (models
(3) and (4)). By contrast, growth after the initial five-year period is not significantly different
compared to other periods.
Table 2 shows the extension of the model presented in equation (4) by adding various de facto
openness measures, other macroeconomic variables and various institutional factors. Note that
each of the variables is added separately to the benchmark model.11 Consistent with much of
the literature, no significant link is found to exist between the de facto openness measures and
growth. For the macroeconomic variables, only short-term debt is significantly negatively
related to growth. By contrast, several of the institutional variables are significantly linked to
the growth performance of countries. In particular, an improvement in political institutions
leads to higher growth.
In summary, the findings presented in the subsection are important ones because they
underline that in order to understand the link between financial openness and growth,
researchers need to look not only at country-specific characteristics relevant for growth, but
also at the time dynamics of the liberalisation process.
11 The coefficients of the other variables are not reported for space reasons and are available uponrequest.
Arellano-Bond dynamicpanel data estimator
Independent variable X: coef. t-stats coef. t-stats coef. t-stats coef. t-stats
Openness: Post-liberalisation 0.755 1.140 1.611 ** 2.630 Short-term post-liberalisation 1.561 * 1.850 2.201 ** 2.980 Long-term post-liberalisation 0.332 0.320 0.805 0.900
Macroeconomic & other variables:Initial income per capita -0.026 ** -3.480 -0.023 ** -3.500 -0.023 ** -2.380 -0.019 ** -2.350Investment1 0.095 1.530 0.149 ** 2.620 0.026 0.340 0.065 0.980Government expenditure1 0.322 ** 4.880 0.272 ** 4.540 0.266 ** 2.910 0.257 ** 3.310Composite political risk indicator 0.055 * 1.680 0.077 ** 2.600 0.073 1.590 0.125 ** 3.090Financial crisis dummy -7.510 ** -4.920 -9.547 ** -4.500
test of difference 2 0.125 0.041
Notes:1 variable is measured as a ratio relative to GDP.2 p-value of test of null hypothesis that growth in short-term liberalisation period is equal to growth in long-term liberalisation period. **, * indicate significance at the 5% and 10% levels, respectively.
(3) (4)(1) (2)
19ECB
Working Paper Series No. 348April 2004

Table 2: Effects of liberalisation on growth: Additional macroeconomic and
institutional variables
3.3 Which countries benefit from liberalisation?So far the paper has established a positive relationship between growth and openness
immediately after liberalisation takes place. Before proceeding to the analysis of the
intertemporal trade-off in section 3.4, the present sub-section investigates in detail whether
there are certain macroeconomic or institutional characteristics that are a pre-condition for
countries to benefit from capital account liberalisation. For that purpose, the estimated model
becomes
Arellano-Bond dynamicpanel data estimator
Independent variable X: � t-stats � t-stats
De facto openness measures:Combined FDI & portfolio inflows1 0.006 0.220 0.010 0.430Combined FDI & portfolio net flows1 0.012 0.140 0.048 0.620Combined FDI & portfolio in-stocks1 -0.006 -0.810 -0.007 -1.070Combined FDI & portfolio net-stocks1 -0.010 -0.690 -0.013 -1.060
Size and composition of capital inflows:FDI inflows1 -0.020 -0.190 0.004 0.040Portfolio investment inflows1 0.013 0.390 0.017 0.560Trade openness1 0.015 1.090 0.006 0.510
Other macroeconomic variables:Inflation 0.003 0.230 -0.003 -0.260Private consumption1 -0.013 -0.240 -0.028 -0.590Private investment1 0.002 0.860 0.001 1.180Current account1 0.026 0.400 -0.008 -0.010Trade balance1 0.011 0.190 -0.013 -0.240Total debt1 -0.020 -1.080 -0.190 -1.130Short-term debt1 -0.163 ** -2.290 -0.146 ** -2.370
Institutional variables:Total composite risk indicator 0.186 ** 2.850 0.139 ** 3.880 Composite political risk indicator 0.055 * 1.680 0.077 ** 2.600 Quality of Bureaucracy -0.839 * -1.850 -0.663 * -1.640 Corruption -0.392 -1.500 -0.204 -0.860 Democratic accountability 0.131 0.530 0.095 0.430 Government stability -0.085 -0.570 -0.134 -1.020 Law & order -0.233 -0.960 -0.277 -1.050 Socioeconomic conditions 0.354 ** 2.610 0.225 1.530
Notes:1 variable is measured as a ratio relative to GDP. **, * indicate significance at the 5% and 10% levels, respectively.
without crisis control with crisis control(1) (2)
20ECBWorking Paper Series No. 348April 2004

� � titiLIBtiti
LIBtiti XDXDy ,,,,,, ����� ����� (6)
where openness is now interacted with the macroeconomic or institutional variable Xi,t. The
first column in Table 3 shows the effect γ of the variables when a country is closed, and the
second column the effect (γ+λ) when a country is open. The third column indicates whether
the difference between both effects is significant, i.e. whether a particular factor has a
statistically stronger effect on growth when a country is open as opposed to when it is closed.
Table 3: Interaction of openness and macroeconomic variables
The results confirm in particular that financial crises are more severe in terms of a loss in
growth when economies are open financially. An open economy suffering a financial crisis
grows, on average, 8% less over the corresponding five-year period compared to non-crisis
countries. By contrast, the loss in growth is only 6% for countries that are closed and
experienced a crisis.
Moreover, a further interesting finding is that the quality of institutions seems to be
significantly more important for open economies than for closed ones in order to raise the rate
Arellano-Bond dynamicpanel data estimator
Independent variable X: � t-stats ����� p-value 2 p-value
De facto openness measure & composition of capital inflows:Combined FDI & portfolio inflows1 0.148 0.318 -0.002 0.945 0.319FDI inflows1 0.161 0.830 -0.070 0.531 0.244Portfolio investment inflows1 0.137 0.642 0.009 0.794 0.663Trade openness1 0.000 0.480 -0.001 0.889 0.894
Other macroeconomic & institutional variables:Initial income per capita -0.032 ** -2.550 -0.027 ** 0.001 0.726Investment1 0.152 ** 2.220 0.010 0.899 0.081 +
Government expenditure1 0.335 ** 3.650 0.312 ** 0.000 0.838Composite political risk indicator 0.033 0.388 0.093 ** 0.049 0.065 +
Financial crisis dummy -6.156 ** -2.450 -8.173 ** 0.000 0.093 +
Current account1 0.058 0.710 -0.007 0.931 0.512Trade balance1 0.075 1.060 -0.051 0.454 0.090 +
Private consumption1 -0.031 -0.480 -0.002 0.973 0.661Total debt1 0.014 0.620 -0.064 ** 0.008 0.004 ++
Short-term debt1 0.097 0.800 -0.291 ** 0.001 0.010 ++
Notes:1 variable is measured as a ratio relative to GDP.2 p-value of test of null hypothesis that the total effect of the respective variable is zero in the liberalisation period.3 p-value of test of null hypothesis that the effect of the respective variable is the same in liberalisation as compared to non-liberalisation period. **, * and ++,+ indicate significance at the 5% and 10% levels, respectively.
liberalisationpre- test of difference3
liberalisation pre versus postpost
21ECB
Working Paper Series No. 348April 2004

of economic growth. Not only is there a significant gain in terms of higher growth from
improving political institutions in an open economy, but this gain is also significantly larger
than that for closed economies.
As to the macroeconomic variables, it is found that the total debt and short-term debt ratios
hurt growth only in open economies, confirming the importance of the external debt variables
already indicated in Table 2.
3.4 The intertemporal trade-off: Short-run gain versus long-run pain?The present subsection now turns to the question of why there is an intertemporal trade-off
between openness and growth. Table 1 showed that economies tend to grow significantly
faster in the initial period after liberalisation, while they seem to not gain in the medium- to
long-term. Why is this the case? In particular, do some variables spur growth in the short-run,
but inhibit growth in the long-run?
To address these questions, the following model is estimated:
� � � � titiLIBLT
tilttiLIBST
tisttiLIBLT
tiltLIBST
tistti XDXDXDDy ,,,,,,,,, ������� �����������
(7)
which is based on the same idea as equation (6), but distinguishes between the short-run
liberalisation period (DST-LIB) and the medium- to long-term liberalisation periods (DLT-LIB).
Tables 4 and 5 show the empirical findings. As to the macroeconomic control variables, a first
important result is that poorer economies - proxied by the initial income per capita - gain
more from financial liberalisation than richer ones in the immediate aftermath of
liberalisation, but not afterwards. Second, investment is positively related to growth only in
the years immediately after liberalisation, but not significantly related to growth in the
medium- to long-term.
A third important finding is related to the de facto openness measures. Portfolio investment
inflows are found to raise growth substantially in the short-run, but not in the long-run. By
contrast, countries tend to benefit from FDI inflows only in the medium-to long-run but not in
the short-run after liberalisation. The effect of portfolio investment on growth is much
stronger than the effect of FDI, which is shown by the size and significance of the coefficient
of combined portfolio and FDI inflows in the short-term post liberalisation period.
22ECBWorking Paper Series No. 348April 2004

Table 4: Intertemporal trade-off of liberalisation: Macroeconomic variables,
openness and the composition of capital flows
Table 5: Intertemporal trade-off of liberalisation: ICRG - quality of institutions
Arellano-Bond dynamicpanel data estimator
Independent variable X: � t-stats ����st� p-value 2����lt� p-value 2 p-value
De facto openness measure & composition of capital inflows:Combined FDI & portfolio inflows1 0.062 0.370 0.320 ** 0.049 0.056 0.597 0.091 +
FDI inflows1 0.074 0.360 0.129 0.566 0.319 * 0.065 0.098 +
Portfolio investment inflows1 -0.080 -0.230 0.468 ** 0.031 -0.014 0.673 0.030 ++
Trade openness1 0.018 * 1.730 0.022 0.253 0.026 0.213 0.875
Other macroeconomic & institutional variables:Initial income per capita -0.037 ** -3.170 -0.047 ** 0.000 -0.026 ** 0.001 0.004 ++
Investment1 0.096 1.280 0.125 * 0.098 -0.089 0.362 0.039 ++
Government expenditure1 0.353 ** 3.680 0.318 ** 0.000 0.219 ** 0.002 0.505Composite political risk indicator 0.067 ** 2.020 0.097 0.166 0.175 ** 0.005 0.100 +
Financial crisis dummy -6.950 ** -3.120 -12.513 ** 0.023 -18.466 ** 0.000 0.128Current account1 0.084 0.980 -0.023 0.852 0.017 0.845 0.699Trade balance1 0.077 1.060 -0.027 0.793 -0.017 0.815 0.901Private consumption1 -0.023 -0.340 -0.017 0.842 -0.019 0.774 0.974Total debt1 0.017 0.700 -0.032 0.351 -0.064 ** 0.015 0.288Short-term debt1 0.070 0.570 -0.420 ** 0.001 -0.245 ** 0.002 0.073 +
Notes:1 variable is measured as a ratio relative to GDP.2 p-value of test of null hypothesis that the total effect of the respective variable is zero in short-term liberalisation period and long-term liberalisation period, respectively.3 p-value of test of null hypothesis that the total effect of the respective variable in short-term liberalisation period is equal to that in the long-term liberalisation period. **, * and ++,+ indicate significance at the 5% and 10% levels, respectively.
liberalisation post- post- short- vs. long-termliberalisation liberalisation
pre- short-term medium/long-term test of difference3
Arellano-Bond dynamicpanel data estimator
Independent variable X: � t-stats ����st� p-value 2����lt� p-value 2 p-value
Total composite risk indicator 0.162 ** 2.330 0.210 ** 0.015 0.304 ** 0.000 0.063 +
Composite economic risk indicator 0.153 ** 1.970 0.086 0.397 0.222 ** 0.037 0.176 Composite investment risk indicator 0.555 ** 3.030 0.489 * 0.051 0.368 ** 0.015 0.646 Composite financial risk indicator 0.051 0.870 0.068 0.446 0.176 ** 0.006 0.204 Composite political risk indicator 0.067 ** 2.020 0.097 0.166 0.175 ** 0.005 0.100 +
Quality of Bureaucracy -0.649 -1.250 -1.337 ** 0.027 -0.152 0.735 0.031 ++
Corruption -0.484 -1.580 -0.455 0.315 0.855 * 0.077 0.036 ++
Democratic accountability 0.019 0.060 0.149 0.712 0.628 * 0.065 0.233 Government stability 0.213 1.160 -0.086 0.740 0.119 0.565 0.536 Law & order -0.693 ** -2.160 -0.432 0.355 0.983 ** 2.170 0.100 *
Socioeconomic conditions 0.697 ** 3.330 0.179 0.407 0.141 0.496 0.877
Notes:1 variable is measured as a ratio relative to GDP.2 p-value of test of null hypothesis that the total effect of the respective variable is zero in short-term liberalisation period and long-term liberalisation period, respectively.3 p-value of test of null hypothesis that the total effect of the respective variable in short-term liberalisation period is equal to that in the long-term liberalisation period. **, * and ++,+ indicate significance at the 5% and 10% levels, respectively.
pre-liberalisation
short-termpost- post- short- vs. long-term
liberalisation liberalisation
medium/long-term test of difference3
23ECB
Working Paper Series No. 348April 2004

Taking the second and third findings together provides substantial support for the McKinnon-
Pill argument of the "overborrowing" syndrome inherent in the liberalisation process. The
results suggest that there is indeed a strong intertemporal trade-off from liberalisation in that a
boom in investment and portfolio inflows raises growth immediately after liberalisation, but
provides no benefit in the medium to long-run. In fact, the coefficients for both variables are
negative, though not statistically significant, in the long-run. This indeed suggests the
presence of a boom-bust cycle due to liberalisation, as implied by the theoretical models by
McKinnon and Pill (1997, 1999).
Fourth, what makes countries benefit from financial liberalisation in the long-run are not only
FDI inflows, but in particular also the quality of domestic political institutions. A key finding
of the analysis is not only that good institutions raise growth more in open economies in the
long-run than in closed ones, but that in the initial period after liberalisation the quality of
institutions plays less of a role. One interpretation of this finding is that countries benefited
from liberalisation in the short-run post-liberalisation period irrespective of the quality of their
political institutions. This is again very much in line with the McKinnon-Pill hypothesis, in
which moral hazard and pure domestic institutions lead to a boom in the short-run.
3.5 Sensitivity analysisAs the final step of the analysis, several sensitivity and robustness tests of the results are
conducted. We focus in particular on three issues: the definition and different types of
financial openness, differences across countries and regions, and the role of financial crises.
Turning to the first of these issues - the definition of openness - sections 3.1 to 3.4 have
looked also at various de facto openness measures, such as capital inflows and capital stocks,
and the composition of capital inflows. The analysis showed some interesting evidence for the
importance of the composition of capital inflows. However, another angle to look at the issue
is to analyse different types of financial openness. Kaminsky and Schmukler (2003)
investigate whether the sequencing of financial liberalisation plays a role in explaining the
amplitude of equity market cycles. They ask whether this amplitude is larger if countries first
liberalised their capital account, their domestic financial sector, or their domestic equity
market. They find that liberalising first the capital account is harmful in that equity market
crashes are larger compared to countries where equity or domestic financial markets are
liberalised first.
24ECBWorking Paper Series No. 348April 2004

We conduct a similar analysis for the openness-growth nexus by using the Kaminsky-
Schmukler data on the openness of domestic financial sectors and equity markets, and again
complement their dataset with EBRD information for acceding countries. We estimate the
following model
titiEQti
DFti
CAtiti XDDDy ,,,3,2,1, ������ ������ (8)
which is basically the same model as equation (4), but now we distinguish between the
dummies of openness of the capital account (DCA), the domestic financial sector (DDF) and the
equity market (DEQ) for each country i.
Table 6: Sensitivity analysis: The role of sequencing
Table 6 shows the results for two sets of countries: first, all countries, and second, only
emerging market economies. We also compare the result with versus without controlling for
financial crises (models (1) and (2)). The key result is that there are large differences between
countries depending on the sequencing of the liberalisation process. Countries that liberalise
Arellano-Bond dynamicpanel data estimator
Independent variable X: �z t-stats �z t-stats
ALL COUNTRIES:Post-liberalisation: Capital account liberalisation (DCA) -0.403 -0.43 0.198 0.24 Domestic financial market liberalisation (DDF) 1.508 * 1.81 1.512 ** 2.02 Equity market liberalisation (DEQ) 0.959 0.99 1.162 1.34
Tests (p-value): H0: D
CA = DDF 0.173 0.298 H0: D
CA = DEQ 0.405 0.512 H0: D
DF = DEQ 0.710 0.791
EMERGING MARKETS ONLY:Post-liberalisation: Capital account liberalisation (DCA) -0.827 -0.58 -0.459 -0.37 Domestic financial market liberalisation (DDF) 2.448 ** 2.19 2.649 ** 2.75 Equity market liberalisation (DEQ) 1.033 0.71 1.342 1.08
Tests (p-value): H0: D
CA = DDF 0.110 0.078 * H0: D
CA = DEQ 0.478 0.424 H0: D
DF = DEQ 0.489 0.458
Notes: **, * indicate significance at the 5% and 10% levels, respectively. Results for regressions are based on equation (8) in the text.
(1) (2)without crisis control with crisis control
25ECB
Working Paper Series No. 348April 2004

their domestic financial sectors first experience significantly higher growth after
liberalisation. Countries that liberalise their domestic equity markets first also tend to benefit,
though the effect is not statistically significant.
By contrast, countries that first liberalise their capital accounts fare worse: growth in these
countries is mostly lower after opening up compared to those that first liberalise domestic
financial or equity markets, though this difference is not always statistically significant.
Finally, the findings are robust when controlling for financial crises in the model (see model
(2) of Table 6).
The second robustness check conducted is to test for regional and country group differences.
For this purpose, two models are formulated, analogously to those of equations (4) and (5)
above, only that now we are distinguishing between the effects of liberalisation on growth
between industrialised countries (DIND), economies in Non-Japan Asia (DAS), Latin American
countries (DLA), and acceding countries (DAC):
� � ACLAASINDzXDDy titiLIBti
z
zi
zti ,,,,,,, ����� � ���� (9)
to analyse the trade-off between being financially open and financially closed, and
� �
� � ACLAASINDzXDD
DDy
titiLIBLT
tiz
zi
zlt
LIBSTti
z
zi
zstti
,,,,,,
,,
����
��
�
�
�
�
���
��
(10)
to investigate the intertemporal trade-off between short-run and long-run liberalisation effects.
Table 7 shows the results for the estimations of equation (9) in the upper panel and of
equation (10) in the lower panel. Overall we find evidence for the presence of significant
differences across regional/country groupings. When regressions control for the presence of a
crisis, the countries that benefit from liberalisation per se are the industrialised, the Latin
American and the acceding countries. When the model does not control for the presence of a
crisis, the only effect that is still statistically significant is the one for acceding countries.
Looking at the short-term versus long-term trade-off, all emerging market regions
experienced a short-term acceleration in growth, though the effect is statistically significant
only for Latin America and the acceding countries when controlling for crises, and only for
26ECBWorking Paper Series No. 348April 2004

the acceding countries when not controlling for such events. By contrast, in the long-run,
economies in Latin America and Asia experience lower growth, whereas acceding countries
continue to grow significantly faster.
Table 7: Sensitivity analysis: Regional differences
Overall, what these results suggest is that the acceding countries do not conform to the above
presented finding of a "short-run gain, long-run pain" from capital account liberalisation
among emerging markets. In fact, for acceding countries liberalisation so far seems to have
been an unconditional gain in terms of higher growth. By contrast, Asian economies seem to
have benefited the least from the liberalisation process. Although growth was significantly
higher in the immediate aftermath of liberalisation, subsequent growth was lower, which from
a comparison in Table 7 seems to be mostly explained the severity of the regional financial
crisis in the second half of the 1990s.
Moreover, an important qualifier of this result is that Asian economies tended to grow
relatively quickly in the 1980s before financial liberalisation, whereas Latin American and
Arellano-Bond dynamicpanel data estimator
Independent variable X: �z t-stats �z t-stats
Openness: Post-liberalisation: Industrialised countries 0.894 1.50 1.149 ** 2.16 Asian economies -0.433 -0.38 0.928 0.88 Latin American economies 1.022 0.95 1.942 ** 1.98 Acceding countries 1.426 ** 3.24 1.435 ** 3.65
Short-term post-liberalisation Industrialised countries -0.618 -0.63 0.118 0.13 Asian economies 0.674 1.02 1.086 1.15 Latin American economies 0.685 1.20 1.530 * 1.63 Acceding countries 1.200 ** 3.08 1.232 ** 3.45
Long-term post-liberalisation Industrialised countries 0.580 0.53 1.214 1.21 Asian economies -2.282 ** -2.17 -1.167 -1.19 Latin American economies -1.670 * -1.63 -0.747 -0.79 Acceding countries 1.041 ** 2.36 0.947 ** 2.34
Notes:1 variable is measured as a ratio relative to GDP. **, * indicate significance at the 5% and 10% levels, respectively. Countries excluded from analysis in this table only are Russia, South Africa and Turkey Results for regressions for "post-liberalisation" are based on equation (9) in the text. Results for separate regressions for "short-term" and "long-term" "post-liberalisation" are based on equation (10).
with crisis controlwithout crisis control(1) (2)
27ECB
Working Paper Series No. 348April 2004

Eastern European economies grew little, or experienced even economic contractions in the
years prior to opening up. Since the estimates given in the first panel of Table 7 show the
differences in growth of being open relative to being closed, the absolute level of growth may
still have been higher for Asian economies under liberalisation than for e.g. Latin American
countries.
One important finding of the analysis is that acceding countries so far seem to defy the
intertemporal trade-off that emerging markets in Asia and Latin America experienced.
However, one important caveat is that acceding countries have liberalised only relatively
recently, i.e. mostly within the last 5 to 10 years, whereas most emerging markets in Asia and
Latin America did so already in the 1980s or early 1990s. Hence it is not possible and too
early to speak of a "long-run gain" for acceding countries. In particular, few acceding
countries have so far suffered financial crises since their transition to market economies. This
point is also underlined by the similarity of the estimates for acceding countries when
controlling and when not controlling for crises. It therefore remains to be seen over the
current and next decades whether acceding countries can continue to unanimously gain from
the financial liberalisation process by achieving higher economic growth.
4 Conclusions
The objective of the paper has been to analyse the financial liberalisation-growth nexus from
a new perspective. The paper has investigated whether capital account liberalisation creates
an intertemporal trade-off, i.e. whether countries experience a short-run gain at the expense of
a medium- to long-run pain due to opening up their capital account. Conceptually such a
trade-off can exist for different reasons. Gourinchas and Jeanne (2002) argue that the first-
order gains of financial liberalisation are relatively small compared with the longer-run gains
coming from the locking in of domestic reforms. The argument by McKinnon and Pill (1997,
1999) states that such a trade-off may be created by an investment and lending boom
immediately after liberalisation, which ultimately may turn into a bust and a collapse,
resulting in lower growth and possibly recession and financial crises in the medium-term.
The paper has presented evidence in favour of the existence of such a trade-off from capital
account liberalisation for a broad set of 45 emerging economies and industrialised countries.
The opening of the capital account led to a 1.5% higher growth during the first five years after
28ECBWorking Paper Series No. 348April 2004

liberalisation. Growth subsequently returned to or even below its pre-liberalisation rate for the
overall average of the countries.
However, there are significant regional differences in that it has been in particular many
Asian and Latin American economies that have gone through such a cycle of faster short-run
growth but lower medium-run growth in the 1980s and 1990s, whereas acceding countries so
far have unambiguously gained from financial liberalisation. An important caveat is, however,
that acceding countries have liberalised much more recently and have mostly not experienced
severe financial crises and economic contractions as many other emerging markets did. It
therefore remains to be seen whether acceding countries can continue to reap benefits from
liberalisation without experiencing any setbacks in terms of economic growth and in terms of
their catching-up potential with industrialised countries.
The main implication of the paper is that it is important to understand this intertemporal trade-
off in order to understand why some countries gain from liberalisation whereas others may
experience lower and more volatile growth. It sheds light on the possible reason why the
literature so far has not found a compelling link between openness and growth. The findings
of the paper also suggest that there are strong time-varying relationships between openness,
several economic determinants and economic growth. In particular, the paper has presented
evidence that economic growth immediately after liberalisation is often driven by an
investment boom and a surge in portfolio and debt inflows, which then become detrimental to
economic growth in the medium- to long-run. By contrast, the factors that lead to higher
growth in the longer term tend to be the quality of domestic institutions, the size of FDI
inflows and the sequencing of the liberalisation process. These may be important points for
policy-makers' managing of their countries' transition process and integration into the world
economy.
29ECB
Working Paper Series No. 348April 2004

References
Arellano, Manuel and Stephen Bond (1991). Some Tests of Specification for Panel Data:
Monte Carlo Evidence and an Application to Employment Equations, Review of
Economic Studies 58: 277-297.
Arteta, Carlos, Barry Eichengreen and Charles Wyplosz (2001). Do the Effects of Capital
Account Liberalisation Depend on the Stage of Financial and Institutional Development?
unpublished manuscript, University of California, Berkeley.
Bailliu, Jeannine (2000). Private Capital Flows, Financial Development, and Economic
Growth in Developing Countries, Bank of Canada Working Paper No. 2000-15.
Barro, Robert (1991). Economic Growth in a Cross-Section of Countries, Quarterly Journal
of Economics 106: 407-43.
Barro, Robert and Xavier Sala-i-Martin (1995). Economic Growth, McGraw-Hill, New York.
Beck, Thorsten, Ross Levine, Norman Loayza (2000). Finance and Sources of Growth,
Journal of Financial Economics 58: 261–300.
Bekaert, Geert and Campbell R. Harvey (1995). Time-Varying World Market Integration,
Journal of Finance 50: 403-444.
Bekaert, Geert, Campbell Harvey and Christian Lundblad (2001). Emerging Equity Markets
and Economic Development, Journal of Development Economics 66: 465-504.
Bhagwati, Jagdish (1998). The Capital Myth: The Difference Between Trade in Widgets and
Trade in Dollars, Foreign Affairs 77: 7-12.
Bordo, Michael, Barry Eichengreen, Daniela Klingenbiel and Soledad Maria Martinez-Peria
(2001). Is the Crisis Problem Growing More Severe? Economic Policy 24: 51-82.
Bussiere, Matthieu and Marcel Fratzscher (2002), Towards a new Early Warning System of
financial crises, ECB Working Paper No. 145, May 2002.
Chinn, Menzie and Hiro Ito (2002). Capital Account Liberalisation, Institutions and Financial
Development: Cross Country Evidence, NBER Working Paper No. 8967.
Demirguc-Kunt, Asli and Ross Levine (2001). Financial Structure and Economic Growth.
MIT Press.
Edison, Hali, Michael Klein, Luca Ricci and Torsten Slok (2002a). Capital Account
Liberalisation and Economic Performance: Survey and Synthesis, IMF Working Paper No
120.
Edison, Hali, Ross Levine, Luca Ricci and Torsten Slok (2002b). International Financial
Integration and Economic Growth, IMF Working Paper No 145.
Edison, Hali and Francis Warnock (2002). A simple measure of the intensity of capital
controls, Journal of Empirical Finance.
30ECBWorking Paper Series No. 348April 2004

Edwards, Sebastian (1998). Openness, Productivity, and Growth: What Do We Really
Know?, Economic Journal 108: 383-398.
Edwards, Sebastian (2001). Capital Flows and Economic Performance: Are Emerging
Economies Different? NBER Working Paper no. 8076 (January).
Eichengreen, Barry (2002). Capital Account Liberalisation: What do the Cross-Country
Studies Tell Us?, World Bank Economic Review, March.
Eichengreen, Barry and David Leblang (2003). Capital Account Liberalisation and Growth:
Was Mr. Mahatir Right? International Journal of Finance and Economics.
Gourinchas, Pierre-Olivier and Olivier Jeanne (2002). On the Benefits of Capital Account
Liberalisation for Emerging Economies, unpublished manuscript, Princeton University
and IMF.
Grilli, V. and G. M. Milesi-Ferretti (1995). Economic Effects and Structural Determinants of
Capital Controls, IMF Staff Papers 42: 517-551.
International Monetary Fund (various years). Annual Report on Exchange Arrangements and
Exchange Restrictions, Washington, D.C.: IMF.
Kaminsky, Graciela, and Sergio Schmukler (2003). Short-Run Pain, Long-Run Gain: The
Effects of Financial Liberalisation. IMF Working Paper No. 34.
King, R. G., and R. Levine. 1993. Finance, Entrepreneurship and Growth. Journal of
Monetary Economics 32: 513-542.
Klein, Michael and Giovanni Olivei (1999). “Capital Account Liberalisation, Financial Depth,
and Economic Growth,” NBER Working Paper no. 7384 (October).
Kraay, Aart (1998). In Search of the Macroeconomic Effects of Capital Account
Liberalizations, World Bank.
La Porta, R., F. Lopez de Silanes, A. Shleifer, and R. Vishny (1998). Law and finance,
Journal of Political Economy 106(6): 1113-1155.
Lane, Philip and Gian Maria Milesi-Ferretti (2001). The External Wealth of Nations:
Measures of Foreign Assets and Liabilities for Industrial and Developing Nations,
Journal of International Economics 55: 263-294.
Leblang, David A. (2001). To Devalue or To Defend: The Political Economy of Exchange
Rate Policy in the Developing World, unpublished manuscript, University of Colorado,
Boulder.
Levine, Ross and Sara Zervos (1998). Stock Markets, Banks, and Economic Growth,
American Economic Review 88: 537-58.
Levine, Ross, Norman Loayza and Thorsten Beck (2000) Financial Intermediation and
Growth: Causality and Causes, Journal of Monetary Economics 46: 31–77.
McKinnon, Ronald and Huw Pill (1997). Credible Economic Liberalizations and
Overborrowing, American Economic Review 87: 189-93.
31ECB
Working Paper Series No. 348April 2004

McKinnon, Ronald and Huw Pill (1999). Exchange-Rate Regimes for Emerging Markets:
Moral Hazard and International Overborrowing, Oxford Review of Economic Policy
15(3): 19-39.
Nickell, Steven (1981). Biases in dynamic models with fixed effects, Econometrica 49: 1417-
1426.
Quinn, Dennis (1997). The Correlates of Changes in International Financial Regulation,
American Political Science Review 91: 531–551.
Quinn, D., C. Inclan and A. M. Toyoda (2001). How and Where Capital Account
Liberalisation Leads to Growth, Unpublished working paper, Georgetown University.
Rajan, R. G. and L. Zingales (1998). Financial Dependence and Growth, American Economic
Review 88: 559-586.
Rodrik, Dani (1998). Who Needs Capital-Account Convertibility? in Peter Kenen (ed),
Should the IMF Pursue Capital Account Convertibility? Essays in International Finance
no. 207, Princeton: Princeton University Press (May).
Stiglitz, Joseph (2000). Capital Market Liberalisation, Economic Growth and Instability,
World Development 25: 1075-1086.
Stiglitz, Joseph (2002). Globalization and its Discontents, New York: W.W. Norton.
Williamson, John and Molly Mahar (1998). A Survey of Financial Liberalisation, Essays in
International Finance no. 211, International Finance Section, Department of Economics,
Princeton University (November).
32ECBWorking Paper Series No. 348April 2004
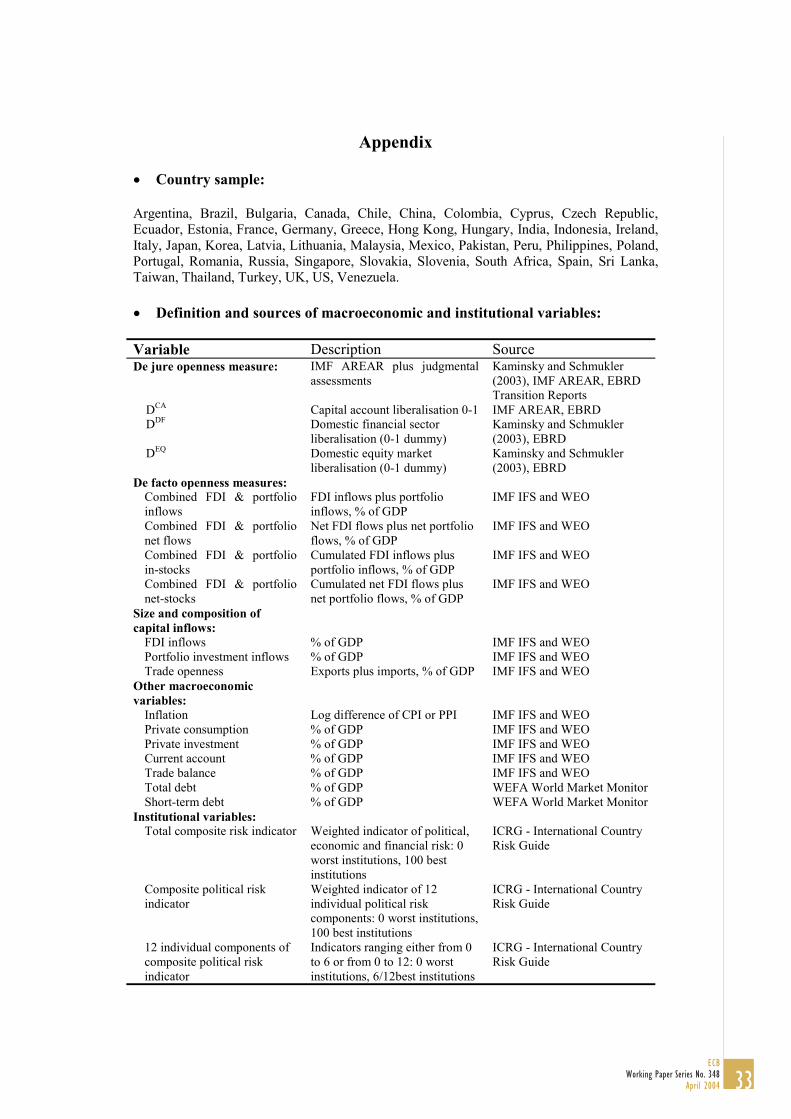
Appendix
� Country sample:
Argentina, Brazil, Bulgaria, Canada, Chile, China, Colombia, Cyprus, Czech Republic,Ecuador, Estonia, France, Germany, Greece, Hong Kong, Hungary, India, Indonesia, Ireland,Italy, Japan, Korea, Latvia, Lithuania, Malaysia, Mexico, Pakistan, Peru, Philippines, Poland,Portugal, Romania, Russia, Singapore, Slovakia, Slovenia, South Africa, Spain, Sri Lanka,Taiwan, Thailand, Turkey, UK, US, Venezuela.
� Definition and sources of macroeconomic and institutional variables:
Variable Description SourceDe jure openness measure: IMF AREAR plus judgmental
assessmentsKaminsky and Schmukler(2003), IMF AREAR, EBRDTransition Reports
DCA Capital account liberalisation 0-1 IMF AREAR, EBRD DDF Domestic financial sector
liberalisation (0-1 dummy)Kaminsky and Schmukler(2003), EBRD
DEQ Domestic equity marketliberalisation (0-1 dummy)
Kaminsky and Schmukler(2003), EBRD
De facto openness measures:Combined FDI & portfolioinflows
FDI inflows plus portfolioinflows, % of GDP
IMF IFS and WEO
Combined FDI & portfolionet flows
Net FDI flows plus net portfolioflows, % of GDP
IMF IFS and WEO
Combined FDI & portfolioin-stocks
Cumulated FDI inflows plusportfolio inflows, % of GDP
IMF IFS and WEO
Combined FDI & portfolionet-stocks
Cumulated net FDI flows plusnet portfolio flows, % of GDP
IMF IFS and WEO
Size and composition ofcapital inflows:
FDI inflows % of GDP IMF IFS and WEOPortfolio investment inflows % of GDP IMF IFS and WEOTrade openness Exports plus imports, % of GDP IMF IFS and WEO
Other macroeconomicvariables:
Inflation Log difference of CPI or PPI IMF IFS and WEOPrivate consumption % of GDP IMF IFS and WEOPrivate investment % of GDP IMF IFS and WEOCurrent account % of GDP IMF IFS and WEOTrade balance % of GDP IMF IFS and WEOTotal debt % of GDP WEFA World Market MonitorShort-term debt % of GDP WEFA World Market Monitor
Institutional variables:Total composite risk indicator Weighted indicator of political,
economic and financial risk: 0worst institutions, 100 bestinstitutions
ICRG - International CountryRisk Guide
Composite political riskindicator
Weighted indicator of 12individual political riskcomponents: 0 worst institutions,100 best institutions
ICRG - International CountryRisk Guide
12 individual components ofcomposite political riskindicator
Indicators ranging either from 0to 6 or from 0 to 12: 0 worstinstitutions, 6/12best institutions
ICRG - International CountryRisk Guide
33ECB
Working Paper Series No. 348April 2004

European Central Bank working paper series
For a complete list of Working Papers published by the ECB, please visit the ECB�s website(http://www.ecb.int).
202 �Aggregate loans to the euro area private sector� by A. Calza, M. Manrique and J. Sousa,January 2003.
203 �Myopic loss aversion, disappointment aversion and the equity premium puzzle� byD. Fielding and L. Stracca, January 2003.
204 �Asymmetric dynamics in the correlations of global equity and bond returns� byL. Cappiello, R.F. Engle and K. Sheppard, January 2003.
205 �Real exchange rate in an inter-temporal n-country-model with incomplete markets� byB. Mercereau, January 2003.
206 �Empirical estimates of reaction functions for the euro area� by D. Gerdesmeier andB. Roffia, January 2003.
207 �A comprehensive model on the euro overnight rate� by F. R. Würtz, January 2003.
208 �Do demographic changes affect risk premiums? Evidence from international data� byA. Ang and A. Maddaloni, January 2003.
209 �A framework for collateral risk control determination� by D. Cossin, Z. Huang,D. Aunon-Nerin and F. González, January 2003.
210 �Anticipated Ramsey reforms and the uniform taxation principle: the role of internationalfinancial markets� by S. Schmitt-Grohé and M. Uribe, January 2003.
211 �Self-control and savings� by P. Michel and J.P. Vidal, January 2003.
212 �Modelling the implied probability of stock market movements� by E. Glatzer andM. Scheicher, January 2003.
213 �Aggregation and euro area Phillips curves� by S. Fabiani and J. Morgan, February 2003.
214 �On the selection of forecasting models� by A. Inoue and L. Kilian, February 2003.
215 �Budget institutions and fiscal performance in Central and Eastern European countries� byH. Gleich, February 2003.
216 �The admission of accession countries to an enlarged monetary union: a tentativeassessment� by M. Ca�Zorzi and R. A. De Santis, February 2003.
217 �The role of product market regulations in the process of structural change� by J. Messina,March 2003.
34ECBWorking Paper Series No. 348April 2004

218 �The zero-interest-rate bound and the role of the exchange rate for monetary policy inJapan� by G. Coenen and V. Wieland, March 2003.
219 �Extra-euro area manufacturing import prices and exchange rate pass-through� byB. Anderton, March 2003.
220 �The allocation of competencies in an international union: a positive analysis� by M. Ruta,April 2003.
221 �Estimating risk premia in money market rates� by A. Durré, S. Evjen and R. Pilegaard,April 2003.
222 �Inflation dynamics and subjective expectations in the United States� by K. Adam andM. Padula, April 2003.
223 �Optimal monetary policy with imperfect common knowledge� by K. Adam, April 2003.
224 �The rise of the yen vis-à-vis the (�synthetic�) euro: is it supported by economicfundamentals?� by C. Osbat, R. Rüffer and B. Schnatz, April 2003.
225 �Productivity and the (�synthetic�) euro-dollar exchange rate� by C. Osbat, F. Vijselaar andB. Schnatz, April 2003.
226 �The central banker as a risk manager: quantifying and forecasting inflation risks� byL. Kilian and S. Manganelli, April 2003.
227 �Monetary policy in a low pass-through environment� by T. Monacelli, April 2003.
228 �Monetary policy shocks � a nonfundamental look at the data� by M. Klaeffing, May 2003.
229 �How does the ECB target inflation?� by P. Surico, May 2003.
230 �The euro area financial system: structure, integration and policy initiatives� byP. Hartmann, A. Maddaloni and S. Manganelli, May 2003.
231 �Price stability and monetary policy effectiveness when nominal interest rates are boundedat zero� by G. Coenen, A. Orphanides and V. Wieland, May 2003.
232 �Describing the Fed�s conduct with Taylor rules: is interest rate smoothing important?� byE. Castelnuovo, May 2003.
233 �The natural real rate of interest in the euro area� by N. Giammarioli and N. Valla,May 2003.
234 �Unemployment, hysteresis and transition� by M. León-Ledesma and P. McAdam,May 2003.
235 �Volatility of interest rates in the euro area: evidence from high frequency data� byN. Cassola and C. Morana, June 2003.
35ECB
Working Paper Series No. 348April 2004

236 �Swiss monetary targeting 1974-1996: the role of internal policy analysis� by G. Rich, June 2003.
237 �Growth expectations, capital flows and international risk sharing� by O. Castrén, M. Millerand R. Stiegert, June 2003.
238 �The impact of monetary union on trade prices� by R. Anderton, R. E. Baldwin andD. Taglioni, June 2003.
239 �Temporary shocks and unavoidable transitions to a high-unemployment regime� byW. J. Denhaan, June 2003.
240 �Monetary policy transmission in the euro area: any changes after EMU?� by I. Angeloni andM. Ehrmann, July 2003.
241 Maintaining price stability under free-floating: a fearless way out of the corner?� byC. Detken and V. Gaspar, July 2003.
242 �Public sector efficiency: an international comparison� by A. Afonso, L. Schuknecht andV. Tanzi, July 2003.
243 �Pass-through of external shocks to euro area inflation� by E. Hahn, July 2003.
244 �How does the ECB allot liquidity in its weekly main refinancing operations? A look at theempirical evidence� by S. Ejerskov, C. Martin Moss and L. Stracca, July 2003.
245 �Money and payments: a modern perspective� by C. Holthausen and C. Monnet, July 2003.
246 �Public finances and long-term growth in Europe � evidence from a panel data analysis� byD. R. de Ávila Torrijos and R. Strauch, July 2003.
247 �Forecasting euro area inflation: does aggregating forecasts by HICP component improveforecast accuracy?� by K. Hubrich, August 2003.
248 �Exchange rates and fundamentals� by C. Engel and K. D. West, August 2003.
249 �Trade advantages and specialisation dynamics in acceding countries� by A. Zaghini,August 2003.
250 �Persistence, the transmission mechanism and robust monetary policy� by I. Angeloni,G. Coenen and F. Smets, August 2003.
251 �Consumption, habit persistence, imperfect information and the lifetime budget constraint�by A. Willman, August 2003.
252 �Interpolation and backdating with a large information set� by E. Angelini, J. Henry andM. Marcellino, August 2003.
253 �Bond market inflation expectations and longer-term trends in broad monetary growth andinflation in industrial countries, 1880-2001� by W. G. Dewald, September 2003.
36ECBWorking Paper Series No. 348April 2004

254 �Forecasting real GDP: what role for narrow money?� by C. Brand, H.-E. Reimers andF. Seitz, September 2003.
255 �Is the demand for euro area M3 stable?� by A. Bruggeman, P. Donati and A. Warne,September 2003.
256 �Information acquisition and decision making in committees: a survey� by K. Gerling,H. P. Grüner, A. Kiel and E. Schulte, September 2003.
257 �Macroeconomic modelling of monetary policy� by M. Klaeffling, September 2003.
258 �Interest rate reaction functions and the Taylor rule in the euro area� by P. Gerlach-Kristen, September 2003.
259 �Implicit tax co-ordination under repeated policy interactions� by M. Catenaro andJ.-P. Vidal, September 2003.
260 �Aggregation-theoretic monetary aggregation over the euro area, when countries areheterogeneous� by W. A. Barnett, September 2003.
261 �Why has broad money demand been more stable in the euro area than in othereconomies? A literature review� by A. Calza and J. Sousa, September 2003.
262 �Indeterminacy of rational expectations equilibria in sequential financial markets� byP. Donati, September 2003.
263 �Measuring contagion with a Bayesian, time-varying coefficient model� by M. Ciccarelli andA. Rebucci, September 2003.
264 �A monthly monetary model with banking intermediation for the euro area� byA. Bruggeman and M. Donnay, September 2003.
265 �New Keynesian Phillips Curves: a reassessment using euro area data� by P. McAdam andA. Willman, September 2003.
266 �Finance and growth in the EU: new evidence from the liberalisation and harmonisation ofthe banking industry� by D. Romero de Ávila, September 2003.
267 �Comparing economic dynamics in the EU and CEE accession countries� by R. Süppel,September 2003.
268 �The output composition puzzle: a difference in the monetary transmission mechanism inthe euro area and the US� by I. Angeloni, A. K. Kashyap, B. Mojon and D. Terlizzese,September 2003.
269 �Zero lower bound: is it a problem with the euro area?" by G. Coenen, September 2003.
270 �Downward nominal wage rigidity and the long-run Phillips curve: simulation-basedevidence for the euro area� by G. Coenen, September 2003.
271 �Indeterminacy and search theory� by N. Giammarioli, September 2003.
37ECB
Working Paper Series No. 348April 2004

272 �Inflation targets and the liquidity trap� by M. Klaeffling and V. López Pérez,September 2003.
273 �Definition of price stability, range and point inflation targets: the anchoring of long-terminflation expectations� by E. Castelnuovo, S. Nicoletti-Altimari and D. Rodriguez-Palenzuela, September 2003.
274 �Interpreting implied risk neutral densities: the role of risk premia� by P. Hördahl andD. Vestin, September 2003.
275 �Identifying the monetary transmission mechanism using structural breaks� by A. Beyer andR. Farmer, September 2003.
276 �Short-term estimates of euro area real GDP by means of monthly data� by G. Rünstlerand F. Sédillot, September 2003.
277 �On the indeterminacy of determinacy and indeterminacy" by A. Beyer and R. Farmer,September 2003.
278 �Relevant economic issues concerning the optimal rate of inflation� by D. R. Palenzuela,G. Camba-Méndez and J. Á. García, September 2003.
279 �Designing targeting rules for international monetary policy cooperation� by G. Benignoand P. Benigno, October 2003.
280 �Inflation, factor substitution and growth� by R. Klump, October 2003.
281 �Identifying fiscal shocks and policy regimes in OECD countries� by G. de Arcangelis and S. Lamartina, October 2003.
.
282 �Optimal dynamic risk sharing when enforcement is a decision variable� by T. V. Koeppl,
October 2003.
283 �US, Japan and the euro area: comparing business-cycle features� by P. McAdam,
November 2003.
284 �The credibility of the monetary policy ‘free lunch’� by J. Yetman, November 2003.
285 �Government deficits, wealth effects and the price level in an optimizing model�
by B. Annicchiarico, November 2003.
286 �Country and sector-specific spillover effects in the euro area, the United States and Japan�
by B. Kaltenhaeuser, November 2003.
287 �Consumer inflation expectations in Poland� by T. Łyziak, November 2003.
288 �Implementing optimal control cointegrated I(1) structural VAR models� by F. V. Monti,
November 2003.
289 �Monetary and fiscal interactions in open economies� by G. Lombardo and A. Sutherland,
November 2003.
38ECBWorking Paper Series No. 348April 2004

291 “Measuring the time-inconsitency of US monetary policy” by P. Surico, November 2003.
290 “Inflation persistence and robust monetary policy design” by G. Coenen, November 2003.
292 “Bank mergers, competition and liquidity” by E. Carletti, P. Hartmann and G. Spagnolo,
November 2003.
293 “Committees and special interests” by M. Felgenhauer and H. P. Grüner, November 2003.
294 “Does the yield spread predict recessions in the euro area?” by F. Moneta, December 2003.
295 “Optimal allotment policy in the eurosystem’s main refinancing operations?” by C. Ewerhart,
N. Cassola, S. Ejerskov and N. Valla, December 2003.
296 “Monetary policy analysis in a small open economy using bayesian cointegrated structural VARs?”
by M. Villani and A. Warne, December 2003.
297 “Measurement of contagion in banks’ equity prices” by R. Gropp and G. Moerman, December 2003.
298 “The lender of last resort: a 21st century approach” by X. Freixas, B. M. Parigi and J.-C. Rochet,
December 2003.
299 “Import prices and pricing-to-market effects in the euro area” by T. Warmedinger, January 2004.
300 “Developing statistical indicators of the integration of the euro area banking system”
by M. Manna, January 2004.
301 “Inflation and relative price asymmetry” by A. Rátfai, January 2004.
302 “Deposit insurance, moral hazard and market monitoring” by R. Gropp and J. Vesala, February 2004.
303 “Fiscal policy events and interest rate swap spreads: evidence from the EU” by A. Afonso and
R. Strauch, February 2004.
304 “Equilibrium unemployment, job flows and inflation dynamics” by A. Trigari, February 2004.
305 “A structural common factor approach to core inflation estimation and forecasting”
by C. Morana, February 2004.
306 “A markup model of inflation for the euro area” by C. Bowdler and E. S. Jansen, February 2004.
307 “Budgetary forecasts in Europe - the track record of stability and convergence programmes”
by R. Strauch, M. Hallerberg and J. von Hagen, February 2004.
308 “International risk-sharing and the transmission of productivity shocks” by G. Corsetti, L. Dedola
and S. Leduc, February 2004.
309 “Monetary policy shocks in the euro area and global liquidity spillovers” by J. Sousa and A. Zaghini,
February 2004.
310 “International equity flows and returns: A quantitative equilibrium approach” by R. Albuquerque,
G. H. Bauer and M. Schneider, February 2004.
311 “Current account dynamics in OECD and EU acceding countries – an intertemporal approach”
by M. Bussière, M. Fratzscher and G. Müller, February 2004.
39ECB
Working Paper Series No. 348April 2004
312 “Similarities and convergence in G-7 cycles” by F. Canova, M. Ciccarelli and E. Ortega, February 2004.
313 “The high-yield segment of the corporate bond market: a diffusion modelling approach
for the United States, the United Kingdom and the euro area” by G. de Bondt and D. Marqués,
February 2004.
314 “Exchange rate risks and asset prices in a small open economy” by A. Derviz, March 2004.
315 “Option-implied asymmetries in bond market expectations around monetary policy actions of the ECB” by S. Vähämaa, March 2004.
316 “Cooperation in international banking supervision” by C. Holthausen and T. Rønde, March 2004.
317 “Fiscal policy and inflation volatility” by P. C. Rother, March 2004.
318 “Gross job flows and institutions in Europe” by R. Gómez-Salvador, J. Messina and G. Vallanti, March 2004.
319 “Risk sharing through financial markets with endogenous enforcement of trades” by T. V. Köppl, March 2004.
320 “Institutions and service employment: a panel study for OECD countries” by J. Messina, March 2004.
321 “Frequency domain principal components estimation of fractionally cointegrated processes”
by C. Morana, March 2004.
322 “Modelling inflation in the euro area” by E. S. Jansen, March 2004.
323 “On the indeterminacy of New-Keynesian economics” by A. Beyer and R. E. A. Farmer, March 2004.
324 “Fundamentals and joint currency crises” by P. Hartmann, S. Straetmans and C. G. de Vries, March 2004.
325 “What are the spill-overs from fiscal shocks in Europe? An empirical analysis” by M. Giuliodori
and R. Beetsma, March 2004.
326 “The great depression and the Friedman-Schwartz hypothesis” by L. Christiano, R. Motto and
M. Rostagno, March 2004.
327 “Diversification in euro area stock markets: country versus industry” by G. A. Moerman, April 2004.
328 “Non-fundamental exchange rate volatility and welfare” by R. Straub and I. Tchakarov, April 2004.
329 “On the determinants of euro area FDI to the United States: the knowledge-capital-Tobin's Q framework,
by R. A. De Santis, R. Anderton and A. Hijzen, April 2004.
330 “The demand for euro area currencies: past, present and future” by B. Fischer, P. Köhler and F. Seitz, April 2004.
331 “How frequently do prices change? evidence based on the micro data underlying the Belgian CPI” by
L. Aucremanne and E. Dhyne, April 2004.
332 “Stylised features of price setting behaviour in Portugal: 1992-2001” by M. Dias, D. Dias and P. D. Neves, April 2004.
40ECBWorking Paper Series No. 348April 2004

333 “The pricing behaviour of Italian firms: New survey evidence on price stickiness” by
S. Fabiani, A. Gattulli and R. Sabbatini, April 2004.
334 “Is inflation persistence intrinsic in industrial economies?” by A. T. Levin and J. M. Piger, April 2004.
335 “Has eura-area inflation persistence changed over time?” by G. O’Reilly and K. Whelan, April 2004.
337 “The decline of activist stabilization policy: Natural rate misperceptions, learning and expectations” by
A. Orphanides and J. C. Williams, April 2004.
338 “The optimal degree of discretion in monetary policy” by S. Athey, A. Atkeson and P. J. Kehoe, April 2004.
339 “Understanding the effects of government spending on consumption” by J. Galí, J. D. López-Salido
and J. Vallés, April 2004.
340 “Indeterminacy with inflation-forecast-based rules in a two-bloc model” by N. Batini, P.Levine
and J. Pearlman, April 2004.
341 “Benefits and spillovers of greater competition in Europe: A macroeconomic assessment” by T. Bayoumi,
D. Laxton and P. Pesenti, April 2004.
342 “Equal size, equal role? Interest rate interdependence between the euro area and the United States” by
M. Ehrmann and M. Fratzscher, April 2004.
343 “Monetary discretion, pricing complementarity and dynamic multiple equilibria” by R. G. King
and A. L. Wolman, April 2004.
344 “Ramsey monetary policy and international relative prices” by E. Faia and T. Monacelli, April 2004.
345 “Optimal monetary and fiscal policy: A linear-quadratic approach” by P. Benigno and M. Woodford, April 2004.
346 “Perpetual youth and endogenous labour supply: a problem and a possible solution” by G. Ascari
and N. Rankin, April 2004.
347 “Firms’ investment decisions in response to demand and price uncertainty” by C. Fuss
and P. Vermeulen, April 2004.
348 “Financial openness and growth: Short-run gain, long-run pain?” by M. Fratzscher and M. Bussiere, April 2004.
41ECB
Working Paper Series No. 348
336 “The great inflation of the 1970s” by F. Collard and H. Dellas, April 2004.
April 2004
