short-selling bans and bank stability
TRANSCRIPT
Electronic copy available at: http://ssrn.com/abstract=2710371
Short-Selling Bans and Bank Stability
Alessandro Beber Cass Business School and CEPR
Daniela Fabbri
Cass Business School
Marco Pagano Università di Napoli Federico II, CSEF, EIEF and CEPR
31 December 2015
Abstract
In both the 2008-09 crisis and the 2011-12 euro debt crisis, security regulators imposed short selling bans, targeting them mainly at financial institutions. Their motivation was that a collapse in the stock price of banks could lead them to experience funding problems, which would trigger further price drops: short-selling bans of bank stocks would break this loop, stabilizing banks and enhancing their solvency. We test this hypothesis by canvassing the evidence produced by both crises, by estimating panel data regressions for 13,473 stocks in 2008 and 16,424 stocks in 2011 from 25 countries, taking also the endogeneity of short-selling bans into account. Contrary to the regulators’ intentions, in neither crisis short-selling bans were associated with increased bank stability: upon being subject to a short-selling ban, financial institutions featured larger stock price drops, return volatility and probability of default, these effects being larger for more vulnerable banks. Moreover, the 2011 ban did not help to mitigate the “diabolic loop” between bank and sovereign insolvency risk during the euro-area sovereign debt crisis. JEL classification: G01, G12, G14, G18.
Keywords: short selling, ban, financial crisis, bank stability, systemic risk.
Acknowledgements: We thank Josh Angrist, Markus Brunnermeier, Giovanni Cespa, Christian Hellwig, Dilip Mookherjee, Paul Redman, Paolo Volpin, and seminar participants at a seminar at the Cass Business School, the Global Risk Institute (GRI) and the 4th ME@Ravello Workshop for helpful comments, and Viral Acharya, Robert Capellini and Michael Robles (NYU V-Lab) for providing data about SRISK. We gratefully acknowledge financial support from GRI, Cass Business School, Institut Europlace de Finance (EIF), and Leverhulme Trust.
Electronic copy available at: http://ssrn.com/abstract=2710371
1
Most stock exchange regulators around the world reacted to the financial crisis of 2007-09 by
imposing bans or constraints on short sales. These hurried interventions, which varied
considerably in intensity, scope, and duration, were presented as measures to restore the
orderly functioning of securities markets and limit unwarranted drops in securities prices,
capable of exacerbating the crisis. The Security Exchange Commission News Release 2008-
211 that announced the short sales ban on U.S. financial stocks summarizes the regulators’
view during the crisis: “unbridled short selling is contributing to the recent sudden price
declines in the securities of financial institutions unrelated to true price valuation.” More
recently, during the ongoing Eurozone sovereign debt crisis, stock exchange regulators in
some European countries have imposed similar restrictions on short-selling with the aim of
stabilizing the volatile evolution of bank stock prices.
The large majority of the bans introduced during the 2008-09 subprime loans crisis and
the ongoing European sovereign debt crisis has targeted financial stocks, the regulators’
rationale being that in times of market stress, sharp drops in banks’ stock prices caused by
short-selling activity could have severe consequences for the stability of the banking system.
In the words of the Financial Services Authority, the U.K. regulator, “On 18 September
2008 we introduced temporary short selling measures in relation to stocks in UK financial
sector companies on an emergency basis. […] it was apparent that sharp share price
declines in individual banks were likely to lead to pressure on their funding and thus create
a self-fulfilling loop”.1 Similarly, in 2012 the Spanish regulator (CNMV) comments on the
decision to maintain the 2011 bans: “… a range of uncertainties with respect to the Spanish
financial system that may affect financial stability … failure to ban short sales would
heighten uncertainty … considered to be absolutely necessary to ensure the stability of the
Spanish financial system and capital markets.”
The regulatory interventions that occurred in 2008-09 spurred research aimed at
analyzing the effect of short-selling bans on stock returns, liquidity, and price discovery
(Battalio and Schultz, 2011; Battalio, Mehran and Schultz, 2011; Beber and Pagano, 2013;
Boehmer, Jones, and Zhang, 2012; Marsh and Payne, 2012; Crane, Crotty, Michenaud and
Naranjo, 2015). These papers document the presence of detrimental, or at best neutral,
effects of the bans: banning short selling tended to reduce market liquidity and slow down
1 This quote is from the FSA: www.fsa.gov.uk/pubs/discussion/dp09_01.pdf.
2
price discovery, while it did not support stock prices. But, although the bans largely targeted
financial stocks, none of the existing papers investigates whether the short selling bans
might have benefitted some vulnerable financial institutions, as claimed by the FSA in the
previous quote. This might contribute to explain why after 2009 some regulators kept bans
active or imposed new short-selling bans despite the presence of compelling empirical
evidence of their ineffectiveness.
Our paper aims to fill this gap: we investigate whether short-selling bans had a different
impact on the stock returns and the volatility of banks – particularly vulnerable ones –
relative to other financial institutions and to non-financial companies, and whether they were
associated with an improvement in their financial solvency indicators, using data for both
the 2008-09 subprime crisis and for the 2011-12 euro-area debt crisis. We also test whether
the 2011 ban lowered the correlation between bank and sovereign CDS premia during the
euro-area sovereign debt crisis, i.e. mitigated the “diabolic loop” between bank and
sovereign insolvency risk. To study these issues, we bring together stock market data
typically analyzed in previous research on the effects of short-selling (returns, liquidity,
volatility) with those typically used in banking (measures of bank assets riskiness, default
probability, stringency of prudential capital ratios, leverage).
The paper is structured as follows. Section I develops the testable hypotheses, based on
the relevant literature. Section II presents the data and some descriptive statistics. Section III
reports the estimates obtained using three different methodologies: panel regressions on
pooled data, panel regressions on matched data for banned and non-banned stocks, and
instrumental variable regressions. Section IV concludes.
I. Theoretical predictions
Should short-selling restrictions be expected to lead to an increase or a lower decline in
stock prices compared to a situation where short-selling is unrestricted? Answers to this
question differ widely in the theoretical literature. The model by Miller (1977) predicts that
a short-selling ban leads to prices above the equilibrium level that would prevail absent such
constraints, because they will lead to stock prices that reflect only the valuations of bullish
and bearish investors who currently own the stock. Bearish investors who do not own the
3
stock are excluded from trading, so that their valuations do not affect the price. Hence,
prices should rise above their full-information values when a ban is imposed, and decline
when it is lifted. This mechanical prediction of Miller’s model does not survive in the
rational expectations framework of Diamond and Verrecchia (1987), where risk-neutral
investors adjust their valuations to take into account the fact that short-selling constraints
sideline investors with negative information, so that in equilibrium stocks are not
systematically overpriced when short sales are banned. Miller’s prediction can even be
overturned completely in the presence of risk aversion: Bai, Chang, and Wang (2006) show
that when rational investors are risk-averse, the slower price discovery induced by a short-
selling ban increases the risk perceived by uninformed investors and may leads them to
require higher expected returns, and thereby induce lower prices. The prediction that a short-
selling ban may aggravate a decline in prices, rather than prevent it, is also present in the
model by Hong and Stein (2003), where the accumulated unrevealed negative information of
investors who would have engaged in short sales surfaces only when the market begins to
drop, thereby aggravating the price decline.
All these models are based on the idea that short-selling bans may affect the process of
price formation, but not stock fundamentals as well. Furthermore, they do not produce
different predictions regarding the effects of short-selling constraints on the stocks of
financial and non-financial companies. A different perspective is that short-selling bans on a
financial stock can prevent a price drop induced by strategic short-sellers, which would
result in a self-fulfilling decline in the stock’s fundamental value. The argument used by
some regulators to justify the introduction of short-selling bans for distressed bank stocks is
that short sales may induce a worsening of funding conditions, because reduced banks’ stock
prices may cause growing difficulties in raising new equity or debt capital, or coordinate
depositors’ expectations on a bank-run equilibrium, with further potential repercussion on
stock prices, thus creating a vicious circle. The ban is seen as a way to break this perverse
feedback loop, and thereby as a policy capable to stabilize the fundamental value of the
bank, and thus its price.
The model by Brunnermeier and Oehmke (2014) spells out clearly the mechanism that
may link the stock price drops to a bank’s insolvency in this type of reasoning: the link is the
likelihood that the bank violates a leverage constraint. In their model, predatory short-selling
4
can occur because financial institutions are subject to leverage constraints, which limit the
amount of funding that short-term creditors and uninsured depositors are willing to provide
to a bank. When these leverage constraints are violated or are close to being violated,
predatory short sellers that temporarily depress the stock price of the bank can force it to sell
long-term assets in order to repay creditors and prevent them from running on the bank. In
some circumstances, short sellers can cause a complete liquidation of assets, even though the
bank would have satisfied its leverage constraint in the absence of predatory short sellers.
Liu (2015) provides a different theoretical explanation for the potential link between
short-selling and bank failures. Short-selling attacks can be harmful for banks, because they
can amplify stock price volatility, leading to an increase in uncertainty and information
asymmetry on the bank’s fundamentals. In the model, creditors use the share price to learn
about the bank’s underlying fundamentals and thus become increasingly unsure about the
true fundamentals as share prices become more volatile. With higher uncertainty, creditors
are less willing to roll over their short-term lending to the bank and, with a sufficient number
of creditors declining to roll-over, a bank run occurs triggering the bank failure.
Both theories imply that institutions with more stable capital structures or with stronger
fundamentals should be less susceptible to the predatory behavior of short-sellers and
therefore less likely to fail. Moreover, given that short-term creditors are the crucial agents in
both models, mismatching in duration and liquidity between assets and liabilities is likely to
be a crucial determinant of the institution’s vulnerability. While this mismatching is
something common to all financial institutions, it varies substantially among different types
of financial institutions. Thus the theoretical analysis of Brunnermeier and Oehmke (2014)
and Liu (2015) deliver several testable predictions on the ban effect by exploiting cross-
sectional heterogeneity of firm’s balance-sheet at the industry and institution level.
The first prediction of their model is that short-selling bans should support and stabilize
more the stock prices of banks than those of non-banks, and even more so than non-financial
companies – banks being far more levered, more exposed to risks due to maturity mismatch
and to liquidity shocks than non-financial companies. By the same token, at times of market
stress, short-selling bans should lower the probability of default of financial institutions – and
particularly banks – more than that of non-financial companies.
5
The alternative hypothesis is that short-selling bans instead play a destabilizing role,
namely, they trigger further declines in stock prices and greater volatility. This may occur if
market participants view a short-selling ban as a negative signal about the solvency of
financial institutions: if they believe the regulator to have superior information about the
solvency of financial institutions, they may read a short-selling ban as a symptom that these
institutions are more distressed than they had realized, resulting in a repricing of their stocks.
Short-selling bans may depress stock prices – though not specifically those of banks – also
because of their detrimental effects on market liquidity and informational efficiency,
documented by many recent studies. Lower liquidity should translate into a stronger liquidity
discount, hence lower market prices of banned stocks; less informative prices can reduce
investors’ ability to scrutinize company performance, resulting in worse managerial
behaviour (Fang, Huang and Karpoff, 2015; Massa, Zhang and Zhang, 2015) and higher cost
of debt (Ho, Lin, and Lin, 2015), which could feed back on stock valuations.
A second prediction of the models by Brunnermeier and Oehmke (2014) and Liu (2015) is
that the effect of short sellers’ actions of banks depends crucially on the vulnerability of the
target banks: short selling should depress more the stock prices, increase more the volatility
and the probability to default of banks that are more levered or are closer to the minimum
capital ratio required by prudential regulation. By the same token, a short-selling ban should
benefit more such distressed banks than more solid ones, and therefore should support more
the stock returns of more fragile financial institutions, lower more their return volatility and
prompt a larger recovery in their perceived solvency. A related prediction is that a bank
should be more vulnerable to predatory short selling if its main shareholders do not have the
resources to recapitalize it. Hence, short-selling bans should benefit more banks whose main
shareholders are less well-capitalized, as these should be more vulnerable to predatory short-
selling attacks, absent the short-selling ban.
A third hypothesis, which does not stem from the above-mentioned models, arises from
the recent literature on the “diabolic loop” between bank insolvency risk and sovereign
insolvency risk in the context of the euro debt crisis: several euro-area banks have large
holdings of high-yield, high-risk sovereign debt, so that the sovereign debt repricing in 2011-
12 lowered these banks’ equity, and reduced their creditworthiness (Altavilla, Pagano and
Simonelli, 2015). Insofar as this induced investors to expect the respective governments to
6
bail out these banks, it contributed to exacerbate sovereign stress even further, creating a
negative feedback loop (Acharya, Drechsler and Schnabl, 2014; Brunnermeier et al., 2015;
Cooper and Nikolov, 2013; Farhi and Tirole, 2015; Leonello, 2014). In this situation, a short-
selling ban on banks’ stocks might be regarded as an intervention capable of defusing the
feedback loop, or at least mitigate it: if it manages to halt or moderate the drop in banks’
stock prices, a ban should also make investors less concerned that banks will have to be
bailed out, and therefore that the sovereign’s own solvency will be put at greater risk.
II. Data
We identify the effect of short-selling bans on banks’ stock prices and bank stability by
exploiting the cross-sectional variability between banks, other financial institutions and non-
financial companies during the two most recent episodes of short-selling restrictions, namely
the bans enacted during the 2008-09 credit crisis and during the more recent European
sovereign debt crisis in 2011-12. This empirical setting is well suited for identification, as
different financial institutions had different exposures to the two crises, and were
differentially affected by short-selling bans: in the 2008-09 crisis, the US, Canada, the UK,
Switzerland and Ireland imposed short-selling bans before most other countries; in the recent
euro-area sovereign crisis, short-selling bans have applied to bank stocks in several (but not
all) Euro-zone countries; and other countries have not imposed short-selling bans in either
period. As a result, in each crisis we have a sizeable control sample of financial institutions
not subject to short-selling bans.
Our data cover 15,983 stocks in 2008-09 and 15,983 companies in 2011-12 for 25
countries: 17 European countries (13 Euro-zone countries and 4 non-Euro-zone ones),2 the
US, Australia, Canada, Japan, Hong-Kong, Israel, New Zealand and South Korea. The data
span the period from 30 May 2008 to 13 April 2012, and are drawn from different sources:
stock returns are drawn from Datastream, financial institutions’ Credit Default Swap (CDS)
quotes are from Bloomberg and Datastream, and balance-sheet data from Bloomberg and
2 The euro-zone countries included in the sample are: Austria, Belgium, Denmark, Finland, France, Germany, Greece, Ireland, Italy, Luxembourg, Netherlands, Portugal, and Spain. The non-euro-zone ones are: Norway, Sweden, Switzerland and the UK.
7
SNL Financials. We winsorize stock return data by eliminating the observations
corresponding to the top and bottom 1% of the observations, as well as zero returns (which
presumably correspond to stale prices), so that eventually in our regression analysis our
sample contains 13,473 stocks in 2008 and 16,424 stocks in 2011.
The estimates of firm-level probability of default over a three-month horizon are
calculated by the Risk Management Institute (RMI) at the National University of Singapore,
and the measures of banks’ systemic risk, stock return variance and leverage of financial
institutions are provided by the NYU V-Lab.
More specifically, the probabilities of default (PD) are estimated by a forward intensity
model introduced by Duan, Sun and Wang (2012), which allows PD forecasts to be made at a
range of different horizons. The forward intensity model is a reduced form model in which
the PD is computed as a function of different input variables, which in the case of the model
used by RMI are two variables common to all firms in the same economy (the stock index
return and the interest rate), and a set of 10 firm-specific variables which are transformations
of measures of six different firm characteristics (volatility-adjusted leverage, liquidity,
profitability, relative size, market misvaluation/future growth opportunities, and idiosyncratic
volatility).
The measure of systemic risk (labeled SRISK by NYU VLab) is an estimate of the capital
shortfall relative to a prudential capital ratio of 8% that banks are expected to incur in a
financial crisis, based on work by Brownlees and Engle (2012) and Acharya, Engle and
Richardson (2012). Though produced from publicly available information, this estimate is
conceptually similar to those obtained via stress tests by U.S. and European regulators, and
takes into account the correlation between the value of each bank’s assets and the financial
sector aggregate in a crisis. We standardize this variable by the corresponding company’s
stock market capitalization.
The variance of stock returns, also produced by the NYU V-Lab, is the daily variance
estimated with a GJR-GARCH(1,1) model as in Glosten, Jagannathan and Runkle (1993).
The leverage of financial institutions is defined as the sum of market value of equity and the
difference between book value of assets and book value of equity, all divided by the market
value of equity.
8
Finally, the dates of short sales bans’ enactments and lifting, and the characteristics of
short-selling regimes come from the websites of national regulatory bodies and of the
European Securities and Markets Authority (ESMA). For each country, we determine if a
short-selling ban was enacted in this period, and if so when, which stocks it applied to, and
which restrictions it imposed on short sales. In particular, we distinguish between “naked”
and “covered” bans: the former forbid naked short sales, that is, transactions in which the
seller does not borrow the stock to deliver it to the buyer within the standard settlement
period, while the latter also forbid covered short sales, that is, transactions in which the seller
manages to borrow the stock.3
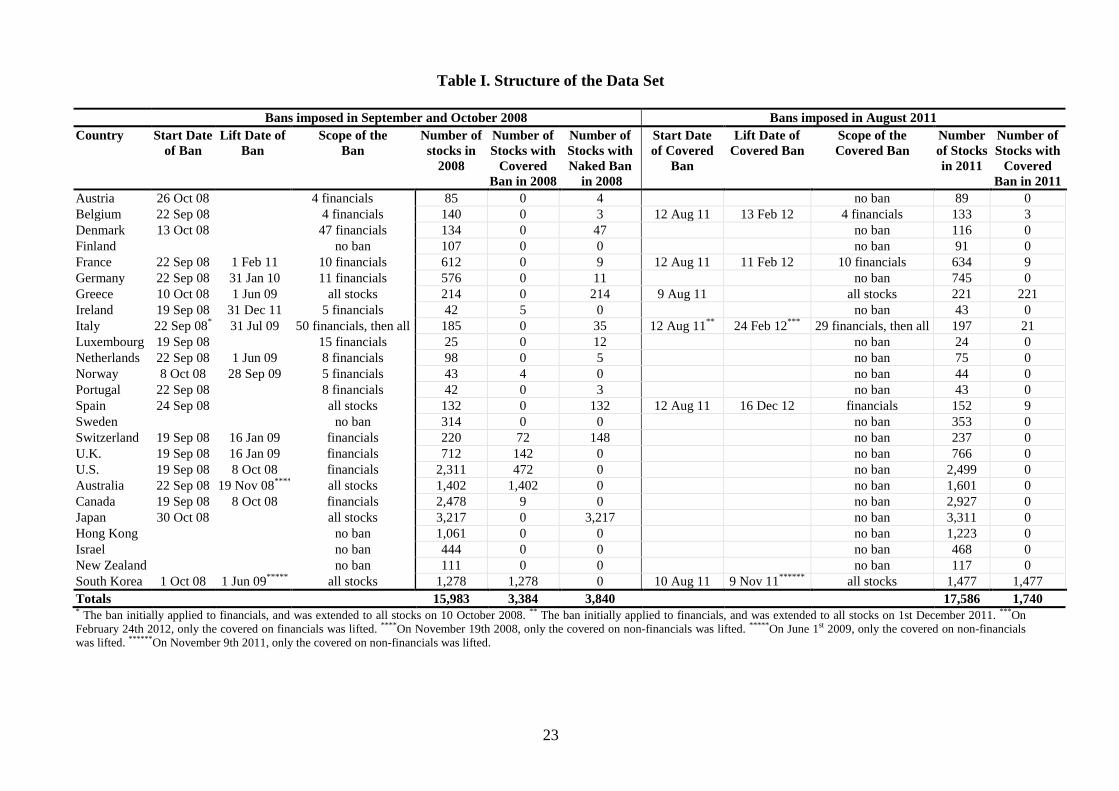
[Insert Table I]
Table I describes the structure of our data set, separately for the two financial crises: the
left panel of the table shows information for the bans enacted in 2008, while the right panel
shows those enacted in 2011. In 2008, regulators often imposed both naked and covered
bans, and then in several cases removed the covered bans but left the naked bans in place:
we show the inception date, lifting date and scope of the first ban imposed in each country,
be it a naked or a covered ban. In 2011, instead, all the newly enacted bans were covered
ones, and accordingly the right panel of the table shows the inception date, lifting date and
scope of covered bans only. In many of these countries the naked bans imposed in the
previous financial crisis were still in force throughout 2011. The bans for which the table
indicates an inception date but no lifting date are were still on as of 30 April 2012, which is
the final date of our sample period.
From the table, it is clear that there great heterogeneity in the geographic spread, timing,
type and scope of the banks in the two crises. First, in the 2008-09 subprime crisis short-
selling bans were much more widespread than in the 2010-11 Euro debt crisis. Moreover, in
the former case regulators in the US, Australia, Canada, Switzerland and UK imposed more
stringent (i.e. covered) bans and moved faster than most other regulators, while in the latter
crisis only the regulators of some euro-area countries (Belgium, Greece, France, Italy and
Spain) and South Korea imposed covered bans. This is in line with the fact that the subprime 3 See Gruenewald, Wagner, and Weber (2010) for a description of the different types of short-selling restrictions and for a discussion of their possible rationale.
9
crisis had its epicentre in the US, and was more global in character than the euro-area debt
crisis. Finally, some countries (Finland, Hong Kong, Israel, New Zealand and Sweden)
imposed no ban in either crisis. Also the scope of the ban varies across countries and across
episodes: in 2008, the ban applied to all stocks Greece, Italy, Spain, Australia, Japan and
South Korea, and only to financials in all the other countries that imposed a ban; in 2011 it
applied to all companies in Greece, Italy and South Korea, and to financials only in
Belgium, France and Spain.4 This great heterogeneity in the geography, timing and scope of
the bans, which is compounded by the availability of data for both the 2008 and the 2011
wave, is an important advantage for the empirical analysis, in that it enables us to have a
substantial group of control stocks to which no ban was applied in both crises.
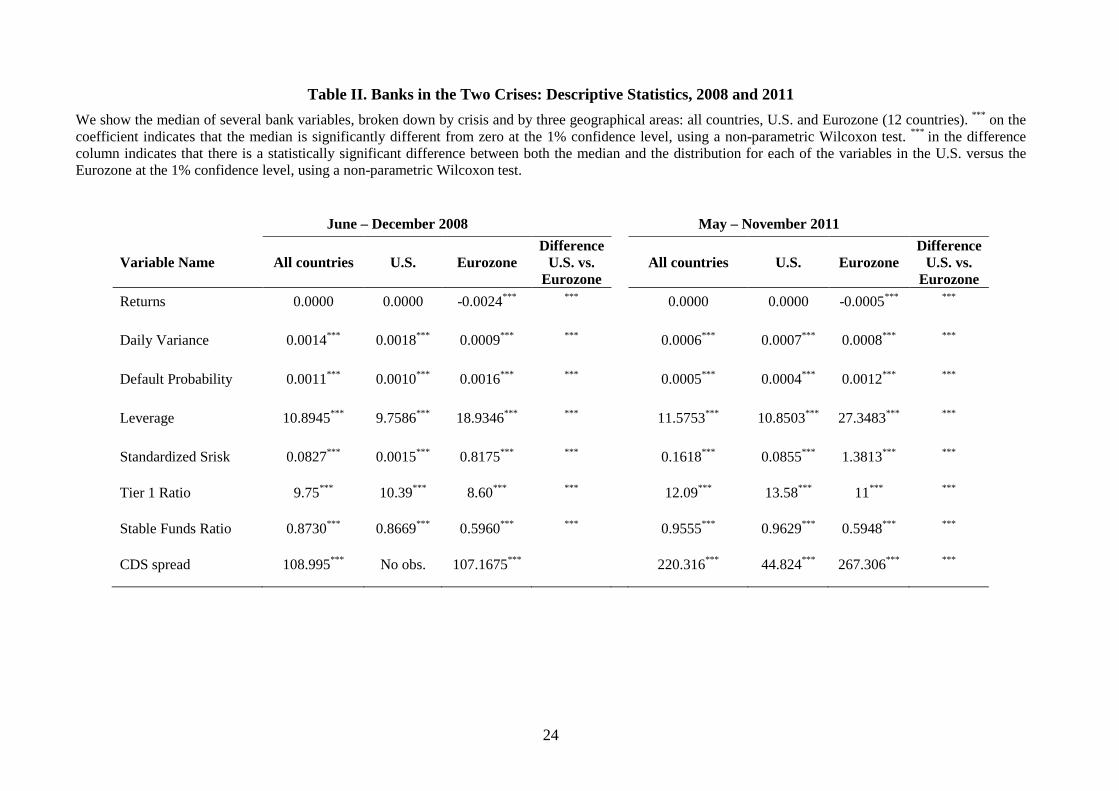
[Insert Table II]
Table II compares descriptive statistics regarding the performance of banks in the entire
sample, as well as in the US and euro-zone subsamples, in September 2008 and in August
2011, i.e. at the peak of each of the two crises. The table reports the daily median values of
some key variables for banks: stock returns; the stock daily variance from a GJR-
GARCH(1,1) model; the three-month default probability obtained as in Duan, Sun and
Wang (2012); leverage, defined as sum of book value of debt and market value of equity
over market value of equity; standardized SRISK, i.e., capital shortfall for a given financial
institution as a fraction of its stock market capitalization, whenever SRISK is positive; and
finally the CDS spread.
In the entire sample, the median daily stock return was zero in both crises, and the
median bank leverage and CDS spread were very similar across the two sub-periods. The
median bank’s risk-related measures (the variance of stock returns, the default probability
and the CDS spread) were higher in 2008 than in 2011, while median systemic risk, as
measured by standardized SRISK, was much higher in 2011 than in 2008. In the US and
euro-zone subsamples, instead, the median bank’s daily stock return is negative and
significantly different from zero (based on the Wilcoxon test) in both crises, with stock
prices dropping more for euro-zone banks than for US ones. Indeed in both crises, the
4 More precisely, Italy featured changes in both the scope of short-selling bans in both crises: it initially applied the ban to financials only and then to all stocks, as explained in the footnotes to Table 1.
10
median Euro-zone bank also featured greater default probability, leverage and systemic risk
than the median US bank, as well as the median bank for the whole sample, and these
differences were larger in 2011 than in 2008. Finally, the volatility of the median US bank
exceeded that of the median bank for the whole sample in 2008, while an that of the median
Euro-zone bank did so in 2011. Hence, on the whole European banks appear riskier and
more fragile than banks elsewhere in both crises, and especially in the second.
III. Results
To investigate the predictions described in Section I, we start by estimating baseline panel
regressions whose dependent variables are alternatively the company-level stock return, the
volatility of stock returns or the probability of default, and the explanatory variables include
dummy variables for the short-selling bans, stock-level fixed effects and other controls. We
estimate these regressions for all stocks, separately for financial stocks and then for banks
only, and separately for the two financial crises.
Second, to address sample selection issues, we construct a matched sample of banned and
exempt financial institutions, where the matching aims at identifying banks with similar
characteristics and risk exposure, and estimate a second set of panel regressions, again
controlling for fixed bank-level effects.
Thirdly, to take into account the potential endogeneity of the decision to introduce the
ban we estimate Instrumental Variables (IV) regressions, where the ban decision is modeled
as depending on macroeconomic variables (the lagged monthly value-weighted stock return
and volatility of financial stocks of each country, and their systematic risk standardized by
the average country capitalization of the financial sector of the relevant country).
Finally, we test whether short-selling bans have managed to mitigate the “diabolic loop”
between bank insolvency risk and sovereign insolvency risk, in the context of the euro debt
crisis. We do so by investigating whether the correlation between a bank’s CDS premia and
the respective sovereign CDS premium changes significantly after the imposition of short-
selling bans. We use a diff-in-diff method, as we exploit both the change in this correlation
over time for banned banks and the difference in the correlation between banned and control
banks.
11
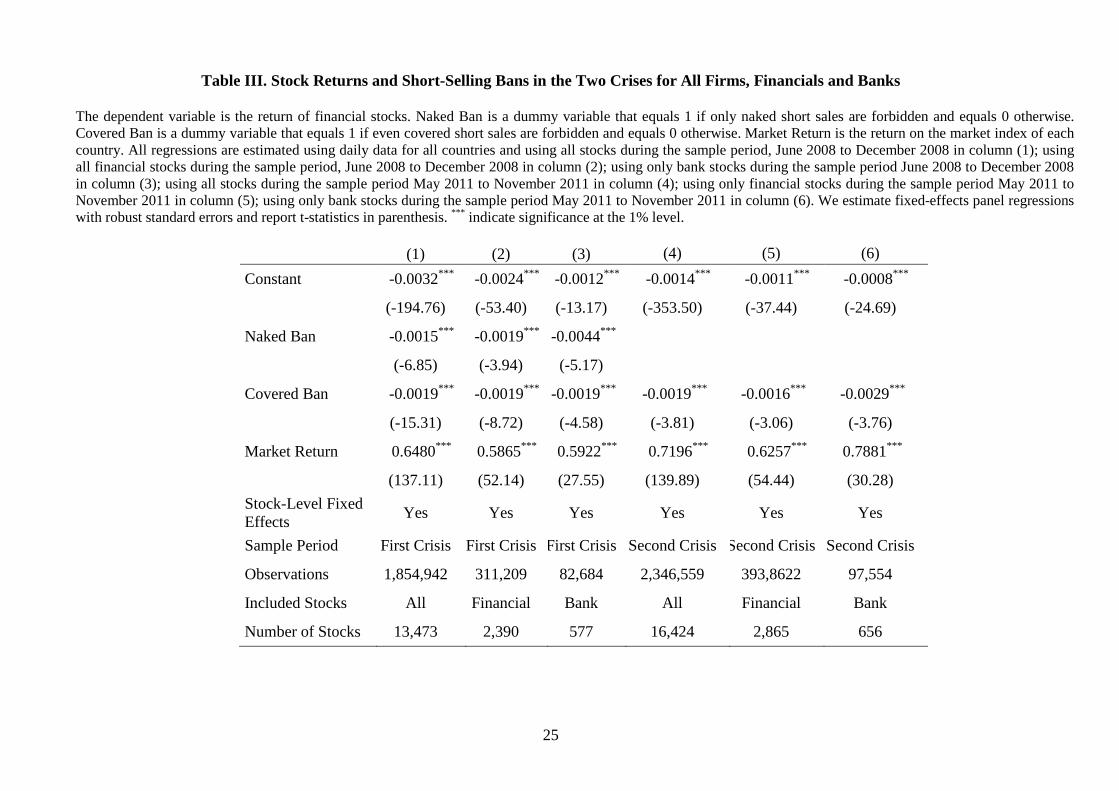
III.1. Baseline estimates
Our first set of results is shown in Table III, which reports the estimated coefficients obtained
from panel regressions where the dependent variable is the daily stock return. Each
regression includes the market return for the corresponding country, stock-level fixed effects,
and two dichotomous variables that capture the presence of short-selling bans and their
stringency: the milder bans that apply to naked short sales only (Naked Ban), and the stricter
ones that forbid covered short sales too (Covered Ban). The Naked Ban variable equals one
when only naked short sales are forbidden (covered ones being allowed), while the Covered
Ban variable equals one when covered short sales are also forbidden. Therefore, the effect of
Naked Ban is identified by the observations for which the ban does not extend to covered
short sales. The estimation is carried out separately for the two crises, to allow the estimates
to take potentially different values in the two cases: columns 1-3 report the estimates
obtained the interval from June 2008 to December 2008, and columns 4-6 those obtained for
the interval from May 2011 to November 2011. Three regressions are reported for each sub-
period, respectively including all the stocks (columns 1 and 4), financial stocks only
(columns 2 and 5), and bank stocks only (columns 3 and 6).
The table shows that the coefficients of the short-selling ban variables are negative, both
in the first crisis and in the second one, where only covered bans were newly imposed.
Notably, the negative coefficient of the naked ban variable in the first crisis is larger in
absolute value for banks than that for all stocks and for financials as a whole, and the same
applies to the covered ban variable in the second crisis. (Instead, the coefficient of the
covered ban variable in the first crisis is the same for all three groups of stocks.) The
difference between the coefficients of the ban variables for bank stocks and non-bank stocks
is statistically different from zero at the 1 percent significance level in both crises. This is an
interesting finding, as regulators have imposed short-selling bans with the intent of
supporting bank stock prices, whereas the prices of bank stocks appear to drop more than
those of other stocks when naked short-selling bans are imposed in the first crisis, and when
covered bans are imposed in the second crisis. This appears inconsistent with both Miller’s
prediction that short-selling constraints should generally be associated with stock prices
12
increases, and with the prediction by Brunnermeier and Oehmke (2014) and Liu (2015) that
this should at least apply to banks’ stock prices.
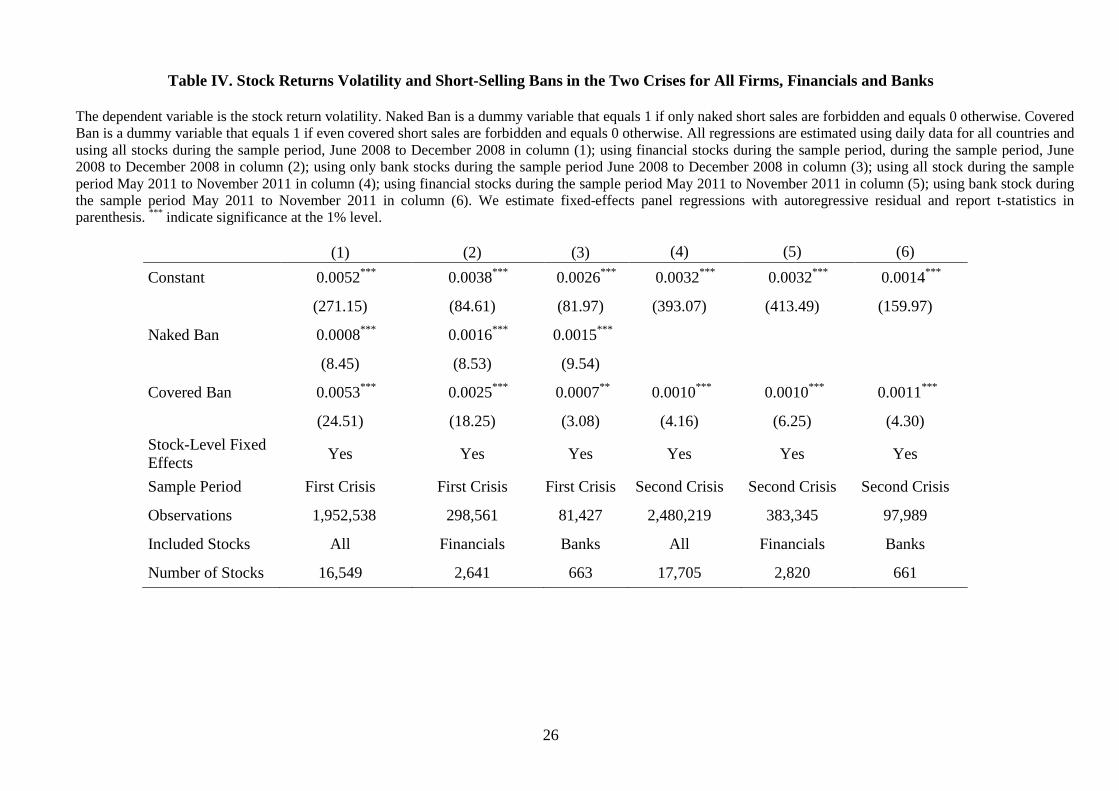
The panel estimates shown in Table IV indicate that short-selling bans were also
associated with significantly greater return volatility for all stocks in both financial crises,
although the increase in volatility was significantly larger for financial stocks than for all the
stocks only for naked bans in the first crisis (whereas for covered bans the opposite occurs).
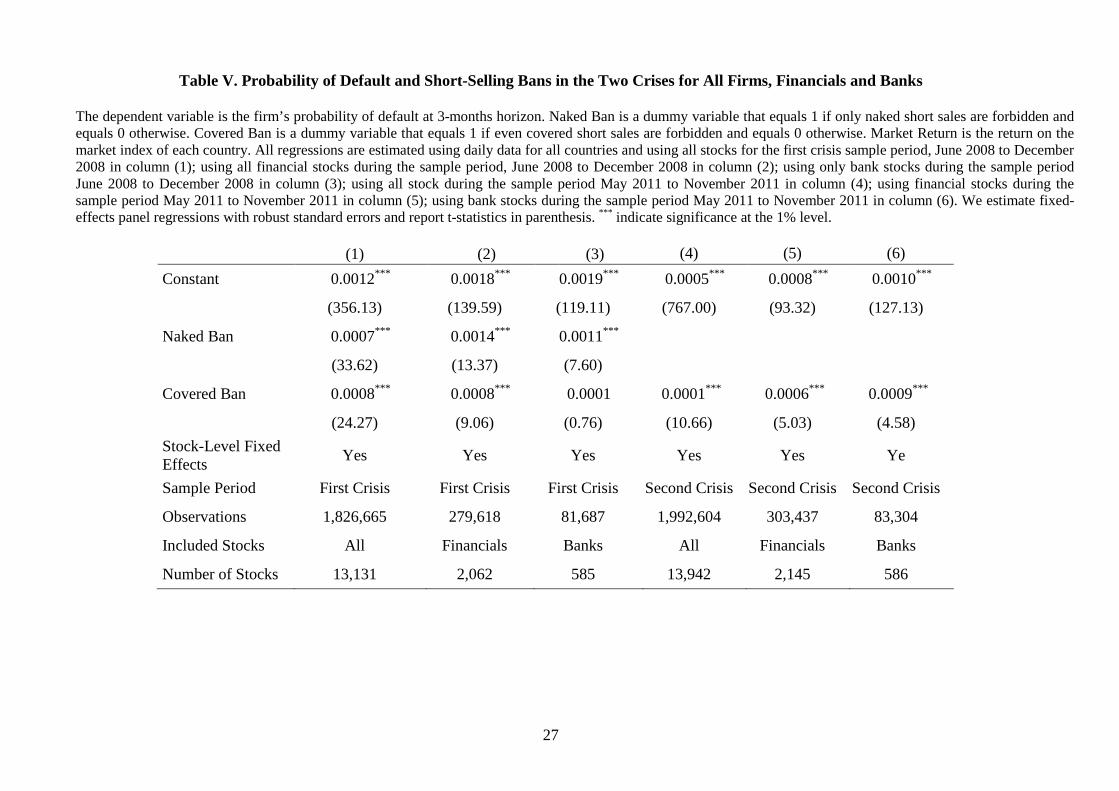
The next question is whether these regulatory interventions are associated with a reduction
in the probability of default of financial institutions, and particularly of banks. Table V,
where the dependent variable is the default probability over a 3-month horizon, indicates that
this is not the case. In the first crisis, the probability of default increased for all stocks when
they were subjected to naked or covered bans (column 1), for financials when either type of
ban was applied to them (column 2), and for bank stocks when subjected to naked bans,
though not for covered bans (column 3). In the second crisis, the probability of default
increased for all the stocks that were subject to covered bans (column 4), especially for
financials (column 5) and even more so for bank stocks (column 6): the covered bans
imposed in 2011 coincide with an increase in the probability of default for banks that is nine
times as large as for banned stocks as a whole.
III.2. Estimates obtained from matched samples
A possible criticism of the results reported so far is that the stocks subjected to short-selling
bans are different from those exempt from such bans: if they are issued by financial
institutions that are intrinsically more exposed to the turbulence caused by financial crises,
for instance because of greater leverage, the results discussed in Section III.1 would be
vitiated by sample selection issues. We address this concern by matching the observations for
each financial institution whose stock was subject to a short-selling ban with those for
another financial institution with similar characteristics and risk exposure. Specifically, for
each financial institution that was ever subject to a short-selling ban, we identify the
institution with a non-banned stock that is most similar according to (i) market capitalization,
(ii) core Tier-1 capital ratio and (iii) leverage within the same category (banks, insurance
companies, financial services companies or real estate companies). The matching is effected
13
by minimizing the sum of the absolute value of the percentage distance of these three
variables for each possible match. The matching algorithm is the same for the two crises, but
the matching is done separately for each of them, since the characteristics of the relevant
financial institutions may have changed from one to the next. For the first wave of bans, we
choose the control financial institution with the minimum distance during the first six months
of 2008 (i.e., the three matching criteria are averages during these six months); for the second
wave of bans, we choose the control financial institution with the minimum distance during
the first six months of 2011. The algorithm results in a sample of 826 financial institutions
for the first crisis, of which 496 were subject to bans as of the 30th of September 2008 and
330 are controls (as in a few cases our matching algorithm identifies the same stock as a
control for more than one banned stock). For the second crisis, the algorithm results in a
sample of 821 financial institutions, 449 of which were subject to bans on the 30th of August
2011and 372 are controls.
Some initial evidence can be gleaned by plotting measures of the return performance of
banned financial stocks and of their controls. Figure 1 shows the average cumulative excess
returns, measured along the left vertical axis, for banned stocks (blue line) and control stocks
(red line), in a window of six weeks around the ban date. The green line in the bottom part of
each graph plots the difference between banned and control stock returns, centered at zero on
the ban date and measured on the right vertical axis. The upper panel shows the evidence for
the first wave of bans in 2008, where the timeline on the horizontal axis represents the
trading days from the ban date, given that different countries imposed the bans on different
dates between the September and October 2008. Cumulative returns in excess of market
returns are virtually identical until about the ban date, and thereafter started diverging,
especially ten days after the ban, with banned stocks persistently underperforming control
stocks.5. The lower panel of Figure 1 shows similar evidence for the second wave of bans in
August 2011. Here the dashed vertical line identifies again the ban date: August 9 for the
early ban imposed in Greece, and August 12 for the banns enacted in Belgium, Greece,
France, Italy and Spain. Again, the data for the two groups of stocks feature parallel trends
before the ban, and divergence after the ban, with a strong and persistent underperformance
5 The evidence is very similar when we use cumulative returns instead of cumulative excess returns, as the market return of the banned and control stocks tend to be highly correlated and offset each other.
14
of banned stocks, except in the first couple of days. This univariate evidence suggests that
short-selling bans are very unlikely to have supported the stock prices of the targeted
financial institutions.
Figure 2 shows similar graphs for the daily variance of returns of banned and control
financial stocks. Also in this case the evidence is clear-cut: in both panels, the bans are
followed by a persistent increase in the variance of the stock returns of banned stocks above
that of control stocks, the increase being larger for the 2011 wave of bans, especially during
the first week after the ban inception. In summary, the regulator’s aim to stabilize stock
prices and reduce uncertainty through the ban is not borne out by this descriptive univariate
evidence.
Finally, Figure 3 performs the same comparison for the probability of default over a 3-
month horizon for banned and control financial stocks. The upper panel shows that around
the ban of 2008 the probability of default was gradually decreasing for both groups of
financial institutions, but that around and after the ban date this trend decrease slowed down
for banned stocks while it persisted for control stocks, so that three weeks after the ban date
the probability of default for banned stocks was almost 2 basis points larger than for the
control sample. The lower panel shows that in 2011 the probabilities of default of banned and
control stocks moved roughly in parallel fashion both before and after the ban. Overall, the
graphical evidence in these two plots does not appear consistent with the view that short-
selling bans helped fragile financial institutions to reduce their probability of default.
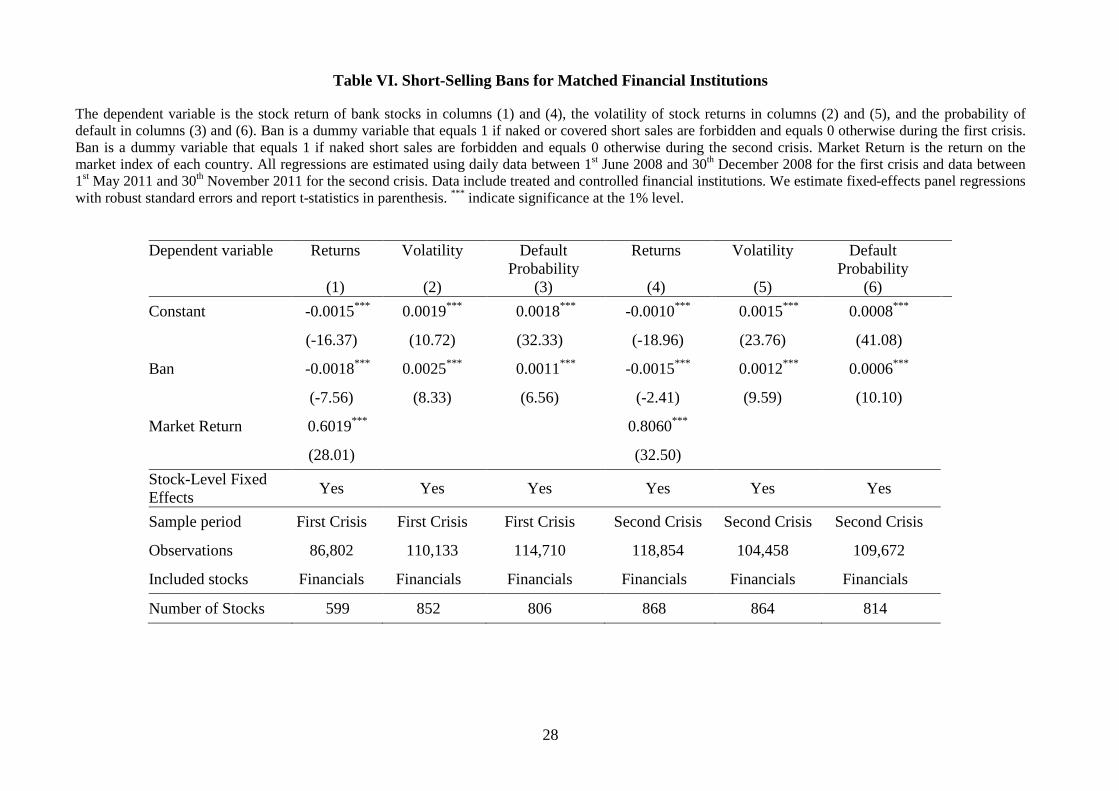
We now turn from this suggestive graphical evidence to a more rigorous empirical
analysis: in Table VI we show the panel results obtained by estimating the specifications of
Tables III, IV and V on the sample resulting from this matching procedure. Due to the
relatively small size of the sample, we now use a single ban variable, which equals 1
whenever a short-selling ban (whether naked or covered) was enacted, and 0 otherwise. In
the case of the second crisis, this variable coincides with the covered ban dummy, because
only this type of short-selling bans was newly enacted in 2011. Columns 1-3 present the
estimates obtained for the first crisis in regressions where the dependent variables are stock
returns, volatility and the default probability, respectively; columns 4-6 shows the
corresponding estimates for the second crisis. Also in the matched sample regressions, short-
selling bans are associated with significantly lower stock returns, higher return volatility and
15
greater probability of default in both crises. The size of the coefficients are very close to the
corresponding coefficient estimates obtained using the full sample of financial institutions in
columns 2 and 5 of Tables III, IV and V.
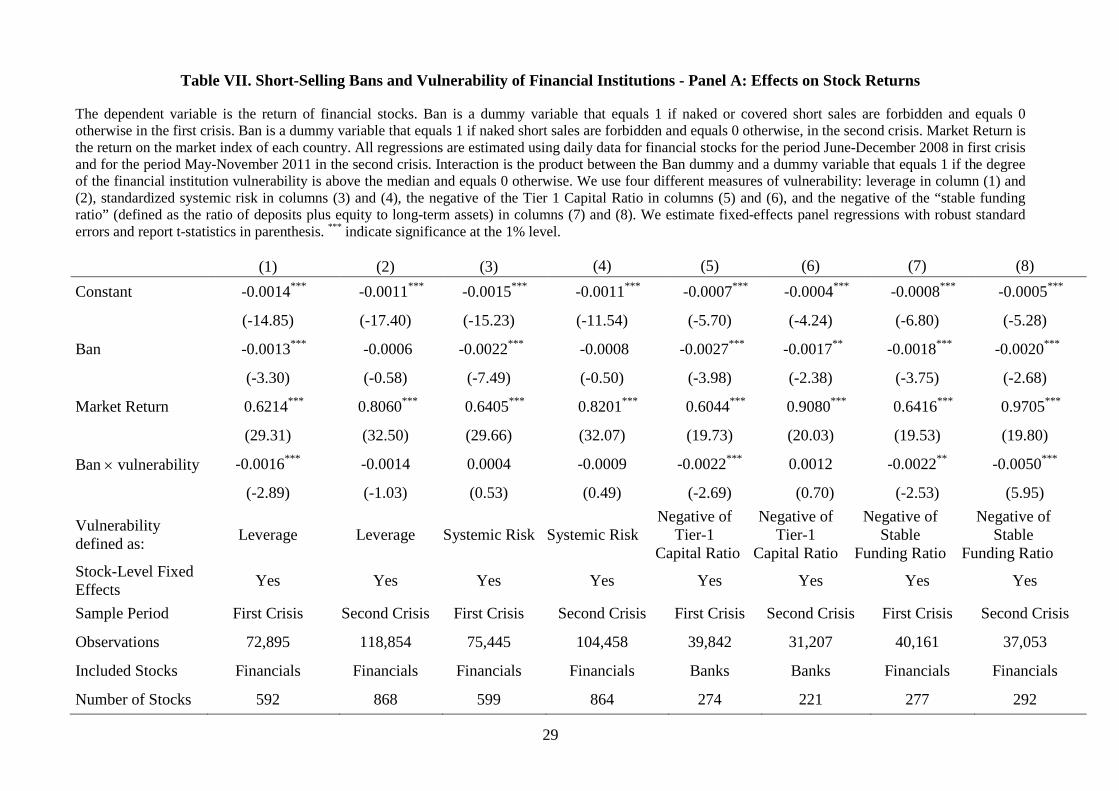
We use this matched sample also to implement a more stringent test of the Brunnermeier-
Oehmke (2014) model, by exploiting cross-sectional differences in the fragility of financial
institutions: recall that, according to their model, short-selling bans should lift stock prices
and reduce volatility and default probability only for highly vulnerable financial institutions.
Hence, we re-estimate the regressions in Table VI with the addition of an interaction between
the short-selling ban dummy and a financial vulnerability dummy, which equals 1 if the
degree of institution vulnerability is above the median and 0 otherwise. Hence, this
interaction variable allows the coefficient of the short-selling ban to take a different sign for
more vulnerable institutions. We measure vulnerability of financial institutions alternatively
by one of four variables: (i) leverage, (ii) systemic risk (SRISK), (iii) the (negative of the)
Tier-1 Capital Ratio, and (iv) the (negative of the) “stable funding ratio” of customers’
deposits plus equity to long-term assets, to capture duration mismatch between liabilities and
assets. Of course, since the last two indicators are defined only for banks, the regressions
where vulnerability is measured by these two indicators are estimated only for bank stocks.
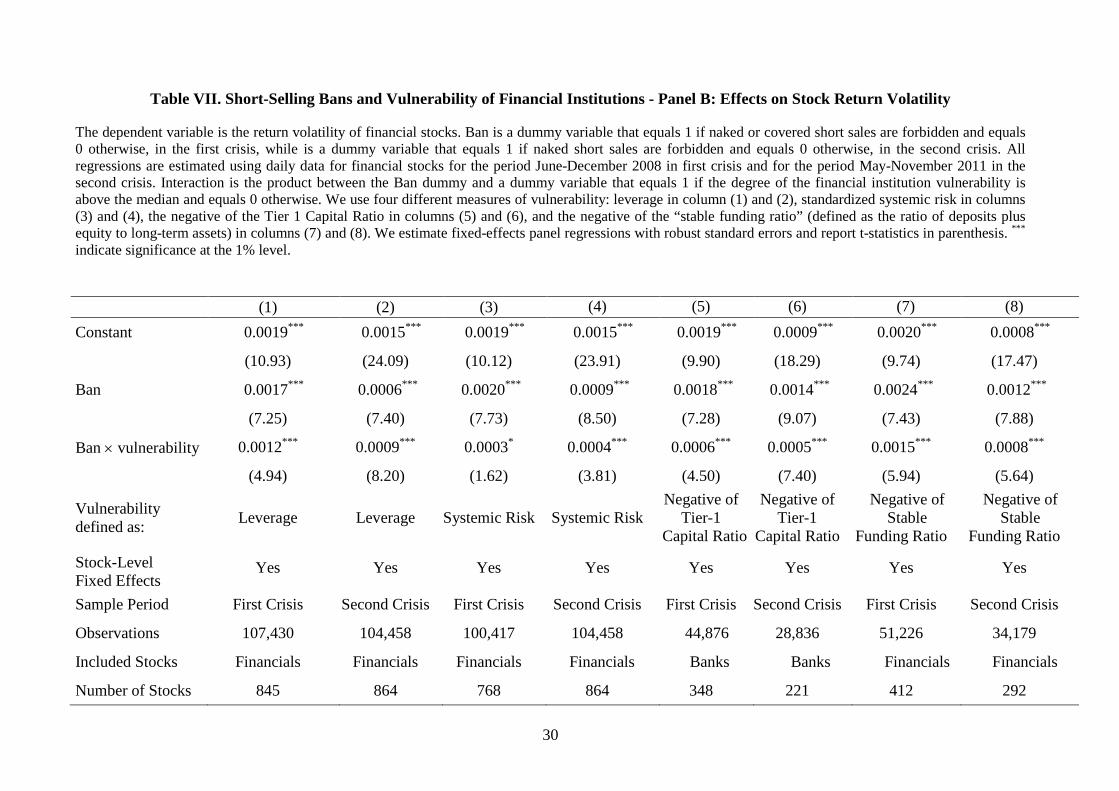
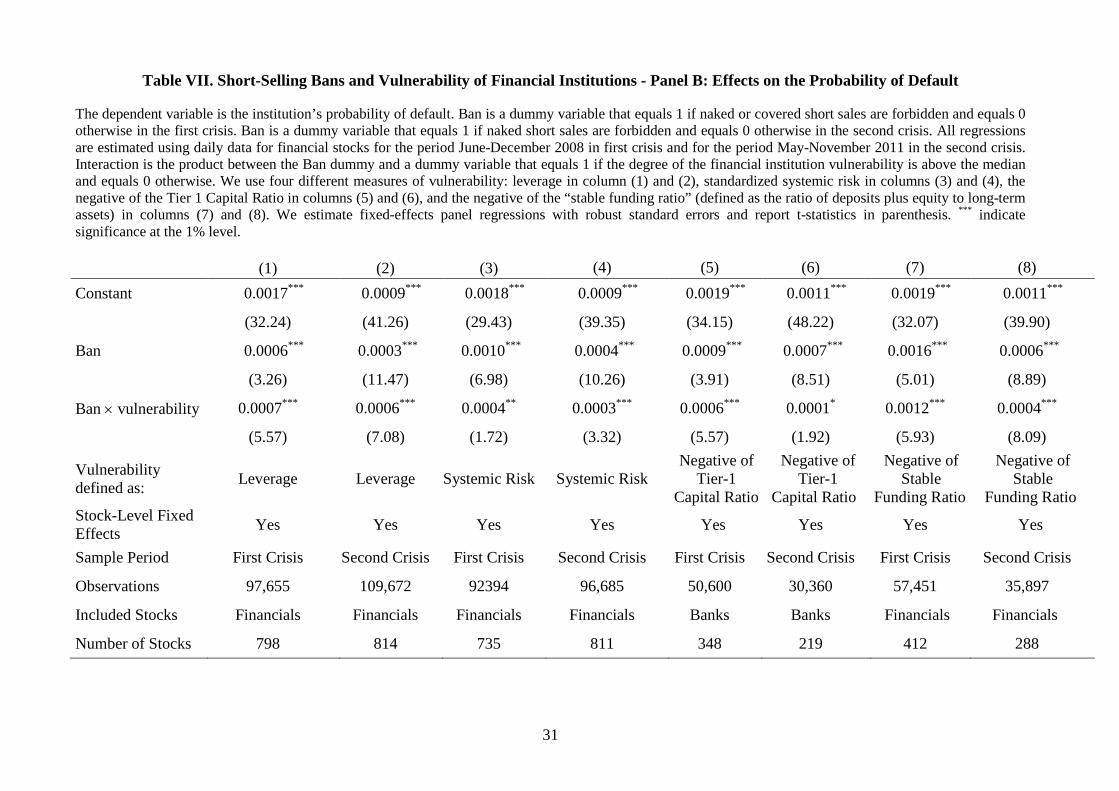
The estimates are reported in Table VII, separately for stock returns (Panel A), return
volatility (Panel B) and default probability (Panel C). In each panel, vulnerability is
measured with leverage in columns 1-2, systemic risk in columns 3-4, the (negative of the)
Tier-1 Capital Ratio in columns 5-6, and with the (negative of the) ratio of stable liabilities to
long-term assets in columns 7-8, each of the two columns referring to one of the two crises.
The results in Panel A of Table VII indicate that when vulnerability is measured by high
leverage or low Tier-1 capital, short-selling bans were associated with significantly lower
returns for more vulnerable financial institutions in the first crisis, though not in the second
crisis. If instead vulnerability is measured by lower stable funding ratio, short-selling bans
were associated with significantly lower returns for more vulnerable banks in both crises.
Finally, the coefficient of the interaction with the systemic risk indicator is not significant in
either crisis.
The estimates in Panels B and C are even stronger and more uniform: short-selling bans
were associated with even larger stock return volatility and default probability. In particular,
16
Panel B of Table VII shows that, in both crises, the short-selling ban has not only been
associated with an increase in the volatility of stock returns for financial institutions, but that
this increase has been larger for institutions with a weaker capital base (whether measured
via the leverage ratio or Tier-1 capital), with more systemic risk and with a lower stable
funding ratio. Similarly, Panel C of the table shows that in both crises short-selling bans were
associated with a greater increase in the probability of default for less capitalized financial
institutions, those with greater systemic risk and lower stable funding ratio. The probability
of default of the less capitalized banks (with below-median Tier-1 capital ratio) increased 6%
more than that of the more capitalized ones (with above-median Tier-1 capital ratio) after the
introduction of the ban. The increase in the default probability amounts to 23% and to 50%,
if we consider more versus less leveraged and more versus less systemically risky banks,
respectively. Hence, in neither crisis there is evidence in favor of the Brunnermeier-Oehmke
prediction that bans can support the prices of less capitalized banks, and more generally of
more fragile financial institutions.
III.3. Instrumental variable estimates
Another concern with the estimates reported in the previous sections arises from the possible
endogeneity of short-selling bans: if policy makers tend to impose such bans at times when
financial stocks tend to experience negative abnormal returns and become more volatile, or
when the corresponding financial institutions feature greater default risk, the correlation
between short-selling bans and bank stability documented so far could not be interpreted as a
causal relationship. Indeed, causality may go from the drop in stock returns, rise in volatility
or in default risk to short-selling bans, rather than the opposite. To address this concern, we
estimate an instrumental variables (IV) regression where the first stage is a linear probability
model determining the likelihood of a ban and the second stage models its effects on
financial stock abnormal returns, volatility, or probability of default.
Our international panel data allow us to attack this identification problem, which would
be unsolvable with a single-country data set. Furthermore, our focus on two waves of short-
selling bans imposed at very different times and to financial sectors in different conditions,
allows us to better identify instruments with the desired characteristics. Specifically, as it is
usual in these cases, the key requirement is identification of suitable instruments, that is,
17
variables to be included only in the first stage that are correlated with the decision to impose
a short-selling ban but not with the residuals of the return, volatility, probability of default
regressions. In this choice, one must take into account the fact that the decision to impose a
short-sale ban is a decision taken at the market-wide level, rather than a decision tailored to
individual stocks. Therefore, the instruments must be market-wide variables, and must vary
over time to avoid perfect collinearity with the stock-level fixed effects.
We identify three candidate instruments: the lagged monthly value-weighted stock
returns of the financial sector of each country; the lagged monthly value-weighted stock
return variance of the financial sector of each country; the lagged monthly total capital
shortfall of financial institutions associated in each country with a large stock market decline
(SRISK), standardized by the capitalization of the financial sector in that sector.
The first instrument is a market-based and timely assessment of the performance of the
financial sector. We expect a short selling ban to be more likely to be enacted by countries
that have seen their financial sector lose a lot of value during the previous month, in line with
the mechanism highlighted in the Brunnermeier and Oehmke (2014) model. If financial
sector stock returns are autocorrelated over time, this might not be a valid instrument for
financial stock returns, but it can be a valid instrument for other dimensions of financial
stability, such as the return volatility or the probability of default of financial stocks.
The second instrument is similar, but describes the second moment of financial stock
returns and is thus more directly related to the risk dimension of the financial sector extracted
from the stock market. We expect that a short-selling ban is more likely to be enacted by
countries that have seen a recent increase in stock market volatility of their financial sector.
The last instrument has a similar logic, but focuses more on the systemic risk generated
by financial institutions in each country, as SRISK is obtained from information extracted
from bank stock returns, volatility, and correlations. Again, the ban is more likely to be
enacted by countries that have seen the systemic risk of their financial sector increase over
time.
We use the systemic risk instrument for all dimensions of bank stability. As a second
instrument, we choose the lagged average country volatility of the financial sector for
individual bank stock returns, and the average country return of the financial sector for
individual bank volatility and probability of default.
18
All instruments turn out to have very strong explanatory power in the respective first-
stage regressions. At the same time, being lagged and averaged at the country level, these
variables should not be correlated with bank stability at the individual stock level if the
market return, volatility, and systemic effects are fully impounded in contemporaneous
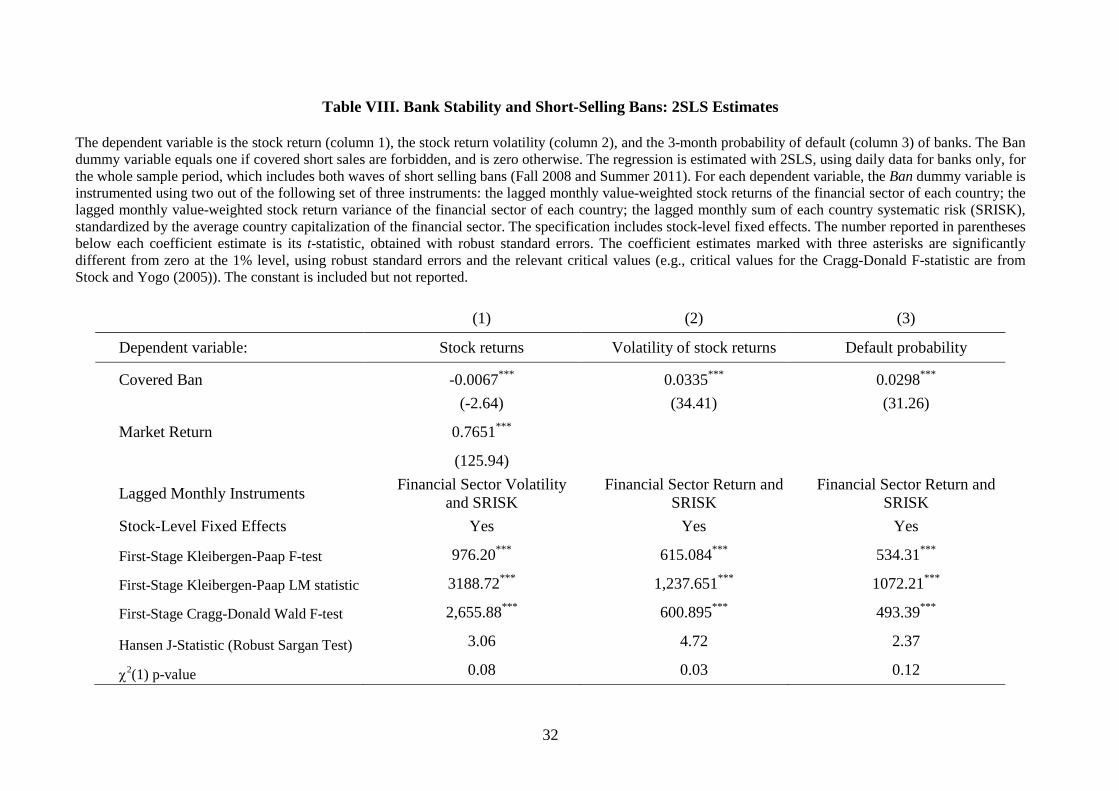
individual variables. Indeed, Table VIII shows that the instruments pass the Sargan
exogeneity test, most clearly for bank volatility and probabilities of default.
When these variables are used as instruments in IV panel regressions with stock-level
fixed effects and robust standard errors, the ban variable is again clearly found to be
associated with lower stock returns, higher volatility, and higher probability of default.
Therefore, short-selling bans appear to have been detrimental for the stability of banks on all
dimensions, even when taking their endogeneity into account.
III.4. Did short-selling bans mitigate the bank-sovereign diabolic loop?
The hallmark of the euro-area debt sovereign crisis has been the “diabolic loop” between
sovereign and banks: sovereign stress impacted the solvency of banks, both by weakening
their implicit public guarantee in case of distress and by decreasing the value of their
sovereign debt holdings; in turn, bank distress weakened the perceived creditworthiness of
the respective sovereigns, regarded as their ultimate backstop.6 This mutually reinforcing
relationship between government and bank distress is probably a key reason for the short-
selling bans swiftly imposed by security market regulators in the stressed countries of the
euro area in 2011. It is then worth investigating whether short-selling bans have managed to
mitigate the “diabolic loop” between bank insolvency risk and sovereign insolvency risk in
the context of the euro debt crisis, even though the evidence reported so far suggests that
there is little reason to expect them to have exerted such a mitigating influence.
We investigate their effect on the bank-sovereign “diabolic loop” by testing whether
the correlation between a bank’s CDS premia and the respective sovereign CDS premium
changes significantly after the imposition of a short-selling ban. The results are shown in
Table IX, which reports the estimated coefficients obtained from panel regressions in the
6 See, for example, Acharya, Drechsler and Schnabl, 2014; Brunnermeier et al, 2015; Cooper and Nikolov, 2013; Farhi and Tirole, 2014; Leonello, 2014, among others.
19
matched sample where the dependent variable is the correlation between the sovereign and
corporate daily credit default swaps during the sample period, May 2011 to November 2011.
The correlation between sovereign and corporate credit default swaps is calculated using
different rolling windows: a 10-days window in columns (1), (2) and (3), and a 20-days
window in columns (4), (5) and (6). Each regression includes stock-level fixed effects and
the Covered Ban variable. The estimation is carried out separately for two different
subgroups of countries in the Euro Area and includes financial stocks only (columns 1, 2, 4
and 5), and bank stocks only (columns 3 and 6).
The table shows that the coefficient of the covered ban variable is positive and not
significant in all the specifications, suggesting that the ban did not help to mitigate the
“diabolic loop” between bank insolvency risk and sovereign insolvency risk during the
sovereign debt crisis in Europe. If anything, the ban seems to have increased the intensity of
the diabolic loop, albeit not significantly.
IV. Conclusions
Previous research has shown that the short-selling bans imposed in 2008-09 reduced market
liquidity, slowed down price discovery, and were at best ineffective in supporting stock
prices. This dismal outcome in 2008-09 has not deterred several EU regulators from
embarking on a new wave of short-selling bans on financials when the European debt crisis
broke out in 2010. In both crises, the main motivation offered in the regulatory debate was
the danger that a collapse of bank stock prices may lead them to experience funding
problems or even a full-fledged run by depositors.
This paper tests whether short-selling bans of bank stocks stabilizes vulnerable banks at
times of market stress or not. We test this hypothesis by canvassing the evidence produced by
the two crises of 2008-09 and 2010-12. To assess the effects of short-selling bans on bank
stability, we compare empirically the evolution of stock returns, volatility and solvency
measures for a large number of companies and financial institutions, many of which banks,
only a subset of which become subject to short-selling bans at one point or repeatedly in
time.
20
On the whole, our evidence indicates that short-selling bans are not associated with
greater bank stability: actually, most of our estimates – including those where we attempt to
control for the endogeneity of short-selling bans – point to the opposite result, namely that
short-selling bans tend to be associated with stronger declines in stock prices, greater
volatility of returns and higher probability of default, particularly so for banks. The market
may have read the imposition of bans as a signal that regulators had more negative
information about the solvency of companies, and especially that of banks, then that
available to the investing public – and possibly that the relevant government authorities were
not ready to take more definite and fast action to address such solvency problems, such as
forcing banks to recapitalize.
21
References
Acharya, Viral, Itamar Drechsler, and Philip Schnabl (2014), “A Pyrrhic Victory? Bank
Bailouts and Sovereign Credit Risk”, Journal of Finance 69, 2689-2739.
Altavilla, Carlo, Marco Pagano, and Saverio Simonelli (2015), “Banks Exposures and
Sovereign Stress Transmission”, CSEF Working Paper no. 410, July.
Bai, Yang, Eric C. Chang, and Jiang Wang (2006), “Asset Prices under Short-sale
Constraints,” Working paper, MIT Sloan School of Management.
Battalio, Robert, Hamid Mehran, and Paul Schultz (2011), “Market Declines: Is Banning
Short Selling the Solution?” Federal Reserve Bank of New York Staff Report no. 518,
September.
Beber, Alessandro, and Marco Pagano (2013), “Short Selling Bans around the World:
Evidence from the 2007-09 Crisis,” Journal of Finance 68, 343-381.
Boehmer Ekkehart, Charles Jones and Xiaoyan Zhang (2013), “Shackling Short Sellers: The
2008 Shorting Ban,” Review of Financial Studies 26, 2013, 1363-1400.
Brownlees, Chris, and Richard Engle (2012), “Volatility, Correlation and Tails for Systemic
Risk Measurement,” Working Paper, New York University.
Brunnermeier, Markus K., and Martin Oehmke (2014), “Predatory short-selling,” Review of
Finance 18(6), 2153-2195.
Brunnermeier, Markus K., Luis Garicano, Philip R. Lane, Marco Pagano, Ricardo Reis,
Tano Santos, David Thesmar, Stijn Van Nieuwerburgh, and Dimitri Vayanos (2015),
“Breaking the Sovereign-Bank Diabolic Loop: A Case for ESBies.” American
Economic Review Papers and Proceedings, forthcoming.
Cooper Russell and Kalin Nikolov, (2013) “Government Debt and Banking Fragility: The
Spreading of Strategic Uncertainty”, NBER Working Paper No. 19278.
Crane, Alan, Kevin Crotty, Sébastien Michenaud, and Patricia Naranjo (2015), “The Causal
Effect of Short-Selling Bans: Evidence from Eligibility Standards,” Working Paper,
Rice University.
22
Diamond, Douglas W., and Robert E. Verrecchia (1987), “Constraints on short selling and
asset price adjustment to private information,” Journal of Financial Economics 18,
277–312.
Fang, Vivian W., Allen Huang, and Jonathan M. Karpoff (2015), “Short Selling and
Earnings Management: A Controlled Experiment,” Journal of Finance, forthcoming.
Farhi, Emmanuel, and Jean Tirole (2014), “Deadly Embrace: Sovereign and Financial
Balance Sheets Doom Loops,” Working Paper, Harvard University.
Gruenewald, Seraina, Alexander F. Wagner, and Rolf H. Weber, 2010, “Short Selling
Regulation after the Financial Crisis – First Principles Revisited,” International
Journal of Disclosure and Regulation 7, 108-135.
Ho, Po-Hsin, Chih-Yung Lin, and Tse-Chun Lin (2015), “Equity Short Selling and Bank
Loan Market: A Controlled Experiment,” Working Paper, University of Hong Kong.
Hong, Harrison, and Jeremy C. Stein (2003), “Differences of opinion, short-sales
constraints, and market crashes,” Review of Financial Studies 16, 487-525.
Kolasinksi, A. C., A. V. Reed, and J. R. Thornock (2010), “Prohibitions versus constraints:
The 2008 short sales regulations,” Working paper, University of Washington and
University of North Carolina.
Leonello, Agnese (2014) “Government Guarantees and the Two-Way Feedback between
Banking and Sovereign Debt Crises”, Working Paper, ECB.
Liu, Xuewen (2015), “Short-Selling Attacks and Creditor Runs,” Management Science
61(4), 814-830.
Marsh, Ian W., and Richard Payne (2012), “Banning short sales and market quality: The
UK’s experience,” Journal of Banking and Finance, 36(7), 1975-1986.
Massa, Massimo, Bohui Zhang, and Hong Zhang (2015), “The Invisible Hand of Short-
Selling: Does Short-Selling Discipline Earnings Manipulation?” Review of Financial
Studies 28, 1701–1736.
Miller, Edward M. (1977), “Risk, uncertainty and divergence of opinion,” Journal of
Finance 32, 1151-1168.
23
Table I. Structure of the Data Set
Bans imposed in September and October 2008 Bans imposed in August 2011 Country Start Date
of Ban Lift Date of
Ban Scope of the
Ban Number of stocks in
2008
Number of Stocks with
Covered Ban in 2008
Number of Stocks with Naked Ban
in 2008
Start Date of Covered
Ban
Lift Date of Covered Ban
Scope of the Covered Ban
Number of Stocks in 2011
Number of Stocks with
Covered Ban in 2011
Austria 26 Oct 08 4 financials 85 0 4 no ban 89 0 Belgium 22 Sep 08 4 financials 140 0 3 12 Aug 11 13 Feb 12 4 financials 133 3 Denmark 13 Oct 08 47 financials 134 0 47 no ban 116 0 Finland no ban 107 0 0 no ban 91 0 France 22 Sep 08 1 Feb 11 10 financials 612 0 9 12 Aug 11 11 Feb 12 10 financials 634 9 Germany 22 Sep 08 31 Jan 10 11 financials 576 0 11 no ban 745 0 Greece 10 Oct 08 1 Jun 09 all stocks 214 0 214 9 Aug 11 all stocks 221 221 Ireland 19 Sep 08 31 Dec 11 5 financials 42 5 0 no ban 43 0 Italy 22 Sep 08* 31 Jul 09 50 financials, then all 185 0 35 12 Aug 11** 24 Feb 12*** 29 financials, then all 197 21 Luxembourg 19 Sep 08 15 financials 25 0 12 no ban 24 0 Netherlands 22 Sep 08 1 Jun 09 8 financials 98 0 5 no ban 75 0 Norway 8 Oct 08 28 Sep 09 5 financials 43 4 0 no ban 44 0 Portugal 22 Sep 08 8 financials 42 0 3 no ban 43 0 Spain 24 Sep 08 all stocks 132 0 132 12 Aug 11 16 Dec 12 financials 152 9 Sweden no ban 314 0 0 no ban 353 0 Switzerland 19 Sep 08 16 Jan 09 financials 220 72 148 no ban 237 0 U.K. 19 Sep 08 16 Jan 09 financials 712 142 0 no ban 766 0 U.S. 19 Sep 08 8 Oct 08 financials 2,311 472 0 no ban 2,499 0 Australia 22 Sep 08 19 Nov 08**** all stocks 1,402 1,402 0 no ban 1,601 0 Canada 19 Sep 08 8 Oct 08 financials 2,478 9 0 no ban 2,927 0 Japan 30 Oct 08 all stocks 3,217 0 3,217 no ban 3,311 0 Hong Kong no ban 1,061 0 0 no ban 1,223 0 Israel no ban 444 0 0 no ban 468 0 New Zealand no ban 111 0 0 no ban 117 0 South Korea 1 Oct 08 1 Jun 09***** all stocks 1,278 1,278 0 10 Aug 11 9 Nov 11****** all stocks 1,477 1,477 Totals 15,983 3,384 3,840 17,586 1,740 * The ban initially applied to financials, and was extended to all stocks on 10 October 2008. ** The ban initially applied to financials, and was extended to all stocks on 1st December 2011. ***On February 24th 2012, only the covered on financials was lifted. ****On November 19th 2008, only the covered on non-financials was lifted. *****On June 1st 2009, only the covered on non-financials was lifted. ******On November 9th 2011, only the covered on non-financials was lifted.
24
Table II. Banks in the Two Crises: Descriptive Statistics, 2008 and 2011
We show the median of several bank variables, broken down by crisis and by three geographical areas: all countries, U.S. and Eurozone (12 countries). *** on the coefficient indicates that the median is significantly different from zero at the 1% confidence level, using a non-parametric Wilcoxon test. *** in the difference column indicates that there is a statistically significant difference between both the median and the distribution for each of the variables in the U.S. versus the Eurozone at the 1% confidence level, using a non-parametric Wilcoxon test.
June – December 2008 May – November 2011
Variable Name All countries U.S. Eurozone Difference
U.S. vs. Eurozone
All countries U.S. Eurozone
Difference U.S. vs.
Eurozone Returns 0.0000 0.0000 -0.0024*** *** 0.0000 0.0000 -0.0005*** ***
Daily Variance 0.0014*** 0.0018*** 0.0009*** *** 0.0006*** 0.0007*** 0.0008*** ***
Default Probability 0.0011*** 0.0010*** 0.0016*** *** 0.0005*** 0.0004*** 0.0012*** ***
Leverage 10.8945*** 9.7586*** 18.9346*** *** 11.5753*** 10.8503*** 27.3483*** ***
Standardized Srisk 0.0827*** 0.0015*** 0.8175*** *** 0.1618*** 0.0855*** 1.3813*** ***
Tier 1 Ratio 9.75*** 10.39*** 8.60*** *** 12.09*** 13.58*** 11*** ***
Stable Funds Ratio 0.8730*** 0.8669*** 0.5960*** *** 0.9555*** 0.9629*** 0.5948*** ***
CDS spread 108.995*** No obs. 107.1675*** 220.316*** 44.824*** 267.306*** ***
25
Table III. Stock Returns and Short-Selling Bans in the Two Crises for All Firms, Financials and Banks
The dependent variable is the return of financial stocks. Naked Ban is a dummy variable that equals 1 if only naked short sales are forbidden and equals 0 otherwise. Covered Ban is a dummy variable that equals 1 if even covered short sales are forbidden and equals 0 otherwise. Market Return is the return on the market index of each country. All regressions are estimated using daily data for all countries and using all stocks during the sample period, June 2008 to December 2008 in column (1); using all financial stocks during the sample period, June 2008 to December 2008 in column (2); using only bank stocks during the sample period June 2008 to December 2008 in column (3); using all stocks during the sample period May 2011 to November 2011 in column (4); using only financial stocks during the sample period May 2011 to November 2011 in column (5); using only bank stocks during the sample period May 2011 to November 2011 in column (6). We estimate fixed-effects panel regressions with robust standard errors and report t-statistics in parenthesis. *** indicate significance at the 1% level.
(1) (2) (3) (4) (5) (6) Constant -0.0032*** -0.0024*** -0.0012*** -0.0014*** -0.0011*** -0.0008***
(-194.76) (-53.40) (-13.17) (-353.50) (-37.44) (-24.69)
Naked Ban -0.0015*** -0.0019*** -0.0044***
(-6.85) (-3.94) (-5.17)
Covered Ban -0.0019*** -0.0019*** -0.0019*** -0.0019*** -0.0016*** -0.0029***
(-15.31) (-8.72) (-4.58) (-3.81) (-3.06) (-3.76)
Market Return 0.6480*** 0.5865*** 0.5922*** 0.7196*** 0.6257*** 0.7881***
(137.11) (52.14) (27.55) (139.89) (54.44) (30.28) Stock-Level Fixed Effects Yes Yes Yes Yes Yes Yes
Sample Period First Crisis First Crisis First Crisis Second Crisis Second Crisis Second Crisis
Observations 1,854,942 311,209 82,684 2,346,559 393,8622 97,554
Included Stocks All Financial Bank All Financial Bank
Number of Stocks 13,473 2,390 577 16,424 2,865 656
26
Table IV. Stock Returns Volatility and Short-Selling Bans in the Two Crises for All Firms, Financials and Banks
The dependent variable is the stock return volatility. Naked Ban is a dummy variable that equals 1 if only naked short sales are forbidden and equals 0 otherwise. Covered Ban is a dummy variable that equals 1 if even covered short sales are forbidden and equals 0 otherwise. All regressions are estimated using daily data for all countries and using all stocks during the sample period, June 2008 to December 2008 in column (1); using financial stocks during the sample period, during the sample period, June 2008 to December 2008 in column (2); using only bank stocks during the sample period June 2008 to December 2008 in column (3); using all stock during the sample period May 2011 to November 2011 in column (4); using financial stocks during the sample period May 2011 to November 2011 in column (5); using bank stock during the sample period May 2011 to November 2011 in column (6). We estimate fixed-effects panel regressions with autoregressive residual and report t-statistics in parenthesis. *** indicate significance at the 1% level.
(1) (2) (3) (4) (5) (6) Constant 0.0052*** 0.0038*** 0.0026*** 0.0032*** 0.0032*** 0.0014***
(271.15) (84.61) (81.97) (393.07) (413.49) (159.97)
Naked Ban 0.0008*** 0.0016*** 0.0015***
(8.45) (8.53) (9.54)
Covered Ban 0.0053*** 0.0025*** 0.0007** 0.0010*** 0.0010*** 0.0011***
(24.51) (18.25) (3.08) (4.16) (6.25) (4.30) Stock-Level Fixed Effects Yes Yes Yes Yes Yes Yes
Sample Period First Crisis First Crisis First Crisis Second Crisis Second Crisis Second Crisis
Observations 1,952,538 298,561 81,427 2,480,219 383,345 97,989
Included Stocks All Financials Banks All Financials Banks
Number of Stocks 16,549 2,641 663 17,705 2,820 661
27
Table V. Probability of Default and Short-Selling Bans in the Two Crises for All Firms, Financials and Banks
The dependent variable is the firm’s probability of default at 3-months horizon. Naked Ban is a dummy variable that equals 1 if only naked short sales are forbidden and equals 0 otherwise. Covered Ban is a dummy variable that equals 1 if even covered short sales are forbidden and equals 0 otherwise. Market Return is the return on the market index of each country. All regressions are estimated using daily data for all countries and using all stocks for the first crisis sample period, June 2008 to December 2008 in column (1); using all financial stocks during the sample period, June 2008 to December 2008 in column (2); using only bank stocks during the sample period June 2008 to December 2008 in column (3); using all stock during the sample period May 2011 to November 2011 in column (4); using financial stocks during the sample period May 2011 to November 2011 in column (5); using bank stocks during the sample period May 2011 to November 2011 in column (6). We estimate fixed-effects panel regressions with robust standard errors and report t-statistics in parenthesis. *** indicate significance at the 1% level.
(1) (2) (3) (4) (5) (6) Constant 0.0012*** 0.0018*** 0.0019*** 0.0005*** 0.0008*** 0.0010***
(356.13) (139.59) (119.11) (767.00) (93.32) (127.13)
Naked Ban 0.0007*** 0.0014*** 0.0011***
(33.62) (13.37) (7.60)
Covered Ban 0.0008*** 0.0008*** 0.0001 0.0001*** 0.0006*** 0.0009***
(24.27) (9.06) (0.76) (10.66) (5.03) (4.58) Stock-Level Fixed Effects Yes Yes Yes Yes Yes Ye
Sample Period First Crisis First Crisis First Crisis Second Crisis Second Crisis Second Crisis
Observations 1,826,665 279,618 81,687 1,992,604 303,437 83,304
Included Stocks All Financials Banks All Financials Banks
Number of Stocks 13,131 2,062 585 13,942 2,145 586
28
Table VI. Short-Selling Bans for Matched Financial Institutions
The dependent variable is the stock return of bank stocks in columns (1) and (4), the volatility of stock returns in columns (2) and (5), and the probability of default in columns (3) and (6). Ban is a dummy variable that equals 1 if naked or covered short sales are forbidden and equals 0 otherwise during the first crisis. Ban is a dummy variable that equals 1 if naked short sales are forbidden and equals 0 otherwise during the second crisis. Market Return is the return on the market index of each country. All regressions are estimated using daily data between 1st June 2008 and 30th December 2008 for the first crisis and data between 1st May 2011 and 30th November 2011 for the second crisis. Data include treated and controlled financial institutions. We estimate fixed-effects panel regressions with robust standard errors and report t-statistics in parenthesis. *** indicate significance at the 1% level.
Dependent variable Returns
(1)
Volatility
(2)
Default Probability
(3)
Returns
(4)
Volatility
(5)
Default Probability
(6) Constant -0.0015*** 0.0019*** 0.0018*** -0.0010*** 0.0015*** 0.0008***
(-16.37) (10.72) (32.33) (-18.96) (23.76) (41.08)
Ban -0.0018*** 0.0025*** 0.0011*** -0.0015*** 0.0012*** 0.0006***
(-7.56) (8.33) (6.56) (-2.41) (9.59) (10.10)
Market Return 0.6019*** 0.8060***
(28.01) (32.50) Stock-Level Fixed Effects Yes Yes Yes Yes Yes Yes
Sample period First Crisis First Crisis First Crisis Second Crisis Second Crisis Second Crisis
Observations 86,802 110,133 114,710 118,854 104,458 109,672
Included stocks Financials Financials Financials Financials Financials Financials
Number of Stocks 599 852 806 868 864 814
29
Table VII. Short-Selling Bans and Vulnerability of Financial Institutions - Panel A: Effects on Stock Returns
The dependent variable is the return of financial stocks. Ban is a dummy variable that equals 1 if naked or covered short sales are forbidden and equals 0 otherwise in the first crisis. Ban is a dummy variable that equals 1 if naked short sales are forbidden and equals 0 otherwise, in the second crisis. Market Return is the return on the market index of each country. All regressions are estimated using daily data for financial stocks for the period June-December 2008 in first crisis and for the period May-November 2011 in the second crisis. Interaction is the product between the Ban dummy and a dummy variable that equals 1 if the degree of the financial institution vulnerability is above the median and equals 0 otherwise. We use four different measures of vulnerability: leverage in column (1) and (2), standardized systemic risk in columns (3) and (4), the negative of the Tier 1 Capital Ratio in columns (5) and (6), and the negative of the “stable funding ratio” (defined as the ratio of deposits plus equity to long-term assets) in columns (7) and (8). We estimate fixed-effects panel regressions with robust standard errors and report t-statistics in parenthesis. *** indicate significance at the 1% level. (1) (2) (3) (4) (5) (6) (7) (8) Constant -0.0014*** -0.0011*** -0.0015*** -0.0011*** -0.0007*** -0.0004*** -0.0008*** -0.0005***
(-14.85) (-17.40) (-15.23) (-11.54) (-5.70) (-4.24) (-6.80) (-5.28)
Ban -0.0013*** -0.0006 -0.0022*** -0.0008 -0.0027*** -0.0017** -0.0018*** -0.0020***
(-3.30) (-0.58) (-7.49) (-0.50) (-3.98) (-2.38) (-3.75) (-2.68)
Market Return 0.6214*** 0.8060*** 0.6405*** 0.8201*** 0.6044*** 0.9080*** 0.6416*** 0.9705***
(29.31) (32.50) (29.66) (32.07) (19.73) (20.03) (19.53) (19.80)
Ban × vulnerability -0.0016*** -0.0014 0.0004 -0.0009 -0.0022*** 0.0012 -0.0022** -0.0050***
(-2.89) (-1.03) (0.53) (0.49) (-2.69) (0.70) (-2.53) (5.95)
Vulnerability defined as: Leverage Leverage Systemic Risk Systemic Risk
Negative of Tier-1
Capital Ratio
Negative of Tier-1
Capital Ratio
Negative of Stable
Funding Ratio
Negative of Stable
Funding Ratio Stock-Level Fixed Effects Yes Yes Yes Yes Yes Yes Yes Yes
Sample Period First Crisis Second Crisis First Crisis Second Crisis First Crisis Second Crisis First Crisis Second Crisis
Observations 72,895 118,854 75,445 104,458 39,842 31,207 40,161 37,053
Included Stocks Financials Financials Financials Financials Banks Banks Financials Financials
Number of Stocks 592 868 599 864 274 221 277 292
30
Table VII. Short-Selling Bans and Vulnerability of Financial Institutions - Panel B: Effects on Stock Return Volatility
The dependent variable is the return volatility of financial stocks. Ban is a dummy variable that equals 1 if naked or covered short sales are forbidden and equals 0 otherwise, in the first crisis, while is a dummy variable that equals 1 if naked short sales are forbidden and equals 0 otherwise, in the second crisis. All regressions are estimated using daily data for financial stocks for the period June-December 2008 in first crisis and for the period May-November 2011 in the second crisis. Interaction is the product between the Ban dummy and a dummy variable that equals 1 if the degree of the financial institution vulnerability is above the median and equals 0 otherwise. We use four different measures of vulnerability: leverage in column (1) and (2), standardized systemic risk in columns (3) and (4), the negative of the Tier 1 Capital Ratio in columns (5) and (6), and the negative of the “stable funding ratio” (defined as the ratio of deposits plus equity to long-term assets) in columns (7) and (8). We estimate fixed-effects panel regressions with robust standard errors and report t-statistics in parenthesis. *** indicate significance at the 1% level. (1) (2) (3) (4) (5) (6) (7) (8) Constant 0.0019*** 0.0015*** 0.0019*** 0.0015*** 0.0019*** 0.0009*** 0.0020*** 0.0008***
(10.93) (24.09) (10.12) (23.91) (9.90) (18.29) (9.74) (17.47)
Ban 0.0017*** 0.0006*** 0.0020*** 0.0009*** 0.0018*** 0.0014*** 0.0024*** 0.0012***
(7.25) (7.40) (7.73) (8.50) (7.28) (9.07) (7.43) (7.88)
Ban × vulnerability 0.0012*** 0.0009*** 0.0003* 0.0004*** 0.0006*** 0.0005*** 0.0015*** 0.0008***
(4.94) (8.20) (1.62) (3.81) (4.50) (7.40) (5.94) (5.64)
Vulnerability defined as: Leverage Leverage Systemic Risk Systemic Risk
Negative of Tier-1
Capital Ratio
Negative of Tier-1
Capital Ratio
Negative of Stable
Funding Ratio
Negative of Stable
Funding Ratio
Stock-Level Fixed Effects
Yes Yes Yes Yes Yes Yes Yes Yes
Sample Period First Crisis Second Crisis First Crisis Second Crisis First Crisis Second Crisis First Crisis Second Crisis
Observations 107,430 104,458 100,417 104,458 44,876 28,836 51,226 34,179
Included Stocks Financials Financials Financials Financials Banks Banks Financials Financials
Number of Stocks 845 864 768 864 348 221 412 292
31
Table VII. Short-Selling Bans and Vulnerability of Financial Institutions - Panel B: Effects on the Probability of Default
The dependent variable is the institution’s probability of default. Ban is a dummy variable that equals 1 if naked or covered short sales are forbidden and equals 0 otherwise in the first crisis. Ban is a dummy variable that equals 1 if naked short sales are forbidden and equals 0 otherwise in the second crisis. All regressions are estimated using daily data for financial stocks for the period June-December 2008 in first crisis and for the period May-November 2011 in the second crisis. Interaction is the product between the Ban dummy and a dummy variable that equals 1 if the degree of the financial institution vulnerability is above the median and equals 0 otherwise. We use four different measures of vulnerability: leverage in column (1) and (2), standardized systemic risk in columns (3) and (4), the negative of the Tier 1 Capital Ratio in columns (5) and (6), and the negative of the “stable funding ratio” (defined as the ratio of deposits plus equity to long-term assets) in columns (7) and (8). We estimate fixed-effects panel regressions with robust standard errors and report t-statistics in parenthesis. *** indicate significance at the 1% level. (1) (2) (3) (4) (5) (6) (7) (8) Constant 0.0017*** 0.0009*** 0.0018*** 0.0009*** 0.0019*** 0.0011*** 0.0019*** 0.0011***
(32.24) (41.26) (29.43) (39.35) (34.15) (48.22) (32.07) (39.90)
Ban 0.0006*** 0.0003*** 0.0010*** 0.0004*** 0.0009*** 0.0007*** 0.0016*** 0.0006***
(3.26) (11.47) (6.98) (10.26) (3.91) (8.51) (5.01) (8.89)
Ban × vulnerability 0.0007*** 0.0006*** 0.0004** 0.0003*** 0.0006*** 0.0001* 0.0012*** 0.0004***
(5.57) (7.08) (1.72) (3.32) (5.57) (1.92) (5.93) (8.09)
Vulnerability defined as: Leverage Leverage Systemic Risk Systemic Risk
Negative of Tier-1
Capital Ratio
Negative of Tier-1
Capital Ratio
Negative of Stable
Funding Ratio
Negative of Stable
Funding Ratio Stock-Level Fixed Effects Yes Yes Yes Yes Yes Yes Yes Yes
Sample Period First Crisis Second Crisis First Crisis Second Crisis First Crisis Second Crisis First Crisis Second Crisis
Observations 97,655 109,672 92394 96,685 50,600 30,360 57,451 35,897
Included Stocks Financials Financials Financials Financials Banks Banks Financials Financials
Number of Stocks 798 814 735 811 348 219 412 288
32
Table VIII. Bank Stability and Short-Selling Bans: 2SLS Estimates
The dependent variable is the stock return (column 1), the stock return volatility (column 2), and the 3-month probability of default (column 3) of banks. The Ban dummy variable equals one if covered short sales are forbidden, and is zero otherwise. The regression is estimated with 2SLS, using daily data for banks only, for the whole sample period, which includes both waves of short selling bans (Fall 2008 and Summer 2011). For each dependent variable, the Ban dummy variable is instrumented using two out of the following set of three instruments: the lagged monthly value-weighted stock returns of the financial sector of each country; the lagged monthly value-weighted stock return variance of the financial sector of each country; the lagged monthly sum of each country systematic risk (SRISK), standardized by the average country capitalization of the financial sector. The specification includes stock-level fixed effects. The number reported in parentheses below each coefficient estimate is its t-statistic, obtained with robust standard errors. The coefficient estimates marked with three asterisks are significantly different from zero at the 1% level, using robust standard errors and the relevant critical values (e.g., critical values for the Cragg-Donald F-statistic are from Stock and Yogo (2005)). The constant is included but not reported.
(1) (2) (3)
Dependent variable: Stock returns Volatility of stock returns Default probability
Covered Ban -0.0067*** 0.0335*** 0.0298***
(-2.64) (34.41) (31.26)
Market Return 0.7651***
(125.94)
Lagged Monthly Instruments Financial Sector Volatility and SRISK
Financial Sector Return and SRISK
Financial Sector Return and SRISK
Stock-Level Fixed Effects Yes Yes Yes
First-Stage Kleibergen-Paap F-test 976.20*** 615.084*** 534.31***
First-Stage Kleibergen-Paap LM statistic 3188.72*** 1,237.651*** 1072.21***
First-Stage Cragg-Donald Wald F-test 2,655.88*** 600.895*** 493.39***
Hansen J-Statistic (Robust Sargan Test) 3.06 4.72 2.37
χ2(1) p-value 0.08 0.03 0.12
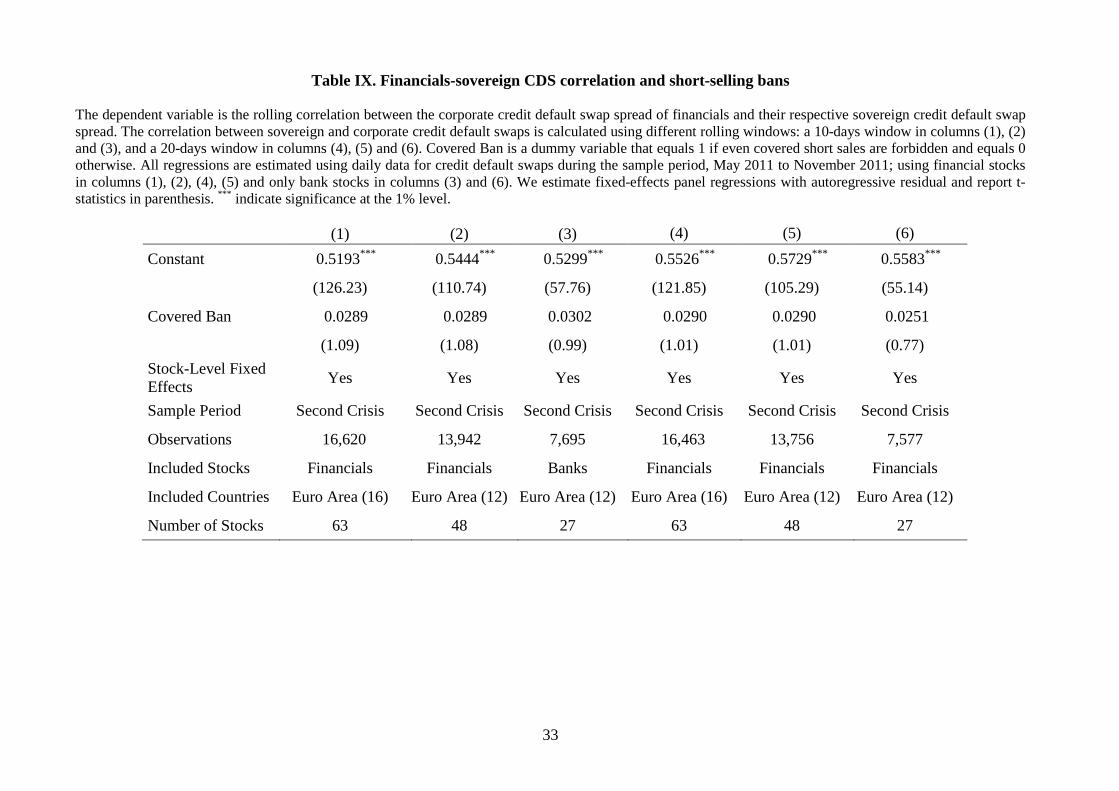
33
Table IX. Financials-sovereign CDS correlation and short-selling bans
The dependent variable is the rolling correlation between the corporate credit default swap spread of financials and their respective sovereign credit default swap spread. The correlation between sovereign and corporate credit default swaps is calculated using different rolling windows: a 10-days window in columns (1), (2) and (3), and a 20-days window in columns (4), (5) and (6). Covered Ban is a dummy variable that equals 1 if even covered short sales are forbidden and equals 0 otherwise. All regressions are estimated using daily data for credit default swaps during the sample period, May 2011 to November 2011; using financial stocks in columns (1), (2), (4), (5) and only bank stocks in columns (3) and (6). We estimate fixed-effects panel regressions with autoregressive residual and report t-statistics in parenthesis. *** indicate significance at the 1% level.
(1) (2) (3) (4) (5) (6) Constant 0.5193*** 0.5444*** 0.5299*** 0.5526*** 0.5729*** 0.5583***
(126.23) (110.74) (57.76) (121.85) (105.29) (55.14)
Covered Ban 0.0289 0.0289 0.0302 0.0290 0.0290 0.0251
(1.09) (1.08) (0.99) (1.01) (1.01) (0.77) Stock-Level Fixed Effects Yes Yes Yes Yes Yes Yes
Sample Period Second Crisis Second Crisis Second Crisis Second Crisis Second Crisis Second Crisis
Observations 16,620 13,942 7,695 16,463 13,756 7,577
Included Stocks Financials Financials Banks Financials Financials Financials
Included Countries Euro Area (16) Euro Area (12) Euro Area (12) Euro Area (16) Euro Area (12) Euro Area (12)
Number of Stocks 63 48 27 63 48 27
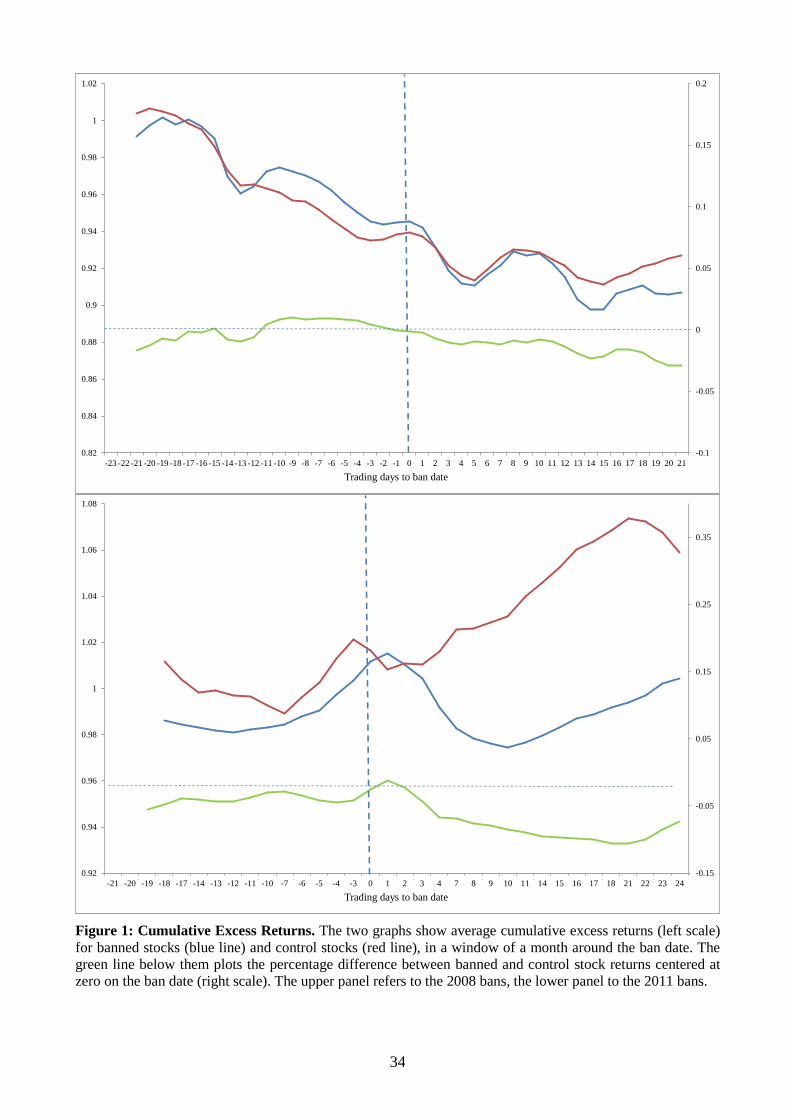
34
-0.1
-0.05
0
0.05
0.1
0.15
0.2
0.82
0.84
0.86
0.88
0.9
0.92
0.94
0.96
0.98
1
1.02
-23 -22 -21 -20 -19 -18 -17 -16 -15 -14 -13 -12 -11 -10 -9 -8 -7 -6 -5 -4 -3 -2 -1 0 1 2 3 4 5 6 7 8 9 10 11 12 13 14 15 16 17 18 19 20 21Trading days to ban date
-0.15
-0.05
0.05
0.15
0.25
0.35
0.92
0.94
0.96
0.98
1
1.02
1.04
1.06
1.08
-21 -20 -19 -18 -17 -14 -13 -12 -11 -10 -7 -6 -5 -4 -3 0 1 2 3 4 7 8 9 10 11 14 15 16 17 18 21 22 23 24Trading days to ban date
Figure 1: Cumulative Excess Returns. The two graphs show average cumulative excess returns (left scale) for banned stocks (blue line) and control stocks (red line), in a window of a month around the ban date. The green line below them plots the percentage difference between banned and control stock returns centered at zero on the ban date (right scale). The upper panel refers to the 2008 bans, the lower panel to the 2011 bans.
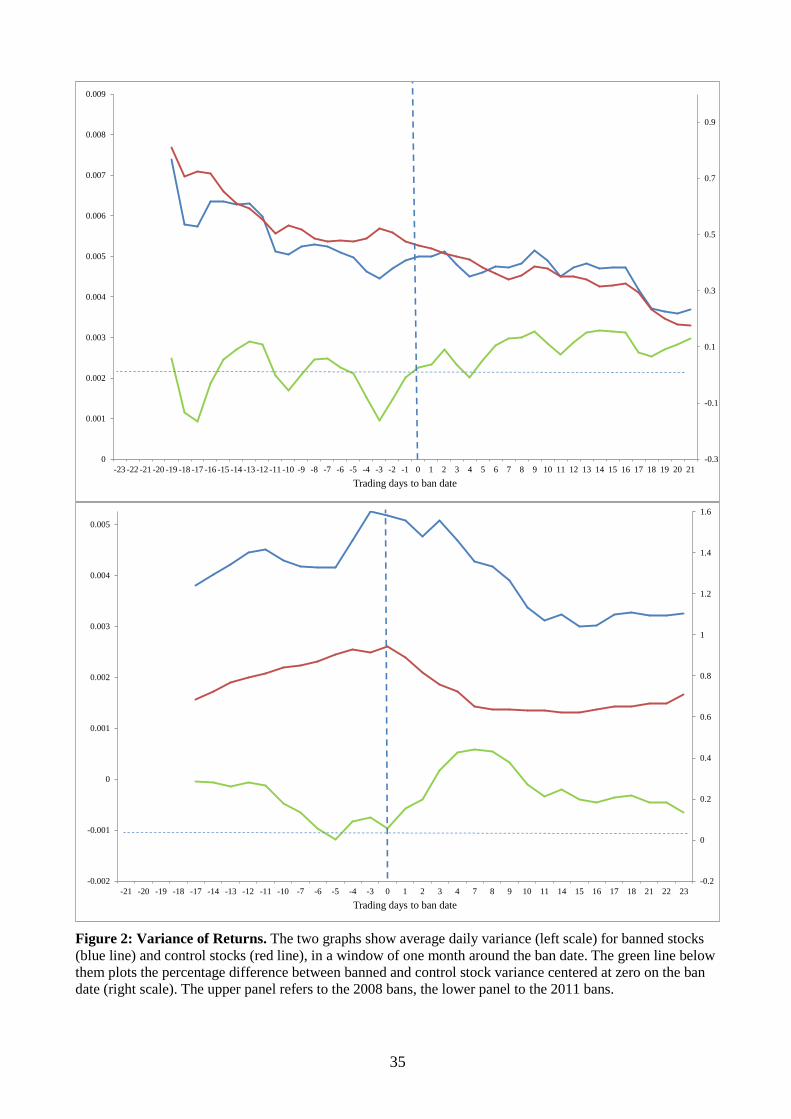
35
-0.3
-0.1
0.1
0.3
0.5
0.7
0.9
0
0.001
0.002
0.003
0.004
0.005
0.006
0.007
0.008
0.009
-23 -22 -21 -20 -19 -18 -17 -16 -15 -14 -13 -12 -11 -10 -9 -8 -7 -6 -5 -4 -3 -2 -1 0 1 2 3 4 5 6 7 8 9 10 11 12 13 14 15 16 17 18 19 20 21Trading days to ban date
-0.2
0
0.2
0.4
0.6
0.8
1
1.2
1.4
1.6
-0.002
-0.001
0
0.001
0.002
0.003
0.004
0.005
-21 -20 -19 -18 -17 -14 -13 -12 -11 -10 -7 -6 -5 -4 -3 0 1 2 3 4 7 8 9 10 11 14 15 16 17 18 21 22 23Trading days to ban date
Figure 2: Variance of Returns. The two graphs show average daily variance (left scale) for banned stocks (blue line) and control stocks (red line), in a window of one month around the ban date. The green line below them plots the percentage difference between banned and control stock variance centered at zero on the ban date (right scale). The upper panel refers to the 2008 bans, the lower panel to the 2011 bans.
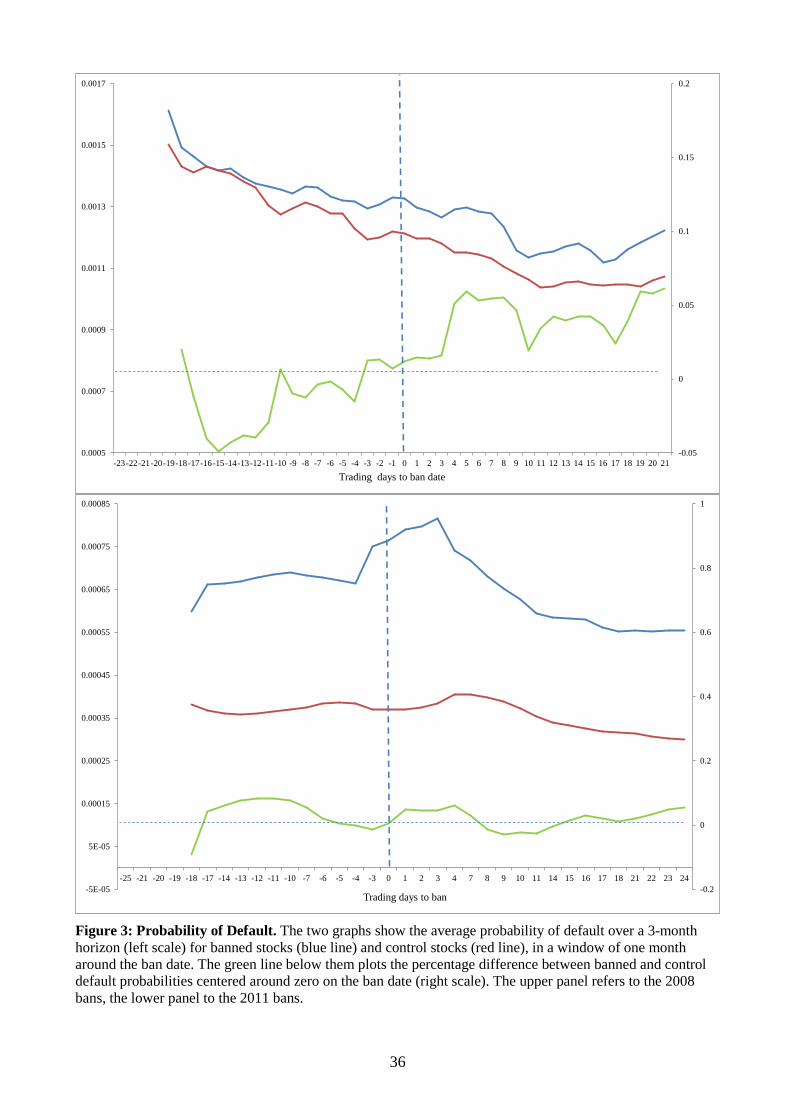
36
-0.05
0
0.05
0.1
0.15
0.2
0.0005
0.0007
0.0009
0.0011
0.0013
0.0015
0.0017
-23-22-21-20-19-18-17-16-15-14-13-12-11-10 -9 -8 -7 -6 -5 -4 -3 -2 -1 0 1 2 3 4 5 6 7 8 9 10 11 12 13 14 15 16 17 18 19 20 21Trading days to ban date
-0.2
0
0.2
0.4
0.6
0.8
1
-5E-05
5E-05
0.00015
0.00025
0.00035
0.00045
0.00055
0.00065
0.00075
0.00085
-25 -21 -20 -19 -18 -17 -14 -13 -12 -11 -10 -7 -6 -5 -4 -3 0 1 2 3 4 7 8 9 10 11 14 15 16 17 18 21 22 23 24
Trading days to ban
Figure 3: Probability of Default. The two graphs show the average probability of default over a 3-month horizon (left scale) for banned stocks (blue line) and control stocks (red line), in a window of one month around the ban date. The green line below them plots the percentage difference between banned and control default probabilities centered around zero on the ban date (right scale). The upper panel refers to the 2008 bans, the lower panel to the 2011 bans.