short-term debt and bank risk - columbia law...
TRANSCRIPT

Preliminary draft
Short-Term Debt and Bank Risk
Brian Dua and Darius Paliab
This draft: March 2015
Abstract
The extant literature has suggested that one of the main causes of the recent financial
crisis has been the excessive use of short-term debt by financial institutions. Using a large
sample of U.S. commercial banks we find that increases in repurchase agreements (repos) was
recognized by external capital markets to increase bank risk in the pre-crisis period. No such
effect is found for other forms of short-term debt such as commercial paper, brokered deposits
and demand deposits. The importance of repos to increasing bank risk is consistent with the
argument of Gorton and Metrick (2012a, b) who found a significant “run” in the repo market. In
the crisis, we find a negative relationship between repos and bank risk. This is because good
banks were able to continue funding their repos, whereas bad banks had to significantly decrease
their repo funding. Counter to the notion that liquid assets provided a buffer against shocks, we
find that banks’ were unable to reduce their risk either in the pre-crisis or crisis period.
Keywords: financial crisis, short-term debt, repurchase agreements
____________________________________ aAssistant Professor, California State University- East Bay, and bThomas A. Renyi Chair in Banking, Rutgers
Business School, and Senior Fellow, Center for Contract and Economic Organization, Columbia Law School,
respectively. All errors remain our responsibility. [email protected]; [email protected].
1
1. Introduction
Many authors describing the recent financial crisis have highlighted the important role
that short-term debt had in creating excessive bank risk (see, for example, Bernanke (2008),
Gorton (2008), Brunnermeier (2009), Shin (2009), and Krishnamurthy, (2010)). The early
theoretical literature has shown that short-term debt in the form of the demand deposit contract
can leave depositors vulnerable to runs (Bryant (1980), Diamond and Dybvig (1983), Allen and
Gale (1998), Rochet and Vives (2004) and Goldstein and Pauzner (2005)). The solution to the
bank run problem in many of these models is federal deposit insurance. More recently, He and
Xiong (2012a, 2012b) show that short-term debt instruments such as repurchase agreements
(“repos”) and commercial paper can exacerbate creditor’s incentives to run due to rollover risk.
Banks can be caught in a liquidity squeeze when they have to rollover ‘shadow’ short-term debt
instruments which have no federal deposit insurance.1 The demand for liquidity strained holdings
of liquid assets forces their liquidation at fire-sale prices. Acharya, Gale, and Yorulmazer (2011)
show that a market freeze can occur if rollover frequency is sufficiently high. Brunnermeier and
Oehmke (2012) study the conflict between long-term and short-term creditors and show that this
conflict can motivate all creditors to demand short-term debt. Acharya and Viswanathan (2011)
show that the extent to which financial firms face de-leveraging or fire sales is a function of their
reliance on short-term debt.
Using a comprehensive sample of 216 publicly traded of U.S. commercial banks for the
period 2002 through 2009, this paper empirically examines the relationship, if any, between
short-term funding and bank risk. Given that the crisis hit non-commercial investment banks
such as Lehman and Bear Stearns more severely, any result that we find is a lower bound on the
1 See Section 2 for a detailed description of repos, commercial paper, brokered deposits and the related theories on
short-term debt.

2
relationship between short-term debt and a financial institution’s risk. Specifically, this paper
empirically examines the following questions: (1) Did the external capital markets know before
the crisis that increases in short-term funding increased bank risk, or was it a unexpected shock?
(2) Which short-term debt instrument, repurchase agreements (repos), commercial paper,
demand deposits, or brokered deposits, increased bank risk in the pre-crisis period? One area of
the crisis which has not been explored is that of brokered deposits or “hot money.” This is among
the first studies to examine the relationship between short-term brokered deposits and bank risk.
(3) What happened to the relationship between bank risk and short-term debt during the crisis?
(4) Did insufficient liquidity contribute to higher bank risk?
We find the following results:
(1) We find that bank risk is higher when the fraction of debt (excluding demand
deposits) in repos is higher in the pre-crisis period. No significant relationship is found for
commercial paper, brokered deposits, demand deposits and liquidity. These results are robust to
including bank-level fixed effects to control for unobservable factors, quarterly dummy
variables, and standard errors corrected for clustering at the firm-level. The importance of repos
to increasing bank risk is consistent with the argument of Gorton and Metrick (2012a, b) who
found that a significant “run” in the repo market contributed to the financial crisis.
(2) When we examine the crisis we find that the impact of repos actually decreased bank
risk. This is because good banks (defined over the pre-crisis period) were able to continue
funding their repos at the same level in the crisis when compared to the pre-crisis period.
However bad banks (defined over the pre-crisis period) had to decrease funding their repos in the
crisis. This result holds whether bank quality in the pre-crisis period is proxied by Tobin’s Q

3
(defined as the sum of market value of equity and book value of liabilities divided by of assets)
or ROA (defined as the ratio of net income to assets).
(3) We find that holding more liquid assets did not allow banks’ to reduce their risk either
in the pre-crisis or crisis period. These results are counter to the notion that liquid assets, namely,
cash and marketable securities, provided a buffer against shocks.
(4) We examine if the change in repo funding from the pre-crisis to crisis periods is
correlated to bank stock returns during the crisis. Fahlenbrach, Prilmeier and Stulz (2012), find a
positive relation between bank performance in 1998 and the stock returns in the crisis. We use
their control variables and regression specification. We find a positive relationship between the
change in repo funding from the pre-crisis to crisis periods and stock returns in the crisis, while
controlling for their 1998 performance variable. This is consistent with the idea that good banks
were able to get repo funding during the crisis and had associated higher stock returns.
(5) Consistent with the above results, we find that the change in repo funding from the
pre-crisis to crisis period is weakly positively related to changes in bank performance during the
same periods.
The remainder of the paper is organized as follows. Section 2 describes the related
literature on short-term debt and rollover risk, whereas Section 3 describes the data and variables
used in the study. In Section 4 we present our empirical tests and results and in Section 5 our
conclusions.
2. Related Literature
In this section, we describe in more detail the related literature on short-term debt and
bank risk. Brunnermeier (2009) was the first to describe the inability for firms to refinance short-

4
term debt as rollover risk. Purnanandam (2011) showed that the originate-to-distribute business
model of banks along with asset securitization lead to the origination of poor-quality loans and
contributed to the housing market bubble. While it may be argued that asset securitization
products can reduce liquidity risk through the utilization of special purpose vehicles and
mortgage-backed securities, they were also used as collateral for short-term debt instruments
such as repos and commercial paper. Gennaioli, Shleifer, and Vishny (2012) argue that investors
and financial intermediaries neglected various risks associated with issuance of securitized assets
and in doing so created excessive supply of such products. When these risks are revealed, these
securities created freezes in the asset backed commercial paper and repo markets and investors
fly back to safety. Hanson, Shleifer, Stein, and Vishny (2014) demonstrate the fundamental
difference between traditional banking and shadow banking. They show that traditional banking
relies on combining stable funding on the liability side while holding relatively safe yet illiquid,
long-term loans and securities. On the other hand, shadow banking creates claims by allowing
investors an early exit option to seize assets and liquidate during downturns. This fundamental
difference in risk and funding structure leaves shadow institutions more prone to runs and fire-
sales.
A number of articles have corroborated the perils of rollover risk associated with short-
term debt financing which can lead to diminished debt capacity (Acharya, Gale, Yorulmazer
(2010)), preemptive running by creditors (He and Xiong (2012a)), and exacerbating the debt-
overhang problem (Diamond and He, (2010)). He and Xiong (2012b) show the presence of
certain forms of short-term debt, such as repos and commercial paper, amplify the conflicts
between debt and equity holders during distress.

5
2.1 Repurchase agreements
A sale and repurchase agreement (“repo”) is the sale of a financial asset to another party
subject to an agreement by the seller to repurchase the asset at a pre-specified date and price.
The market value of the securities purchased usually exceeds the value of the cash the borrower
receives, and the difference (generally expressed as a percentage) is called the “margin” and
measures the extent to which the loan is overcollateralized. The collateral used in repo
transactions includes government securities, federal agency securities, mortgage-backed
securities, asset-backed securities, money market instruments, and corporate debt or equity.
Gorton and Metrick (2012a) show that overreliance on repos and the subsequent run in
the repo market was a main cause for the recent financial crisis. Gorton and Metrick (2012b)
find that the significant run in the bi-lateral repo market was predominantly driven by the flight
of domestic and off-shore hedge funds, foreign financial institutions and other unregulated cash
pools. Krishnamurthy, Nagel, and Orlov (2014) utilize data for repos between nonbank lenders
and dealers banks and show that repos account for a small fraction of fraction of short-term
funding of securitized assets. They find that asset-backed commercial paper accounted for a
much larger magnitude of financing prior to the crisis and the contraction during the crisis. They
do find that the contraction in repos disproportionately affected a few dealer banks. Copeland,
Martin, and Walker (2014) find that the repo margins and funding amounts were stable during
the crisis for tri-party repos.
In the model of debt capacity developed by Acharya, Gale, Yorulmazer (2010), the
underlying assumption is that debt with a shorter term than the firm’s assets needs to be rolled
over more frequently. High rollover frequency associated with short-term debt can lead to
reduced debt capacity, which ultimately leads to a market freeze. Thus, the level of short-term

6
debt, measured by rollover frequency, is expected to be positively related to rollover risk. Since
a freeze in the market for repos is correlated with high repo haircuts, the authors show that repo
haircuts rise in a deteriorating economy due to high repo frequency. He and Xiong (2012a) show
that rollover frequency is a factor which motivates maturing creditors to run even when the firm
is still solvent.
2.2 Commercial paper
Commercial paper consists of short-term negotiable promissory notes with a maturity of
270 days or less. Our construction of commercial paper involves the total amount of commercial
paper borrowed by the BHC on the liabilities side of the balance sheet under “other borrowed
money.” Various other papers have examined asset-backed commercial paper (ABCP) issued by
conduits for financial holding companies (Kacperczyk and Schnabl, 2010). Acharya, Schnabl,
Suarez (2013) find that banks provide guarantees to conduit investors and argue that banks use
conduits for regulatory arbitrage. Covitz, Liang, and Suarez (2013) find substantial runs in the
ABCP market during the crisis using proprietary data from the Depository Trust and Clearing
Corporation to examine the prices, quantities and maturities of ABCP. In this study, we examine
BHC-level commercial paper as information at the conduit level is not available in our sample.
2.3 Brokered deposits
As defined in the Financial Institutions Reform, Recovery, and Enforcement Act
(FIRREA) of 1989, a brokered deposit is a deposit which is “obtained, directly or indirectly,
from or through the mediation or assistance of a deposit broker.” Deposit brokers are paid a
commission by depositors to seek the best certificate of deposit rates. Brokered deposits consist

7
of large denomination deposits (usually in lots of $100,000) and earn higher interest rates than
demand deposits due to economies of scale. Brokered deposits, together with other core deposits
such as demand deposits, negotiable orders of withdrawal (NOW) accounts, money market
deposit accounts, and time deposits, comprise of a bank’s deposit base.
Banks typically use brokered deposits to fuel growth; however, distressed banks will
exercise the option to raise money through brokers by offering higher rates. On the supply side,
yield-hungry brokered depositors generally chase the highest available returns and are not loyal
to any particular bank. To offset the higher cost of financing, banks must invest in higher yield
loans and thus, riskier assets. Thus, the level of brokered deposits reflects the willingness of
banks to take risk and signal ex-ante asset risk. Although many brokered deposits do not have a
penalty for early withdrawal, in the event of bank failure, it is more difficult to realize FDIC
insurance on these deposits. By comparison, demand deposits typically receive funds within
seven to 10 days while brokered deposits take 30 days to be refunded. Brokers must also provide
the burden of proof to reclaim the funds. Brokered deposits are a relatively expensive and
unstable form of financing and leaves financial institutions particularly vulnerable during periods
of uncertainty and downturns in the economy.
A few early studies focused on the role of brokered deposits in the late 1980s’ thrift
crisis. Goldberg and Hudgins (2002) found that failing thrifts were more active in using brokered
deposits than solvent thrifts. Cook and Spellman (1991) found that brokered deposits
significantly contributed to default risk. Regulatory measures from both the FIRREA and FDIC
Improvement Act attempted to limit the acceptance of brokered deposits to allow thrifts to meet
their capital adequacy guidelines. More recently, Cole and White (2011) find that higher levels
of brokered deposits had a positive effect on bank failure in the crisis year of 2009.
8
3. Data and Variables
3.1. Data
This study utilizes a list of Bank Holding Companies (BHCs) obtained from the Federal
Reserve Bank of New York’s CRSP-FRB link.2 Prior research in this field required hand-
matched data based on an institution’s name which is prone to error and only utilizes the largest
BHCs. This paper considers a broader set of firms from SIC codes 6000, 6011, 6020, 6021,
6022, 6025, 6030, 6035, 6036, 6211, 6331, 6411, 6710, 6711, and 6712. Daily stock returns and
market returns are obtained from the CRSP daily file. Balance sheet and income statement data
are obtained from the Consolidated Financial Statements for bank holding companies or the FR
Y-9C report. Data is obtained from 2002 to 2011.3 Banks with information available on both
CRSP and FR Y-9C are examined. The final sample consists of 216 BHCs. We do not examine
any investment banks.
Our analysis is conducted quarterly for the following reasons. First, the FR Y-9C data
contains quarterly reports. Hence, analysis performed on a quarterly basis fully captures the
effects of timing on the relationship between measures of short-term debt and bank risk. Second,
the behavior of variance has roots in the study of option markets which deal in nine-month
options. Third, using annual data will limit the number of data points available for analysis.
2 This link matches regulatory entity codes and CRSP PERMCOs for publicly traded banks and bank holding
companies. For more information, see http://www.newyorkfed.org/research/banking_research/datasets.html. 3 The year 2002 is chosen because it is the first year in which bank holding companies are required to report repo
positions in the FR Y-9C report.

9
3.2. Variables
We describe below the construction of each variable used in our regressions, and the
variable name from FR-Y 9C is given in [ ]. Table 1 summarizes the description of each
variable.
***Table 1***
3.2.1. Risk
Our dependent variable is bank risk, and is estimated from the daily stock returns of bank
holding companies (BHCs). Following much of the prior research on individual firm-level risk
(Christie, (1982) and (Campbell et. al, (2001)), we use daily returns adjusted for stock splits and
dividend reinvestment. For each BHC, risk is measured as the standard deviation of daily stock
returns. More specifically, it is estimated as the square root of the sum of squared log daily
returns in a given quarter.4 Note that risk is measured for the period (quarter) following balance
sheet measures.5 The use of logs of volatility versus levels of risk is consistent with the previous
literature. Duffee (1995) notes that the choice of logs will not affect the signs of the coefficient
estimates, rather it affects the inter-firm comparisons of estimated coefficients due to the cross-
sectional differences in average risk-return levels across firms. Thus, a given change in the log
volatility for a bank will correspond directly to a greater level change for firms with high
volatility than firms with low volatility. If a firm has fewer than 60 daily return observations in a
quarter, the standard deviation is set to missing (less than one-percent of observations).
4 Results using demeaned daily returns have no material effect since the square of the mean quarterly returns is
essentially zero. 5 The first FR Y-9C report of 2002 is on March 31. Thus, the corresponding risk measures are for the 2nd quarter of
2002.

10
3.2.2. Independent variables
Repurchase agreements: Our first short-term debt variable is net repos, and is defined as
securities sold under agreements to repurchase [BHCKB995], minus securities purchased under
agreements to resell [BHCKB989]. Thus, the measure of rollover frequency related to repos is
net repos scaled by total borrowings. Total borrowings is measured as the sum of net repurchase
agreements, federal funds purchased [BHDMB993], subordinated notes and debentures
[BHCK4062], and other borrowed money [BHCK3190].
Commercial paper: Our second short-term debt variable is the amount of commercial
paper borrowed by the bank [BHCK2309]. To be consistent with the above variable, we scale the
commercial paper variable by total borrowings.
Brokered deposits: Our third short-term debt variable is the amount of brokered deposits
borrowed by the bank. As this study focuses on short-term funding sources, we examine
brokered deposits maturing in less than one year [BHDMA243] scaled by total borrowings.
However, it should be noted that results remain similar when total brokered deposits scaled by
total borrowings is used.
Deposits: Banks that rely more on demand deposits might experience less risk than
banks that rely more on other forms of short-term financing.6 We proxy for this type of short-
term debt by including the ratio of total demand deposits [BHDM6631+BHDM6636] minus
brokered deposits to total assets.
Size: It seems reasonable that BHC’s of different sizes have different risks. To control
for this possibility, we proxy for bank size by the natural logarithm of bank assets [BHCK2170].
6 In fact, Flannery and James (1984b) document evidence that demand deposits have effective maturities which
resemble that of a longer-term security.

11
Size squared: To control for any nonmonotonicity in bank size, we also include the
natural logarithm of total assets squared.
Leverage: Banks which are more leveraged are more likely to experience a larger
variation in equity values given a shock to their asset value. We proxy for leverage by the ratio
of the book value of equity [BHCKG105] to assets. Note, therefore, that our proxy is inversely
related to leverage, and we expect it to be negatively related to risk.
Loans: We construct a variable to capture the risks associated with lending. It is defined
as the ratio of loans [BHCKB529] to assets.
Profitability: Banks which are more profitable may have either higher or lower risk. We
proxy for bank profitability by a bank’s return-on-assets variable, defined as the ratio of net
income [BHCK4340] to total assets. Return-on-assets is a better measure of profitability than
return-on-equity because it is not distorted by high equity multipliers common in this industry.
The higher the profitability ratio, the higher the returns for a bank, which implies lower volatility
of returns. Thus, this ratio is expected to vary negatively with risk.
Non-interest income: Stiroh (2006) and Brunnermeier, Dong, and Palia (2014) document
that bank holding companies shifted more and more into alternative revenue sources captured by
non-interest income. These activities include income from fiduciary activities, trading revenue,
service charges, fees and commissions, underwriting and advising services. Additionally,
DeYoung and Rice (2004) and Stiroh (2004) find evidence of higher volatility for banks with
greater non-interest income. Consistent with these studies we define our proxy variable as the
ratio of noninterest income to interest income [BHCK4079/BHCK4107].
Off balance sheet: We use this variable to measure the degree of a bank’s use of
derivative instruments. It is defined as the ratio of the sum of notional principal on foreign

12
exchange futures and notional principal on interest rate swaps [BHCK8694+BHCK3450] to total
assets. Similar to Demsetz and Strahan (1997), notional principal amounts are used to reflect the
scale of derivative activity, although they are representative of the marked-to-market values.
This ratio controls for how hedged a bank is against interest rate and foreign exchange risks and
is expected to have a positive coefficient.
Cash. Acharya and Skeie (2011) show that in addition to short-term leverage, the
illiquidity of assets is associated with higher rollover risk. Morris and Shin (2009) examine the
link between rollover risk and liquidity and show that increasing the level of liquid assets
reduces the threshold at which short-term creditors run. They provide a model which
incorporates the interaction between insolvency risk and illiquidity risk as a function of total
credit risk. Illiquidity risk is the probability of default due to a run when an institution would
have otherwise been solvent. A major determinant of illiquidity risk is the liquidity ratio,
defined as value of cash that can be realized in the short run relative to short run liabilities. A
shift to holding more cash increases the liquidity ratio and thus, increases the threshold at which
the short-term creditors choose to not rollover funding at the interim date. Bolton, Chen, and
Wang (2009) examine the role of cash reserve management as a tool for dynamic risk
management. Holmstrom and Tirole (2000) identify Treasury bonds and cash as the two main
buffers against shocks since they are instruments which a firm can quickly resell or pledge as
collateral at its true value when an institution is strapped for cash. Thus, our measure of liquidity
is the sum of cash [BHCK0081+BHCK0395] and Treasury securities [BHCK1287] scaled by
short-term debt (securities purchased under agreements to resell, commercial paper, and
brokered deposits maturing in less than 1 year).

13
Liquidity creation. Many theoretical papers (see for example, Bryant (1980), Diamond
and Dybvig (1983), Holmstrom and Tirole (1998) and Kashyap, Rajan, and Stein (2002)) argue
that banks create liquidity by financing relatively illiquid assets such as loans with relatively
liquid liabilities such as deposits. Allen and Gale (2004) suggest that a bank might have higher
losses due to fire sales experienced when facing high liquidity demands. Berger and Bouwman
(2009) define a cat fat measure to capture a bank’s liquidity creation ability. It involves
decomposing financial statement data to various components and assigning weights as follows:
[(1/2) * (illiquid assets + liquid liabilities + illiquid guarantees) – (1/2) (liquid assets + illiquid
liabilities + equity + liquid guarantees + liquid derivatives)] / (total assets). Various assets,
liabilities, equity, and off balance sheet items are classified as liquid, semi-liquid, and illiquid
based on ease, cost, and time for withdraw of funds from the bank as well as the ease, cost and
time to dispose of obligations to meet liquidity demands. Weights are assigned as +1/2, 0, or -
1/2 to the bank activities. See Berger and Bouwman (2009) for a comprehensive description of
the cat fat measure.
3.3. Summary statistics
Table 2 reports the summary statistics for the sample of over 8,000 BHC-quarter
observations from 2002 to 2009. We find that the average banks had a total log stock return
volatility for a quarter of -1.78 corresponding to an average quarterly standard deviation of
returns of 1.66%. We find similar median values, suggesting that the distribution for stock
returns is not skewed. We find that net repurchase agreements are 32% of total borrowing with a
median value of 20%. Commercial paper seems to be nonexistent for the median bank, and
brokered deposits are on average 7% of total borrowing. The average asset size is $2.6 billion,

14
average equity to assets is 10%, loans comprised of 65% of total assets, and net income is a little
under 1% of total assets reflecting the high degree of financial leverage. A bank holds on
average 2.8 times the amount of short-term debt in liquid assets.
***Table 2***
In Table 3, we provide the Pearson correlation coefficients for all our variables. We find
that noninterest income and leverage has the highest coefficient of 0.82, followed by a
correlation coefficient of 0.61 between loans and deposits. However when we compute the
condition index of Belsley, et. al (1980), we find it lower than 10, suggesting no evidence of
multicollinearity in our regression specification. In order to further ensure the robustness of our
results, we drop the variables, non-interest income and loans, and found no significant change in
our results.
***Table 3***
4. Tests and Results
We begin by examining the impact of short-term debt and liquidity measures on bank risk
in the pre-crisis period of 2002 through 2007Q2. In this regression, we estimate a BHC-level
fixed effects model so as to control for time-invariant factors such as bank culture and market
power. We also include quarterly dummy variables in order to capture any macroeconomic and
financial factors that are common to all BHCs in the sample. In Table 4, we present the results
of such a regression and do not report the fixed effects or the quarterly dummies. Standard errors
are clustered at the BHC level to control for dependence of standard errors across BHCs.
***Table 4***
In column (1) we examine the impact of repurchases agreements (repos) on total bank
risk while including the various control variables. We find that increasing repos increased bank
15
risk at the five-percent level of statistical significance. A one standard deviation increase in repos
increases bank risk by 33 basis points. This result suggests that external capital markets
recognized in the pre-crisis period that increases in repos contributed to higher bank risk. A
higher increase in demand deposits does not change bank risk. We also find that bank size is
nonmontonically related to bank risk. Specifically, bank size is positively related to bank risk but
the relationship turns negative when bank size is over 14.22, corresponding to about a $1.5billion
asset size. Given that our proxy variable is bank equity, we find that increases in leverage
increases bank risk. We also find that banks that increase their loan-to-asset ratio decrease their
risk. We also find that banks that increased their diversification activities into noninterest income
activities such as trust income, investment and trading income reduced their bank risk. We find
no statistically significant relationship between a banks derivative activity and risk, as well as
with its liquidity creation ability. Finally, we find that that banks that increased their holdings of
liquid assets decreased their risk.
In columns (2) and (3) we examine the impact of the other two short-term debt measures
on bank risk while including the various control variables. We find that commercial paper and
brokered deposits are not statistically significantly related to bank risk. The results on the control
variables that we found in column (1) generally remain in these regressions. In column (4) we
include all the short-term debt variables together. We find that repos continue to be negatively
and statistically significantly related to bank risk, whereas commercial paper, demand and
brokered deposits continue to be statistically insignificantly related to bank risk. The results on
the control variables do not generally change, except that cash is now statistically insignificant.
This result is consistent with arguments of Diamond and He (2010) who argue that extra cash

16
will not resolve the short-term debt overhang problem because managers have an incentive to
divert the cash rather than to hold it until a later period.
In summary, we find that bank risk is higher when the fraction of debt (excluding
deposits) in repos is higher in the pre-crisis period. No significant relationship is found for
commercial paper, brokered deposits, and demand deposits. These results are robust to including
bank-level fixed effects to control for unobservable factors, quarterly dummy variables, standard
errors corrected for clustering at the firm-level, and risk being defined as idiosyncratic risk. The
importance of repos to increasing bank risk is consistent with the argument of Gorton and
Metrick (2012a,b ) who found a significant “run” in the repo market.
We now turn our attention to the crisis period, by expanding our sample period from
2002 through 2009. Consistent with Fahlenbrach, Prilmeier and Stulz (2012; referred to FPZ),
we use two definitions of the crisis period. The first is defined as the period 2007Q3 through
2008Q4. This is the period which FPZ focusses their analysis on because of the substantial
uncertainty caused by the possibility of bank nationalization in 2009. The second definition of
the crisis includes 2009, and is therefore defined as 2007Q3 through 2009Q4. We calculate the
interaction of the crisis periods with measures of short-term debt, and re-estimate the regressions
of column (5) of Table 4. We present these results in Table (5) while not reporting the
regression coefficients and their associated t-statistics on the control variables (for brevity).
***Table 4***
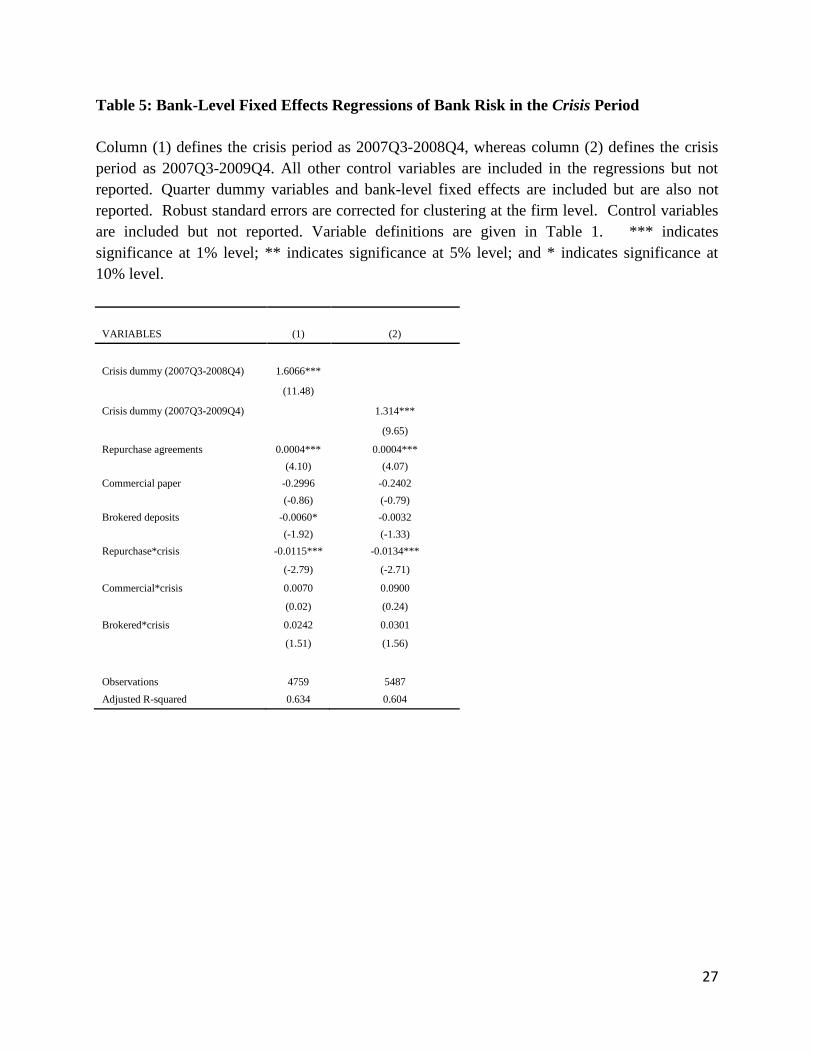
As expected we find that a bank’s volatility is higher in the crisis period when compared
to the pre-crisis period. Consistent with the results of Table (4), we find that repos increased
bank risk in the pre-crisis period and there was a statistically insignificant relationship between
commercial paper, brokered deposits, and bank risk. When we examine the impact of the crisis,
17
we find that increasing repos decreased bank risk. Consistent with the results for the pre-crisis
period, we find that commercial paper and brokered deposits was statistically insignificantly
related to bank risk during the crisis.
***Table 5***
We further investigate what happened to repo funding in the crisis using different tests.
Specifically we investigate why there was a differential effects of repos on bank risk when we
compare the pre-crisis period to the crisis period. First we split our sample of banks by quality in
to “good” banks and “bad” banks in the six quarters prior to the crisis (2006Q1 through
2007Q2). We proxy bank quality by Tobin’s Q (defined as the sum of market value of equity and
book value of liabilities divided by of assets) or ROA (defined as the ratio of net income to
assets). “Good” quality banks are in the fourth quartile of either Tobin’s Q or ROA, and “bad”
quality banks are in the first quartile. We then examine the change in the mean repo funding
between the pre-crisis and crisis periods for these two subsamples of banks. Table 6 presents the
results. For both definitions of bank quality (Tobin’s Q and ROA), we find a statistically
significant decrease in mean repo funding in the crisis when compared to the pre-crisis for “bad”
quality banks. No such result is found for “good” quality banks. These results help explain the
negative relationship between repo funding and bank risk in the crisis, as “good” banks were able
to continue funding their repos whereas “bad” banks had to significantly decrease their repo
funding.
***Table 6***
We hence examine if the change in repo funding from the pre-crisis to crisis periods is
correlated to bank stock returns during the crisis. Fahlenbrach, Prilmeier and Stulz (2012), find a
positive relation between bank performance in 1998 and the stock returns in the crisis. We use

18
their control variables and regression specification. We find a positive relationship between the
change in repo funding from the pre-crisis to crisis periods and stock returns in the crisis, while
controlling for their 1998 performance variable. This is consistent with the idea that good banks
were able to get repo funding during the crisis and had associated higher stock returns.
***Table 7***
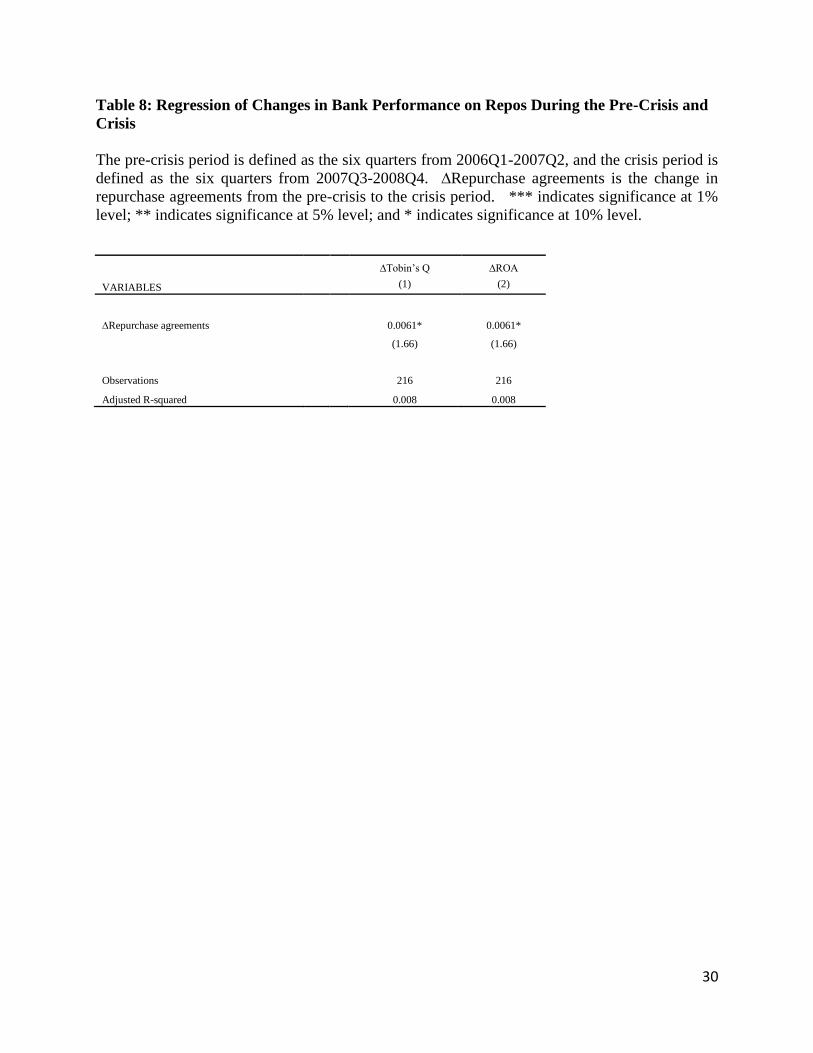
Finally, we examine what happened to bank performance from the pre-crisis to crisis
periods when compared to the change in repo funding during the same periods. The results of
this analysis is given in Table 8. Consistent with the above results, we find that the change in
repo funding from the pre-crisis to crisis period is positively related to changes in bank
performance during the same periods. But this result is statistically significant only at the 10-
percent level of significance.
***Table 8***
5. Conclusions
This paper is motivated by the financial crisis of 2007 as well as the number of recent
models of rollover risk that arises from banks’ using short-term debt. Using a large sample of
U.S. commercial banks for the period 2002 through 2009, we find that increases in repurchase
agreements (repos) was recognized by external capital markets to increase bank risk in the pre-
crisis period of 2002 through 2007Q2. No such effect is found for other forms of short-term debt
such as commercial paper, brokered and demand deposits. The importance of repos to increasing
bank risk is consistent with the argument of Gorton and Metrick (2012a, b) who found a
significant “run” in the repo market. In the crisis, we find a negative relationship between repos
and bank risk. This is because good banks were able to continue funding their repos, whereas bad

19
banks had to significantly decrease their repo funding. We also find that banks’ were unable to
reduce their risk either in the pre-crisis or crisis period by using their available liquidity. Finally,
we find that that good banks that were able to get repo funding during the crisis had better
performance. Given that we only examine commercial banks and the crisis hit the non-
commercial investment banks such as Lehman and Bear Stearns more severely, any result that
we find is a lower bound on repo funding and bank risk.
Future research might examine the role of asset backed commercial paper in precipitating
bank risk and whether corporate governance mechanisms such as managerial incentive pay
helped work in conjunction with repo funding to increase risk.

20
References
Acharya, V., D. Gale, and T. Yorulmazer, 2010. Rollover risk and market freezes, Journal of
Finance 66, 1177-1209.
Acharya, V., P. Schnabl, and G. Suarez, 2010. Securitization without risk transfer, Journal of
Financial Economics 107, 515-536.
Acharya, V. and D. Skeie, 2011. A model of liquidity hoarding and term premia in inter-bank
markets, Federal Reserve Bank of New York Staff Reports, no. 498.
Acharya, V., S. Viswanathan, 2011. Leverage, moral hazard, and liquidity, Journal of Finance
66, 99-138.
Allen F. and D. Gale, 1998. Optimal financial crises. Journal of Finance 53, 1245-1284.
Allen F. and D. Gale, 2004. Financial intermediaries and markets, Econometrica 72, 1023-1061.
Belsley, D., Kuh, E. and R. Welsch, 1980. Regression diagnostics: Identifying influential data
and sources of collinearity. New York: John Wiley & Sons.
Berger, A. and C. Bouwman, 2009. Bank liquidity creation, Review of Financial Studies 22,
3779-3837.
Bernanke, B., 2009. Liquidity provision by the Federal Reserve. Speech at the Risk Transfer
Mechanisms and Financial Stability Workshop, Basel, Switzerland, May 29.
Bolton, P., H. Chen, and N. Wang, 2011. A unified theory of Tobin’s q, corporate investment,
financing, and risk management, Journal of Finance 66, 1545-1578.
Brunnermeier, M., 2009. Deciphering the liquidity and credit crunch 2007-08, Journal of
Economic Perspectives 23, 77-100.
Brunnermeier, M. and L. Pedersen, 2009. Market liquidity and funding liquidity, Review of
Financial Studies 22, 2201-2238.
Brunnermeier, M. and M. Oehmke, 2013. The maturity rat race, Journal of Finance 68, 483-521.
Brunnermeier, M., G. Dong, and D. Palia, 2014. Banks’ non-interest income and systemic risk,
Working paper, Princeton University.
Bryant, J., 1980. A model of reserves, bank runs, and deposit insurance, Journal of Banking and
Finance 4, 335-344.
Campbell, J., M. Lettau, B. Malkiel, and Y. Xu, 2001. Have individual stocks become more
volatile? An empirical exploration of idiosyncratic risk, Journal of Finance 56, 1-43.

21
Christie, A., 1982. The stochastic behavior of common stock variances, Journal of Financial
Economics 10, 407-432.
Cole, R. and L. White, 2011. Déjà vu all over again: The causes of U.S. commercial bank
failures this time around, Journal of Financial Services Research 42, 5-29.
Cook, D. and L. Spellman, 1991. Federal financial guarantees and the occasional market pricing
of default risk: Evidence from insured deposits, Journal of Banking and Finance 15, 1113-1130.
Copeland, A., A. Martin, and M. Walker, 2014. Repo runs: Evidence from the tri-party repo
market, Journal of Finance 69, 2343-2380.
Covitz, D., N. Liang, and G. Suarez, 2013. The evolution of a financial crisis: Collapse of the
asset-backed commercial paper market, Journal of Finance 68, 815-848.
Demsetz, R. and P. Strahan, 1997. Diversification, size, and risk and bank holding companies,
Journal of Money, Credit and Banking 29, 300-313.
DeYoung, R. and T. Rice, 2004. Noninterest income and financial performance at U.S.
commercial banks, Financial Review 39, 101-127.
Diamond, D. and P. Dybvig, 1983. Bank runs, deposit insurance, and liquidity, Journal of
Political Economy 91, 401-419.
Diamond, D. and Z. He, 2014. A theory of debt maturity: The long and short of debt overhang,
Journal of Finance 69, 719-762.
Duffee, G., 1995. Stock returns and volatility: A firm-level analysis, Journal of Financial
Economics 37, 399-420.
Fahlenbrach, R., R. Prilmeier, and R. Stulz, 2012. This time is the same: Using bank
performance in 1998 to explain bank performance during the recent financial crisis, Journal of
Finance 67, 2139-2185.
Gennaioli, N., A. Shleifer, and R. Vishny, 2012. Neglected risks, financial innovation, and
financial fragility, Journal of Financial Economics 104, 452-468.
Goldberg, L. and S. Hudgins, 2002. Depositor discipline and changing strategies for regulating
thrift institutions, Journal of Financial Economics 63, 263-274.
Goldstein, I. and A. Pauzner, 2005. Demand-deposit contracts and the probability of bank runs,
Journal of Finance 60, 1293-1327.
Gorton, G., 2009. The subprime panic, European Financial Management 15, 10-46.

22
Gorton, G. and A. Metrick, 2012a. Securitized banking and the run on repo, Journal of Financial
Economics 104, 425-451.
Gorton, G. and A. Metrick, 2012b. Who ran on repo, Working paper, Yale University.
Hanson, S, A. Shleifer, J. Stein, and R. Vishny, 2014. Banks as patient fixed-income investors,
Working paper, Harvard University.
He, Z. and W. Xiong, 2012a. Dynamic debt runs, Review of Financial Studies 25, 1799-1843.
He, Z. and W. Xiong, 2012b. Rollover risk and credit risk, Journal of Finance 67, 391-430.
Holmstrom, B. and J. Tirole, 1998. Public and private supply of liquidity, Journal of Political
Economy 106, 1-40.
Holmstrom, B. and J. Tirole, 2000. Liquidity and risk management, Journal of Money, Credit,
and Banking 32, 295-319
Kacperczyk, M. and P. Schnabl, 2010. When safe proved risky: Commercial paper during the
financial crisis of 2007-2009, Journal of Economic Perspectives 24, 29-50.
Kashyap, A., R. Rajan and J. Stein, 2002. Banks as liquidity providers: An explanation for the
coexistence of lending and deposit-taking. Journal of Finance 57, 33-73.
Krishnamurthy, A., 2010. How debt markets have malfunctioned in the crisis, Journal of
Economic Perspectives 24, 3-28.
Krishnamurthy, A., S. Nagel, and D. Orlov, 2014. Sizing up repo, Journal of Finance 69, 2381-
2417.
Morris, S. and H. Shin, 2009. Illiquidity component of credit risk, Working paper, Princeton
University.
Purnanandam, A., 2011. Originate-to-distribute model and the subprime mortgage crisis,
Review of Financial Studies 24, 1881-1915.
Rochet, J. and X. Vives, 2004. Coordination failures and the lender of last resort: Was Bagehot
right after all?, Journal of European Economic Association 2, 1116-1147.
Shin, H., 2009. Securitisation and financial stability, The Economic Journal 119, 309-332.
Stiroh, K., 2004. Diversification in banking: Is noninterest income the answer?, Journal of
Money, Credit and Banking 36, 853-882.
Stiroh, K., 2006. New evidence on the determinants of bank risk, Journal of Financial Services
Research 30, 237-263.

23
Table 1: Variable definitions.
This table reports the variable definitions for the variables used in the study.
Variable Definitions
Risk
Repurchase agreements
Commercial paper
Brokered deposits
Deposits
Size
Size squared
Leverage
Loans
Profitability
Noninterest income
Off balance sheet
Cash
Liquidity creation
Square root of the sum of squared log daily returns.
Net repurchase agreements divided by total borrowings. Net repurchase agreements is
measured as securities sold under agreements to repurchase minus securities purchased
under agreements to resell. Total borrowings is measured as the sum of net repurchase
agreements, federal funds purchased, subordinated notes and debentures, and other
borrowed money.
Commercial paper divided by total borrowings.
Brokered deposits maturing in less than one year divided by total borrowings.
Demand deposits divided by total assets.
Common logarithm of total assets.
Common logarithm of total assets squared.
Total equity divided by total assets.
Total loans divided by total assets.
Net income divided by total assets.
Noninterest income divided by interest income.
Sum of notional principal on foreign exchange futures and notional principal on interest
rate swaps divided by total assets.
Sum of cash and Treasury securities divided by short-term debt.
Berger and Bouwman’s (2009) measure of liquidity creation: [(1/2) * (illiquid assets +
liquid liabilities + illiquid guarantees) – (1/2) (liquid assets + illiquid liabilities + equity +
liquid guarantees + liquid derivatives)] / (total assets)

24
Table 2: Summary statistics.
This table reports the summary statistics for the sample of 216 U.S. banks from 2002-2009. All
variables are winsorized using the median threshold plus/minus five times the interquartile
range.7
Variable
Risk
Repurchase agreements
Commercial paper
Brokered deposits
Deposits
Size
Size squared
Leverage
Loans
Profitability
Noninterest income
Off balance sheet
Cash
Liquidity creation
Obs.
8,419
8,393
8,393
8,389
8,424
8,424
8,424
8,424
8,424
8,424
8,424
8,424
6,731
8,424
Mean
-1.78
0.32
0.00
0.07
0.75
14.78
220.21
0.10
0.65
0.01
0.25
0.03
2.80
0.18
Median
-1.85
0.20
0.00
0.00
0.76
14.46
208.99
0.09
0.66
0.00
0.20
0.00
1.05
0.20
Std. Dev.
0.57
0.29
0.01
0.15
0.09
1.37
42.36
0.05
0.11
0.00
0.17
0.06
4.52
0.14
7 Results remain quantitatively similar when all variables are winsorized at 99%.

25
Table 3: Correlation matrix
Pearson correlations. Definitions of variables are given in Table 1.
Risk
Repurchase
Agreements
Commercial
Paper
Brokered
deposits Deposits Size
Size
Squared Leverage Loans Profitability
Noninterest
income
Off balance
sheet
Liquidity
creation
Risk
Repurchase agreements
Commercial paper
Brokered deposits
Deposits
Size
Size squared
Leverage
Loans
Profitability
Noninterest income
Off balance sheet
Cash
Liquidity creation
-0.00
-0.07
0.30
0.05
-0.04
-0.04
-0.01
0.12
-0.29
-0.02
-0.02
0.03
0.00
-0.01
0.02
0.02
-0.02
-0.02
-0.00
-0.00
-0.01
-0.00
-0.01
-0.00
0.00
-0.09
-0.49
0.53
0.55
0.14
-0.33
0.13
0.18
0.42
-0.06
-0.33
0.15
-0.06
-0.06
-0.03
0.23
-0.24
-0.03
-0.04
0.06
0.06
-0.56
-0.57
-0.28
0.61
-0.25
-0.37
-0.35
0.17
0.64
1.00
0.06
-0.32
0.05
0.09
0.45
-0.04
-0.33
0.05
-0.33
0.05
0.08
0.49
-0.04
-0.36
-0.28
0.55
0.82
-0.04
0.05
-0.15
-0.22
-0.34
-0.24
0.05
0.66
0.50
-0.01
-0.04
-0.09
0.01
0.05
-0.21
-0.03
-0.33
0.08

26
Table 4: Bank-Level Fixed Effects Regressions of Bank Risk in the Pre-Crisis Period
Sample of 216 U.S. banks in the pre-crisis period of 2002 through 2007Q2. Quarter dummy
variables and bank-level fixed effects are included but not reported. Robust standard errors are
corrected for clustering at the firm level. Variable definitions are given in Table 1. ***
indicates significance at 1% level; ** indicates significance at 5% level; and * indicates
significance at 10% level.
VARIABLES (1) (2) (3) (4)
Repurchase agreements 0.0002***
0.0003***
(3.14)
(4.87)
Commercial paper
-0.3274
-0.2860
(-1.12)
(-0.90)
Brokered deposits
-0.0074 -0.0064
(-1.32) (-1.42)
Deposits -0.0684 -0.0758 -0.0536 0.1405
(-0.30) (-0.33) (-0.24) (0.59)
Size 0.9158*** 0.9240*** 0.8808*** 1.0542***
(3.66) (3.67) (3.56) (4.09)
Size squared -0.0322*** -0.0325*** -0.0311*** -0.0358***
(-3.81) (-3.83) (-3.72) (-4.16)
Leverage -1.3730* -1.3492* -1.3714* -0.5494
(-1.86) (-1.82) (-1.86) (-0.67)
Loans -0.3924* -0.3975** -0.4068** -0.2413
(-1.97) (-1.99) (-2.05) (-1.09)
Profitability -0.2783 -0.0379 -0.2283 1.0863
(-0.17) (-0.02) (-0.14) (0.65)
Noninterest income -0.0202*** -0.0223*** -0.0200*** -0.0191***
(-4.33) (-4.30) (-4.33) (-3.29)
Off balance sheet -0.0331 -0.0284 -0.0412 -0.0395
(-1.00) (-0.88) (-1.34) (-1.21)
Cash -0.0000** -0.0000* -0.0000* -0.0000
(-2.04) (-1.77) (-1.71) (-1.46)
Liquidity creation 0.0294 0.0383 0.0188 0.0159
(0.55) (0.76) (0.37) (0.33)
Observations 3,670 3,670 3,666 3,666
Adjusted R-squared 0.494 0.494 0.495 0.523
27
Table 5: Bank-Level Fixed Effects Regressions of Bank Risk in the Crisis Period
Column (1) defines the crisis period as 2007Q3-2008Q4, whereas column (2) defines the crisis
period as 2007Q3-2009Q4. All other control variables are included in the regressions but not
reported. Quarter dummy variables and bank-level fixed effects are included but are also not
reported. Robust standard errors are corrected for clustering at the firm level. Control variables
are included but not reported. Variable definitions are given in Table 1. *** indicates
significance at 1% level; ** indicates significance at 5% level; and * indicates significance at
10% level.
VARIABLES (1) (2)
Crisis dummy (2007Q3-2008Q4) 1.6066***
(11.48)
Crisis dummy (2007Q3-2009Q4)
1.314***
(9.65)
Repurchase agreements 0.0004*** 0.0004***
(4.10) (4.07)
Commercial paper -0.2996 -0.2402
(-0.86) (-0.79)
Brokered deposits -0.0060* -0.0032
(-1.92) (-1.33)
Repurchase*crisis -0.0115*** -0.0134***
(-2.79) (-2.71)
Commercial*crisis 0.0070 0.0900
(0.02) (0.24)
Brokered*crisis 0.0242 0.0301
(1.51) (1.56)
Observations 4759 5487
Adjusted R-squared 0.634 0.604

28
Table 6: Bank Performance and Repos during the Pre-Crisis and Crisis
The pre-crisis period is defined as the six quarters from 2006Q1-2007Q2, and the crisis period is
defined as the six quarters from 2007Q3-2008Q4. Bank performance is measured using Tobin’s
Q (defined as the sum of market value of equity and book value of liabilities divided by of
assets) or ROA (defined as the ratio of net income to assets) in the pre-crisis period. Mean repos
is defined as the total net repurchase agreements divided by the average borrowings over six
quarters. ** indicates significance at 5% level; and * indicates significance at 10% level.
Panel A: Tobin's Q and Mean Repos
Pre-crisis Crisis Difference
Tobin's Q Quartile 1: 1.469 1.031 -1.79*
Tobin's Q Quartile 4: 1.719 1.731 0.03
Panel B: ROA and Mean Repos
Pre-crisis Crisis Difference
ROA Quartile 1: 1.594 0.942 -2.23**
ROA Quartile 4: 1.454 1.83 1.1

29
Table 7: Regressions of Stock Returns in Crisis on Repos and Other variables Before
Crisis
This table reports the cross-sectional regressions of buy-and-hold returns during the financial
crisis of 2007 (2007Q3 through 2008Q4) on bank performance during the crisis of 1998, firm
characteristics, and repurchase agreements. B2M is the book-to-market ratio, Leverage is the
ratio of leverage to assets, and Size is the natural logarithm of assets. ∆Repurchase agreements
is the change in repurchase agreements from the pre-crisis to the crisis period. Stock returns in
1998 is the Fahlenbrach, Prilmeier and Stulz (2012; FPZ) variable of bank performance. **
indicates significance at 5% level; and * indicates significance at 10% level.
VARIABLES (otherwise all in 2006) (1) (2)
Stock returns in 1998 -0.0720 -0.0673
(-0.39) (-0.36)
B2M -0.5847** -0.5854**
(-2.42) (-2.39)
Leverage 0.0123 0.0131
(0.70) (0.74)
Size 0.0104 0.0087
(0.61) (0.51)
Stock returns in 1998 (FPZ variable) 0.3850
(1.54)
Worst quartile of FPZ variable
-0.0944
(-1.24)
2nd worst quartile of FPZ variable
-0.0908
(-1.20)
3rd worst quartile of FPZ variable
-0.0636
(-0.84)
∆Repurchase agreement 0.0333** 0.0340**
(2.03) (2.05)
Observations 173 173
Adjusted R-squared 0.060 0.046
30
Table 8: Regression of Changes in Bank Performance on Repos During the Pre-Crisis and
Crisis
The pre-crisis period is defined as the six quarters from 2006Q1-2007Q2, and the crisis period is
defined as the six quarters from 2007Q3-2008Q4. ∆Repurchase agreements is the change in
repurchase agreements from the pre-crisis to the crisis period. *** indicates significance at 1%
level; ** indicates significance at 5% level; and * indicates significance at 10% level.
∆Tobin’s Q ∆ROA
VARIABLES (1) (2)
∆Repurchase agreements 0.0061* 0.0061*
(1.66) (1.66)
Observations 216 216
Adjusted R-squared 0.008 0.008