short-term variation in air quality associated with
TRANSCRIPT
1
Short-term variation in air quality associated
with firework event: A case study
KHAIWAL RAVINDRA *, SUMAN MOR and C.P. KAUSHIK
Department of Environmental Science and Engineering, Guru Jambheshwar
University, Hisar-125001 (India).
Abstract:
The effect of fireworks on the air quality was assessed from the ambient
concentrations of various air pollutants (SO2, NO2, PM10 and TSP) during Diwali
festival in Hisar city (India), in November 1999. The extensive use of fireworks was
found to be related with short-term variation in air quality. During the festival the
concentration of SO2 was observed to be increased ~10 - fold at few sites, whereas the
concentrations of NO2, PM10 and TSP increased 2-3 times, compared to the data
collected on a typical winter day in December 1999. The maximum NO2 concentration
was observed a day after the festival. The diurnal pattern of the above pollutants
showed a slight increase in the night. The levels of these pollutants observed during
Diwali were found to be moderately high, which can be associated with serious health
impacts.
Key words: Air pollution, Diwali Festival, fireworks, SO2, NO2, PM10, TSP.
*Corresponding Author: Present Address: Ravindra, Micro and Trace Analysis
Center, Department of Chemistry, University of Antwerp, Universiteitsplein 1, B-2610,
Antwerp, Belgium. e-mail: [email protected] or [email protected]
2
Introduction:
Diwali, or Deepawali, is a festival of “rows of light”, which is celebrated every year
during October/November in India. Celebrating with the illumination and fireworks brings
gaiety, joy and festivity. Fireworks contains, chemical such as arsenic, sulphur, manganese,
sodium oxalate, aluminium and iron dust powder, potassium perchlorate, strontium nitrate,
barium nitrate and charcoal1. Burning of fireworks release pollutants, like sulphur dioxide (SO2),
carbon dioxide (CO2), carbon monoxide (CO), suspended particles (including particles below 10
m in diameter, i.e. PM10) and several metals like aluminium, manganese and cadmium, etc.,
which are associated with serious health hazards2-4
. Additionally, firecrackers often result in
serious accidents and lethal injuries5.
High concentrations of Mn and Cr have been reported in the scalp hair of manufacturers
of fireworks6. Firework related trace elements have also been found in blood and urine of victims
of firework disasters7. Carranza et al.
8 have also reported significant increase in Mg and Al in
aerosol particles related with fireworks. Fleischer et al.9 reported that remains of fireworks
contained toxic equivalent quantity (TEQ) of octachlorinated dioxins and furans up to 142 ng/kg,
as well as hexachlorobenzene in the range of 0.05 to 1400 mg/kg. In Oxford (England), an
increase in dioxin and furan concentrations (TEQ) by a factor of four occurred during the period
of bonfire night, suggesting that bonfire and /or fireworks can be a significant source of trace
organic pollutants10
. The complex nature of particulate with trace metals and organic compounds
possess more threat to human health according to a recent review11
. The use of coloured
fireworks generates ozone at the ground level, which is a strong and harmful oxidizing agent12
.
The use of coloured sparklers by people, mostly children at ground level, put them at high risk of
inhaling the emitted pollutants.
3
Excess emergency hospital admissions have been reported during Diwali festival related
to burn hazards and increased asthma attacks. Particulate matter and the sulphur oxides aggravate
the conditions of asthma and bronchitis13-14
. Studies15-16
on the short-term exposure to high
pollution concentration suggest a higher prevalence of bronchitis, asthma, and other symptoms,
and hence, found to be related with the increase in emergency room visit in hospitals17-20
.
Trapping of pollutants, due to atmospheric inversion under cold conditions during Diwali,
promotes the formation of smog that stays close to the ground for long time before its dispersion
into the atmosphere. Smog may worsen the condition of patients with lung, heart and nervous
system diseases.
The objective of present study is to assess the short-term variation in the ambient
concentration of SO2, nitrogen dioxide (NO2), total suspended particles (TSP) and PM10
associated with firework events at different location in Hisar city during Diwali festival, in the
year 1999, from 5th
to 9th
of November. The health effects of short-term exposure to these
pollutants have been discussed. To assess the daily variations in air quality, the diurnal pattern
was also studied. Finally the ambient air quality was compared with that of a typical winter day
of December 1999.
Experimental
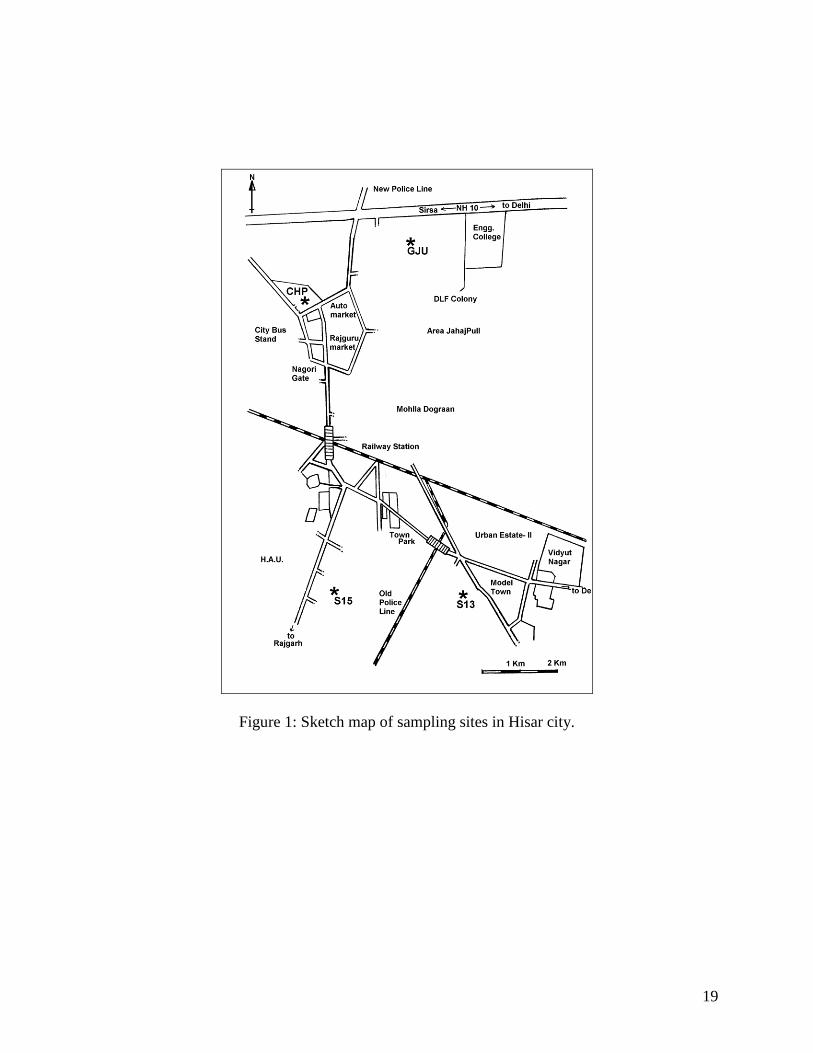
A total of four sampling sites were selected in Hisar city (29010‟ N, 75
0 46‟ E, 215.2
meter above mean sea level) on the bases of differential population characteristics (Fig. 1). The
district civil hospital (CHP) was selected as sensitive area, and three different residential
locations selected were, Sector-13 (S13), which represent densely populated with moderately
financially rich population, Guru Jambheshwar University (GJU), primarily institutional and
partially residential area and the Sector-15 (S15) densely populated area with mostly financially
4
rich population. Characteristics of population with varying financial status, likely indicate their,
spending capacity to celebrate this very paramount Indian festival. Financially strong population
generally spend more money on firework as the festival is deeply connected with strong human
sentiments.
APM-460 respirable dust samplers (RDS) with provision for gaseous sampling APM-411
(Envirotech, New Delhi) was used for measuring the concentrations of TSP, PM10, NO2 and SO2
in the air. The sampling inlet was placed ~ 5 meter above the ground level, because most of the
houses have enough roof space and they generally use this roof space for display of fireworks.
Further this height can be considered as the respirable zone for people stayed in 2-3 storey
buildings. The APM-460 Respirable Dust Sampler was equipped with a cyclone. The cyclone
was designed by Envirotech to provide separation of PM10 particles. Atmospheric air was drawn
through the cyclone and 20 X 25 cm glass fibre filter (GFF) paper sheet at a flow rate of 0.8 to
1.2 m3 min
-1.
As the air with suspended particulate enters the cyclone, coarse non-respirable dust is
separated from the air stream by centrifugal forces. The suspended particulate matter falls
through the cyclone‟s conical hopper and gets collected in the cyclonic-cup. The fine dust
comprising the respirable fraction of TSP passes through the cyclone and gets collected on the
GFF paper. The amount of non-respirable particulate (NRP) and respirable particulate per unit
volume of air passed was calculated on the basis of the difference between initial and final
weights of the cyclone cup and that of the GFF paper, and the total volume of the air sucked
during sampling. Mass concentration of TSP was calculated by adding the concentration of PM10
and NRP, i.e. [TSP (µg/m3) = PM10 (µg/m
3) + NRP (µg/m
3)]. For gaseous (SO2 and NO2)
sampling the impingers were exposed in two shift of 12 hours at an impingement rate of 1 dm3
5
min-1
to get two samples for day and night concentration. SO2 was analysed following Lodge21
by employing the West-Gaeke method on Spectronic-21 spectrophotometer at wavelength of 560
nm. NO2 was also analyzed following Lodge21
employing the Jacob-Hochheiser modified
method on the above spectrophotometer at wavelength of 540 nm.
Results and Discussion
Burning of sulfur nitrates, magnesium, aluminium, paper and host of other materials
contained in crackers and fireworks produces air pollution during Diwali. The full composition
and the relative concentration of the various gaseous vapours and particulate pollutants emitted is
not known. However, SO2, NO2, and particulate matter (specially PM10) are of special interest, as
they are known to be potentially injurious to the respiratory passages and other health effcets3, 17
.
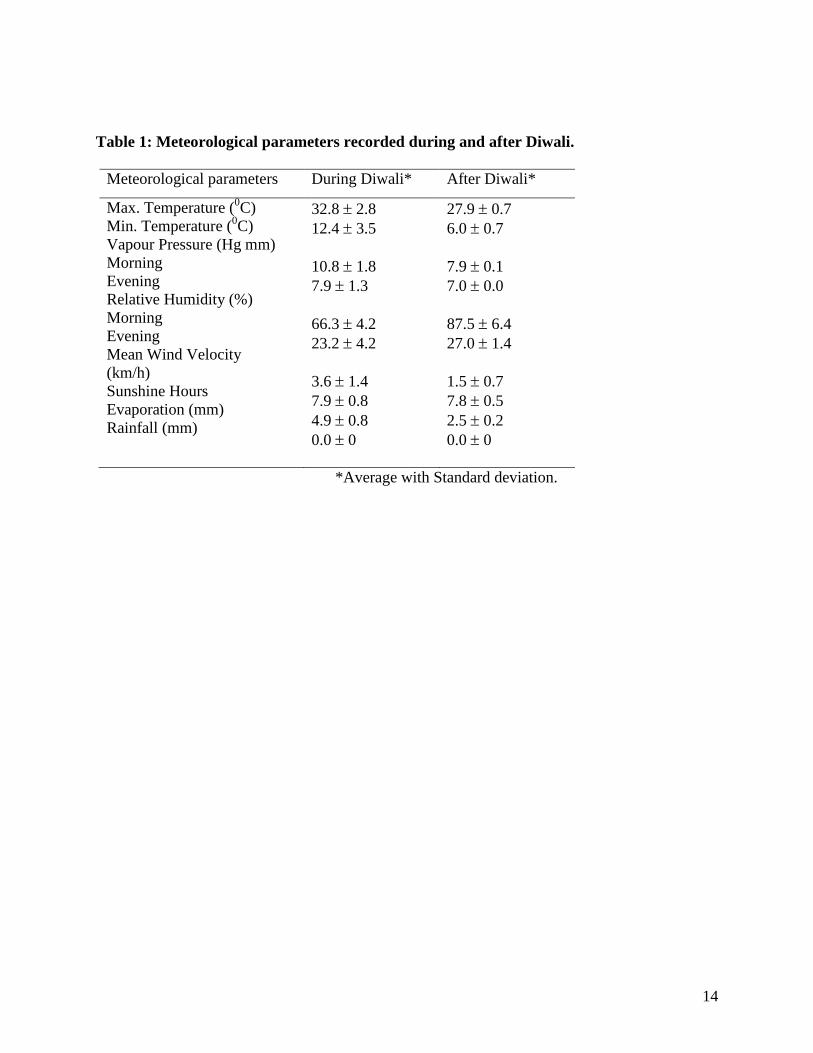
The metrological parameters during Diwali and after Diwali are presented in Table 1,
which shows that the metrological conditions during both monitoring periods were almost
identical and can be used for the comparison of the air quality data. Further the atmosphere was
stable with no inversion, which support a low lapse rate. During the monitoring period the
weather was sunny with out any clouds cover. NE & NNE were the prevailing wind directions
recorded.
Sulphur dioxide
In general, firecrackers contain 75 % potassium nitrate, 15 % carbon (C), and 10 % sulfur
(S). Potassium nitrate is a strong oxidising agent, when burnt with C and S, it release gases such
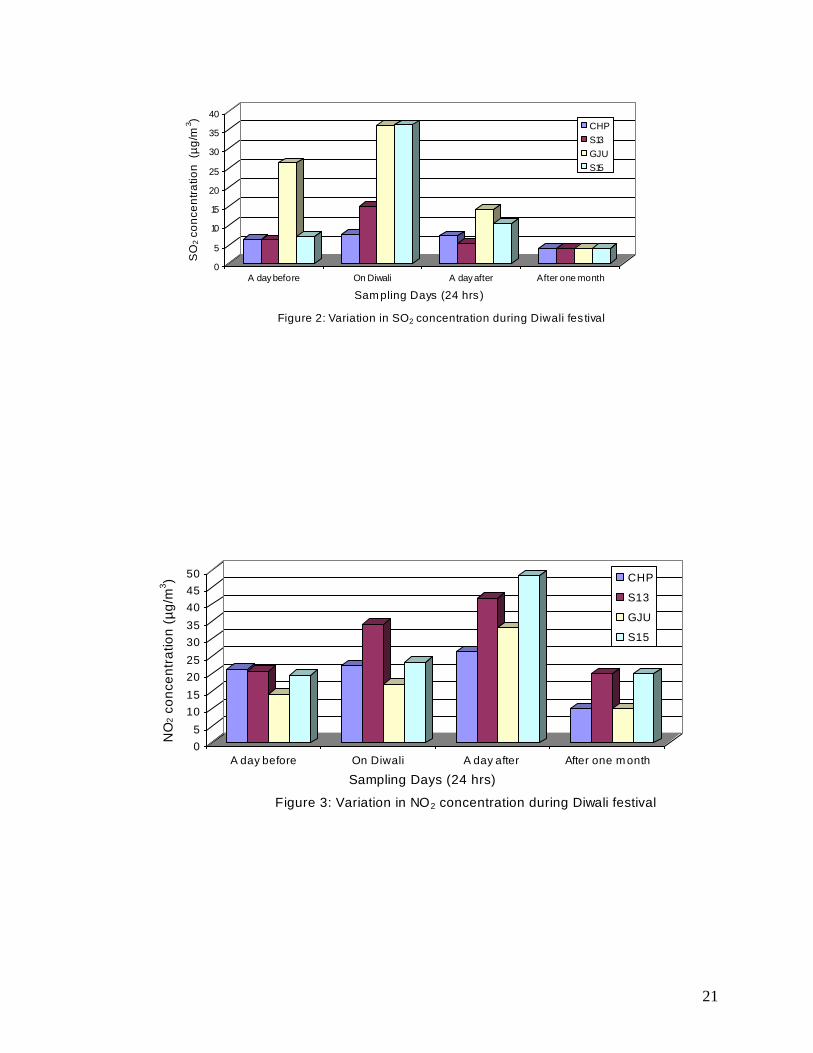
as CO2 and SO2. The site-specific daily average concentration of SO2 before Diwali varied from
6.4 µg/m3 (S13) to 27 µg/m
3 (GJU). The reason for the high concentration of SO2 in the
university area seems to be related with the pre-Diwali celebrations by the students before
leaving the campus for Diwali holidays. During Diwali, the SO2 concentration increased up to
6
ten times (36.1 µg/m3) at S15 site and increased approximately four times (14.5 µg/m
3) at S13
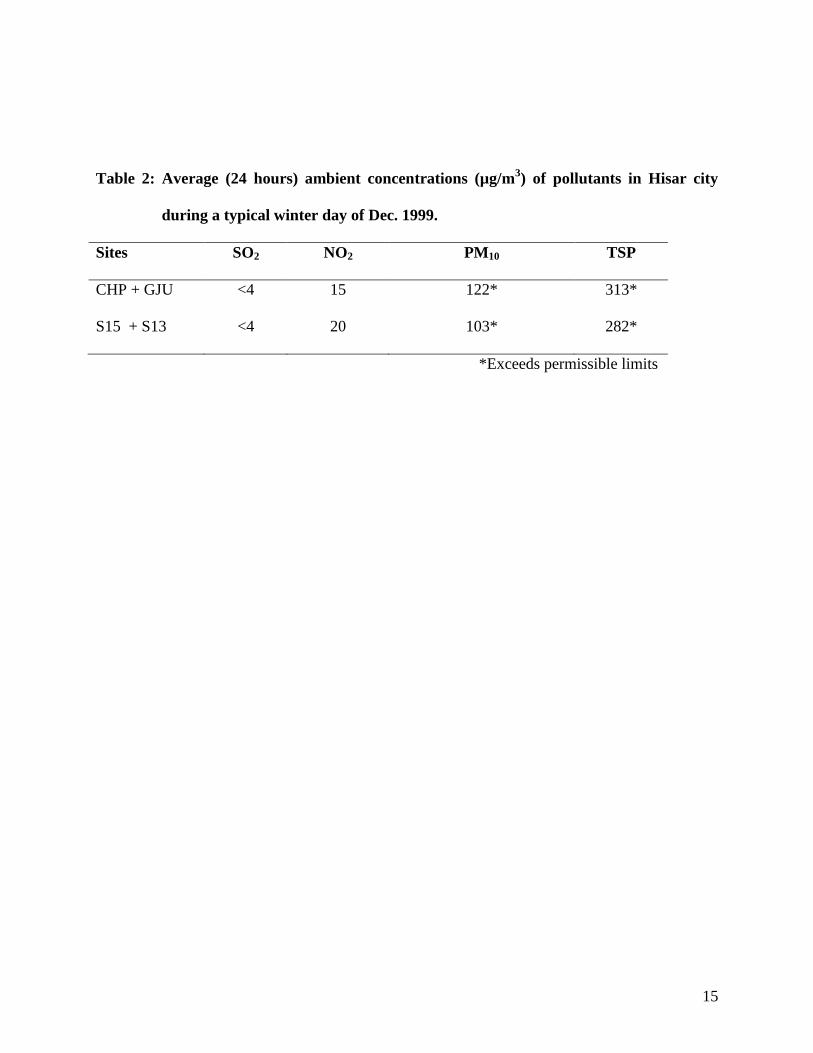
site to its concentration during a typical winter day22
(Table 2) of 1999, where as at GJU SO2
concentration of 35.9 µg/m3 was observed. A day after Diwali the SO2 concentration decreased
significantly, as compared to the levels on Diwali (Fig. 2). At the sensitive site, SO2
concentration increased slightly (7.6 µg/m3) during Diwali as compared to 6.4 µg/m
3 a day
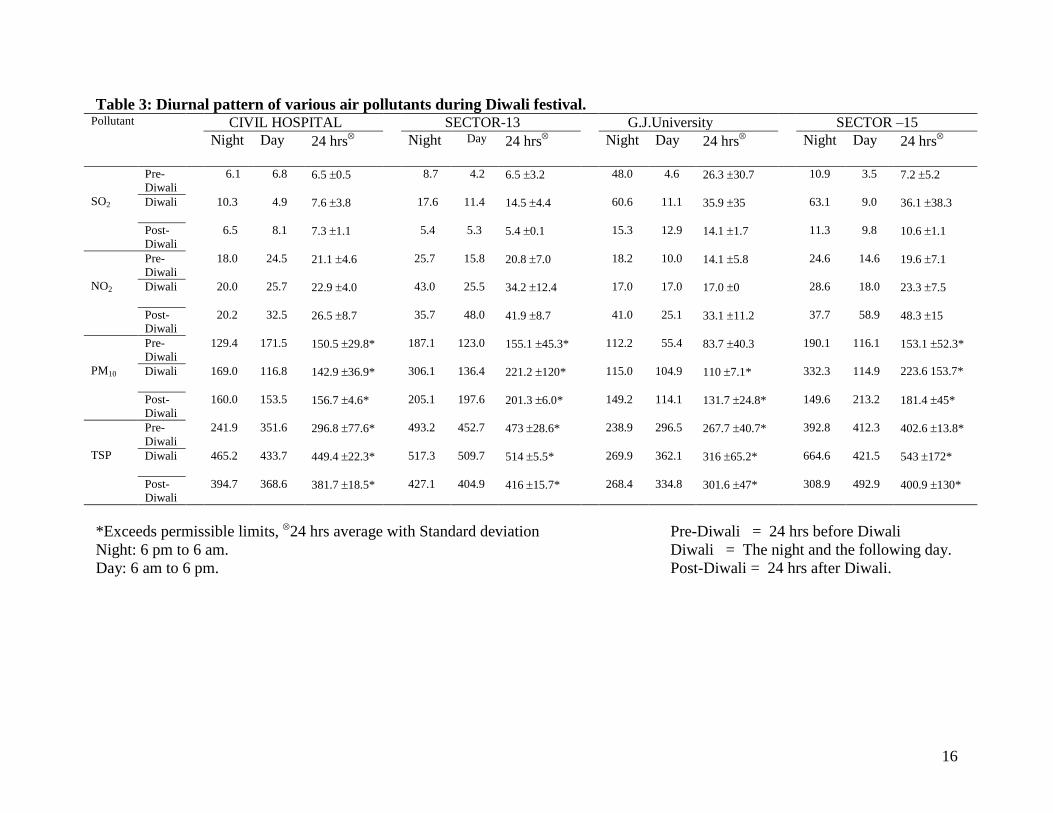
before Diwali. Diurnal pattern of SO2 concentration showed a slight increase in night (6 p.m. to 6
a.m.) as compared to daytime (Table 3), which seems to be associated with increased firework
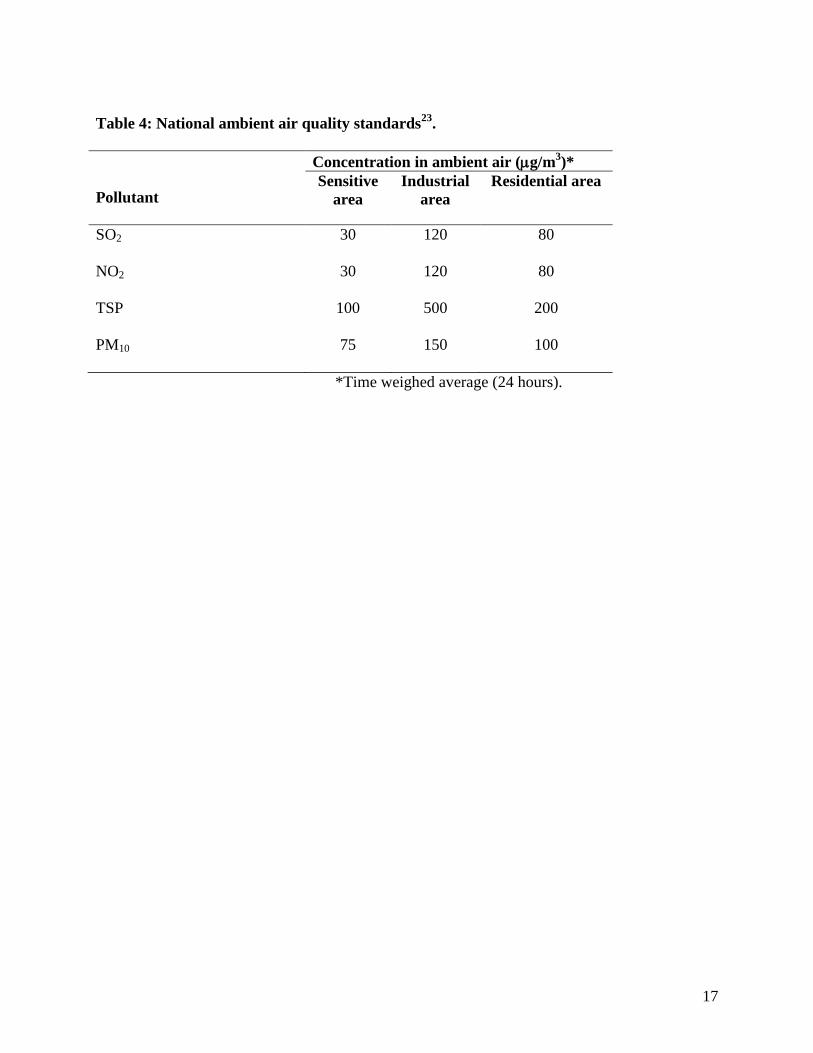
events during the night (a special characteristic of Diwali night). Although the daily average SO2
concentration during winter season remains well below the maximum allowed limit23
for
different areas (Table 4), it seems to be moderately high during Diwali.
High levels of SO2 are particularly dangerous in the presence of particulate matter,
because it slowly adsorbs on fine atmospheric particles and can be transported very deep into
lungs, and therefore staying there for a long time. Due to their very long residence time and
acidic character they can cause serious damage to the lungs tissue (Oedema). WHO24
and other
studies25
have shown that of among the particles of diverse composition, sulphates have the
worst health impact, which also stay in air for long time.
Gong, et al.16
studied the short-term health response to SO2 exposure on asthmatic
patients. They found that ten minute SO2 exposure at concentration > 1.32 mg/m3 and ventilation
30 dm3/min can cause short term asthma manifestations more intense than those usually
experienced from everyday stress with out SO2 exposure. Many other studies18,24
have reported
the short-term exposure to SO2 causes broncho-constriction. Most of the information on the acute
effects of SO2 comes from controlled chamber experiments on volunteers exposed to SO2 for
period ranging from a few minutes up to one hour26
. Acute responses occur within the first few
7
minutes after commencement of inhalation. Normally healthy individuals show upper respiratory
symptoms, whereas asthmatics and person with respiratory hyper-reactivity exhibit acute
responses. The effect in sensitive individuals includes in reduction in mean forced expiratory
volume over one second (FEV1), reduction in forced vital capacity (FVC) and increases in
specific airway resistance (sRAW), and symptoms, such as wheezing, or shortness of breathing.
These effects are enhanced by exercises that increase the volume of air inspired, as it allows SO2
to penetrate into the respiratory tract27
of the lungs.
Nitrogen dioxide
A day before Diwali, the daily average concentration of NO2 ranged from 14.1
µg/m3
(GJU) to 21.3 µg/m3 (CHP). On Diwali, the maximum NO2 concentration was noted at
S13 (34.1 µg/m3), followed by S15 (23.3 µg/m
3), CHP (22.9 µg/m
3), and GJU (17.0 µg/m
3). On
Diwali, two to three times increase in NO2 concentration was observed at the various site,
compared to that of a typical winter day concentration. Even a day after Diwali, the daily average
NO2 concentration showed an increasing trend (Fig. 3) and the maximum concentration of NO2
was observed at S15 (48.3 µg/m3) site, followed by S13 (41.9 µg/m
3), GJU (33.2 µg/m
3) and
CHP (26.3 µg/m3) sites. During monitoring period, the diurnal pattern for NO2 concentration
also showed a slight increase in the night, as compare to daytime (Table 3). During Diwali
period, the daily average NO2 concentrations remained close to the maximum prescribed limit in
comparison to the typical winter day.
Most effects of NO2 are exerted in the airways and the lungs. The health effects of NO2
have been reviewed in various studies26,28-30
. NO2 is a deep lung irritant, which has been shown
to generate biochemical alterations and histological demonstrable lung damage in laboratory
animals as a result of both acute and chronic exposure24
. NO2 increases bronchial reactivity, as
8
measured by the response of normal and asthmatic subjects following exposure to
pharmacological broncho-constrictor agents, even at levels that do not affect pulmonary function
directly in the absence of broncho-constrictor. Some authors have shown increased
responsiveness to broncho-constrictors at NO2 levels as low as 376 to 565 µg/m3, other found
that higher level had no such effect26
. Ponka et al.31
have found a significant association with
emergency room visit for exacertation of chronic bronchitisor emphysema, and low levels of air
pollutants specifically with SO2 and NO2. Inhaled NO2 can penetrate to small lung airways and
hence, there is much greater susceptibility with SO2 to broncho-constrictive response in
individuals with asthma32,33
.
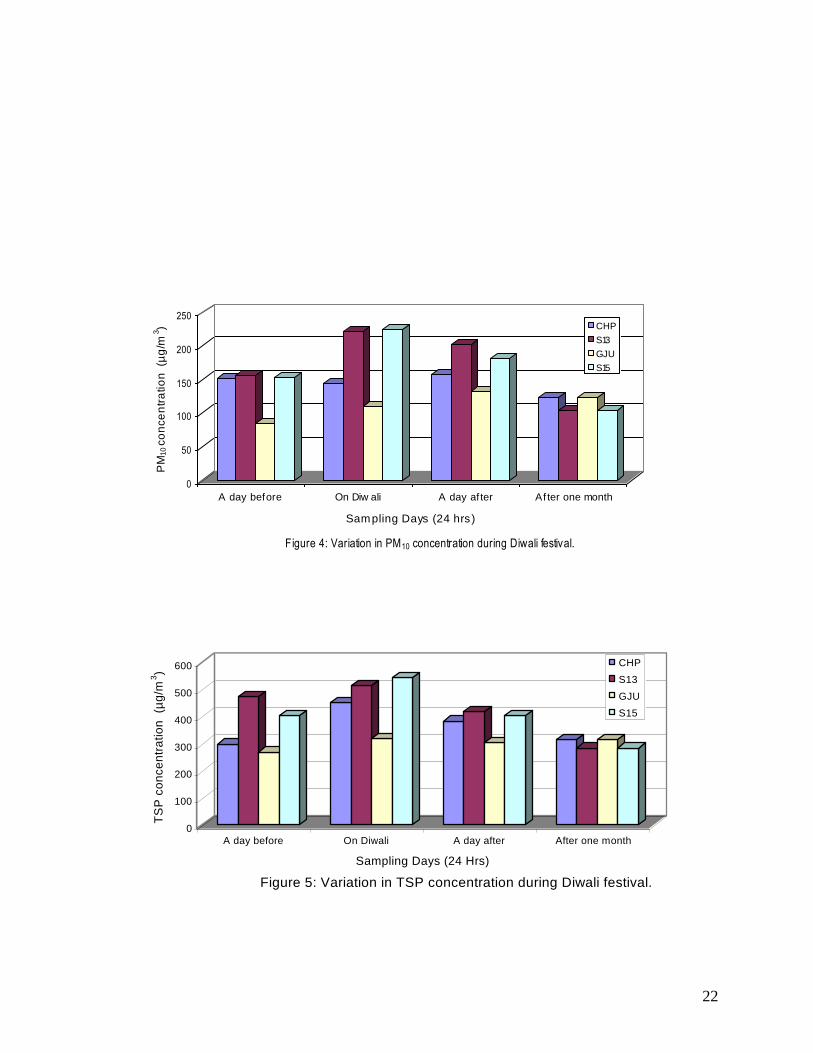
Respirable (PM10) and total suspended particles
Concentration of PM10 at all the sites exceeded the maximum prescribed allowable limit
before and after Diwali. During Diwali a slight increase in PM10 concentration was observed to
its pre Diwali concentration. The maximum daily average concentration of PM10 was observed at
S15 (224 µg/m3) site followed by S13 (221 µg/m
3), CHP (143 µg/m
3) and GJU (110 µg/m
3)
monitoring stations. A slight fall in PM10 concentration was observed a day after the festival
(Fig. 4). Even on a typical day of winter, the level of particles was reported to be very high in
Hisar city (Table 2), which seems to be related with the fact that it has semi desert climate with
less vegetation cover and fine soil structure22
. The higher concentration of PM10 in inhaled air
has more possibility of these particles to reach deep in lungs. Entry of particles into lungs is
dangerous, because they can carry a complex mixture of toxic pollutants from fireworks. Michie
et al.34
have also studied effect of PM10 particles on paediatric respiratory diseases following
community fireworks. There are reports on the decrements in peak expiratory flow rates in
children, in relation with PM10 concentration35
.
9
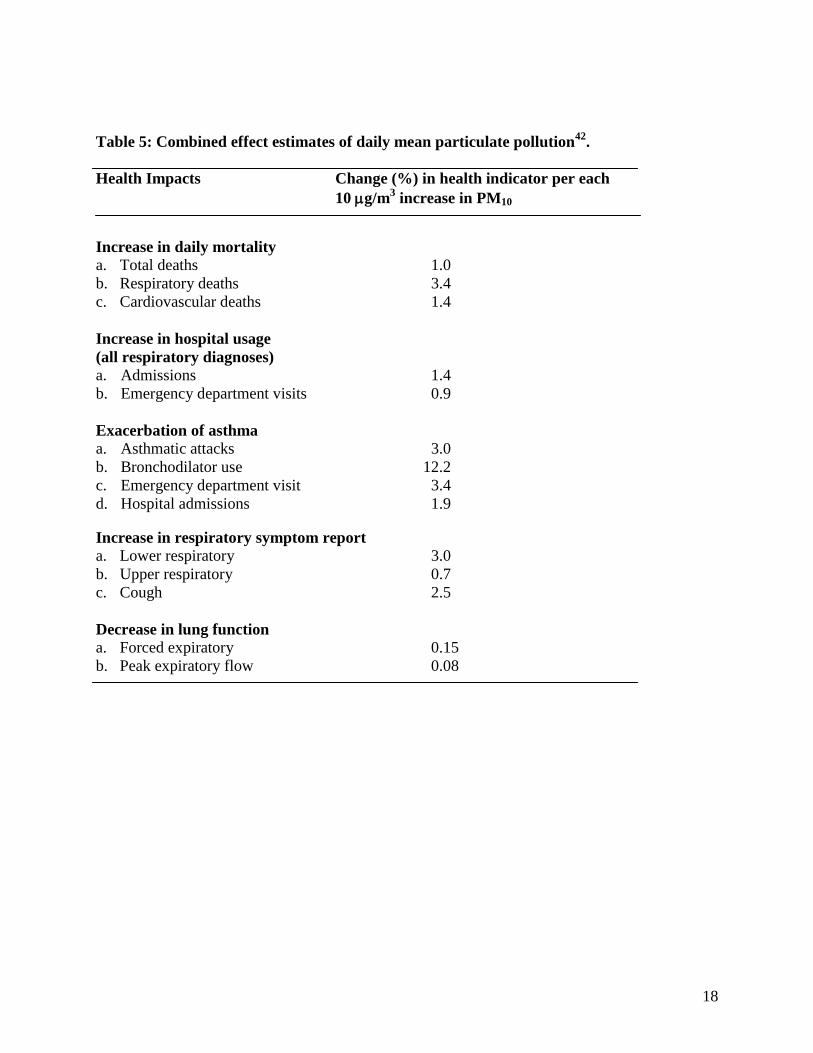
Reviews and analysis of epidemiological literature for acute adverse effects following
exposure to particulates have been presented by Pope et al.36
Schwartz et al.37
Dockery et al.38
and other teams39
estimate these effects as percent increase in mortality associated with each
incremental increase of PM10 by 10 µg/m3 (Table 5). Individuals, who were elderly or had pre-
existing lung, or heart disease, appeared to be more susceptible than others to adverse effects of
PM10. During Diwali period, concentration of suspended particles in air has been found to be
double to its concentration on a typical winter day, although the meteorological conditions were
very similar. Clark40
, has also reported a dramatically short term (hourly average) increase in the
particle level, which originated from bonfires and fireworks across England and Wales. Further
the PM10 levels were strongly influenced by local conditions, i.e. how close the sites were to
large bonfires, and weather changes.
TSP concentration exceeded the maximum prescribed limits at all the sites (Table 3).
Before Diwali, the daily average concentration ranged from 268 µg/m3
(GJU) to 473 µg/m3
(S13). On Diwali the maximum concentration of 542 µg/m3
was noted at S15 (Fig 5). The TSP
concentration at Diwali was approximately double of the maximum prescribed limit, i.e. 200
µg/m3 for residential area. After Diwali the TSP concentration slightly decreased. Babu et al.
41
have also observed a large increase in the black carbon concentration by a factor of over 3 above
the unperturbed background level at a remote costal location, associated with the Diwali festival
in 2000.
The diurnal pattern for the concentrations of TSP and PM10 does not show significant
changes during day and night (Table 2). In general, the particle concentration seems to be
doubled during Diwali festival. Exposure to particulate matter can aggravate chronic respiratory
and cardiovascular diseases, alter host defence, damage lung tissue, lead to premature death and
10
possibly contribute to cancer. TSP and specifically PM10, or smaller particles have been related
to premature death, aggravated asthma, increased hospital admission, and increased respiratory
problems14,39,42
.
Conclusions
Display of fireworks with loud explosive, crackers, etc., during Diwali celebration causes
enormous though short-lived air pollution. The SO2, NO2, PM10 and TSP concentrations shown
increase, as the crackers start bursting. Concentration of SO2 at Diwali increased many times,
while the level of other pollutants also got approximately doubled to their normal concentration
reported during a typical winter day. Highest concentration of pollutants was noted at S15, which
seems to be related with the economic status of the citizens of that locality and dense population.
The short-term exposure of these pollutants above the permissible allowable limits can increase
the likelihood of acute health effects. Hence, there is a need exist to determine this proportion
and to control this pollution. Further this scientific study also corroborate the general feeling of
creating a strong public opinion to celebrate festival like Diwali, New Year etc. in an
environmentally friendly manner.
Acknowledgement
The authors would like to acknowledge Dr. Bhatiya (Civil Hospital), Mr. Sandal (Sector-13) and
Mr. Mor (Sector-15) and their family for allowing to use the instruments in their premises and
for their kind support.
11
References:
1 H.H. Holmes, Encyclopedia Americana, 1983, Vol-11, p. 263
2 W. Bach, A. Daniels, L. Dickinson, F. Hertlein, J. Morrow, S. Margolis, V.D. Dinh, Int.
J. Environ. Stud., 1975, 7, 183.
3 S.A. Takiguchi, R. Kusumoto, N. Teruya, S.A. Mayers, M.H. Yu, Crit. Care Med., 2000,
28, 527.
4 J.M. Becker, S. Iskandrian, J. Conkling, J. Ann. Allerg. Asthma I.M., 2000, 85,512.
5 M. J. Bull, P. Agran, H.G. Gardner, D. Laraque, S.H. Pollack, G.A. Smith, H.R. Spivak,
M. Tenenbein, Pediatrics, 2001, 108, 190.
6 A. Sukumar, R. Subramanian, Sci. Total Environ., 1992, 114, 161.
7 P. Fischer, Epidemiology, 2001, 12, S98-S98.
8 J.E. Carranza, B.T. Fisher, G.D. Yoder, D.W. Hahan, Spectrochim. Acta B, 2001, 56,
851.
9 O. Fleischer, H. Wichmann, W. Lorenz, Chemosphere, 1999, 39, 925.
10 P. Dyke, P. Coleman, R. James, Chemosphere, 1997, 34, 1191.
11 Ravindra, A.K. Mittal. R. Van Grieken, Rev. Environ. Health, 2001, 16, 169.
12 A. K. Attri, U. Kumar, V. K. Jain, Nature, 2001, 411, 1015.
13 D.V. Bates, R. Sizto, Environ. Res., 1987, 43, 317.
14 D.V. Bates, Thorax, 1996, 51, S3-S8.
15 B. Brunekreef, D.W. Dockery, M. Krzyzanowski, Environ. Health. Persp., 1995, 103, 3.
16 H. Gong, P.A. Lachenbruch, P. Harber, W.S. Linn, Toxicol. Ind. Health, 1995, 11, 467.
17 D.V. Bates, Scand. J. Work Environ. Health, 1995, 21, 405.
18 J.R. Balmes, J.M. Fine, D. Sheppard, Am. Rev. Respir. Dis., 1987, 136, 1117.
12
19 S. Walters, R.K. Griffiths, J.G. Ayres, Thorax, 1994, 49, 133.
20 B. Bakke, B. Ulvestad, P. Stewart, M.B. Lund, W. Eduard, Scand. J. Work Environ.
Health, 2001, 27, 250.
21 J.P. Lodge, Methods of air sampling and analysis, 3rd
edn, Lewes Publisher INC, Chelsea,
Michigan, 1989, pp. 403-406.
22 Ravindra, M.Tech. Dissertation, G.J. University, Hisar, 1999.
23 Central Pollution Control Board (CPCB), 2000 „National ambient air quality statistics of
India‟, Parevesh Bhavan, Delhi.
24 WHO, Air quality Guidelines for Europe, WHO regional Publications, Europien Series
No. 23, Regional Office for Europe, World Health Organization, Copenhagen, 1987.
25 D.W. Dockery, J. Schwartz, D. Spengler, Environ. Res., 1993, 59, 362.
26 WHO, Air quality Guidelines for Europe, WHO regional Publications, Europien Series
No. 23, Regional Office for Europe, World Health Organization, Copenhagen, 1999.
(http://www.who.dk)
27 D. Schwela, Rev. Environ. Health, 2000, 15, 13.
28 WHO, Nitrogen Oxides. Environmental Health Criteria 188, World Health Organization,
Genewa, 1997.
29 A.J. Chauhan, M.T. Krishna, A.J. Frew, Rev. Environ. Health, 1998, 13, 91.
30 U. Ackermann-liebrich, R. Rapp. In: S.T. Holgate, J.M. Samet, H.S. Koren, R.L.
Maynard, eds. Air pollution and health. London, Academic Press, 1999, pp. 559-584.
31 A. Ponka, M. Virtanen, Environ. Res., 1994, 65, 207.
32 C. Schindler, U. Ackermann-Liebrich, P. Leuenberger, C. Monn, R. Rapp, G. Bologini et
al., Epidemiology, 1998 9, 405.
13
33 WHO, Guideline for air quality, World Health Organization, Genewa, 2000.
(http://www.who.int/peh/)
34 C.A. Michie, G. Keeling, J. Freeman, Paediatrics, 2000, 47, 479A.
35 G. Hoek, D.W. Dockery, A. Pope, L. Neas, W. Roemer, B. Brunkreef, Eur. Respir. J.,
1998, 11, 1307.
36 C. Pope, J. Schwartz, M. Ransom, Arc. Environ. Health, 1992, 47, 211.
37 J. Schwartz, Am. J. Epidemiol., 1993, 137, 1136.
38 D. Dockery, C.I. Pope, X. Xiping, J. Spengler, J. Wore, M. Fay, B. Ferris, F. Speize, New
Eng. J. Med., 1993, 329, 1753.
39 Committees of the Environmental and Occupational Health Assembly (COEHA) of the
American Thoracic Society. Am. J. Respir. Crit. Care Med. 1996, 131, 133.
40 H. Clark, Atmos. Environ, 1997, 31, 2893.
41 S.S. Babu, K.K. Moorthy, Curr. Sci. India, 2001, 81, 1208.
42 A. Seaton, W. MacNee, K. Donaldson, D. Godden, Lancet 1995, 345, 176.
14
Table 1: Meteorological parameters recorded during and after Diwali.
Meteorological parameters During Diwali* After Diwali*
Max. Temperature (0C)
Min. Temperature (0C)
Vapour Pressure (Hg mm)
Morning
Evening
Relative Humidity (%)
Morning
Evening
Mean Wind Velocity
(km/h)
Sunshine Hours
Evaporation (mm)
Rainfall (mm)
32.8 2.8
12.4 3.5
10.8 1.8
7.9 1.3
66.3 4.2
23.2 4.2
3.6 1.4
7.9 0.8
4.9 0.8
0.0 0
27.9 0.7
6.0 0.7
7.9 0.1
7.0 0.0
87.5 6.4
27.0 1.4
1.5 0.7
7.8 0.5
2.5 0.2
0.0 0
*Average with Standard deviation.
15
Table 2: Average (24 hours) ambient concentrations (µg/m3) of pollutants in Hisar city
during a typical winter day of Dec. 1999.
Sites SO2 NO2 PM10 TSP
CHP + GJU <4 15 122* 313*
S15 + S13 <4 20 103* 282*
*Exceeds permissible limits
16
Table 3: Diurnal pattern of various air pollutants during Diwali festival. Pollutant CIVIL HOSPITAL SECTOR-13
G.J.University SECTOR –15
Night Day 24 hrs Night Day 24 hrs
Night Day 24 hrs
Night Day 24 hrs
SO2
Pre-
Diwali
6.1 6.8 6.5 0.5 8.7 4.2 6.5 3.2 48.0 4.6 26.3 30.7 10.9 3.5 7.2 5.2
Diwali 10.3 4.9 7.6 3.8 17.6 11.4 14.5 4.4 60.6 11.1 35.9 35 63.1 9.0
36.1 38.3
Post-
Diwali
6.5 8.1 7.3 1.1 5.4 5.3 5.4 0.1 15.3 12.9 14.1 1.7 11.3 9.8 10.6 1.1
NO2
Pre-
Diwali
18.0 24.5 21.1 4.6 25.7 15.8 20.8 7.0 18.2 10.0 14.1 5.8 24.6 14.6 19.6 7.1
Diwali 20.0 25.7 22.9 4.0 43.0 25.5 34.2 12.4 17.0 17.0 17.0 0 28.6 18.0
23.3 7.5
Post-
Diwali
20.2 32.5 26.5 8.7 35.7 48.0 41.9 8.7 41.0 25.1 33.1 11.2 37.7 58.9 48.3 15
PM10
Pre-
Diwali
129.4 171.5 150.5 29.8* 187.1 123.0 155.1 45.3* 112.2 55.4 83.7 40.3 190.1 116.1 153.1 52.3*
Diwali 169.0 116.8 142.9 36.9* 306.1 136.4 221.2 120* 115.0 104.9 110 7.1* 332.3 114.9
223.6 153.7*
Post-
Diwali
160.0 153.5 156.7 4.6* 205.1 197.6 201.3 6.0* 149.2 114.1 131.7 24.8* 149.6 213.2 181.4 45*
TSP
Pre-
Diwali
241.9 351.6 296.8 77.6* 493.2 452.7 473 28.6* 238.9 296.5 267.7 40.7* 392.8 412.3 402.6 13.8*
Diwali 465.2 433.7 449.4 22.3* 517.3 509.7 514 5.5* 269.9 362.1 316 65.2* 664.6 421.5
543 172*
Post-
Diwali
394.7 368.6 381.7 18.5* 427.1 404.9 416 15.7* 268.4 334.8 301.6 47* 308.9 492.9 400.9 130*
*Exceeds permissible limits, 24 hrs average with Standard deviation Pre-Diwali = 24 hrs before Diwali
Night: 6 pm to 6 am. Diwali = The night and the following day.
Day: 6 am to 6 pm. Post-Diwali = 24 hrs after Diwali.
17
Table 4: National ambient air quality standards23
.
Pollutant
Concentration in ambient air (g/m3)*
Sensitive
area
Industrial
area
Residential area
SO2 30 120 80
NO2 30 120 80
TSP 100 500 200
PM10 75 150 100
*Time weighed average (24 hours).
18
Table 5: Combined effect estimates of daily mean particulate pollution42
.
Health Impacts Change (%) in health indicator per each
10 g/m3 increase in PM10
Increase in daily mortality
a. Total deaths 1.0
b. Respiratory deaths 3.4
c. Cardiovascular deaths 1.4
Increase in hospital usage
(all respiratory diagnoses)
a. Admissions 1.4
b. Emergency department visits 0.9
Exacerbation of asthma
a. Asthmatic attacks 3.0
b. Bronchodilator use 12.2
c. Emergency department visit 3.4
d. Hospital admissions 1.9
Increase in respiratory symptom report
a. Lower respiratory 3.0
b. Upper respiratory 0.7
c. Cough 2.5
Decrease in lung function
a. Forced expiratory 0.15
b. Peak expiratory flow 0.08
19
Figure 1: Sketch map of sampling sites in Hisar city.

20
21
0
5
10
15
20
25
30
35
40
SO
2 c
on
ce
ntr
atio
n (µ
g/m
3)
A day before On Diwali A day after After one month
Sampling Days (24 hrs )
Figure 2: Variation in SO2 concentration during Diwali fes tival
CHP
S13
GJU
S15
0
5
10
15
20
25
30
35
40
45
50
NO
2 c
on
ce
ntr
atio
n (
µg
/m3)
A day before On Diwali A day after After one month
Sampling Days (24 hrs)
Figure 3: Variation in NO2 concentration during Diwali festival
CHP
S13
GJU
S15
22
0
50
100
150
200
250
PM
10 c
on
ce
ntr
atio
n (µ
g/m
3)
A day before On Diw ali A day af ter Af ter one month
Sampling Days (24 hrs)
Figure 4: Variation in PM10 concentration during Diwali festival.
CHP
S13
GJU
S15
0
100
200
300
400
500
600
TS
P c
on
ce
ntr
atio
n
(µg
/m3)
A day before On Diwali A day after After one month
Sampling Days (24 Hrs)
Figure 5: Variation in TSP concentration during Diwali festival.
CHP
S13
GJU
S15