short vs. long gamma-ray bursts: a comprehensive … · short vs. long gamma-ray bursts: a...
TRANSCRIPT
Mon. Not. R. Astron. Soc. 000, 1–23 (2014) Printed 1 April 2015 (MN LATEX style file v2.2)
Short vs. Long Gamma-Ray Bursts: A ComprehensiveStudy of Energetics and Prompt Gamma-Ray Correlations
Amir Shahmoradi 1?, Robert J. Nemiroff 2?1Department of Physics & Institute for Fusion Studies, The University of Texas at Austin, TX 78712, USA2Department of Physics, Michigan Technological University, Houghton, MI 49931, USA
ABSTRACTWe present the results of a comprehensive study of the luminosity function, energet-ics, prompt gamma-ray correlations, and classification methodology of short–hard andlong–soft GRBs (SGRBs & LGRBs), based on observational data in the largest cata-log of GRBs available to this date: BATSE catalog of 2702 GRBs. We find that: 1.The least-biased classification method of GRBs into short and long, solely based onprompt–emission properties, appears to be the ratio of the observed spectral peak en-ergy to the observed duration (R = Ep/T90) with the dividing line at R ' 50[keV s−1].2. Once data is carefully corrected for the effects of the detection threshold of gamma-ray instruments, the population distribution of SGRBs and LGRBs can be individuallywell described as multivariate log-normal distribution in the 4–dimensional space ofthe isotropic peak gamma-ray luminosity, total isotropic gamma-ray emission, the in-trinsic spectral peak energy, and the intrinsic duration. 3. Relatively large fractionsof SGRBs and LGRBs with moderate-to-low spectral peak energies have been missedby BATSE detectors. 4. Relatively strong and highly significant intrinsic hardness–brightness and duration–brightness correlations likely exist in both populations ofSGRBs and LGRBs, once data is corrected for selection effects. The strengths ofthese correlations are very similar in both populations, implying similar mechanismsat work in both GRB classes, leading to the emergence of these prompt gamma-raycorrelations.
Key words: Gamma-Rays: Bursts – Gamma-Rays: observations – Methods: statis-tical
1 INTRODUCTION
The field of Gamma-Ray Bursts (GRBs) has witnessedrapid growth over the past decades, in particular, followingthe launches of NASA Compton Gamma-Ray Observatory(Meegan et al. 1992), Swift (Gehrels et al. 2004) & Fermi(Michelson, Atwood & Ritz 2010) missions. Early hints tothe existence of distinct populations of gamma-ray tran-sients (e.g., Mazets et al. 1981; Norris et al. 1984), and atleast two classes of short-hard (Type-I) & long-soft (Type-II) GRBs (Dezalay et al. 1992) have now been extensivelycorroborated and confirmed by the prompt-emission data
? E-mail: [email protected] (AS); [email protected](RJN)
from independent gamma-ray detector missions (e.g., Kou-veliotou et al. 1993a; Gehrels, Ramirez-Ruiz & Fox 2009;Zhang et al. 2012) or follow-up observations of the after-glows or host galaxies (e.g., Zhang et al. 2009; Berger 2011,2014). Although the possibility of more than two classesof GRBs with distinct progenitors has been extensivelydiscussed and considered (e.g., Horvath 1998; Mukherjeeet al. 1998; Hakkila et al. 2001; Balastegui, Ruiz-Lapuente& Canal 2001; Hakkila et al. 2004b; Horvath et al. 2006;Gehrels et al. 2006; Chattopadhyay et al. 2007; Horvathet al. 2008; Virgili, Liang & Zhang 2009; Gao, Lu & Zhang2010; Horvath et al. 2012; Levan et al. 2014; Kbori et al.2014), it has remained a matter of debate and speculationto this date (e.g., Hakkila et al. 2000c,a,b, 2003, 2004a; Shah-moradi 2013b; Zhang et al. 2014; Levan et al. 2014).
Beginning with the influential work of Kouveliotou et al.
c© 2014 RAS
arX
iv:1
412.
5630
v2 [
astr
o-ph
.HE
] 3
0 M
ar 2
015
2 Shahmoradi and Nemiroff
(1993a), GRBs have been traditionally classified into twopopulations of Short and Long GRBs (SGRBs & LGRBsrespectively) based on a sharp cutoff on the bimodal distri-bution of the observed duration (T90) of prompt gamma-rayemission, generally set to T90 ∼ 2 − 3[s]. Nevertheless, thedetector & energy dependence of the observed GRB dura-tion (e.g., Fenimore et al. 1995; Nemiroff 2000; Qin et al.2013) has prompted many studies in search of alternativeless-biased methods of GRB classification, typically basedon a combination of the prompt gamma-ray emission and/orafterglow/host properties (e.g., Gehrels, Ramirez-Ruiz &Fox 2009; Zhang et al. 2009; Goldstein, Preece & Briggs2010; L et al. 2010; Shahmoradi & Nemiroff 2011; Zhang,Chen & Huang 2012; Zhang et al. 2012; Shahmoradi 2013b;L et al. 2014) or using the prompt-emission spectral corre-lations in conjunction with the traditional method of classi-fication (e.g., Qin & Chen 2013).
Ideally, a phenomenological classification method ofGRBs should be based on their intrinsic (i.e., rest-frame)properties, free from potential biases due to data analy-sis, detector specifications, observational selection effectsand sample incompleteness. Such method is currently farfrom reach due to detector-induced heterogeneity in avail-able GRB catalogs (e.g., Qin et al. 2013) and complex se-lection effects in the detection, analysis, and redshift mea-surement processes (e.g., Hakkila et al. 2000c, 2003; Band &Preece 2005; Nakar & Piran 2005; Nava et al. 2008; Butleret al. 2007; Butler, Kocevski & Bloom 2009; Butler, Bloom &Poznanski 2010; Shahmoradi & Nemiroff 2009, 2011; Shah-moradi 2013b,a; Coward et al. 2013, c.f., Shahmoradi & Ne-miroff 2011 for a comprehensive review of relevant litera-ture).
Historically, the intrinsic properties of short GRBs havealso been less studied compared to long GRBs, potentiallydue to lack of redshift information for the majority of SGRBs(e.g., Coward et al. 2012). This has led to an additionalobstacle towards a quantitative GRB taxonomy. While thepopulation properties of long GRBs and their progenitorshave been extensively researched and fairly well constrained(e.g., Dainotti, Ostrowski & Willingale 2011; Shahmoradi2013b,a; Lien et al. 2013; Dainotti et al. 2013; Lien et al.2014; Howell et al. 2014; Pescalli et al. 2015; Littlejohns &Butler 2014; Dainotti et al. 2014, c.f., Shahmoradi 2013 for acomprehensive review of the literature), the cosmic rate andthe intrinsic prompt-emission properties of short GRBs arefar less understood and investigated (e.g., Guetta, Piran &Waxman 2005; Guetta & Piran 2006; Nakar, Gal-Yam & Fox2006; Salvaterra et al. 2008; Chapman, Priddey & Tanvir2009; Virgili et al. 2011; Czerny et al. 2011; Wanderman &Piran 2014).
Motivated by the existing gap and uncertainties in thecurrent knowledge of the intrinsic population propertiesof short GRBs and the lack of an efficient, quantitative,bias-free classification method for gamma-ray bursts intolong and short subgroups, here we present a methodologyand model to constrain the energetics, luminosity function
and the joint distributions and correlations of the promptgamma-ray emission of SGRBs. Despite lacking a completeknowledge of the true cosmic rate and redshift distribution,here we argue and show that short GRBs exhibit very similarprompt-emission correlations and population distribution tothose of long GRBs as presented by Shahmoradi (2013b),both qualitatively and, under plausible cosmic rate assump-tions, also quantitatively. This result, along with other re-cent works on the time-resolved and time-integrated spec-tral properties of SGRBs (e.g., Ghirlanda et al. 2011; Shah-moradi & Nemiroff 2011; Zhang, Chen & Huang 2012; Tsut-sui et al. 2013; Calderone et al. 2014) points towards the pos-sibility of a unified mechanism responsible for the promptgamma-ray emission of the two GRB classes, independentlyof the diverse progenitor candidates for the two GRB pop-ulations.
The presented work also paves the way towardsa detector-independent minimally-biased phenomenologicalclassification method for GRBs solely based on the observedprompt gamma-ray data of individual events. Towards this,we focus our attention on the largest sample of uniformly-detected gamma-ray bursts to this date: the BATSE catalogof 2702 GRBs (Paciesas et al. 1999; Goldstein et al. 2013). Inthe following sections, we present an example of data miningon BATSE data that showcases the tremendous amount ofuseful, yet unexplored information buried in this seeminglyarchaic GRB catalog.
We devote Sec. 2.1 of this manuscript to presenting anelaborate method of classification for the observed sample ofGamma-Ray Bursts into two subclasses of short-hard andlong-soft GRBs. In Sec. 2.2, we elaborate on the construc-tion of a GRB world model that is capable of describingBATSE SGRB data. This is followed by a discussion of theprocedure for fitting the model to BATSE data in Sec. 2.4.The predictions of the model together with univariate andmultivariate goodness-of-fit tests are presented in Sec. 3, fol-lowed by a discussion of the similarities and differences inthe population distributions of SGRBs & LGRBs in Sec. 4.The main findings of the presented GRB world model aresummarized in Sec. 5.
2 GRB WORLD MODEL
2.1 Sample Selection
Depending on the triggering criteria, some gamma-ray de-tectors facilitate the detection of one class of bursts overthe others (e.g., Paciesas et al. 1999; Hakkila 2003; Band2003, 2006; Band et al. 2008; Lien et al. 2014). For example,the specific detector sensitivity of the Burst Alert Telescope(BAT) onboard Swift satellite results in better detections ofLGRBs over SGRBs (e.g., Band 2003, 2006). Compared toBAT however, BATSE Large Area Detectors (LAD) had anincreased relative sensitivity to short GRBs (e.g., Hakkila2003; Band 2003). Several studies have already offered newmethods for a global detector-independent phenomenologi-
c© 2014 RAS, MNRAS 000, 1–23

Short vs. Long Gamma-Ray Bursts 3
Figure 1. Classification of 1966 BATSE GRBs with measured peak flux (Pbol), fluence (Sbol), and observed duration (T90) taken from
the current BATSE catalog and measured spectral peak energies (Ep) taken from Shahmoradi & Nemiroff (2010). The segregationmethodology is based on fuzzy C-means clustering algorithm using the two GRB variables Ep & T90 that are least affected by the
triggering threshold of the BATSE Large Area Detectors (c.f., Sec. 2).
cal classification of GRBs based on empirical relations thatare believed to hold for only a specific class of GRBs orbased on the prompt or afterglow emission data (e.g., Zhanget al. 2009; L et al. 2010; Qin & Chen 2013). These methodshowever, either suffer from sample incompleteness or requireinformation, such as redshift, that might not be available forthe majority of GRBs (e.g., Coward et al. 2012, 2013).
Here in this work, we ensure a minimally-biased analysisof short-duration class of GRBs by following the classifica-tion approach of Shahmoradi (2013b), which to the extentof our knowledge provides the least biased classification ofBATSE GRBs, solely based on prompt emission data1. Theword ‘bias’ here refers to the systematic contamination of
1 The authors have already investigated multiple classification
data and analysis that might be introduced when using thetraditional definition of GRB classes, based on a sharp cutoffon the duration variable T90 (Kouveliotou et al. 1993a), asit is generally used by many GRB researchers (e.g., Guetta,Piran & Waxman 2005; Butler, Bloom & Poznanski 2010;Campisi, Li & Jakobsson 2010; Wanderman & Piran 2010).
The classification method used here is based on fuzzy C-means clustering algorithm of Dunn (1973); Bezdek (1981):Each BATSE GRB is assigned a probability (i.e., class co-efficient) of belonging to LGRB (versus SGRB) population,the value of which depends on the set of GRB variablesused in classification. This can be any combinations of the
methodologies, on a variety of GRB characteristics, that are docu-mented in Shahmoradi & Nemiroff (2011) & Shahmoradi (2013b).
c© 2014 RAS, MNRAS 000, 1–23

4 Shahmoradi and Nemiroff
peak flux (P50−300 [photon/s/cm2]) in BATSE detection en-ergy range [50− 300 keV ], in three different time scales: 64,256 & 1024 [ms]; bolometric fluence (Sbol [erg/cm2]); theobserver-frame spectral peak energy (Ep [keV ]), for whichwe use estimates by Shahmoradi & Nemiroff (2010), and theobserved duration (T90 [s]).2 Then, GRBs with LGRB classcoefficient > 0.5 are flagged as long-duration bursts. Fol-lowing Shahmoradi (2013b), we make use of only two GRBvariables Ep & T90 for classification of the sample into longand short GRBs. Unlike Ep & T90 which are weakly cou-pled to (i.e., correlated with) the variable peak flux (Pbol),the population distribution of the two other GRB promptvariables (Sbol & Pbol) are strongly affected by the detectorthreshold and not suitable for classifications based on fuzzyC-means algorithms. This is mainly due to the sensitivityof C-means clustering method to different subgroup sizes,orientations, and asymmetries (c.f., Shahmoradi 2013b, Sec.2.1 & Appendix A therein for details). In addition, the twoGRB populations are most distinctively separated in theplane of T90 − Ep. This classification led to the initial se-lection of 1366 events as LGRBs and 600 events as SGRBsin our sample of 1966 BATSE GRBs with complete promptemission data as illustrated in Figure 1, also in section 2.1of Shahmoradi (2013b).
To ensure minimal contamination of the two GRBclasses, the lightcurves of 291 bursts among 1966 BATSEGRBs with SGRB class coefficients in the range of 0.3− 0.7were also visually inspected in the four main energy channelsof BATSE Large Area Detectors. This led to reclassificationof some events as Soft Gamma Repeaters (SGRs) or fromone class to another, thus reducing the size of the originalSGRB sample to 565 (Table 1). 3 Shahmoradi (2013b) findsthat the inclusion of the uncertainties on the two GRB vari-ables T90 & Ep has marginal effects on the derived samplesof the two GRB classes discussed above. Also, a classifica-tion based on T50 instead of T90 resulted in about the samesample sizes for the two GRB classes with a minimal differ-ence of ∼ 0.7% (c.f., section 2.1, Appendix A and Figure (1)in Shahmoradi (2013b) for further comparison and detailsof different classification methods).
2.2 Model Construction
Our primary goal in this work is to derive a multivariate sta-tistical model that, subject to BATSE detection threshold, is
2 All BATSE GRB data are taken from the current BATSE
Catalog and the spectral peak energies (Ep) are taken
from Shahmoradi & Nemiroff (2010), publicly available at:https://sites.google.com/site/amshportal/research/aca/
in-the-news/lgrb-world-model.3 It is notable that the same simulation protocol for the origi-nal 600 BATSE events flagged as SGRBs did not result in any
qualitative change in the conclusions of this work, although thestrength and significance of the measured parameters of the modelare affected by the presence potential non-SGRB events in data.
capable of reproducing the observational data of 565 BATSESGRBs. Examples of multivariate treatment of GRB lumi-nosity function and energetics are rare in studies of Gamma-Ray Bursts. Conversely, many authors have focused primar-ily on the univariate distribution of the spectral parame-ters, most importantly on the luminosity function. This isparticularly true for the short population of GRBs wherethe prompt, afterglow and redshift information of individ-ual events are scarcely available. In Shahmoradi (2013b) weargued that an accurate modelling of the luminosity func-tion of LGRBs requires at least two GRB observable in-corporated in the model: the bolometric peak flux (Pbol)and the observed peak energy (Ep). The parameter Ep isrequired, since most gamma-ray detectors are photon coun-ters, a quantity that depends on not only Pbol but also Epof the burst. This leads to the requirement of using a bi-variate distribution as the minimum acceptable model forlong GRBs, for the purpose of constraining the luminosityfunction.
For the class of short GRBs, the duration distribution(e.g., T90) of the population spans a wide range from mil-liseconds to tens of seconds. The wide duration distribu-tion is particularly important in modeling BATSE LargeArea Detectors, since short GRBs could be potentially trig-gered on any of three triggering timescales: 64ms, 256ms& 1024ms. Therefore, a SGRB world model should mini-mally incorporate the joint trivariate distribution of Pbol,Ep and an appropriate definition of the observed duration(e.g., T90). The duration variable is required in order to cor-rectly account for the detection threshold of BATSE LADs.In addition, the definition of the observer-frame parame-ter bolometric peak flux (Pbol) and the corresponding rest-frame parameter Liso merits special attention in the studyof SGRBs. Here we use the 64ms definition of peak flux,Pbol,64, for SGRBs taken from BATSE catalog data, in con-trast to the two other common definitions: 256ms& 1024ms.Unlike the case for LGRBs (e.g., Shahmoradi 2013b), weshow in the addendum to this article (Appendix A & B)that Pbol,64 is the least biased measure of peak flux for themajority of BATSE SGRBs, also the best definition for anappropriate modelling of the BATSE detection threshold incase of short GRBs.
Hereafter in the text and figures, the two parame-ters Pbol and Liso implicitly refer to a 64ms definition ofpeak flux and luminosity wherever used for SGRBs and tothe commonly used 1024ms definitions wherever used forLGRBs.
Following the arguments of Shahmoradi (2013b) forLGRBs, we propose the multivariate log-normal distribu-tion as the simplest natural candidate model capable of de-scribing BATSE SGRB data. The motivation behind thischoice of model comes from the available observational datathat closely resembles a joint multivariate log-normal distri-bution for four most widely studied temporal and spectralparameters of both GRB classes in the observer-frame: Pbol,Sbol (bolometric fluence), Ep, T90: Since most SGRBs are
c© 2014 RAS, MNRAS 000, 1–23
Short vs. Long Gamma-Ray Bursts 5
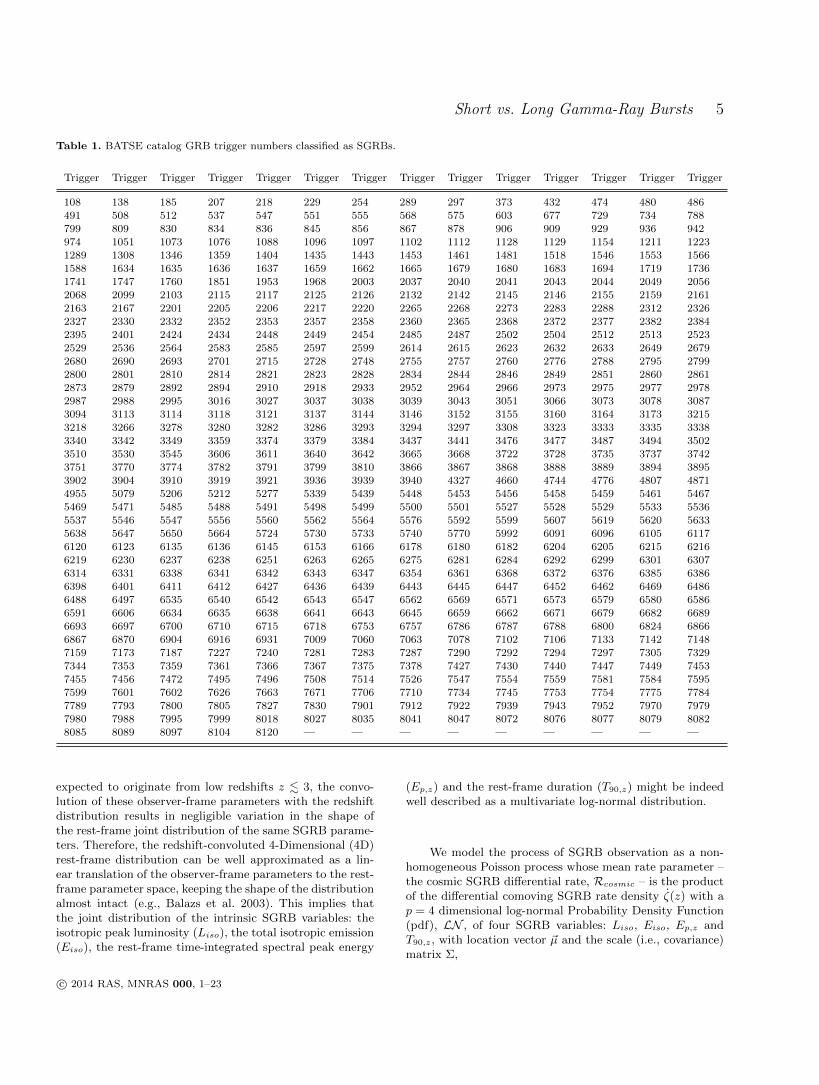
Table 1. BATSE catalog GRB trigger numbers classified as SGRBs.
Trigger Trigger Trigger Trigger Trigger Trigger Trigger Trigger Trigger Trigger Trigger Trigger Trigger Trigger
108 138 185 207 218 229 254 289 297 373 432 474 480 486491 508 512 537 547 551 555 568 575 603 677 729 734 788
799 809 830 834 836 845 856 867 878 906 909 929 936 942
974 1051 1073 1076 1088 1096 1097 1102 1112 1128 1129 1154 1211 12231289 1308 1346 1359 1404 1435 1443 1453 1461 1481 1518 1546 1553 1566
1588 1634 1635 1636 1637 1659 1662 1665 1679 1680 1683 1694 1719 1736
1741 1747 1760 1851 1953 1968 2003 2037 2040 2041 2043 2044 2049 20562068 2099 2103 2115 2117 2125 2126 2132 2142 2145 2146 2155 2159 2161
2163 2167 2201 2205 2206 2217 2220 2265 2268 2273 2283 2288 2312 2326
2327 2330 2332 2352 2353 2357 2358 2360 2365 2368 2372 2377 2382 23842395 2401 2424 2434 2448 2449 2454 2485 2487 2502 2504 2512 2513 2523
2529 2536 2564 2583 2585 2597 2599 2614 2615 2623 2632 2633 2649 2679
2680 2690 2693 2701 2715 2728 2748 2755 2757 2760 2776 2788 2795 27992800 2801 2810 2814 2821 2823 2828 2834 2844 2846 2849 2851 2860 2861
2873 2879 2892 2894 2910 2918 2933 2952 2964 2966 2973 2975 2977 29782987 2988 2995 3016 3027 3037 3038 3039 3043 3051 3066 3073 3078 3087
3094 3113 3114 3118 3121 3137 3144 3146 3152 3155 3160 3164 3173 3215
3218 3266 3278 3280 3282 3286 3293 3294 3297 3308 3323 3333 3335 33383340 3342 3349 3359 3374 3379 3384 3437 3441 3476 3477 3487 3494 3502
3510 3530 3545 3606 3611 3640 3642 3665 3668 3722 3728 3735 3737 3742
3751 3770 3774 3782 3791 3799 3810 3866 3867 3868 3888 3889 3894 38953902 3904 3910 3919 3921 3936 3939 3940 4327 4660 4744 4776 4807 4871
4955 5079 5206 5212 5277 5339 5439 5448 5453 5456 5458 5459 5461 5467
5469 5471 5485 5488 5491 5498 5499 5500 5501 5527 5528 5529 5533 55365537 5546 5547 5556 5560 5562 5564 5576 5592 5599 5607 5619 5620 5633
5638 5647 5650 5664 5724 5730 5733 5740 5770 5992 6091 6096 6105 6117
6120 6123 6135 6136 6145 6153 6166 6178 6180 6182 6204 6205 6215 62166219 6230 6237 6238 6251 6263 6265 6275 6281 6284 6292 6299 6301 6307
6314 6331 6338 6341 6342 6343 6347 6354 6361 6368 6372 6376 6385 6386
6398 6401 6411 6412 6427 6436 6439 6443 6445 6447 6452 6462 6469 64866488 6497 6535 6540 6542 6543 6547 6562 6569 6571 6573 6579 6580 6586
6591 6606 6634 6635 6638 6641 6643 6645 6659 6662 6671 6679 6682 66896693 6697 6700 6710 6715 6718 6753 6757 6786 6787 6788 6800 6824 6866
6867 6870 6904 6916 6931 7009 7060 7063 7078 7102 7106 7133 7142 7148
7159 7173 7187 7227 7240 7281 7283 7287 7290 7292 7294 7297 7305 73297344 7353 7359 7361 7366 7367 7375 7378 7427 7430 7440 7447 7449 7453
7455 7456 7472 7495 7496 7508 7514 7526 7547 7554 7559 7581 7584 7595
7599 7601 7602 7626 7663 7671 7706 7710 7734 7745 7753 7754 7775 77847789 7793 7800 7805 7827 7830 7901 7912 7922 7939 7943 7952 7970 7979
7980 7988 7995 7999 8018 8027 8035 8041 8047 8072 8076 8077 8079 8082
8085 8089 8097 8104 8120 — — — — — — — — —
expected to originate from low redshifts z . 3, the convo-lution of these observer-frame parameters with the redshiftdistribution results in negligible variation in the shape ofthe rest-frame joint distribution of the same SGRB parame-ters. Therefore, the redshift-convoluted 4-Dimensional (4D)rest-frame distribution can be well approximated as a lin-ear translation of the observer-frame parameters to the rest-frame parameter space, keeping the shape of the distributionalmost intact (e.g., Balazs et al. 2003). This implies thatthe joint distribution of the intrinsic SGRB variables: theisotropic peak luminosity (Liso), the total isotropic emission(Eiso), the rest-frame time-integrated spectral peak energy
(Ep,z) and the rest-frame duration (T90,z) might be indeedwell described as a multivariate log-normal distribution.
We model the process of SGRB observation as a non-homogeneous Poisson process whose mean rate parameter –the cosmic SGRB differential rate, Rcosmic – is the productof the differential comoving SGRB rate density ζ(z) with ap = 4 dimensional log-normal Probability Density Function(pdf), LN , of four SGRB variables: Liso, Eiso, Ep,z andT90,z, with location vector ~µ and the scale (i.e., covariance)matrix Σ,
c© 2014 RAS, MNRAS 000, 1–23
6 Shahmoradi and Nemiroff
Rcosmic =dN
dLiso dEiso dEp,z dT90,z dz(1)
∝ LN(Liso, Eiso, Ep,z, T90,z
∣∣~µ,Σ)× ζ(z)dV/dz
(1 + z),
where ζ(z) is the comoving SGRB rate density, and thefactor (1 + z) in the denominator accounts for cosmologi-cal time dilation. The comoving volume element per unitredshift, dV/dz, is given by,
dV
dz=
C
H0
4πDL2(z)
(1 + z)2
[ΩM (1 + z)3 + ΩΛ
]1/2, (2)
with DL standing for the luminosity distance,
DL(z) =C
H0(1 + z)
∫ z
0
dz′[(1 + z′)3ΩM + ΩΛ
]−1/2
, (3)
assuming a flat ΛCDM cosmology, with parameters setto h = 0.70, ΩM = 0.27 and ΩΛ = 0.73 (Jarosik et al. 2011)for consistency with the work of Shahmoradi (2013b). Theparameters C & H0 = 100h [Km/s/MPc] stand for thespeed of light and the Hubble constant respectively.
The 4-dimensional log-normal distribution of Equation(1), LN , has an intimate connection to the multivariateGaussian distribution in the logarithmic space of SGRBobservable parameters (c.f., Appendix D in Shahmoradi2013b).
Finally, in order to obtain the observed rate (Robs) ofSGRBs detected by BATSE LADs, the cosmic SGRB rate,Rcosmic, in Equation (1) must be convolved with an accuratemodel of BATSE trigger efficiency for short GRBs, η,
Robs = η(Liso, Ep,z, T90,z, z)×Rcosmic (4)
In reality, the variable η is a highly complex functionof observational conditions and prompt emission character-istics, almost unique to each individual GRB. Nevertheless,we show in Appendix A that it can be approximated as ageneric function of the burst’s redshift (z), isotropic lumi-nosity (Liso), the rest-frame spectral peak energy (Ep,z) andthe rest-frame duration (T90,z).
2.3 The SGRB Rate Density
The largest source of uncertainty in population studiesof short GRBs originates from the lack of an accurateknowledge of their cosmic rate. Only a small fraction ofheterogeneously-detected SGRBs have measured redshiftsto this date (e.g., Coward et al. 2012) and redshift com-pleteness often limits studies to the brightest events (e.g.,D’Avanzo et al. 2014). It is therefore, perceivable that the
current observed redshift distribution of SGRBs is likelystrongly biased and not representative of the entire pop-ulation of SGRBs (e.g., Nakar 2007; Coward et al. 2013).An alternative approach to empirical determination of therate of SGRBs is through population synthesis simulations(e.g., Belczynski et al. 2006), based on the assumption of‘compact binary mergers’ as the progenitor of the majorityof SGRBs (e.g., Narayan, Paczynski & Piran 1992; Eichleret al. 1989; Paczynski 1986). In this scenario, the cosmic rateof SGRBs follows the Star Formation Rate (SFR) convolvedwith a distribution of the delay time between the formationof a binary system and its coalescence due to gravitationalradiation.
There is currently no consensus on the statistical mo-ments and shape of the delay time distribution, solely basedon observations of individual events and their host galaxies.The median delays vary widely in the range of ∼ 0.1−7 bil-lion years depending on the assumptions involved in estima-tion methods or in the dominant binary formation channelsconsidered (e.g., Belczynski et al. 2006; Hopman et al. 2006;Bogomazov, Lipunov & Tutukov 2007; Berger et al. 2007;Zheng & Ramirez-Ruiz 2007; Berger 2011; Hao & Yuan 2013;Guelbenzu et al. 2014). Recent results from population syn-thesis simulations however, favor very short delay times ofa few hundred million years with a long negligible tail to-wards several billion years (e.g., O’Shaughnessy, Belczynski& Kalogera 2008; Belczynski et al. 2010).
The computational expenses and limitations imposedon this work strongly limit the number of possible scenariosthat could be considered for the cosmic rate of short GRBs.Thus, in order to approximate the comoving rate densityζ(z) of SGRBs, we adopt the Star Formation Rate (SFR) ofHopkins & Beacom (2006) in the form of a piecewise power-law function,
SFR(z) ∝
(1 + z)γ0 z < z0
(1 + z)γ1 z0 < z < z1
(1 + z)γ2 z > z1,
(5)
with parameters (z0, z1, γ0, γ1, γ2) set to the best-fit val-ues (0.993, 3.8, 3.3, 0.055,−4.46) of an updated SFR fit by Li(2008). The SFR is then convolved with a log-normal modelof the delay time distribution (e.g., Nakar 2007),
LN (τ |µ, σ) ∝ 1
τσe− (ln τ−µ)2
2σ2 (6)
with parameters [µ, σ] = [log(0.1), 1.12] in units of bil-lion years (Gyrs) estimated from the population synthesissimulation results of (e.g., Belczynski et al. 2010), such thatthe comoving rate density of SGRBs is calculated as,
ζ(z) ∝∫ ∞z
SFR(z′)LN
(t(z)− t(z′)
) dtdz′
dz′, (7)
with the universe’s age t(z) at redshift z given by,
c© 2014 RAS, MNRAS 000, 1–23

Short vs. Long Gamma-Ray Bursts 7
t(z) =1
H0
∫ ∞z
dz′
(1 + z′)√
(1 + z′)3ΩM + ΩΛ
, (8)
We also fit data with alternative cosmic rates of SGRBs,assuming that SGRBs follow SFR of Hopkins & Beacom(2006) or the convolution of SFR with a long mergerdelay time of log-normal form with parameters [µ, σ] =[log(4.0Gyrs), 0.3] as suggested by Nakar (2007). For all red-shift scenarios, we find that the resulting best-fit parametersare qualitatively the same, although some parameters mayexhibit quantitative differences at > 1σ significance level.
2.4 Model Fitting
Now, with a statistical model at hand for the observed rate ofshort GRBs (i.e., Equation 4), we proceed to obtain the bestfit parameters of the model to BATSE short GRBs data.In principle, any model fitting must take into account theobservational uncertainties and any prior knowledge fromindependent sources, which can be achieved via Bayesianmultilevel methodology (e.g., Hobson et al. 2010). This isdone by first constructing the likelihood function, takinginto account the uncertainties in observational data (e.g.,Loredo 2004): Under the assumption of symmetric Gaussianuncertainties, as it is the case with BATSE catalog data,the full Poisson likelihood of data O given the parameters~µ,Σ of the SGRB world model in Eqns. 1 & 4 can bewritten as,
L(O | ~µ,Σ
)= AN
× exp
(−A
∫~Ospace
Robs(~O | ~µ,Σ, η
)d ~O
)
×565∏i=1
∫~Ospace
Rcosmic(~O | ~µ,Σ
)× Li
(~O | O(~µi,Σi)
)d ~O, (9)
in which A is a factor that properly normalizes thecosmic rate of SGRBs (Rcosmic) and the vector O(~µi,Σi),standing for the ith SGRB Observation in BATSE cata-log, has the likelihood Li of having the true parameters~O ≡
[Liso, Eiso, Ep,z, T90,z
]in the rest-frame 4-dimensional
observation space ( ~Ospace) that can be described as a Gaus-sian probability density function with parameters ~µi,Σiobtained from BATSE catalog such that,
Li(~O)∼ N ( ~O|~µi,Σi), (10)
In this sense, the term Rcosmic in Equation 9 acts as aBayesian prior for Li. In the absence of this prior knowledgehowever, as it is the case with BATSE short GRBs, theEmpirical Bayes approach provides an alternative solution,in which an ad hoc estimate of the model parameters ~µ,Σbased on the observed data – excluding uncertainties – serves
as the prior for the same data – including uncertainties – atthe second level of analysis (e.g., Hobson et al. 2010). Thejoint posterior of the unknown parameters of the model canbe then written as,
P(~µ,Σ|O
)= P
(~µ,Σ
)× L
(O|~µ,Σ
), (11)
As for the choice of hyperprior, P(~µ,Σ
), we adopt the
noninformative uniform prior for the mean vector ~µ. A va-riety of noninformative or weakly-informative priors for thecovariance matrix Σ have been already proposed and consid-ered in the literature, with Inverse Wishart familty of distri-butions among the most popular choices (c.f., John Barnard(2000) and references therein). Here, to avoid problems andcomplications associated with Inverse Wishart priors, weadopt a separation strategy (e.g., Browne 2006) by decom-posing the covariance matrix Σ into a correlation matrixand a set of standard deviations. We then use uniform pri-ors on the log-transformation of all standard deviations, alsoon the Fisher-transformation (Fisher 1915) of all correlationcoefficients.
Due to the complex truncation imposed on SGRB dataand the world model by BATSE detection threshold (c.f.,Appendix A), maximization of the likelihood function ofEqn. 9 is analytically intractable. Calculation of the nor-malization factor A by itself requires a multivariate integralover the 4-dimensional space of SGRB variables at any givenredshift. In addition, due to lack of redshift (z) informa-tion for BATSE SGRBs, the probability for observation ofeach SGRB given the model parameters must be marginal-ized over all possible redshifts. These numerical integrationsmake sampling from the posterior distribution of Eqn. 11an extremely difficult task. Given the potential presence ofunknown systematic biases in BATSE catalog data as dis-cussed in Appendix B, (also by Koshut et al. 1996; Hakkilaet al. 2000c, 2003; Shahmoradi 2013b, Appendix C) and thehigh level of uncertainty in the redshift distribution of shortGRBs, we take a bold but reasonable and highly simplifyingstep and drop data uncertainties in the calculation of thelikelihood function (Eqn. 9) in order to bring the probleminto the realm of current computational technologies. Thejoint posterior distribution of the model parameters is thenobtained by iterative sampling using a variant of MarkovChain Monte Carlo (MCMC) techniques known as Adap-tive Metropolis-Hastings (e.g., Haario, Saksman & Tammi-nen 2001). To further the efficiency of MCMC sampling, weimplement all algorithms in Fortran (Backus 1978; Metcalf,Reid & Cohen 2011) and approximate the numerical inte-gration in the definition of the luminosity distance of Eqn.3 by the analytical expressions of Wickramasinghe & Uk-watta (2010). This integration is encountered on the orderof billion times during MCMC sampling from the posteriordistribution (c.f., Appendix C in Shahmoradi (2013b) forfurther details of the MCMC sampling method).4
4 The entire simulation codes and algorithms will be available for
c© 2014 RAS, MNRAS 000, 1–23
8 Shahmoradi and Nemiroff
Table 2. Mean best-fit parameters of SGRB World Model, com-pared to LGRB world model of Shahmoradi (2013b).
Parameter SGRBs World Model LGRBs World Model
Redshift Parameters (Equation 5)
z0 0.993 0.993
z1 3.8 3.8
γ0 3.3 3.3γ1 0.0549 0.0549
γ2 −4.46 −4.46
Log-normal Merger Delay (Equation 6)
µdelay 0.1 –σdelay 1.12 –
Location Parameters
log(Liso) 51.88 ± 0.16 51.54 ± 0.18
log(Eiso) 50.93 ± 0.19 51.98 ± 0.18log(Ep,z) 2.98 ± 0.05 2.48 ± 0.05
log(T90,z) −0.74 ± 0.08 1.12 ± 0.03
Scale Parameters
log(σLiso ) −0.36 ± 0.06 −0.25 ± 0.06log(σEiso ) −0.10 ± 0.04 −0.08 ± 0.03
log(σEp,z ) −0.39 ± 0.02 −0.44 ± 0.02
log(σT90,z) −0.24 ± 0.02 −0.37 ± 0.01
Correlation Coefficients
ρLiso−Eiso 0.91 ± 0.03 0.94 ± 0.01
ρLiso−Ep,z 0.51 ± 0.10 0.45 ± 0.07
ρLiso−T90,z0.50 ± 0.09 0.48 ± 0.09
ρEiso−Ep,z 0.60 ± 0.06 0.58 ± 0.04
ρEiso−T90,z0.63 ± 0.05 0.60 ± 0.05
ρEp,z−T90,z0.12 ± 0.06 0.31 ± 0.04
BATSE Detection Efficiency (Eqn. A5)
µthresh −0.25 ± 0.03 −0.45 ± 0.02
log(σthresh) −0.86 ± 0.05 −0.90 ± 0.05
Note.— The full Markov Chain sampling of the aboveparameters from the 16-dimensional parameter spaceof the likelihood function are available for download at
https://sites.google.com/site/amshportal/research/aca/
in-the-news/lgrb-world-model for the LGRB world model and
at https://bitbucket.org/AmirShahmoradi/grbworldmodel for
SGRBs world model.
3 RESULTS & GOODNESS-OF-FIT TESTS
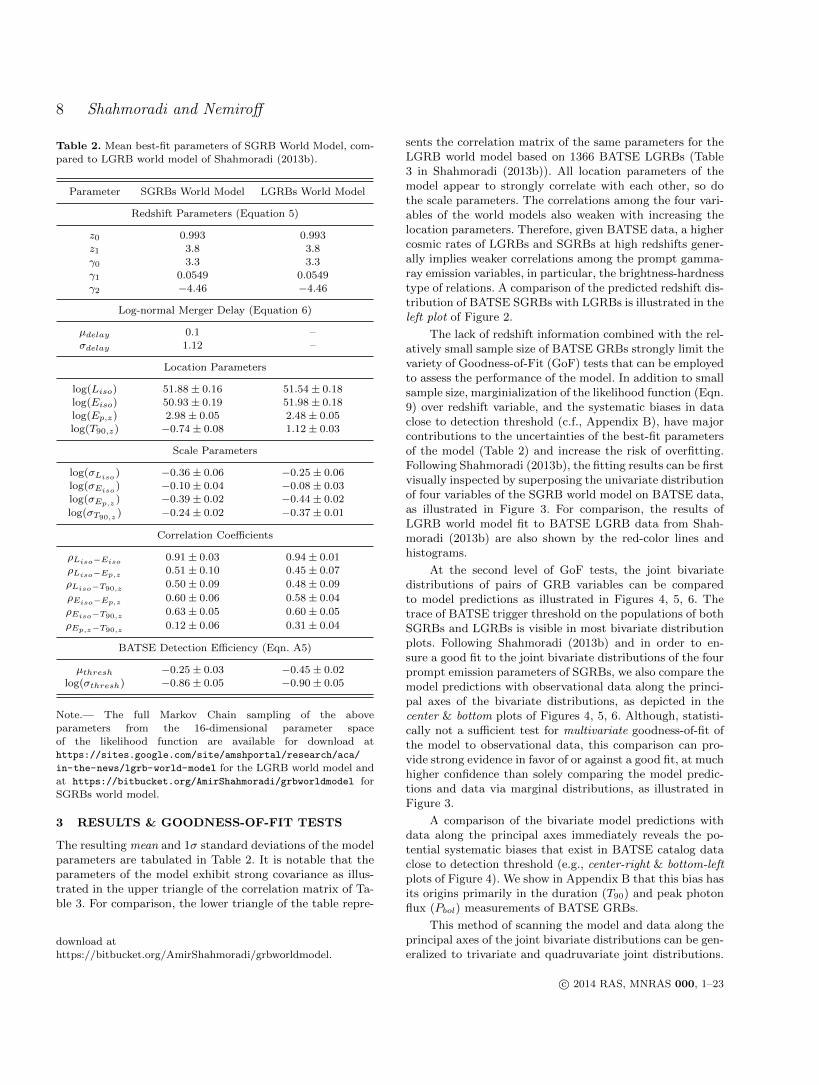
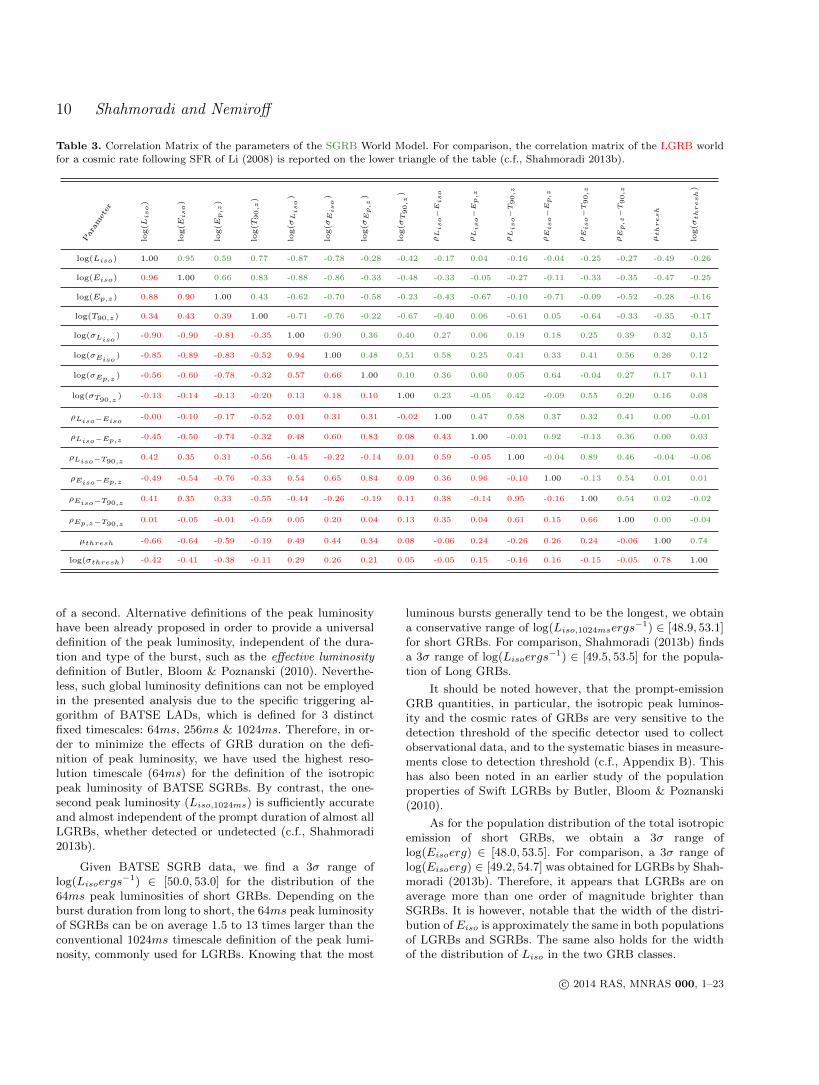
The resulting mean and 1σ standard deviations of the modelparameters are tabulated in Table 2. It is notable that theparameters of the model exhibit strong covariance as illus-trated in the upper triangle of the correlation matrix of Ta-ble 3. For comparison, the lower triangle of the table repre-
download at
https://bitbucket.org/AmirShahmoradi/grbworldmodel.
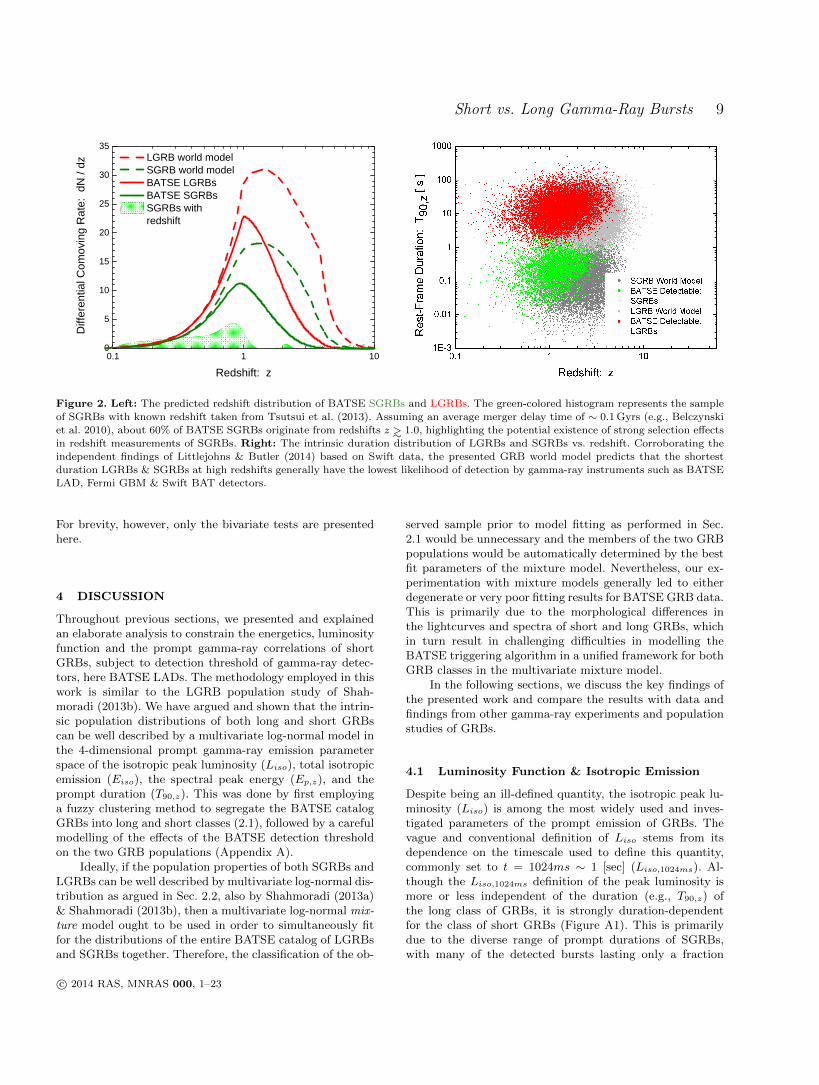
sents the correlation matrix of the same parameters for theLGRB world model based on 1366 BATSE LGRBs (Table3 in Shahmoradi (2013b)). All location parameters of themodel appear to strongly correlate with each other, so dothe scale parameters. The correlations among the four vari-ables of the world models also weaken with increasing thelocation parameters. Therefore, given BATSE data, a highercosmic rates of LGRBs and SGRBs at high redshifts gener-ally implies weaker correlations among the prompt gamma-ray emission variables, in particular, the brightness-hardnesstype of relations. A comparison of the predicted redshift dis-tribution of BATSE SGRBs with LGRBs is illustrated in theleft plot of Figure 2.
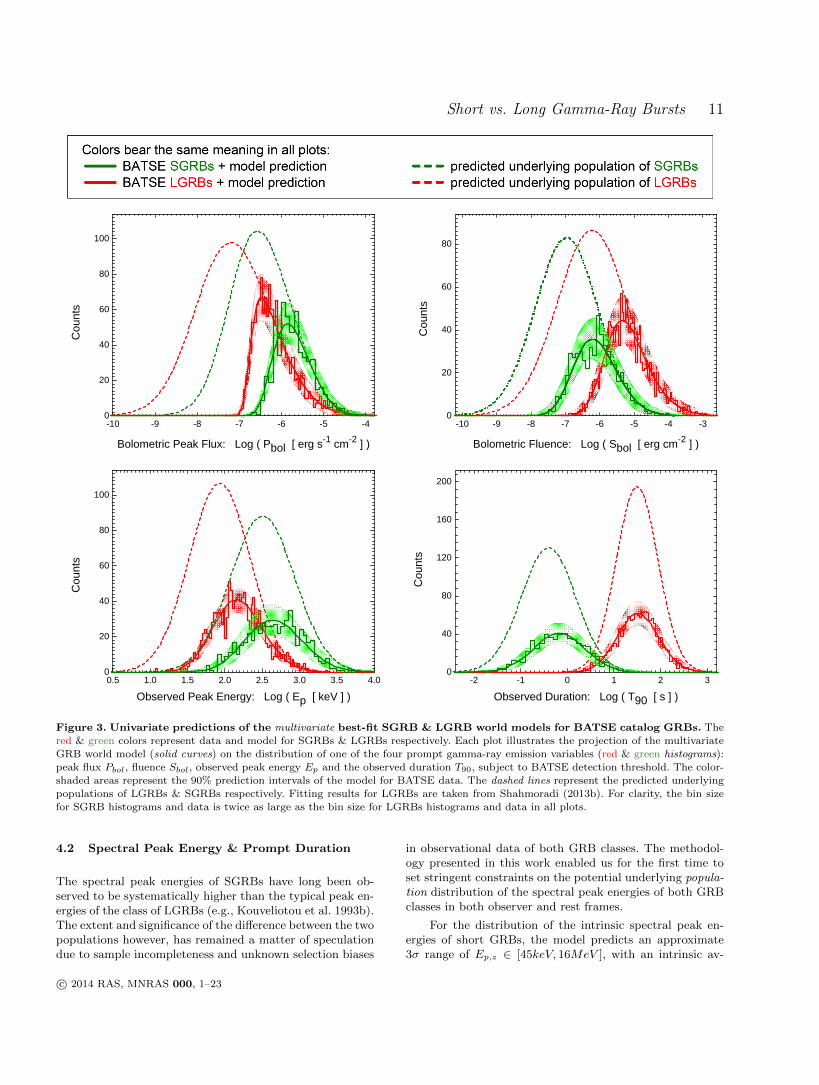
The lack of redshift information combined with the rel-atively small sample size of BATSE GRBs strongly limit thevariety of Goodness-of-Fit (GoF) tests that can be employedto assess the performance of the model. In addition to smallsample size, marginialization of the likelihood function (Eqn.9) over redshift variable, and the systematic biases in dataclose to detection threshold (c.f., Appendix B), have majorcontributions to the uncertainties of the best-fit parametersof the model (Table 2) and increase the risk of overfitting.Following Shahmoradi (2013b), the fitting results can be firstvisually inspected by superposing the univariate distributionof four variables of the SGRB world model on BATSE data,as illustrated in Figure 3. For comparison, the results ofLGRB world model fit to BATSE LGRB data from Shah-moradi (2013b) are also shown by the red-color lines andhistograms.
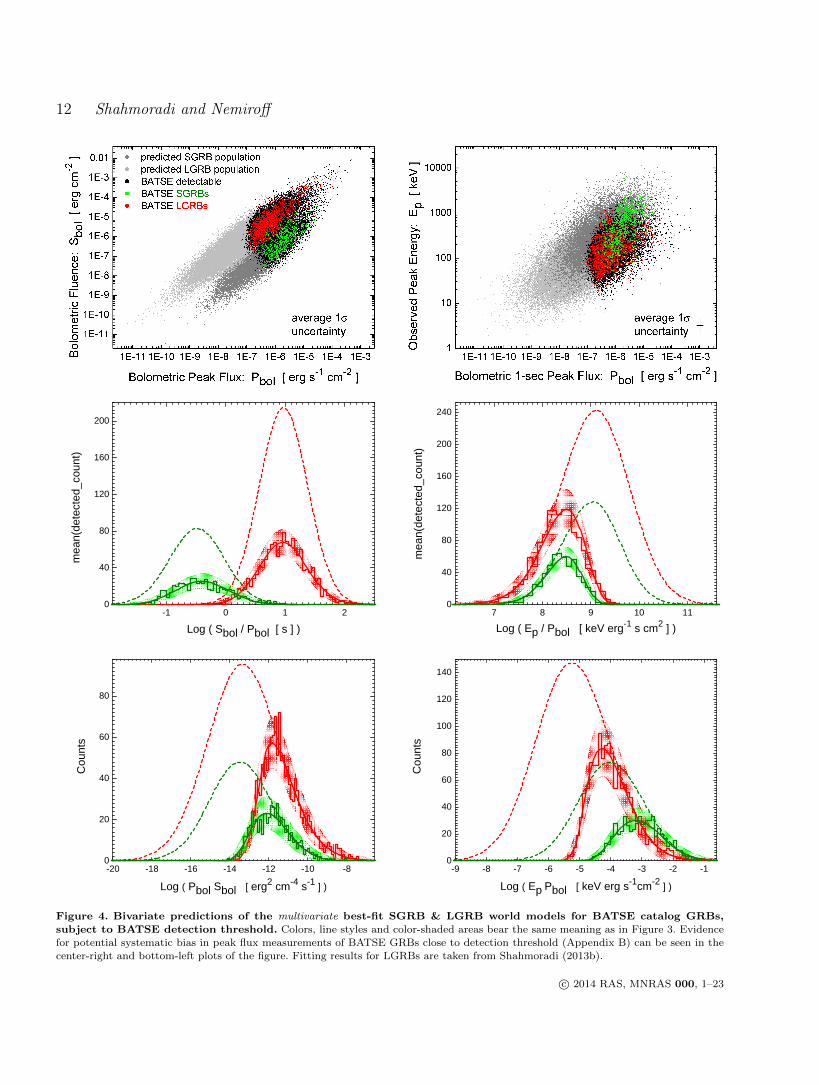
At the second level of GoF tests, the joint bivariatedistributions of pairs of GRB variables can be comparedto model predictions as illustrated in Figures 4, 5, 6. Thetrace of BATSE trigger threshold on the populations of bothSGRBs and LGRBs is visible in most bivariate distributionplots. Following Shahmoradi (2013b) and in order to en-sure a good fit to the joint bivariate distributions of the fourprompt emission parameters of SGRBs, we also compare themodel predictions with observational data along the princi-pal axes of the bivariate distributions, as depicted in thecenter & bottom plots of Figures 4, 5, 6. Although, statisti-cally not a sufficient test for multivariate goodness-of-fit ofthe model to observational data, this comparison can pro-vide strong evidence in favor of or against a good fit, at muchhigher confidence than solely comparing the model predic-tions and data via marginal distributions, as illustrated inFigure 3.
A comparison of the bivariate model predictions withdata along the principal axes immediately reveals the po-tential systematic biases that exist in BATSE catalog dataclose to detection threshold (e.g., center-right & bottom-leftplots of Figure 4). We show in Appendix B that this bias hasits origins primarily in the duration (T90) and peak photonflux (Pbol) measurements of BATSE GRBs.
This method of scanning the model and data along theprincipal axes of the joint bivariate distributions can be gen-eralized to trivariate and quadruvariate joint distributions.
c© 2014 RAS, MNRAS 000, 1–23
Short vs. Long Gamma-Ray Bursts 9
0.1 1 100
5
10
15
20
25
30
35 LGRB world model SGRB world model BATSE LGRBs BATSE SGRBs SGRBs with
redshift
Diff
eren
tial C
omov
ing
Rat
e: d
N /
dz
Redshift: z
Figure 2. Left: The predicted redshift distribution of BATSE SGRBs and LGRBs. The green-colored histogram represents the sampleof SGRBs with known redshift taken from Tsutsui et al. (2013). Assuming an average merger delay time of ∼ 0.1 Gyrs (e.g., Belczynski
et al. 2010), about 60% of BATSE SGRBs originate from redshifts z ∼> 1.0, highlighting the potential existence of strong selection effects
in redshift measurements of SGRBs. Right: The intrinsic duration distribution of LGRBs and SGRBs vs. redshift. Corroborating theindependent findings of Littlejohns & Butler (2014) based on Swift data, the presented GRB world model predicts that the shortest
duration LGRBs & SGRBs at high redshifts generally have the lowest likelihood of detection by gamma-ray instruments such as BATSE
LAD, Fermi GBM & Swift BAT detectors.
For brevity, however, only the bivariate tests are presentedhere.
4 DISCUSSION
Throughout previous sections, we presented and explainedan elaborate analysis to constrain the energetics, luminosityfunction and the prompt gamma-ray correlations of shortGRBs, subject to detection threshold of gamma-ray detec-tors, here BATSE LADs. The methodology employed in thiswork is similar to the LGRB population study of Shah-moradi (2013b). We have argued and shown that the intrin-sic population distributions of both long and short GRBscan be well described by a multivariate log-normal model inthe 4-dimensional prompt gamma-ray emission parameterspace of the isotropic peak luminosity (Liso), total isotropicemission (Eiso), the spectral peak energy (Ep,z), and theprompt duration (T90,z). This was done by first employinga fuzzy clustering method to segregate the BATSE catalogGRBs into long and short classes (2.1), followed by a carefulmodelling of the effects of the BATSE detection thresholdon the two GRB populations (Appendix A).
Ideally, if the population properties of both SGRBs andLGRBs can be well described by multivariate log-normal dis-tribution as argued in Sec. 2.2, also by Shahmoradi (2013a)& Shahmoradi (2013b), then a multivariate log-normal mix-ture model ought to be used in order to simultaneously fitfor the distributions of the entire BATSE catalog of LGRBsand SGRBs together. Therefore, the classification of the ob-
served sample prior to model fitting as performed in Sec.2.1 would be unnecessary and the members of the two GRBpopulations would be automatically determined by the bestfit parameters of the mixture model. Nevertheless, our ex-perimentation with mixture models generally led to eitherdegenerate or very poor fitting results for BATSE GRB data.This is primarily due to the morphological differences inthe lightcurves and spectra of short and long GRBs, whichin turn result in challenging difficulties in modelling theBATSE triggering algorithm in a unified framework for bothGRB classes in the multivariate mixture model.
In the following sections, we discuss the key findings ofthe presented work and compare the results with data andfindings from other gamma-ray experiments and populationstudies of GRBs.
4.1 Luminosity Function & Isotropic Emission
Despite being an ill-defined quantity, the isotropic peak lu-minosity (Liso) is among the most widely used and inves-tigated parameters of the prompt emission of GRBs. Thevague and conventional definition of Liso stems from itsdependence on the timescale used to define this quantity,commonly set to t = 1024ms ∼ 1 [sec] (Liso,1024ms). Al-though the Liso,1024ms definition of the peak luminosity ismore or less independent of the duration (e.g., T90,z) ofthe long class of GRBs, it is strongly duration-dependentfor the class of short GRBs (Figure A1). This is primarilydue to the diverse range of prompt durations of SGRBs,with many of the detected bursts lasting only a fraction
c© 2014 RAS, MNRAS 000, 1–23
10 Shahmoradi and Nemiroff
Table 3. Correlation Matrix of the parameters of the SGRB World Model. For comparison, the correlation matrix of the LGRB worldfor a cosmic rate following SFR of Li (2008) is reported on the lower triangle of the table (c.f., Shahmoradi 2013b).
Para
met
er
log(Liso)
log(Eiso)
log(Ep,z
)
log(T
90,z
)
log(σLiso
)
log(σEiso
)
log(σEp,z
)
log(σT90,z
)
ρLiso−Eiso
ρLiso−Ep,z
ρLiso−T90,z
ρEiso−Ep,z
ρEiso−T90,z
ρEp,z
−T90,z
µthresh
log(σthresh
)
log(Liso) 1.00 0.95 0.59 0.77 -0.87 -0.78 -0.28 -0.42 -0.17 0.04 -0.16 -0.04 -0.25 -0.27 -0.49 -0.26
log(Eiso) 0.96 1.00 0.66 0.83 -0.88 -0.86 -0.33 -0.48 -0.33 -0.05 -0.27 -0.11 -0.33 -0.35 -0.47 -0.25
log(Ep,z) 0.88 0.90 1.00 0.43 -0.62 -0.70 -0.58 -0.23 -0.43 -0.67 -0.10 -0.71 -0.09 -0.52 -0.28 -0.16
log(T90,z) 0.34 0.43 0.39 1.00 -0.71 -0.76 -0.22 -0.67 -0.40 0.06 -0.61 0.05 -0.64 -0.33 -0.35 -0.17
log(σLiso ) -0.90 -0.90 -0.81 -0.35 1.00 0.90 0.36 0.40 0.27 0.06 0.19 0.18 0.25 0.39 0.32 0.15
log(σEiso ) -0.85 -0.89 -0.83 -0.52 0.94 1.00 0.48 0.51 0.58 0.25 0.41 0.33 0.41 0.56 0.26 0.12
log(σEp,z ) -0.56 -0.60 -0.78 -0.32 0.57 0.66 1.00 0.10 0.36 0.60 0.05 0.64 -0.04 0.27 0.17 0.11
log(σT90,z ) -0.13 -0.14 -0.13 -0.20 0.13 0.18 0.10 1.00 0.23 -0.05 0.42 -0.09 0.55 0.20 0.16 0.08
ρLiso−Eiso -0.00 -0.10 -0.17 -0.52 0.01 0.31 0.31 -0.02 1.00 0.47 0.58 0.37 0.32 0.41 0.00 -0.01
ρLiso−Ep,z -0.45 -0.50 -0.74 -0.32 0.48 0.60 0.83 0.08 0.43 1.00 -0.01 0.92 -0.13 0.36 0.00 0.03
ρLiso−T90,z 0.42 0.35 0.31 -0.56 -0.45 -0.22 -0.14 0.01 0.59 -0.05 1.00 -0.04 0.89 0.46 -0.04 -0.06
ρEiso−Ep,z -0.49 -0.54 -0.76 -0.33 0.54 0.65 0.84 0.09 0.36 0.96 -0.10 1.00 -0.13 0.54 0.01 0.01
ρEiso−T90,z 0.41 0.35 0.33 -0.55 -0.44 -0.26 -0.19 0.11 0.38 -0.14 0.95 -0.16 1.00 0.54 0.02 -0.02
ρEp,z−T90,z 0.01 -0.05 -0.01 -0.59 0.05 0.20 0.04 0.13 0.35 0.04 0.61 0.15 0.66 1.00 0.00 -0.04
µthresh -0.66 -0.64 -0.59 -0.19 0.49 0.44 0.34 0.08 -0.06 0.24 -0.26 0.26 0.24 -0.06 1.00 0.74
log(σthresh) -0.42 -0.41 -0.38 -0.11 0.29 0.26 0.21 0.05 -0.05 0.15 -0.16 0.16 -0.15 -0.05 0.78 1.00
of a second. Alternative definitions of the peak luminosityhave been already proposed in order to provide a universaldefinition of the peak luminosity, independent of the dura-tion and type of the burst, such as the effective luminositydefinition of Butler, Bloom & Poznanski (2010). Neverthe-less, such global luminosity definitions can not be employedin the presented analysis due to the specific triggering al-gorithm of BATSE LADs, which is defined for 3 distinctfixed timescales: 64ms, 256ms & 1024ms. Therefore, in or-der to minimize the effects of GRB duration on the defi-nition of peak luminosity, we have used the highest reso-lution timescale (64ms) for the definition of the isotropicpeak luminosity of BATSE SGRBs. By contrast, the one-second peak luminosity (Liso,1024ms) is sufficiently accurateand almost independent of the prompt duration of almost allLGRBs, whether detected or undetected (c.f., Shahmoradi2013b).
Given BATSE SGRB data, we find a 3σ range oflog(Lisoergs
−1) ∈ [50.0, 53.0] for the distribution of the64ms peak luminosities of short GRBs. Depending on theburst duration from long to short, the 64ms peak luminosityof SGRBs can be on average 1.5 to 13 times larger than theconventional 1024ms timescale definition of the peak lumi-nosity, commonly used for LGRBs. Knowing that the most
luminous bursts generally tend to be the longest, we obtaina conservative range of log(Liso,1024msergs
−1) ∈ [48.9, 53.1]for short GRBs. For comparison, Shahmoradi (2013b) findsa 3σ range of log(Lisoergs
−1) ∈ [49.5, 53.5] for the popula-tion of Long GRBs.
It should be noted however, that the prompt-emissionGRB quantities, in particular, the isotropic peak luminos-ity and the cosmic rates of GRBs are very sensitive to thedetection threshold of the specific detector used to collectobservational data, and to the systematic biases in measure-ments close to detection threshold (c.f., Appendix B). Thishas also been noted in an earlier study of the populationproperties of Swift LGRBs by Butler, Bloom & Poznanski(2010).
As for the population distribution of the total isotropicemission of short GRBs, we obtain a 3σ range oflog(Eisoerg) ∈ [48.0, 53.5]. For comparison, a 3σ range oflog(Eisoerg) ∈ [49.2, 54.7] was obtained for LGRBs by Shah-moradi (2013b). Therefore, it appears that LGRBs are onaverage more than one order of magnitude brighter thanSGRBs. It is however, notable that the width of the distri-bution of Eiso is approximately the same in both populationsof LGRBs and SGRBs. The same also holds for the widthof the distribution of Liso in the two GRB classes.
c© 2014 RAS, MNRAS 000, 1–23
Short vs. Long Gamma-Ray Bursts 11
-10 -9 -8 -7 -6 -5 -40
20
40
60
80
100
Cou
nts
Bolometric Peak Flux: Log ( Pbol [ erg s-1 cm-2 ] )
-10 -9 -8 -7 -6 -5 -4 -30
20
40
60
80
Cou
nts
Bolometric Fluence: Log ( Sbol [ erg cm-2 ] )
0.5 1.0 1.5 2.0 2.5 3.0 3.5 4.00
20
40
60
80
100
Cou
nts
Observed Peak Energy: Log ( Ep [ keV ] )-2 -1 0 1 2 3
0
40
80
120
160
200
Cou
nts
Observed Duration: Log ( T90 [ s ] )
Figure 3. Univariate predictions of the multivariate best-fit SGRB & LGRB world models for BATSE catalog GRBs. Thered & green colors represent data and model for SGRBs & LGRBs respectively. Each plot illustrates the projection of the multivariate
GRB world model (solid curves) on the distribution of one of the four prompt gamma-ray emission variables (red & green histograms):peak flux Pbol, fluence Sbol, observed peak energy Ep and the observed duration T90, subject to BATSE detection threshold. The color-
shaded areas represent the 90% prediction intervals of the model for BATSE data. The dashed lines represent the predicted underlyingpopulations of LGRBs & SGRBs respectively. Fitting results for LGRBs are taken from Shahmoradi (2013b). For clarity, the bin sizefor SGRB histograms and data is twice as large as the bin size for LGRBs histograms and data in all plots.
4.2 Spectral Peak Energy & Prompt Duration
The spectral peak energies of SGRBs have long been ob-served to be systematically higher than the typical peak en-ergies of the class of LGRBs (e.g., Kouveliotou et al. 1993b).The extent and significance of the difference between the twopopulations however, has remained a matter of speculationdue to sample incompleteness and unknown selection biases
in observational data of both GRB classes. The methodol-ogy presented in this work enabled us for the first time toset stringent constraints on the potential underlying popula-tion distribution of the spectral peak energies of both GRBclasses in both observer and rest frames.
For the distribution of the intrinsic spectral peak en-ergies of short GRBs, the model predicts an approximate3σ range of Ep,z ∈ [45keV, 16MeV ], with an intrinsic av-
c© 2014 RAS, MNRAS 000, 1–23
12 Shahmoradi and Nemiroff
-1 0 1 20
40
80
120
160
200
mea
n(de
tect
ed_c
ount
)
Log ( Sbol / Pbol [ s ] )7 8 9 10 11
0
40
80
120
160
200
240
mea
n(de
tect
ed_c
ount
)
Log ( Ep / Pbol [ keV erg-1 s cm2 ] )
-20 -18 -16 -14 -12 -10 -80
20
40
60
80
Cou
nts
Log ( Pbol Sbol [ erg2 cm-4 s-1 ] )
-9 -8 -7 -6 -5 -4 -3 -2 -10
20
40
60
80
100
120
140
Cou
nts
Log ( Ep Pbol [ keV erg s-1cm-2 ] )
Figure 4. Bivariate predictions of the multivariate best-fit SGRB & LGRB world models for BATSE catalog GRBs,subject to BATSE detection threshold. Colors, line styles and color-shaded areas bear the same meaning as in Figure 3. Evidence
for potential systematic bias in peak flux measurements of BATSE GRBs close to detection threshold (Appendix B) can be seen in thecenter-right and bottom-left plots of the figure. Fitting results for LGRBs are taken from Shahmoradi (2013b).
c© 2014 RAS, MNRAS 000, 1–23
Short vs. Long Gamma-Ray Bursts 13
4 5 6 7 8 9 10 110
40
80
120
160
Cou
nts
Log ( T90 / Pbol [ erg-1 cm2 s2 ] )5 6 7 8 9 10 11 12
0
40
80
120
160
200
Cou
nts
Log ( Ep / Sbol [ keV erg-1 cm2 ] )
-10 -9 -8 -7 -6 -5 -4 -3 -20
20
40
60
80
100
120
140
160
180
Cou
nts
Log ( T90 Pbol [ erg cm-2 ] )
-8 -7 -6 -5 -4 -3 -2 -1 00
20
40
60
80
100
120
140
Cou
nts
Log ( Ep Sbol [ keV erg cm-2 ] )
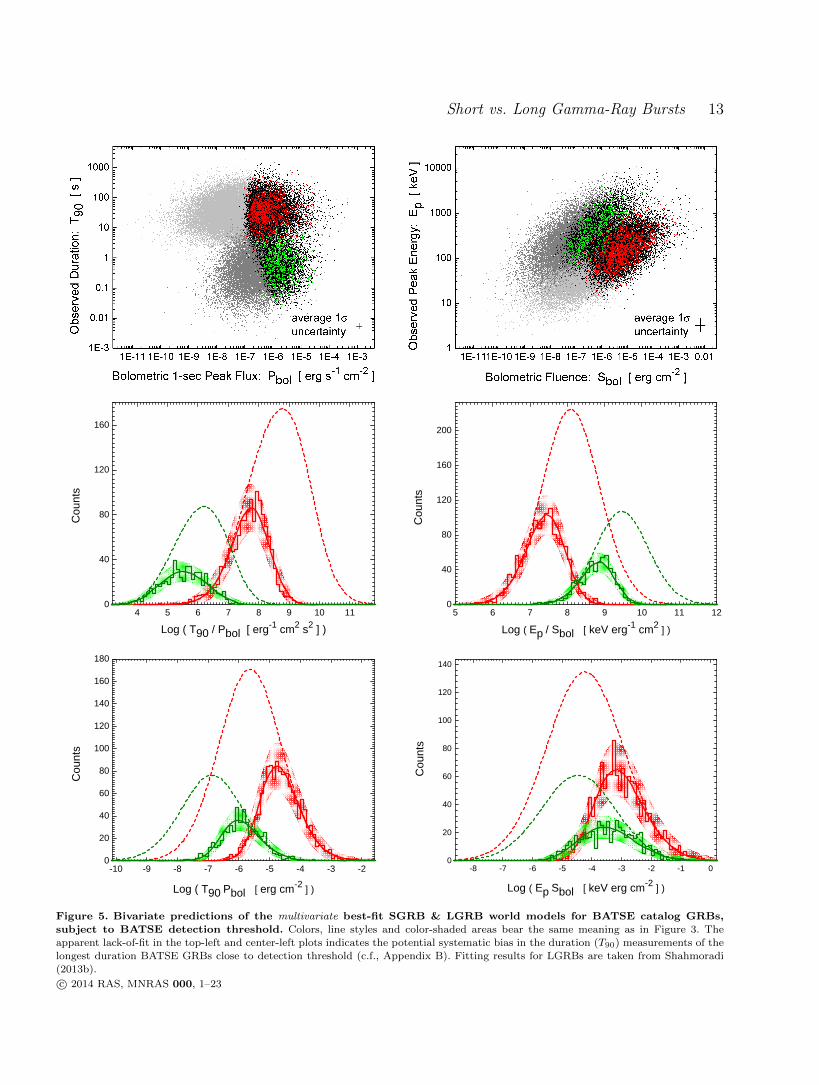
Figure 5. Bivariate predictions of the multivariate best-fit SGRB & LGRB world models for BATSE catalog GRBs,subject to BATSE detection threshold. Colors, line styles and color-shaded areas bear the same meaning as in Figure 3. The
apparent lack-of-fit in the top-left and center-left plots indicates the potential systematic bias in the duration (T90) measurements of thelongest duration BATSE GRBs close to detection threshold (c.f., Appendix B). Fitting results for LGRBs are taken from Shahmoradi(2013b).
c© 2014 RAS, MNRAS 000, 1–23
14 Shahmoradi and Nemiroff
4 5 6 7 8 9 100
50
100
150
200
Cou
nts
Log ( T90 / Sbol [ erg-1 cm2 s ] )-1 0 1 2 3 4 5
0
50
100
150
200
250
300C
ount
s
Log ( Ep / T90 [ keV s-1 ] )
-11 -10 -9 -8 -7 -6 -5 -4 -3 -2 -10
20
40
60
80
100
120
140
Cou
nts
Log ( T90 Sbol [ s erg cm-2 ] )
0 1 2 3 4 5 60
40
80
120
160
200
240
280
Cou
nts
Log ( Ep T90 [ keV s ] )
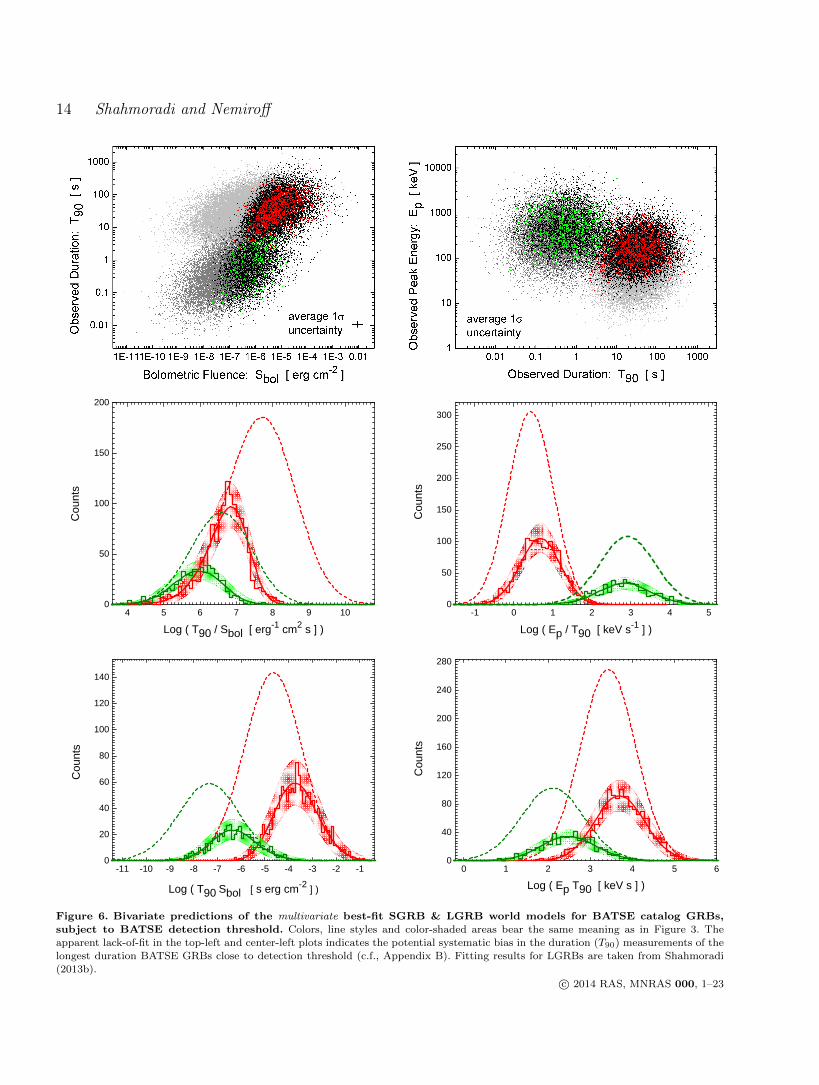
Figure 6. Bivariate predictions of the multivariate best-fit SGRB & LGRB world models for BATSE catalog GRBs,subject to BATSE detection threshold. Colors, line styles and color-shaded areas bear the same meaning as in Figure 3. The
apparent lack-of-fit in the top-left and center-left plots indicates the potential systematic bias in the duration (T90) measurements of thelongest duration BATSE GRBs close to detection threshold (c.f., Appendix B). Fitting results for LGRBs are taken from Shahmoradi(2013b).
c© 2014 RAS, MNRAS 000, 1–23

Short vs. Long Gamma-Ray Bursts 15
Figure 7. Prediction of the world model for the joint bivariate distributions of SGRBs in the rest-frame planes ofLiso−Ep,z & Eiso−Ep,z. For comparison, the prediction of the world model for LGRBs population – the Amati & Yonetoku relations
– are also shown (c.f., Shahmoradi (2013b)). The green filled circles represent SGRB data with known redshift (Zhang, Chen & Huang
2012; Tsutsui et al. 2013) and the red filled circles represent LGRB data taken from Schaefer (2007), Amati et al. (2008),Ghirlanda et al.(2008).
erage peak energy of Ep,z ∼ 955 keV . This corresponds toan observer-frame 3σ range of Ep,z ∈ [10keV, 6MeV ], withan observer-frame average peak energy of Ep,z ∼ 300 keV .For comparison, Shahmoradi (2013b) finds approximate 3σranges of Ep,z(keV ) ∈ [20, 4000] & Ep(keV ) ∈ [5, 1430] forthe intrinsic and observer-frame spectral peak energy distri-butions of LGRBs, with population averages Ep,z ∼ 300 keV& Ep ∼ 85 keV respectively.
In contrast, the distributions of the observed spectralpeak energies of BATSE catalog LGRBs & SGRBs as foundby Shahmoradi & Nemiroff (2010) (Figure 13 therein) areEp ∼ 140(keV ) and Ep ∼ 520(keV ) respectively, slightlylarger than the inferred values for the underlying populationof the two classes here in this work. Similarly, Nava et al.(2011) also find slightly larger average Ep values for a sampleof 438 Fermi SGRBs and LGRBs. The discrepancy betweenthe detected sample and the underlying population can beexplained by sample incompleteness due to BATSE LAD &Fermi GBM detection thresholds. This is line with previousfindings on the role of selection effects due to gamma-ray de-tectors in shaping the observed properties of the two GRBclasses (e.g., Band & Preece 2005; Shahmoradi & Nemiroff2009; Butler, Kocevski & Bloom 2009; Shahmoradi & Ne-miroff 2011; Kocevski 2012b).
As for the prompt duration of short GRBs, the modelpredicts a 3σ range of T90,z ∈ [2ms, 7s] for the intrinsic du-ration distribution of SGRBs with a population average ofT90,z ∼ 180ms. This corresponds to a 3σ dynamic rangeof T90 ∈ [5ms, 22s] for the duration distribution of shortGRBs in the observer frame with a population average ofT90 ∼ 350ms. When compared to BATSE detected sam-ple of SGRBs with an average T90 ∼ 670ms, it is apparent
that the majority of undetected SGRBs were likely amongthe shortest events in the population. This corroborates theearly hints on the potential existence of very short-durationGRBs that could have been missed by BATSE Large AreaDetectors (e.g., Figure (1) & (2) in Nemiroff et al. 1998).The minor excess predicted by the SGRB world model mayalso be partly attributed to the systematic biases and errorsin BATSE data and the simplified model of BATSE triggerthreshold for SGRBs as explained in Appendix A & B.
For comparison, the LGRB world model of Shahmoradi(2013b) predicts an approximate 3σ range of T90,z(s) ∈[0.5, 145] for the intrinsic duration distribution of LGRBswith a population average of T90,z ∼ 10s, corresponding toan approximate 3σ dynamic range of T90(s) ∈ [1, 620] in theobserver frame with a population average of T90 ∼ 30s.
The presented LGRB and SGRB world models also pre-dict that intrinsically shorter duration GRBs in both classes,although likely exist, have lower chances of detection bygamma-ray instruments such as BATSE LAD and FermiGBM. These results corroborate the recent findings of Lit-tlejohns et al. (2013) & Littlejohns & Butler (2014) based ona sample of Swift LGRBs and further extend it to the pop-ulation of short GRBs as illustrated in right plot of Figure2.
4.3 Temporal & Spectral Correlations
There is already an extensive body of literature on the po-tential existence of correlations among the prompt spec-tral and temporal parameters of LGRBs (c.f., Shahmoradi& Nemiroff 2011, for a comprehensive review of the lit-erature). Much of the efforts so far has mainly focused on
c© 2014 RAS, MNRAS 000, 1–23
16 Shahmoradi and Nemiroff
brightness-hardness types of relations, such as the Amati re-lation (Eiso−Ep,z) and the Yonetoku relation (Liso−Ep,z).Currently, the general consensus is that these relations doexist with high significance (e.g., Butler, Bloom & Poznan-ski 2010; Shahmoradi 2013b), but with far less strengththan the original findings of Amati et al. (2002) and Yo-netoku et al. (2004). In addition to early hints on the poten-tial existence of duration-brightness relations (e.g., Horvathet al. 2005), recently Butler, Bloom & Poznanski (2010) alsofound, through an elaborate and comprehensive analysis ofSwift data, some tentative signatures of a significant posi-tive correlation between the intrinsic duration and the to-tal isotropic emission of LGRBs. Later, Shahmoradi (2013b)provided evidence in support of intrinsic duration-brightnesscorrelations among LGRBs using independent methods andmodels applied to BATSE catalog data, and further showedthat the brightness-duration relations (i.e., Eiso − T90,z &Liso − T90,z) are of comparable strength and significance tobrightness-hardness relations (i.e., Eiso−Ep,z & Liso−Ep,z).This positive correlation is also evident in the results of theLGRB world model in Table 2. Unlike the work of Shah-moradi (2013b), here in this work we have applied an energyband correction of the form (1 + z)−0.34 to the observed du-rations (T90) of BATSE LGRBs (e.g., Gehrels et al. 2006;Butler, Bloom & Poznanski 2010). This correction if applied,slightly relaxes the strength of the correlation between theintrinsic duration and brightness.
Contrary to LGRBs, correlations among the prompt-emission parameters of short GRBs have been far less inves-tigated. Recently, Zhang, Chen & Huang (2012) and Tsut-sui et al. (2013) used a small sample of SGRBs with mea-sured redshift to argue for the potential existence of intrinsichardness-brightness correlations in the population of SGRBssimilar to the class of LGRBs. Nevertheless, the strength andsignificance of these positive correlations in the underlyingpopulation of SGRBs could not be determined in their stud-ies due to strong selection bias and sample incompletenessin observational data.
The results of the SGRB world model, as presentedin Table 2, confirm the existence of intrinsic hardness-brightness correlations among SGRBs. Specifically, themodel predicts highly significant correlation strengths ofρ ∼ 0.51±0.10 & ρ ∼ 0.60±0.06 for Liso−Ep,z & Eiso−Ep,zrelations respectively. The two correlation strengths are verysimilar to the predictions of the LGRB world model for thesame relations in the population of LGRBs (ρ ∼ 0.45± 0.07& ρ ∼ 0.58 ± 0.04, respectively). This is illustrated in theplots of Figure 7.
The similarity of the two GRB classes in the joint dis-tributions and correlations is not limited to only hardness-brightness relations. Indeed, all four prompt-emission vari-ables in both populations (Liso, Eiso, Ep,z, T90,z) appear tobe similarly related to each other in both populations, asshown in Table 2.
A potential correlation of the form,
Ep,z√T90,z ∝ Eγ (12)
has also been derived and suggested by Putten (2008),in which Eγ stands for the beaming-angle-corrected outputenergy from the burst. The presented analysis is consistentwith the existence of such universal relation. The strengthand significance of it however, cannot be determined solelybased on BATSE observational data, as it requires a knowl-edge of redshift and the beaming angle of individual events.We also caution against the use of the hardness-brightnesscorrelations, such as the Amati relation, to infer the char-acteristics of the inner engines of the two GRB classes. Ourpredictions based on BATSE catalog GRBs is that the Am-ati relation in its current form – as presented by Putten et al.(2014) – is likely strongly affected by sample incompleteness.In addition, the significant overlap of the two GRB popula-tions in hardness-brightness plots, as illustrated in Figure 7,likely renders the Amati relation an ineffective tool for GRBclassification.
5 CONCLUDING REMARKS
The primary goal of the presented analysis was to con-strain the energetics, luminosity function, and the promptgamma-ray correlations of short-hard class of GRBs, usingthe wealth of information that has remained untouched inthe largest catalog of GRBs available to this date, the cur-rent BATSE GRB catalog. In the following lines we sum-marize the steps we have taken to constrain the popula-tion properties of short-hard and similarly, long-soft GRBs(SGRBs & LGRBs, respectively):
(i) A sample of 565 short-hard and 1366 long-soft burstswere first segregated and selected from the current BATSEcatalog of 2130 GRBs, for which complete data were avail-able, including the bolometric peak flux (Pbol), the bolomet-ric fluence (Sbol), the observed spectral peak energy (Ep)and the observed duration (T90). The classification methodis based on fuzzy clustering algorithms on the two prompt-emission variables Ep & T90 which are least affected by thedetection threshold of gamma-ray detectors (Sec. 2.1). Thismethodology can be readily applied to other GRB catalogs,in particular Fermi GBM.
(ii) We propose that the intrinsic joint distribution ofthe four main prompt-emission parameters of SGRBs:the isotropic peak gamma-ray luminosity (Liso), the totalisotropic gamma-ray emission (Eiso), the intrinsic spectralpeak energy (Ep,z) and the intrinsic duration (T90,z) can bewell described as a multivariate (4-dimensional) log-normaldistribution, once the observational data is corrected for ef-fects of detection threshold and sample incompleteness (Sec.2.2).
(iii) The best-fit parameters of the model are then foundby maximizing the likelihood function of the model givenBATSE SGRB data (Eqn. 9) subject to the Bayesian priors
c© 2014 RAS, MNRAS 000, 1–23
Short vs. Long Gamma-Ray Bursts 17
of Eqn. 11, with a SGRB rate density (Eqn. 7) that is theresult of the convolution of Star Formation Rate (Eqn 5)with a log-normal binary merger delay distribution of Eqn.6. The resulting best-fit parameters are summarized in Table2.
We highlight, in the following lines, the main conclu-sions of the presented analysis and the important similaritiesand differences that we find in the prompt gamma-ray emis-sion properties of the two classes of short-hard and long-softGRBs.
• Population Distribution.The population distributions of LGRBs and SGRBs appearsto be well described by two separate multivariate log-normaldistributions in the 4-dimensional parameter space of theisotropic peak gamma-ray luminosity (Liso), total isotropicgamma-ray emission (Eiso), the intrinsic spectral peak en-ergy (Ep,z) and the intrinsic duration (T90,z), once correctedfor the effects of detector threshold and sample incomplete-ness. This is in line with previous findings of Shahmoradi(2013b) & Shahmoradi (2013a).• GRB Classification.
According to the predictions of our GRB world, the mostaccurate and the quickest method of individual GRB classi-fication – solely based on prompt emission properties – ap-pears to be the observer-frame ratio Ep/T90[keV s−1]. Wefind that 99% of all LGRBs have Ep/T90 . 50, and 95% ofall SGRBs have Ep/T90 ∼> 50 (c.f., Figure 6, center right).
We caution against the use of other similar quantities,such as the ratio of the observed spectral peak energy tobolometric fluence Ep/Sbol as proposed by Goldstein, Preece& Briggs (2010). Although this ratio seems to be a gooddiscriminator in the sample of detected GRBs, it is stronglyaffected by sample incompleteness and detector threshold ef-fects. Figure 5 (center right) illustrates the effects of sampleincompleteness on the observed distribution of this ratio.• Energetics & Luminosity Function.
The presented GRB world model predicts a 3σ range ofLiso(erg s
−1) ∈ [1050, 1053] for the 64ms isotropic peak lu-minosity of SGRBs. A translation of this range to 1024mspeak luminosity using Eqn. A3 approximately correspondsto Liso(erg s
−1) ∈ [8× 1048, 1.3× 1053]. This range is veryclose and similar to the predictions of the GRB world modelfor 1024ms peak luminosity distribution of LGRBs with a3σ range of Liso(erg s
−1) ∈ [3.2× 1049, 3.2× 1053].Also predicted by the model are the 3σ ranges of
Eiso(erg) ∈ [1048, 3.2×1053] & Eiso(erg) ∈ [1.6×1049, 5.0×1054] for the total isotropic gamma-ray emission of SGRBs& LGRBs respectively. The two variables Liso and Eiso arestrongly correlated with each other in both GRB classes (c.f.,Table 2).• Prompt Duration & Spectral Peak Energy.
The population distribution of the rest-frame spectral peakenergies (Ep,z) of both SGRBs and LGRBs appears to bedescribed well by log-normal distributions with populationaverages Ep,z ∼ 955 keV & Ep,z ∼ 300 keV , and 3σ
ranges Ep,z ∈ [45keV, 16MeV ] & Ep,z ∈ [10keV, 6MeV ] re-spectively. In the observer-frame, this corresponds approxi-mately to average Ep,z ∼ 300 keV & Ep,z ∼ 85 keV with3σ ranges Ep(keV ) ∈ [20, 4000] & Ep(keV ) ∈ [5, 1430] forthe two SGRB and LGRB classes, respectively.
While the underlying duration distribution of LGRBs(T90,z) does not seem to be significantly affected by the de-tection threshold of BATSE Large Area Detectors, there istentative evidence that very short-duration SGRBs had, ingeneral, lower chances of detection by BATSE (Figure 3, bot-tom right). For the population of SGRBs, we find a 3σ rangeof intrinsic duration T90,z(s) ∈ [0.002, 7] with a populationaverage of T90,z ∼ 180ms. In contrast, for T90,z distributionof LGRBs we find a 3σ range of T90,z(s) ∈ [0.5, 145] withpopulation average T90,z ∼ 10s (Sec. 4.2).• Prompt Gamma-Ray Correlations.
All four prompt gamma-ray variables appear to be stronglyand positively correlated with each other in both GRBclasses, with the exception of the two variables Ep,z & T90,z
which tend to be weakly, yet positively, correlated with eachother. The intrinsic hardness–brightness relations (e.g., theAmati & the Yonetoku relations) are confirmed but withmuch higher dispersions than originally reported for theserelations (Figure 7). The presented GRB world model re-veals startling similarities in the strengths of the corre-sponding hardness–brightness correlations in the two GRBclasses. Specifically, the model predicts a Pearson’s correla-tion strength of ρ ∼ 0.6 for Eiso–Ep,z relation and ρ ∼ 0.5for Liso–Ep,z relation, similarly in both GRB classes.
The presented GRB model also predicts intrinsicduration–brightness correlations that are almost identicalin strength between the two GRB classes, also very similarto the correlation strengths of hardness–brightness relations(c.f., Table 2 & Sec. 4.3).
In summary, we have presented a mathematical modelwith minimal free parameters that enables us, for the firsttime, to constrain the main characteristics of the promptgamma-ray emission of short–hard and long–soft GRBs,jointly and simultaneously, while paying careful attention toselection biases and sample incompleteness due to gamma-ray detector thresholds. Our model predicts a high level ofsimilarity in the joint population distribution of the prompt-emission properties of the two GRB classes, a finding thatmerits further investigation of the potential similarities inthe prompt emission mechanisms of both GRB classes.
APPENDIX A:BATSE DETECTION THRESHOLD
An accurate modelling of the detection threshold of gamma-ray instruments is an integral part of any population studyof GRBs. We have already argued in Sec. 2.2 that modelingthe trigger efficiency of gamma-ray detectors solely based ona measure of peak photon/energy flux – as is generally donein most GRB population studies – can potentially lead to
c© 2014 RAS, MNRAS 000, 1–23
18 Shahmoradi and Nemiroff
0.01 0.1 1 10 100 1000
1
10
best-fit Error Function
BATSE LGRBsBATSE SGRBs
Pea
k Fl
ux R
atio
: P
64m
s /
P10
24m
s
Observed Duration: Log ( T90 [ s ] )
-0.4000
-0.3500
-0.3000
-0.2500
-0.2000
0.1 1 100.0
0.2
0.4
0.6
0.8
1.0
SGRB WorldModel
BA
TSE
GR
B T
rigge
r Effi
cien
cy
64ms Peak Flux: P50-300 keV [ ph s-1 cm-2 ]
BATSE 4BCatalog
LGRB WorldModel
< -0.4
-0.35
-0.30
-0.25
> -0.2
averagelog (T90 [s])
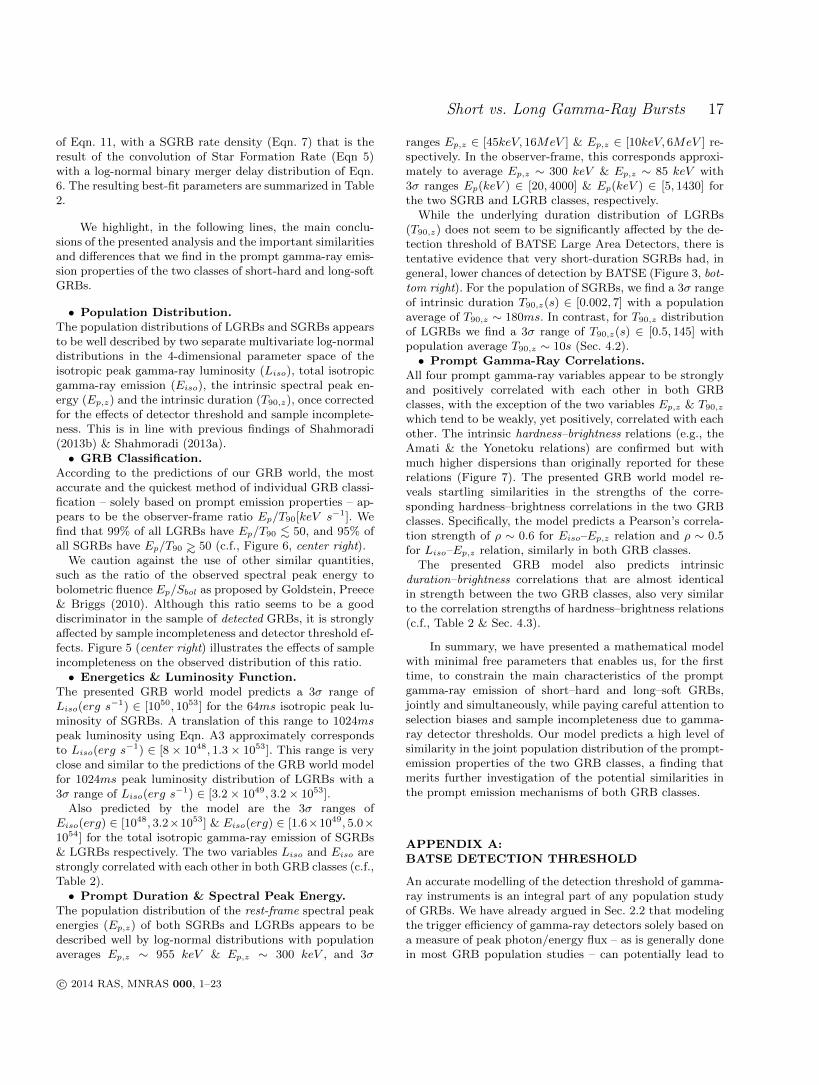
Figure A1. Left: An illustration of the higher detection probability of short GRBs on 64ms timescale peak flux towards very shortdurations compared to the commonly used 1024ms peak flux definition for LGRBs. The duration-dependence of the ratio of the two peak
flux definitions highlights the inadequacy of the conventional definition of peak flux based on 1024ms time binning for the detection of
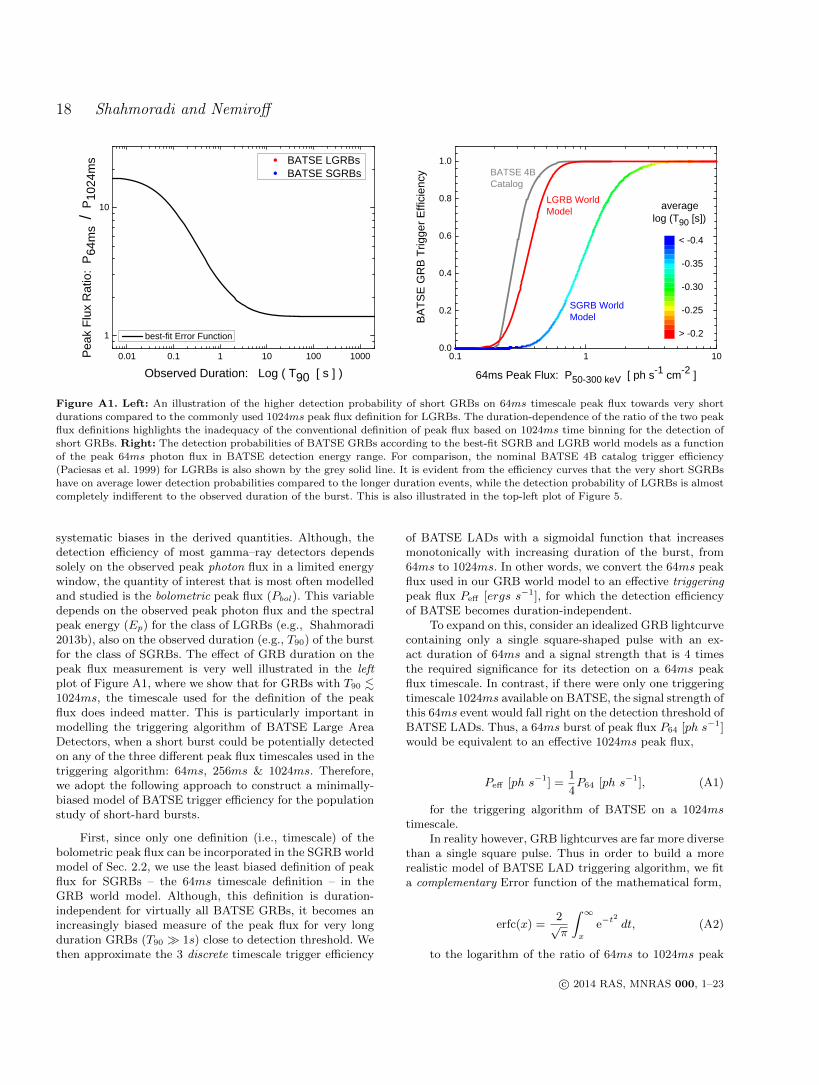
short GRBs. Right: The detection probabilities of BATSE GRBs according to the best-fit SGRB and LGRB world models as a functionof the peak 64ms photon flux in BATSE detection energy range. For comparison, the nominal BATSE 4B catalog trigger efficiency
(Paciesas et al. 1999) for LGRBs is also shown by the grey solid line. It is evident from the efficiency curves that the very short SGRBs
have on average lower detection probabilities compared to the longer duration events, while the detection probability of LGRBs is almostcompletely indifferent to the observed duration of the burst. This is also illustrated in the top-left plot of Figure 5.
systematic biases in the derived quantities. Although, thedetection efficiency of most gamma–ray detectors dependssolely on the observed peak photon flux in a limited energywindow, the quantity of interest that is most often modelledand studied is the bolometric peak flux (Pbol). This variabledepends on the observed peak photon flux and the spectralpeak energy (Ep) for the class of LGRBs (e.g., Shahmoradi2013b), also on the observed duration (e.g., T90) of the burstfor the class of SGRBs. The effect of GRB duration on thepeak flux measurement is very well illustrated in the leftplot of Figure A1, where we show that for GRBs with T90 .1024ms, the timescale used for the definition of the peakflux does indeed matter. This is particularly important inmodelling the triggering algorithm of BATSE Large AreaDetectors, when a short burst could be potentially detectedon any of the three different peak flux timescales used in thetriggering algorithm: 64ms, 256ms & 1024ms. Therefore,we adopt the following approach to construct a minimally-biased model of BATSE trigger efficiency for the populationstudy of short-hard bursts.
First, since only one definition (i.e., timescale) of thebolometric peak flux can be incorporated in the SGRB worldmodel of Sec. 2.2, we use the least biased definition of peakflux for SGRBs – the 64ms timescale definition – in theGRB world model. Although, this definition is duration-independent for virtually all BATSE GRBs, it becomes anincreasingly biased measure of the peak flux for very longduration GRBs (T90 1s) close to detection threshold. Wethen approximate the 3 discrete timescale trigger efficiency
of BATSE LADs with a sigmoidal function that increasesmonotonically with increasing duration of the burst, from64ms to 1024ms. In other words, we convert the 64ms peakflux used in our GRB world model to an effective triggeringpeak flux Peff [ergs s−1], for which the detection efficiencyof BATSE becomes duration-independent.
To expand on this, consider an idealized GRB lightcurvecontaining only a single square-shaped pulse with an ex-act duration of 64ms and a signal strength that is 4 timesthe required significance for its detection on a 64ms peakflux timescale. In contrast, if there were only one triggeringtimescale 1024ms available on BATSE, the signal strength ofthis 64ms event would fall right on the detection threshold ofBATSE LADs. Thus, a 64ms burst of peak flux P64 [ph s−1]would be equivalent to an effective 1024ms peak flux,
Peff [ph s−1] =1
4P64 [ph s−1], (A1)
for the triggering algorithm of BATSE on a 1024mstimescale.
In reality however, GRB lightcurves are far more diversethan a single square pulse. Thus in order to build a morerealistic model of BATSE LAD triggering algorithm, we fita complementary Error function of the mathematical form,
erfc(x) =2√π
∫ ∞x
e−t2
dt, (A2)
to the logarithm of the ratio of 64ms to 1024ms peak
c© 2014 RAS, MNRAS 000, 1–23
Short vs. Long Gamma-Ray Bursts 19
fluxes (RP64/P1024) as a function of the observed duration
(T90) of BATSE GRBs, as illustrated in the left plot of FigureA1. The resulting best-fit function for RP64/P1024
has theform,
log(RP64/P1024
)' 0.15
+ 0.56× erfc
(log(T90
)+ 0.48
1.05
). (A3)
The effective triggering peak flux in the SGRB worldmodel is then calculated using the following relation,
log(Peff
)' log
(P64
)− 1
2
(log(RP64/P1024
)− 0.15
). (A4)
Once Peff is obtained, we follow the approach of Shah-moradi (2013b) to calculate the detection probability (η) ofa given SGRB with an effective triggering peak flux Peff ,
η(
detection |µthresh, σthresh, Liso, Ep,z, T90,z, z)
=1
2+
1
2×
erf
(log(Peff(Liso, Ep,z, T90,z, z)− µthresh
)√
2σthresh
), (A5)
where µthresh & σthresh are the detection thresh-old parameters that are found by fitting the SGRBworld model to BATSE observational data (c.f., Table2), and Peff(Liso, Ep,z, T90,z, z) is the 1024ms effectivetriggering peak flux in BATSE energy range of detec-tion , 50–300[keV], calculated from the 64ms peak flux(P64(Liso, Ep,z, z) [ph s−1]) in BATSE detection energyrange using Eqn. A4. The connection between the rest-frameGRB parameters, Liso&Ep,z, z, and the 64ms peak flux P64
is obtained by fitting a smoothly broken power-law knownas the Band model (Band et al. 1993) of the mathematicalform,
Φ(E) ∝
Eα e
(− (1+z)(2+α)E
Ep,z
)if E ≤
(Ep,z1+z
)(α−β2+α
),
Eβ if otherwise.
(A6)to SGRBs differential photon spectra, such that,
P64
(Liso, Ep,z, z
)=
Liso
4πDL2(z)
∫ 300
50Φ dE∫ 20000/1+z
0.1/1+zEΦ dE
, (A7)
where DL(z) is the luminosity distance of Eqn. 3. In or-der to bring the above calculations into the realm of currentcomputational technologies, we simplify the integration lim-its in the denominator of Eqn. A7 to a redshift-independentenergy range [0.1keV, 20MeV] and fix the low– & high– en-ergy photon indices of the Band model (Eqn. A6) to theircorresponding population averages α = −1.1 & β = −2.3.
Butler, Bloom & Poznanski (2010) show that these simpli-fications result in an uncertainty of < 0.05dex in the esti-mated peak flux, which is negligible compared to the exist-ing systematic biases in BATSE data (c.f., Appendix B anduncertainties in the spectral peak energy estimates of Shah-moradi & Nemiroff (2010) used in this work). The resultingbest-fit model of BATSE detection efficiency as a functionof P64 for the class of short-hard bursts is illustrated andcompared to the detection efficiency of long-soft bursts inthe right plot of Figure A1.
APPENDIX B:SYSTEMATIC BIASES IN BATSE GRB DATA
As argued by Hogg & Turner (1998), astronomical catalogsand surveys are prone to systematic biases in measurements,in particular, close to the detection threshold of the ob-servational instruments. The BATSE catalog of GRBs isno exception to such biases, also noted by BATSE teamand others (e.g., Nemiroff et al. 1994; Paciesas et al. 1999;Stern et al. 2001; Stern, Atteia & Hurley 2002). Although,throughout this work we relied on BATSE catalog data intheir original form, here we present the results of our searchfor the potential signatures of systematic biases in BATSEdata, which will pave the way for more accurate and rigorouspopulation studies of GRBs in future.
In order to identify the extent of systematic bias inBATSE GRB data close to detection threshold, we first cal-culate the average background photon counts for each in-dividual BATSE GRB lightcurve, in each of the four mainenergy channels of BATSE Large Area Detectors. we thensubtract the calculated average background gamma-ray pho-ton counts from the corresponding BATSE GRB lightcurves.The background-subtracted lightcurves are then used to cal-culate the peak photon fluxes of all GRBs in the sample,in three 64ms, 256ms, & 1024ms timescale definitions. Al-though the calculated peak fluxes are already contaminatedand biased by background noise, we assume they representthe ‘true peak fluxes’ of BATSE GRBs and use them asour reference to simulate and investigate the effects of back-ground noise in the calculation of peak flux at very lowsignal-to-noise ratios. To do so, we add synthetic backgroundnoise to the entire time-bins of each of the background-subtracted lightcurves. The noise count (n) for each time-bin in a given GRB lightcurve is drawn from the Poissondistribution,
P (n|λ) =λn
n!e−λ . (B1)
The mean of the noise count (λ) for each BATSE GRBlightcurve is set to the original mean background photoncounts found in each of the original lightcurves. We thensubtract the average background counts (λ) from the newlyobtained lightcurves and measure the new peak fluxes inthree timescales 64ms, 256ms & 1024ms. This procedure of
c© 2014 RAS, MNRAS 000, 1–23

20 Shahmoradi and Nemiroff
1 10 100 10000.9
1.0
1.1
1.2
1.3
1.4
1.5
1.6
1.7Systematic Bias in Peak Flux Measurements
equality line 64ms timescale 1024ms timescale
Mea
n M
easu
red
Pea
k Fl
ux /
Tru
e P
eak
Flux
Signal Strength ( in units of σ above background )
nominal BATSE triggering threshold~5.5σ above background noise
0.01 0.1 1 10 100 1000
1
10
100 BATSE LGRBs BATSE SGRBs Average T90 / T50
T 90
[ s
] /
T 50
[ s
]
Observed Duration: T50 [ s ]
Systematic Bias in Duration Measurements
Figure B1. Left: An illustration of the existing systematic bias in the peak flux measurements of BATSE GRBs and possibly otherGRB catalogs, such as Swift BAT & Fermi GBM. The horizontal axis represents the peak-flux signal strength of a given BATSE GRB
lightcurve, in units of the standard deviation (σ) of the background photon counts fluctuations. For comparison, the nominal BATSE
triggering threshold is shown by the green vertical dashed line. Right: An illustration of the existing systematic bias in the durationmeasurements of BATSE GRBs, in particular T90 definition at very long durations. At durations longer than T90 ∼ 30[s] corresponding
to T50 ∼ 10[s] close to detection threshold, the prompt durations of most GRBs tend to be systematically underestimated in BATSE
catalog (c.f., Koshut et al. 1996; Hakkila et al. 2000c). This systematic bias is also evident in the top-left & center-left plots of bothFigures 5 & 6.
adding and subtracting synthetic background noise is thenrepeated 10000 time for each GRB lightcurve to obtain asample of peak flux measurements for each of BATSE cat-alog GRB. The mean of this sample is then compared tothe original ‘true peak flux’ measured after the initial back-ground subtraction. The results are illustrated in the leftplot of Figure B1. It is evident that peak the flux estimatesbecome increasingly biased with decreasing Signal-to-NoiseRatio (SNR) in BATSE data. This result corroborates thefindings of Hogg & Turner (1998), who argue that flux mea-surements in astronomical surveys tend to be overestimatedat very low SNR.
We have also tested the BATSE fluence and spectralpeak energy data for the potential existence of systematicbiases at low SNR, for which we find no significant evi-dence. We identify, however, a systematic bias in the dura-tion measurements of BATSE catalog GRBs, specifically, invery long T90 measurements. This is illustrated in the rightplot of Figure B1, where we show that the T90 measures ofBATSE LGRBs are likely systematically underestimated atvery long durations, corresponding to durations T50 ∼> 10[s].As argued by Koshut et al. (1996); Hakkila et al. (2000c);Kocevski (2012a), the T90 definition of GRB duration seemsto be prone to systematic underestimations for very longduration low-SNR GRBs, since it is more likely that thelate-time weak signals in the lightcurves would vanish in thebackground noise. The effects of this duration bias are alsoevident in the predictions of the LGRB world model shownin Figures 5 & 6 (top–left & center–left plots in both figures).
REFERENCES
Amati L. et al., 2002, Astronomy and Astrophysics, 390,81
Amati L., Guidorzi C., Frontera F., Della Valle M., FinelliF., Landi R., Montanari E., 2008, Monthly Notices of theRoyal Astronomical Society, 391, 577
Backus J., 1978, ACM SIGPLAN Notices, 13, 165Balastegui A., Ruiz-Lapuente P., Canal R., 2001, MonthlyNotices of the Royal Astronomical Society, 328, 283
Balazs L. G., Bagoly Z., Horvath I., Mszros A., Mszros P.,2003, Astronomy and Astrophysics, 401, 129
Band D. et al., 1993, The Astrophysical Journal, 413, 281Band D. L., 2003, The Astrophysical Journal, 588, 945Band D. L., 2006, The Astrophysical Journal, 644, 378Band D. L. et al., 2008, The Astrophysical Journal, 673,1225
Band D. L., Preece R. D., 2005, The Astrophysical Journal,627, 319
Belczynski K., Holz D. E., Fryer C. L., Berger E., Hart-mann D. H., O’Shea B., 2010, The Astrophysical Journal,708, 117
Belczynski K., Perna R., Bulik T., Kalogera V., IvanovaN., Lamb D. Q., 2006, The Astrophysical Journal, 648,1110
Berger E., 2011, New Astronomy Reviews, 55, 1Berger E., 2014, Annual Review of Astronomy and Astro-physics, 52, 43
Berger E. et al., 2007, The Astrophysical Journal, 664, 1000Bezdek J. C., 1981, Pattern recognition with fuzzy objec-
c© 2014 RAS, MNRAS 000, 1–23
Short vs. Long Gamma-Ray Bursts 21
tive function algorithms. Plenum Press
Bogomazov A. I., Lipunov V. M., Tutukov A. V., 2007,Astronomy Reports, 51, 308
Browne W. J., 2006, Computational Statistics & DataAnalysis, 50, 1655
Butler N. R., Bloom J. S., Poznanski D., 2010, The Astro-physical Journal, 711, 495
Butler N. R., Kocevski D., Bloom J. S., 2009, The Astro-physical Journal, 694, 76
Butler N. R., Kocevski D., Bloom J. S., Curtis J. L., 2007,The Astrophysical Journal, 671, 656
Calderone G. et al., 2014, ArXiv e-prints, 1408, 1608
Campisi M. A., Li L.-X., Jakobsson P., 2010, Monthly No-tices of the Royal Astronomical Society, 407, 1972
Chapman R., Priddey R. S., Tanvir N. R., 2009, MonthlyNotices of the Royal Astronomical Society, 395, 1515
Chattopadhyay T., Misra R., Chattopadhyay A. K., NaskarM., 2007, The Astrophysical Journal, 667, 1017
Coward D., Howell E., Branchesi M., Gendre B., StrattaG., 2013, ArXiv e-prints, 1305, 3366
Coward D. M. et al., 2012, Monthly Notices of the RoyalAstronomical Society, 425, 2668
Czerny B., Janiuk A., Cline D. B., Otwinowski S., 2011,New Astronomy, 16, 33
Dainotti M. G., Cardone V. F., Piedipalumbo E.,Capozziello S., 2013, Monthly Notices of the Royal As-tronomical Society, 436, 82
Dainotti M. G., Del Vecchio R., Shigehiro N., CapozzielloS., 2014, arXiv:1412.3969 [astro-ph], arXiv: 1412.3969
Dainotti M. G., Ostrowski M., Willingale R., 2011,Monthly Notices of the Royal Astronomical Society, 418,2202
D’Avanzo P. et al., 2014, Monthly Notices of the RoyalAstronomical Society, 442, 2342
Dezalay J.-P., Barat C., Talon R., Syunyaev R., TerekhovO., Kuznetsov A., 1992, in , pp. 304–309
Dunn J. C., 1973, Journal of Cybernetics, 3, 32
Eichler D., Livio M., Piran T., Schramm D. N., 1989, Na-ture, 340, 126
Fenimore E. E., in ’t Zand J. J. M., Norris J. P., BonnellJ. T., Nemiroff R. J., 1995, The Astrophysical JournalLetters, 448, L101
Fisher R., 1915, Biometrika, 10, 507
Gao H., Lu Y., Zhang S. N., 2010, The Astrophysical Jour-nal, 717, 268
Gehrels N. et al., 2004, The Astrophysical Journal, 611,1005
Gehrels N. et al., 2006, Nature, 444, 1044
Gehrels N., Ramirez-Ruiz E., Fox D. B., 2009, Annual Re-view of Astronomy and Astrophysics, 47, 567
Ghirlanda G., Ghisellini G., Nava L., Burlon D., 2011,Monthly Notices of the Royal Astronomical Society: Let-ters, 410, L47
Ghirlanda G., Nava L., Ghisellini G., Firmani C., CabreraJ. I., 2008, Monthly Notices of the Royal AstronomicalSociety, 387, 319
Goldstein A., Preece R. D., Briggs M. S., 2010, The Astro-physical Journal, 721, 1329
Goldstein A., Preece R. D., Mallozzi R. S., Briggs M. S.,Fishman G. J., Kouveliotou C., Paciesas W. S., BurgessJ. M., 2013, The Astrophysical Journal Supplement Se-ries, 208, 21
Guelbenzu A. N. et al., 2014, The Astrophysical Journal,789, 45
Guetta D., Piran T., 2006, Astronomy and Astrophysics,453, 823
Guetta D., Piran T., Waxman E., 2005, The AstrophysicalJournal, 619, 412
Haario H., Saksman E., Tamminen J., 2001, Bernoulli, 7,223, articleType: research-article / Full publication date:Apr., 2001 / Copyright 2001 International StatisticalInstitute (ISI) and Bernoulli Society for MathematicalStatistics and Probability
Hakkila J., 2003, in , AIP, pp. 176–178
Hakkila J., Giblin T. W., Roiger R. J., Haglin D. J., Pa-ciesas W. S., Meegan C. A., 2003, The Astrophysical Jour-nal, 582, 320
Hakkila J., Giblin T. W., Roiger R. J., Haglin D. J., Pa-ciesas W. S., Meegan C. A., 2004a, in , p. 78
Hakkila J., Giblin T. W., Roiger R. J., Haglin D. J., Pa-ciesas W. S., Meegan C. A., 2004b, Baltic Astronomy, 13,211
Hakkila J., Haglin D. J., Pendleton G. N., Mallozzi R. S.,Meegan C. A., Roiger R. J., 2000a, The AstrophysicalJournal, 538, 165
Hakkila J., Haglin D. J., Roiger R. J., Mallozzi R. S.,Pendleton G. N., Meegan C. A., 2000b, in , pp. 33–37
Hakkila J., Mallozzi R. S., Roiger R. J., Haglin D. J.,Pendleton G. N., Meegan C. A., 2001, p. 60
Hakkila J., Meegan C. A., Pendleton G. N., Mallozzi R. S.,Haglin D. J., Roiger R. J., 2000c, in AIP Conference Pro-ceedings, Vol. 526, AIP Publishing, pp. 48–52
Hao J.-M., Yuan Y.-F., 2013, Astronomy and Astrophysics,558, 22
Hobson M. P., Jaffe A. H., Liddle A. R., Mukeherjee P.,Parkinson D., 2010, Bayesian Methods in Cosmology
Hogg D. W., Turner E. L., 1998, Publications of the As-tronomical Society of the Pacific, 110, 727, articleType:research-article / Full publication date: June 1998 / Copy-right 1998 The University of Chicago Press
Hopkins A. M., Beacom J. F., 2006, The AstrophysicalJournal, 651, 142
Hopman C., Guetta D., Waxman E., Portegies Zwart S.,2006, The Astrophysical Journal Letters, 643, L91
Horvath I., 1998, The Astrophysical Journal, 508, 757
Horvath I., Balazs L. G., Meszaros P., Bagoly Z.,Meszaros A., 2005, arXiv:astro-ph/0508023, arXiv: astro-ph/0508023
Horvath I., Balzs L. G., Bagoly Z., Ryde F., Mszros A.,2006, Astronomy and Astrophysics, 447, 23
Horvath I., Balzs L. G., Bagoly Z., Veres P., 2008, Astron-omy and Astrophysics, 489, L1
c© 2014 RAS, MNRAS 000, 1–23
22 Shahmoradi and Nemiroff
Horvath I., Balzs L. G., Hakkila J., Bagoly Z., Preece R. D.,2012, p. 46
Howell E. J., Coward D. M., Stratta G., Gendre B., ZhouH., 2014, ArXiv e-prints, 1407, 2333
Jarosik N. et al., 2011, The Astrophysical Journal Supple-ment Series, 192, 14
John Barnard R. M., 2000, Statistica Sinica, 10, 1281
Kbori J., Bagoly Z., Balzs L. G., Horvath I., 2014, ArXive-prints, 1407, 2760
Kocevski D., 2012a, eprint: arXiv:1110.6175, p. 17
Kocevski D., 2012b, The Astrophysical Journal, 747, 146
Koshut T. M., Paciesas W. S., Kouveliotou C., van ParadijsJ., Pendleton G. N., Fishman G. J., Meegan C. A., 1996,The Astrophysical Journal, 463, 570
Kouveliotou C., Meegan C. A., Fishman G. J., Bhat N. P.,Briggs M. S., Koshut T. M., Paciesas W. S., PendletonG. N., 1993a, The Astrophysical Journal Letters, 413,L101
Kouveliotou C., Meegan C. A., Fishman G. J., Bhat N. P.,Briggs M. S., Koshut T. M., Paciesas W. S., PendletonG. N., 1993b, The Astrophysical Journal Letters, 413,L101
L H.-J., Liang E.-W., Zhang B.-B., Zhang B., 2010, TheAstrophysical Journal, 725, 1965
L H.-J., Zhang B., Liang E.-W., Zhang B.-B., Sakamoto T.,2014, Monthly Notices of the Royal Astronomical Society,442, 1922
Levan A. J. et al., 2014, The Astrophysical Journal, 781,13
Li L.-X., 2008, Monthly Notices of the Royal AstronomicalSociety, 388, 1487
Lien A., Sakamoto T., Gehrels N., Palmer D. M.,Barthelmy S. D., Graziani C., Cannizzo J. K., 2013, ArXive-prints, 1308, 3720
Lien A., Sakamoto T., Gehrels N., Palmer D. M.,Barthelmy S. D., Graziani C., Cannizzo J. K., 2014, TheAstrophysical Journal, 783, 24
Littlejohns O. M., Butler N. R., 2014, arXiv:1408.6525[astro-ph], arXiv: 1408.6525
Littlejohns O. M., Tanvir N. R., Willingale R., Evans P. A.,O’Brien P. T., Levan A. J., 2013, Monthly Notices of theRoyal Astronomical Society, 436, 3640
Loredo T. J., 2004, in , eprint: arXiv:astro-ph/0409387, pp.195–206
Mazets E. P. et al., 1981, Astrophysics and Space Science,80, 3
Meegan C. A., Fishman G. J., Wilson R. B., Horack J. M.,Brock M. N., Paciesas W. S., Pendleton G. N., Kouve-liotou C., 1992, Nature, 355, 143
Metcalf M., Reid J., Cohen M., 2011, Modern Fortran Ex-plained. OUP Oxford
Michelson P. F., Atwood W. B., Ritz S., 2010, Reports onProgress in Physics, 73, 074901
Mukherjee S., Feigelson E. D., Babu G. J., Murtagh F.,Fraley C., Raftery A., 1998, The Astrophysical Journal,508, 314
Nakar E., 2007, Physics Reports, 442, 166
Nakar E., Gal-Yam A., Fox D. B., 2006, The AstrophysicalJournal, 650, 281
Nakar E., Piran T., 2005, Monthly Notices of the RoyalAstronomical Society, 360, L73
Narayan R., Paczynski B., Piran T., 1992, The Astrophys-ical Journal Letters, 395, L83
Nava L., Ghirlanda G., Ghisellini G., Celotti A., 2011, As-tronomy and Astrophysics, 530, 21
Nava L., Ghirlanda G., Ghisellini G., Firmani C., 2008,Monthly Notices of the Royal Astronomical Society, 391,639
Nemiroff R. J., 2000, The Astrophysical Journal, 544, 805
Nemiroff R. J., Norris J. P., Bonnell J. T., Marani G. F.,1998, The Astrophysical Journal Letters, 494, L173
Nemiroff R. J., Norris J. P., Bonnell J. T., WickramasingheW. A. D. T., Kouveliotou C., Paciesas W. S., FishmanG. J., Meegan C. A., 1994, The Astrophysical JournalLetters, 435, L133
Norris J. P., Cline T. L., Desai U. D., Teegarden B. J.,1984, Nature, 308, 434
O’Shaughnessy R., Belczynski K., Kalogera V., 2008, TheAstrophysical Journal, 675, 566
Paciesas W. S. et al., 1999, The Astrophysical Journal Sup-plement Series, 122, 465
Paczynski B., 1986, The Astrophysical Journal Letters,308, L43
Pescalli A., Ghirlanda G., Salafia O. S., Ghisellini G.,Nappo F., Salvaterra R., 2015, Monthly Notices of theRoyal Astronomical Society, 447, 1911
Putten M. H. P. M. v., 2008, The Astrophysical JournalLetters, 685, L63
Putten M. H. P. M. v., Lee G. M., Valle M. D., Amati L.,Levinson A., 2014, Monthly Notices of the Royal Astro-nomical Society: Letters, 444, L58
Qin Y. et al., 2013, The Astrophysical Journal, 763, 15
Qin Y.-P., Chen Z.-F., 2013, Monthly Notices of the RoyalAstronomical Society, 430, 163
Salvaterra R., Cerutti A., Chincarini G., Colpi M.,Guidorzi C., Romano P., 2008, Monthly Notices of theRoyal Astronomical Society, 388, L6
Schaefer B. E., 2007, The Astrophysical Journal, 660, 16
Shahmoradi A., 2013a, ArXiv e-prints, 1308, 1097
Shahmoradi A., 2013b, The Astrophysical Journal, 766, 111
Shahmoradi A., Nemiroff R., 2009, AIP Conference Pro-ceedings, 1133, 425
Shahmoradi A., Nemiroff R. J., 2010, Monthly Notices ofthe Royal Astronomical Society, 407, 2075
Shahmoradi A., Nemiroff R. J., 2011, Monthly Notices ofthe Royal Astronomical Society, 411, 1843
Stern B. E., Atteia J.-L., Hurley K., 2002, The Astrophys-ical Journal, 578, 304
Stern B. E., Tikhomirova Y., Kompaneets D., Svensson R.,Poutanen J., 2001, The Astrophysical Journal, 563, 80
Tsutsui R., Yonetoku D., Nakamura T., Takahashi K.,Morihara Y., 2013, Monthly Notices of the Royal Astro-
c© 2014 RAS, MNRAS 000, 1–23
Short vs. Long Gamma-Ray Bursts 23
nomical Society, 431, 1398Virgili F. J., Liang E.-W., Zhang B., 2009, Monthly Noticesof the Royal Astronomical Society, 392, 91
Virgili F. J., Zhang B., O’Brien P., Troja E., 2011, TheAstrophysical Journal, 727, 109
Wanderman D., Piran T., 2010, Monthly Notices of theRoyal Astronomical Society, 406, 1944
Wanderman D., Piran T., 2014, ArXiv e-prints, 1405, 5878Wickramasinghe T., Ukwatta T. N., 2010, Monthly Noticesof the Royal Astronomical Society, 406, 548
Yonetoku D., Murakami T., Nakamura T., Yamazaki R.,Inoue A. K., Ioka K., 2004, The Astrophysical Journal,609, 935
Zhang B. et al., 2009, The Astrophysical Journal, 703, 1696Zhang B.-B., Zhang B., Murase K., Connaughton V.,Briggs M. S., 2014, The Astrophysical Journal, 787, 66
Zhang F.-W., Shao L., Yan J.-Z., Wei D.-M., 2012, TheAstrophysical Journal, 750, 88
Zhang Z. B., Chen D. Y., Huang Y. F., 2012, The Astro-physical Journal, 755, 55
Zheng Z., Ramirez-Ruiz E., 2007, The Astrophysical Jour-nal, 665, 1220
c© 2014 RAS, MNRAS 000, 1–23