shortage impacts to cap priority pools and customers · shortage impacts to cap priority pools and...
TRANSCRIPT

Shortage Impacts to CAP Priority Pools and Customers
Shortage WorkshopApril 22, 2015
Priorities within CAP
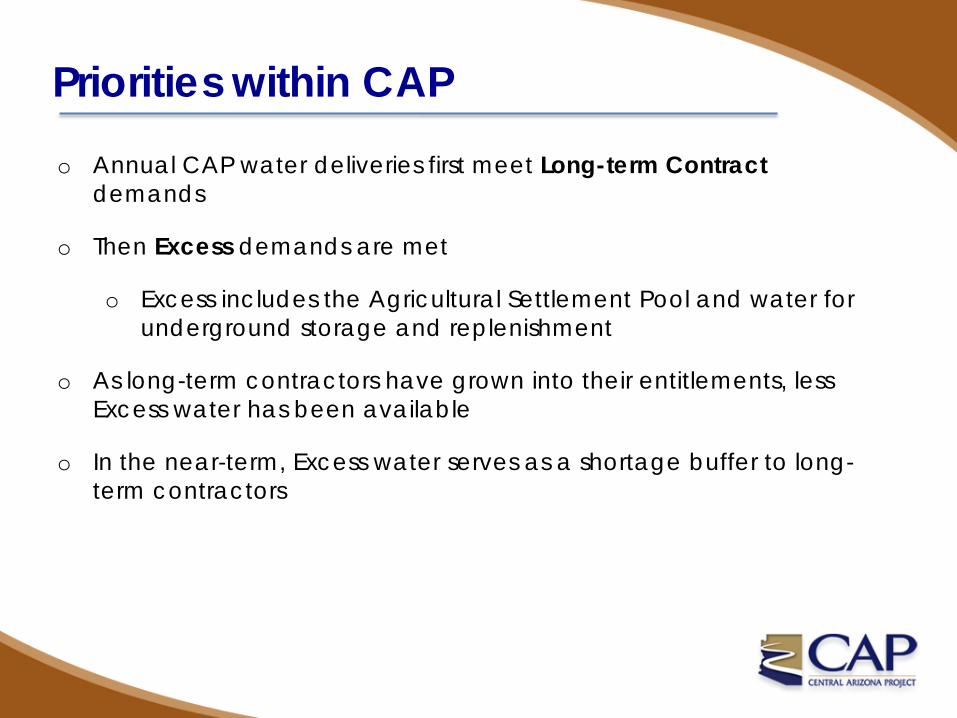
o Annual CAP water deliveries first meet Long-term Contractdemands
o Then Excess demands are met
o Excess includes the Agricultural Settlement Pool and water for underground storage and replenishment
o As long-term contractors have grown into their entitlements, less Excess water has been available
o In the near-term, Excess water serves as a shortage buffer to long-term contractors

Historic CAP Deliveries 2014

CAP
Deliv
ery
Prio
rity
Low
High
0
200,000
400,000
600,000
800,000
1,000,000
1,200,000
1,400,000
1,600,000
Acr
e Fe
et
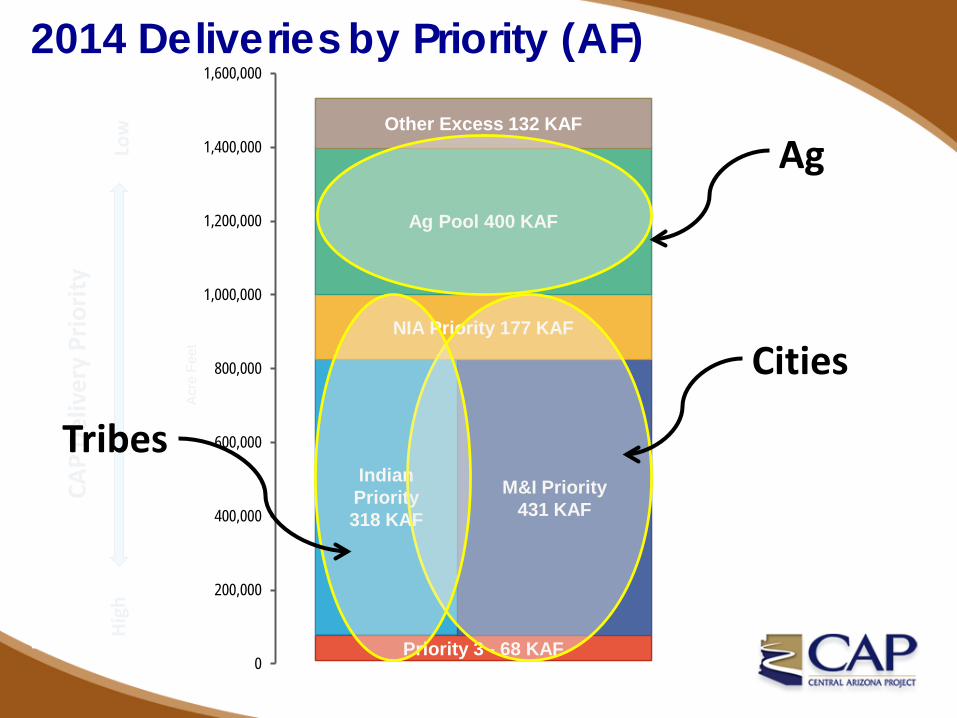
Indian Priority 318 KAF
M&I Priority431 KAF
NIA Priority 177 KAF
Excess Ag Pool 400 KAF
Other Excess 132 KAF
Priority 3 - 68 KAF
1,525,000 AF
Long-Term Contract Water995,000 AF
Excess Water530,000 AF
2014 CAP Deliveries (AF)
Priorities within CAP
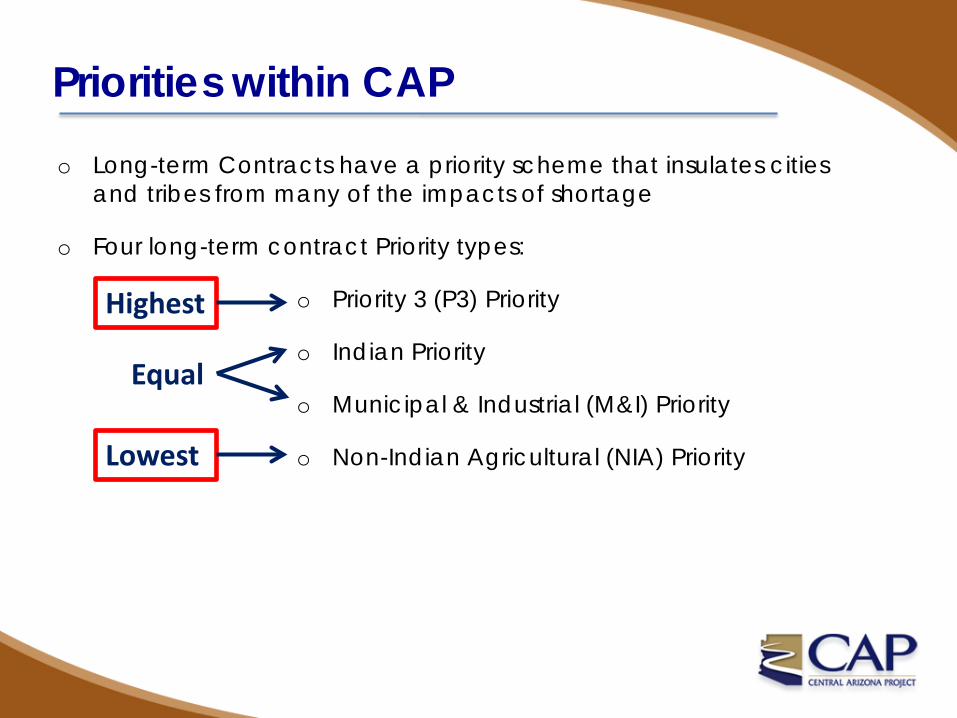
o Long-term Contracts have a priority scheme that insulates cities and tribes from many of the impacts of shortage
o Four long-term contract Priority types:
o Priority 3 (P3) Priority
o Indian Priority
o Municipal & Industrial (M&I) Priority
o Non-Indian Agricultural (NIA) Priority
Highest
Lowest
Equal

Excess Water530,000 AF
Long-Term Contract Water995,000 AF
2014 Deliveries by Priority (AF)CA
P De
liver
y Pr
iorit
y
Low
High
0
200,000
400,000
600,000
800,000
1,000,000
1,200,000
1,400,000
1,600,000
Acr
e Fe
et
1,525,000 AF
Priority 3 - 68 KAF
Indian Priority 318 KAF
M&I Priority431 KAF
NIA Priority 177 KAF
Ag Pool 400 KAF
Other Excess 132 KAF
Excess Water530,000 AF
Long-Term Contract Water995,000 AFCA
P De
liver
y Pr
iorit
y
Low
High
0
200,000
400,000
600,000
800,000
1,000,000
1,200,000
1,400,000
1,600,000
Acr
e Fe
et
Priority 3 - 68 KAF
Indian Priority 318 KAF
M&I Priority431 KAF
NIA Priority 177 KAF
Ag Pool 400 KAF
Other Excess 132 KAF
Cities
Tribes
Ag
2014 Deliveries by Priority (AF)

Declaration of Colorado River Supply(for next calendar year)
• Reclamation on behalf of the Secretary of Interior
• Colorado River AOP (CRMWG)• August 24-Month Study• Final Consultation – August
Shortage?Normal?Surplus?
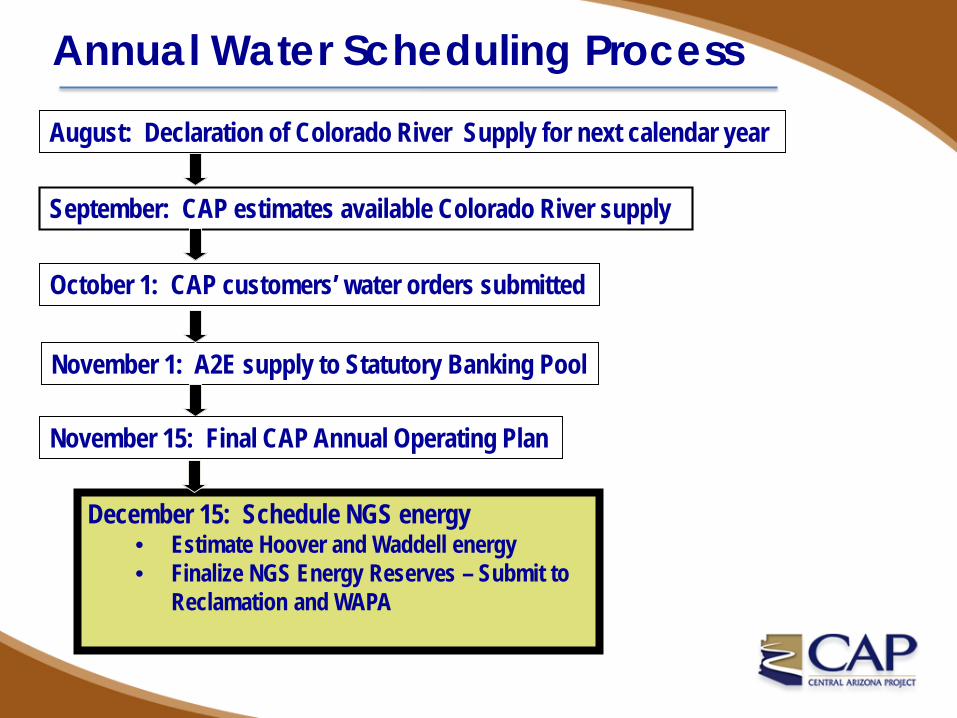
Annual Water Scheduling Process
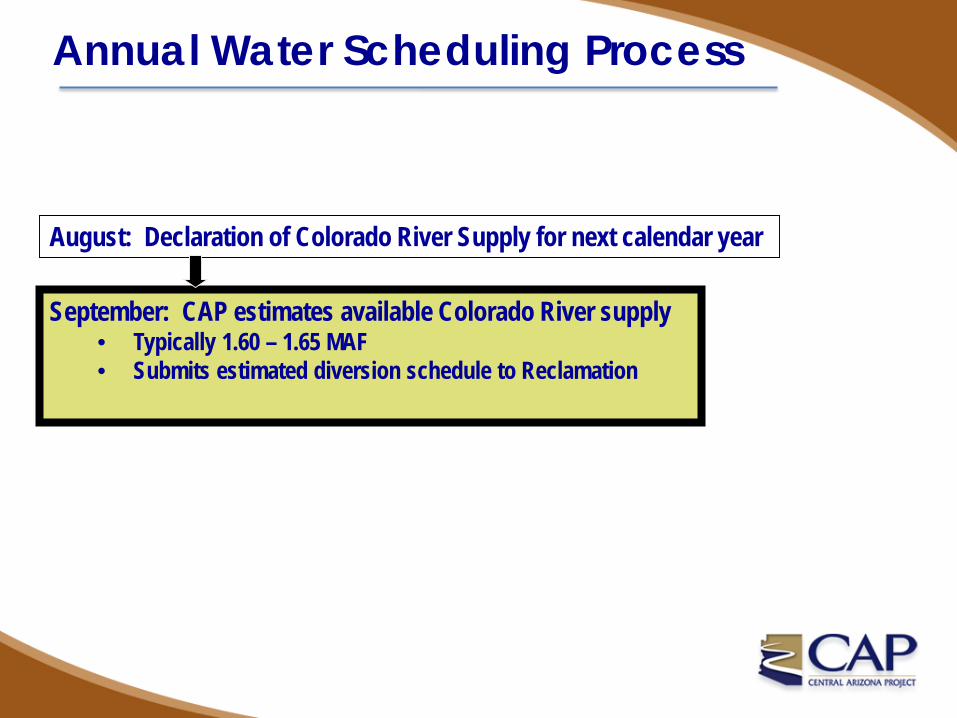
September: CAP estimates available Colorado River supply• Typically 1.60 – 1.65 MAF• Submits estimated diversion schedule to Reclamation
August: Declaration of Colorado River Supply for next calendar year
Annual Water Scheduling Process

September: CAP estimates available Colorado River supply
August: Declaration of Colorado River Supply for next calendar year
October 1: CAP customers’ water orders submitted• M&I• Federal/Indian (Oct. 10)• Ag Settlement Pool
Annual Water Scheduling Process

October 1: CAP customers’ water orders submitted
November 1: Access to Excess Supply - Statutory Banking Pool• AWBA • CAGRD – Replenishment Obligation & Reserve• Reclamation – Indian Firming
August: Declaration of Colorado River Supply for next calendar year
September: CAP estimates available Colorado River supply
Annual Water Scheduling Process

October 1: CAP customers’ water orders submitted
November 1: A2E supply to Statutory Banking Pool
November 15: Final CAP Annual Operating Plan• USF Recharge Capacities• Canal Capacities• Lake Pleasant storage & operations• Maintenance & Engineering Outages• Finalized Water Delivery Schedules
August: Declaration of Colorado River Supply for next calendar year
The Plan
September: CAP estimates available Colorado River supply
Annual Water Scheduling Process

October 1: CAP customers’ water orders submitted
November 1: A2E supply to Statutory Banking Pool
December 15: Schedule NGS energy• Estimate Hoover and Waddell energy• Finalize NGS Energy Reserves – Submit to
Reclamation and WAPA
August: Declaration of Colorado River Supply for next calendar year
September: CAP estimates available Colorado River supply
November 15: Final CAP Annual Operating Plan
Annual Water Scheduling Process

Near-Term CAP Projections
Near-term CAP order projections are developed annually to assist operations and planning.
Assumptions:
o Normal year delivery volume of 1.54 MAFo 2014: 1.525 MAF deliveredo 2015: 1.578 MAF ordered
o No major changes in customer orderso Slight increase in long-term contract orders above 2015o Similar rate of Long-Term Storage Credit (LTSC) accrual
o Increased availability of NIA-priority watero White Mountain Apache Tribe’s allocation finalized by
2016o Recent NIA reallocation (46,629 AF) finalized and
ordered in 2017

CAP
Deliv
ery
Prio
rity
Low
High
2016 Projected CAP Orders
0
200,000
400,000
600,000
800,000
1,000,000
1,200,000
1,400,000
1,600,000
Acr
e Fe
et
Indian Priority 326 KAF
M&I Priority 441 KAF
NIA Priority 178 KAF
Ag Pool 400 KAF
Other Excess 127 KAF
Priority 3 - 68 KAF
ExcessWater
Long-termContract
Water

0
200,000
400,000
600,000
800,000
1,000,000
1,200,000
1,400,000
1,600,000
Acr
e Fe
et
Indian Priority 326 KAF
M&I Priority 441 KAF
NIA Priority 178 KAF
Ag Pool 208 KAF
Ag Pool Shortage 192 KAF
Other Excess Shortage
320,
000
Priority 3 - 68 KAF
CAP
Deliv
ery
Prio
rity
Low
High
2016 Projected Tier 1 Shortage Impact
0
200,000
400,000
600,000
800,000
1,000,000
1,200,000
1,400,000
1,600,000
Acr
e Fe
et
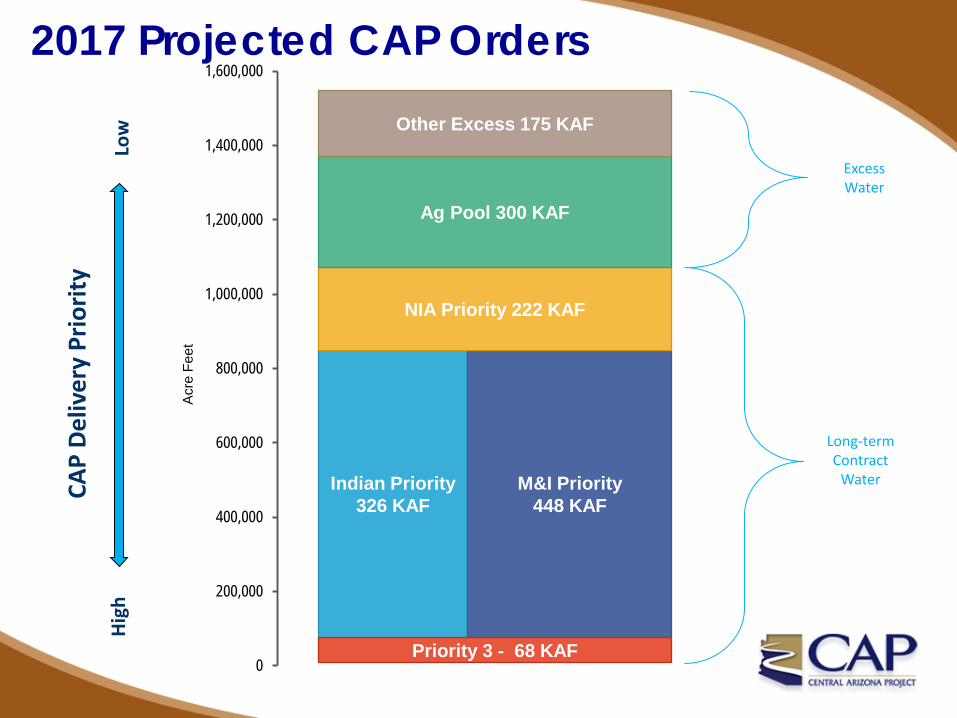
Indian Priority 326 KAF
M&I Priority 448 KAF
NIA Priority 222 KAF
Ag Pool 300 KAF
Other Excess 175 KAF
Priority 3 - 68 KAF
CAP
Deliv
ery
Prio
rity
Low
High
2017 Projected CAP Orders
ExcessWater
Long-termContract
Water

0
200,000
400,000
600,000
800,000
1,000,000
1,200,000
1,400,000
1,600,000
Acr
e Fe
et
Indian Priority 326 KAF
M&I Priority 448 KAF
NIA Priority 222 KAF
Ag Pool 157 KAF
Ag Pool Shortage 143 KAF
Other Excess Shortage
320,
000
Priority 3 - 68 KAF
CAP
Deliv
ery
Prio
rity
Low
High
2017 Projected Tier 1 Shortage Impact

0
200,000
400,000
600,000
800,000
1,000,000
1,200,000
1,400,000
1,600,000
Acr
e Fe
et
Indian Priority 326 KAF
M&I Priority 448 KAF
NIA Priority 222 KAF
Ag Pool 77 KAF
Ag Pool Shortage 223 KAF
Other Excess Shortage
400,
000
Priority 3 - 68 KAF
CAP
Deliv
ery
Prio
rity
Low
High
Near-term Tier 2 Shortage Impact

Projection Uncertainties
o There are several CAP supply & demand uncertaintieso On-river use total available CAP delivery supplyo Changes in customer ordering patternso Availability of other supplies
o There are additional uncertainties during shortageo Drought-related conservation or behavioral changes
affecting long-term contract orderso Impact of rate increases

Questions?