shot peening simulation using discrete and finite … · shot peening simulation using discrete and...
TRANSCRIPT

Shot Peening Simulation using Discrete and Finite
Element Methods
Baskaran Bhuvaraghana,∗, Sivakumar M.Srinivasanb, Bob Maffeoc, RobertD McCLainc, Yogesh Potdard, Om Prakashe
aGE Aviation, Bangalore, IndiabDepartment of Applied Mechanics, IIT Madras, Chennai, India
cGE Aviation, Cincinnati, OH, USAdGE Global Research, Niskayuna, NY, USA
eex GE Global Research Research, Bangalore, India
Abstract
Modeling shot peening process is very complex as it involves the interactionof metallic surfaces with a large number of shots of very small diameter. Con-ventionally such problems are solved using the finite element software (suchas ABAQUS) to predict the stresses and strains. However, the number ofshots involved and the number of elements required in a real-life componentsfor a 100% coverage that lasts a considerable duration of peening make suchan approach impracticable. Ideally, a method that is suitable for obtainingresidual compressive stresses (RCS) and the amount of plastic deformationswith the least computational effort seems a dire need.
In this paper, an attempt has been made to address this issue by us-ing the discrete element method (DEM) in combination with the finite ele-ment method (FEM) to obtain reasonably accurate predictions of the residualstresses and plastic strains. In the proposed approach, the spatial informa-tion of force versus time from the DEM simulation is utilized in the FE Modelto solve the shot peening problem as a transient problem. The results showthat the RCS distribution obtained closely matches with that of the com-
∗Corresponding author. Address: GE India Technology Center,122, EPIP,WhitefieldRoad, Bangalore-560066, ph: +919980017207, fax:+918028413113
Email addresses: [email protected] (Baskaran Bhuvaraghan),[email protected] (Sivakumar M.Srinivasan), [email protected] (Bob Maffeo),[email protected] (Robert D McCLain), [email protected] (YogeshPotdar), [email protected] (Om Prakash)
Preprint submitted to Advances in Engineering Software May 22, 2010
putationally intensive direct FEM simulation. It has also been established,in this paper, that this method works well even in the situations where therobust unit cell approaches are found to be difficult to handle.
Key words: shot peening, finite element method, discrete element method
1. Introduction
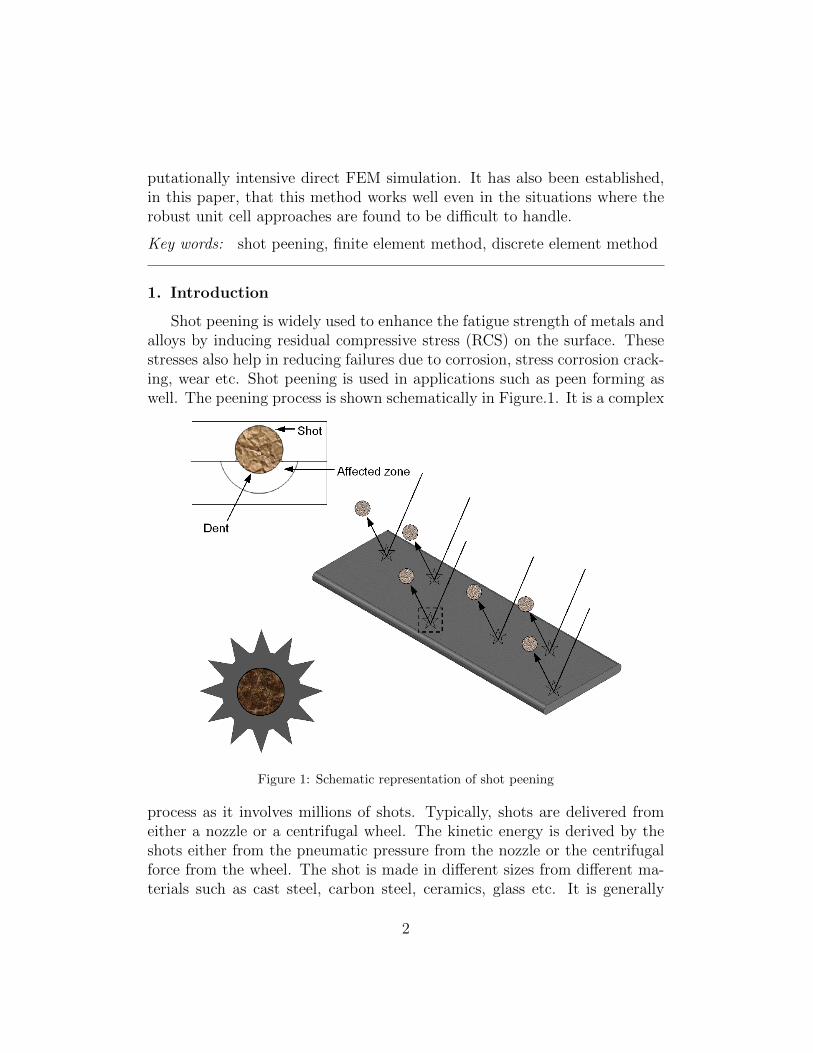
Shot peening is widely used to enhance the fatigue strength of metals andalloys by inducing residual compressive stress (RCS) on the surface. Thesestresses also help in reducing failures due to corrosion, stress corrosion crack-ing, wear etc. Shot peening is used in applications such as peen forming aswell. The peening process is shown schematically in Figure.1. It is a complex
Figure 1: Schematic representation of shot peening
process as it involves millions of shots. Typically, shots are delivered fromeither a nozzle or a centrifugal wheel. The kinetic energy is derived by theshots either from the pneumatic pressure from the nozzle or the centrifugalforce from the wheel. The shot is made in different sizes from different ma-terials such as cast steel, carbon steel, ceramics, glass etc. It is generally
2

Figure 2: Data flow in DEM. The shots are generated and contacts between the shotsand the surface are evaluated. If contact exists, the forces are calculated based on theoverlap. The frame is modified to depict post-contact situation. New shots are added andthe process continues till the simulation time is completed.
spherical in shape. Shot peening generates cold work and surface roughnessalong with the RCS.
In order to control the process, many variables related to both shot andtarget metal surface need to be monitored. The following are the key pa-rameters that affect the work hardening and hence the compressive stresses[1]:
• shot size, velocity, material, hardness
• angle of impact of the shot
• target material and hardness
• friction between shot and target
Understanding the effect of these parameters on the material behavior dueto shot peening is important for the designer to reduce the overall cost of theparts.
A large number of studies have been performed on shot peening exper-imentally. In this approach, parts are shot peened with a set of peeningparameters for a certain coverage. Then these parts are subjected to fatiguetesting. If the fatigue performance is adequate, then the subsequently man-ufactured parts are also subjected to the same peening conditions. However,the determination of peening parameters needs to be repeated through fur-ther experimentation if the part does not meet the fatigue life, resulting inhuge costs.
3

Figure 3: Shot Peening by Baskaran et al (2008). The figure shows the shot peeningsimulation.
Theoretical methods, therefore, have been employed to predict the RCSto reduce the experimental costs. Details of research using such methodscan be found in [2, 3]. FEM is primarily used in the peening simulation forevaluation of the RCS based on unit cells, as it can accommodate featuressuch as strain rate variations, impact friction and complex material proper-ties. However, there are limitations in using FEM as the numerical tool. Inreal-life components, the geometry of the features is complex. These featuresare peened using a large number of shots. The indentation created by eachshot is in the order of 0.1-0.3 mm in diameter. To capture the stress varia-tion, these indentation zones must be further divided into smaller elements.This approach will result in large number of elements for the entire part. Afew attempts have been made by the researchers to simulate large number ofimpacts using FEM. An example in this direction involves impacts of nearly1000 shots using the explicit-implicit analysis by Wang and Platts[4]. Thus,the complex features of real-life components that are shot peened with a largenumber of shots are yet to be modeled to capture the residual stresses.
Numerical methods that will handle numerous interactions of particleswill be useful to solve this problem. Discrete element method (DEM) is a
4

Figure 4: Combined DEM-FEM method indicating the how residual stresses are calculatedusing DEM and then FEM. The geometry is exported to DEM where the contact forceor pressure distribution is obtained. These loadings are applied on FE mesh to get thestresses/strains.
method used in particle simulation and it was originally developed by Cundallet al.[5]. It cannot be directly used in solving a shot peening problem. Atypical data flow in DEM is shown in Figure.2. It uses Newton’s laws topredict the position, velocity and acceleration of shots. Different contactmodels exist to predict the contact forces.
An overview of combined DEM-FEM is given in Ref.[6] where the inter-actions between entities are governed by DEM while each entity is meshedby FEM. Han et al.[7] have performed a two-dimensional analysis treatingthe sphere as a rigid circle. They have used different interaction laws (linear,Hertz, Winkler and power laws) and also included damping. The work hasbeen extended further to three-dimensional simulation [8]. They have alsosimulated multiple impacts with a few shots at predetermined locations. Thestrain distribution due to shot peening is evaluated using combined DEM-FEM method at micro-level and the same are applied to the peen-formedcomponent [9]. This method is based on the practical assumption that thestresses and strains on the component surfaces will be the same when theyare subjected to the same peening conditions. The big advantage of themethod is the use of coarse mesh at the component level. Hong et al.[10]have used DEM to determine the effect of mass flow rate, shot initial veloc-ity and angle of incidence on the energy loss on the target surface. They
5

have evaluated the necessary coefficient of restitution (CoR) from shot-shotand shot-plate interactions using ABAQUS Explicit software. Baskaran etal. have used DEM for shot peening simulation and provided a process mapto link DEM and FEM [11]. A schematic peening simulation using DEM isgiven in Figure.3. The method employed to simulate the peening is shownin Figure.4. This process focused on using transient FEM analysis to get theresidual stresses from contact pressures, calculated from the contact forcesobtained from DEM. This process capability was demonstrated for a singleshot impact at an angle of 90◦ on the target surface. While the above men-tioned researches have used DEM in shot peening simulations, they do notpredict the RCS in actual component features employing large number ofshots generated randomly. The current procedure employs multiple randomshots aimed at calculating RCS more accurately in actual components andtheir features. It provides comparable results with reduced computationalcosts. A case study involving peening of a bolt hole is performed using theDEM-FEM method.
The paper is arranged as follows. After a brief overview of the process, theDEM and FEM software tools that are used in the simulation are discussed.Subsequently, different simulations are performed to establish the processfor DEM-FEM. In the first simulation, the impact is simulated in FEM aswell as DEM to compare the contact parameters from the two different ap-proaches. In the second simulation, the material response in terms of RCSand strains are compared between the methods with impact simulation andcontact pressure application in FEM. Enhancements of incorporating infiniteelements and CoR due to strain-hardening are considered in the next sub-sections. The case study of peening the bolt hole using deflector peening ispresented in the next section. To perform this simulation, a set of interfaceprograms between DEM with FEM are developed. The techniques that havebeen employed to reduce the computational resources are also brought outduring the discussion on case study. Thus the current process has the abilityto combine DEM with FEM to get comparable results with less computingresources.
2. Sequentially coupled DEM-FEM method
The current method is shown in the process map (Figure.5). In thisstudy, the process mentioned in [11] is improved to accommodate impacts ofmultiple shots.
6

Figure 5: Top level process map. The chart shows the data flow between DEM and FEMsimulations.
1. Selection of the appropriate software tools for performing the DEM andFEM simulations (Section. 2.1).
2. A single shot impact analysis is performed in both FEM and a DEM-FEM analysis. The responses such as contact duration, force, velocityand momentum are compared. (Section. 2.2). In addition, from thesingle shot impact simulation, the spatial and temporal pressure distri-bution along with the respective contact forces are obtained during thecontact duration. In addition, the indentation diameter is obtained fordefining the pressure zone dimension to be used in the FEM analysis.
3. The effects of applying equivalent pressure in lieu of loads due to singleshot impact are evaluated. (Section. 2.3)
4. The infinite element boundaries are used to reduce the the componentFE mesh size further (Section. 2.4). The location of such boundariesis optimized for maintaining the accuracy of the RCS prediction.
5. From a multiple co-indentation study, an average CoR is calculated(Section. 2.5). The averaging helps to impart the plasticity effect that
7

Figure 6: Normalized stress-strain curves for Inco718. The properties are obtained usingJohnson-Cook equation.
takes care of strain hardening due to multiple impacts.
6. Once the contact forces and their locations are calculated in DEM,the data is transferred to FEM through a set of programs. Based onthe pressure versus contact force look-up table from single shot impactanalysis, the contact forces from DEM simulation are converted intoequivalent pressure loads. An explicit simulation in FEM is performedusing the information obtained from above steps to get the RCS distri-bution. This is demonstrated through a case study.
The shot is assumed to be rigid and spherical in shape. It is assumed to havethe properties of SAE 1070 steel(Table.1). The target material is assumedto be Inco718 whose properties are also listed in the same table. As theimpact occurs for a very short duration, strain-rate dependent elastic-plasticproperties are more appropriate to use. Figure.6 shows the stress-strainproperties of Inco718 for different strain rates. These curves are deducedusing appropriate constants Johnson-Cook equation. The yield strengths arenormalized with respect to static yield point.
8

Sl. No. Shot Target1 Material Steel Inco7182 ρ(kg/m3) 7800 82003 E (GPa) 210 2114 ν 0.3 0.29
Table 1: Properties for shot and target materials
2.1. Discussions on softwares used
In the FEM domain, ABAQUS software (version 6.9) from SIMULIACorporation is used due to its non-linear and impact capabilities [12]. Thecurrent study uses EDEM for DEM simulations [13]. The advantages of DEMsoftware are:
• The effects of variation in shot sizes, shapes and velocities can be in-cluded.
• Shots can be generated in a random manner with a specified mass flowrate.
• The relative motion of the factory(representing nozzle or wheel) andthe target object can be easily modeled.
• Multiple sources of shots from factories can be implemented.
• Orientation and size of the factories can be modeled to be realistic.
• Special peening operations such as hole-peening using deflectors can beeasily performed (Section. 3).
The software has the following limiting features that need to be taken careof:
• The collisions are elastic. In shot peening process, the collisions areelastic-plastic. This is circumvented by using the coefficient of restitu-tion(CoR) from FEM analysis.
• DEM does not calculate the stresses and plastic strains automatically.It needs customized post-processing of the results that are inputtedinto FEM to predict the residual stresses.
9

• It provides the information about the location of contact point betweenshot and the target surface. The forces at the contact point from DEMneed to be converted into spatial distribution of pressure over the con-tact zone in FEM.
• DEM needs coarse mesh while FEM mesh needs to be fine to capturethe stress variation.
• The rebound angle is based on the undeformed target surface and theeffects of surface variation due to previous impacts are ignored.
2.2. Comparison of contact parameters between FEM and DEM
Figure 7: Single shot DEM-FEM Analysis Process
It is assumed that results from the FEM analysis are considered as refer-ence. With a single shot impact analysis in both FEM and DEM methods,it is verified if the force, velocity, contact duration and energy transfer areclose. The process map is shown in Figure. 7. The assumptions made in thecurrent approach are:
• The shot is assumed to impact the surface in normal direction.
• The effect of friction is ignored as it does not have much influence onthe RCS.
10

Figure 8: Peening with single shot (FEM)
FEM Method. A unit cell approach is used for single shot simulation. The FEmodel is shown in Figure.8. The shot is of 0.3556 mm. Symmetry boundaryconditions are applied appropriately on the four sides and the bottom surfaceis vertically supported. Both shot and the target are modeled with C3D8Rhexagonal elements with reduced integration. A rigid constraint is createdbetween the center of the shot(reference point) and its elements. The shotproperties are given in Table.1. A velocity of 62.5 m/s is applied during theimpact simulation. Subsequently, a static stabilization run is performed toeliminate the inertial effects.
CoR is calculated from the FEM analysis from the velocities of the shotbefore and after the impact. The pressure distribution derived from FEMsimulation (Figure.9) is almost uniform in the set of nodes within the dentarea. The values are normalized with respect to the static yield point, (σy).As can be seen, the pressure value is about 3σy.This result matches with thefindings from [14] where plastic impact creates a flat pressure distribution.From this analysis, thus, the following information are captured:
• Coefficient of restitution (CoR) between shot and target surface (to
11

Figure 9: Pressure Application in contact zone. The peak pressure is almost flat.
simulate the energy loss due to plasticity).
• Indentation diameter (for applying the pressure).
• Contact pressure variation along the contact radius with respect totime (to normalize with respect to contact forces from DEM).
DEM Method . In this step, the surface details of the target are capturedtypically by tessellation through Stereo-lithography (STL) format and havebeen imported into DEM. Alternatively, a finite element mesh can also beimported into DEM. Typical DEM model is shown in Figure.10, where thesizes of the flat plate and the tiny shots can be compared.
The mesh due to tessellation needs to be at optimum size in order tocorrectly capture the contact forces. Following are the requirements for DEM:
• The element edge length should be at least as large as the diameter ofthe shot. A finer mesh is likely to cause the contact overlap spanningacross many elements, causing possibly uneven distribution of pressure.Since, the main purpose of the mesh is contact detection, the numberof elements must be just adequate to describe the geometry. Moreelements are likely to increase the simulation time.
• The time step should be not more than 20-40% of Rayleigh time stepwhich is given by:
TR =πR( ρ
G)0.5
0.1631ν + 0.8766(1)
where R, ρ, G and ν are the shot radius, density, shear modulus andpoisson’s ratio respectively.
12

Figure 10: Relative size of triangular mesh and the shots
The same set of shot parameters are applied in the DEM simulation as usedin FEM. The CoR of 0.4 is applied from the single shot FEM results. Theelastic material properties are input for both shot and the work-piece (Ref.Table.1). The application of CoR simulates the elastic-plastic collision andthus the energy transfer between the shot and the work-piece.
The results are compared in Figure.11 and 12. The velocity after reboundis the same in both cases, as the CoR is kept the same. However, in DEMthe drop of velocity and subsequent rebound happens earlier than in FEM.Also, the magnitude of contact force is lower in DEM than in FEM. But thecontact duration is the same in both cases. Besides, the total momentumtransfered is the same in both cases as compared in the Table.2. Thus basedon the values of momentum and contact duration, it can be concluded thatthe FEM alone and DEM-FEM simulations are very close. The differencein force value can be accounted by normalizing the look-up table properlybetween contact pressure and contact force.
13

Figure 11: Velocity Comparison between FEM and DEM. The velocity change is quickerin DEM than FEM.
Figure 12: Force Comparison between FEM and DEM. The FEM produces higher contactforce than DEM.
Sl No Parameter DEM FEM Variation1 Maximum Force, N 87.8 111.6 27%2 Contact Duration, sec 5.0e-7 5.0e-7 0%3 Force x Duration 2.70e-5 2.69e-5 0.5%
Table 2: Comparison between DEM and FEM single shot results. The table shows thatDEM results can be used to replace contact modeling in FEM, as momentum values aresame.
2.3. Equivalent pressure application
The next step is to compare the results from a single shot impact onthe target material with the results when equivalent pressures are applied.
14

Again a FEM based unit cell approach is followed to determine the residualstresses in both cases. The shot is assumed to impact the surface in normaldirection. The pressure distribution is shown in Figure.9. Figure.13 showsthe normalized stress with respect to static yield point of Inco718 for bothcases. The stresses due to shot impact and equivalent pressure applicationmatch very well indicating that the process can be used for the features ofactual parts. Since the contact detection is totally eliminated, the simulationis faster when contact pressures are applied as can be seen in Table.3.
Figure 13: Stress due to impact versus pressure application. This investigation has beendone to apply equivalent pressures in stead of forces.
Sl No Loading Type CPU Time1 Single Shot Impact 19.1 sec2 Pressure Application 14.1 sec
Table 3: Comparison between single shot and pressure application results. Pressure ap-plication reduces the simulation time as no contact detection is involved.
2.4. Using infinite elements
The usage of DEM practically eliminates the need of modeling shots inFEM in our current approach. Only the target component needs to be ide-alized in FEM. As the surface stresses are of main interest, the mesh has tobe very fine in the surface layers. Therefore, even without the need to modelthe shots, the current approach can lead to enormous number of elements.
15

As shot peening is a surface phenomenon, if the meshing of inner materialcan be avoided, it will reduce the FEM model size. The ABAQUS softwarehas the feature of infinite element that absorbs the shock wave propagation.This feature is utilized to avoid meshing of inner material by coating thefinite elements with a layer of infinite elements. For example, a 3D analysison unit cell has been performed by Schwarzer for simulating multiple impactsusing ABAQUS-explicit tool that uses infinite boundaries used to dampenthe stress oscillations[15]. Thus, a layer of infinite elements can be includedat the appropriate location beyond the finite elements in the current processto avoid the meshing of the inner material of the part as shown in Figure.14.
Figure 14: Modeling of infinite elements. A layer of infinite elements is added at theoutermost FEM layer normal to the wave direction.
16

A set of runs using FEM have been made to determine the minimumdepth to which the finite elements need to be present. The target materialis assumed to be Inco718, whose properties are given in Figure.6. The FEM-only mesh is supported at the bottom surface in the direction of the impact.The FEM-infinite element mesh has no support in the vertical direction. Thesame set of shot and target parameters, which have been used in the previousanalyses, are used. For the given set of shot properties and target material,it is found that a minimum depth of 0.375 mm is required for the finiteelement mesh (Figure.14) to develop the same RCS distribution when it issupported at the bottom. If the FE mesh is thinner than this, sufficient andcorrect distribution of RCS is not developed when a layer of infinite elementsis present. Thus, the layer of material provides enough resistance for RCS todevelop, when the thickness of FE mesh is significant. This is a function ofshot parameters (such as size, velocity, angle) and the target material prop-erties (such as hardness). Figure.15 compares the stresses, normalized withstatic yield point, for the cases with and without infinite elements developedin a thickness 0.375 mm.
Figure 15: Comparison of stresses with and without infinite elements. RCS in both casesare close enough to use infinite elements in stead of modeling the entire inner material.
17

2.5. Calculation of CoR
The CoR is a function of shot velocity, shot material, angle of impact,target material hardness etc. For a given set of shot, target material, ve-locity and nozzle orientation, the CoR as calculated from FEM software isassumed to be a constant. The CoR will be higher due to the higher dy-namic yield strength of the target material at higher strain rates. To have a100% coverage, when the shots are delivered in a random basis it is requiredto have 3-4 times the number of shots that will be required when they arepositioned in an orderly manner. In other words, each point is likely to behit 3-4 times in an average sense [16]. It implies that as the target materialis strain-hardening, subsequent impacts at the same location is likely to hita harder surface than the previous ones. To take into the effect of strainhardening in the calculations, a FEM analysis with multiple impacts at thesame location has been performed and the average CoR has been evaluated.The Table.4 shows the variation of CoR due to strain-hardening effect of the
Impact No Input velocity Rebound Velocity CoRm/sec m/sec
1 100 40.27 0.3962 100 54.04 0.5403 100 58.28 0.5834 100 76.31 0.763
Table 4: Variation of CoR due to strain-hardening. Due to successive impacts, the materialhardens further resulting in increased CoR.
target material. The average CoR is found to be 0.57.
3. Case study: Deflector peening of a bolt hole
The next step is to simulate multi-ball simulation in DEM. The test casechosen is peening simulation of a bolt hole. A special method called deflectorpeening is employed to peen the holes which are small in size. The bolt holein consideration is 7.5 mm in diameter and 25 mm long. A rigid rod is usedto deflect the shots from the nozzle onto the hole surface (Figure.16).
The process can be divided into four steps. In the first step, impactanalysis is performed on a unit cell with single shot. This step enables usto capture the required information (such as indentation diameter, pressurevalues for respective contact force magnitudes over the contact duration)
18

Figure 16: Deflector peening of bolt hole. The shots from nozzle are deflected by the rodonto the bole hole.
Figure 17: Bolt hole mesh. The model uses reduced integration elements in the impactzone and one layer of infinite elements.
19

for the next step which is a DEM analysis. In the third step, the resultsfrom DEM native format are translated to FEM-specific format. Again weperform FEM analysis in the fourth step using the results obtained fromDEM analysis.
Step 1-Single shot FEM analysis:. A unit cell is used for the FEM simulation.The shot and target material are the same as before. The shot diameter isalso 0.3556mm. The FE model is shown in Figure.8. From this analysis,thus, the following information are captured:
• Coefficient of Restitution (CoR) between shot and target surface (tosimulate the energy loss due to plasticity).
• Indentation diameter (for applying the pressure).
• Contact pressure variation along the contact radius with respect totime (to normalize with respect to contact forces from DEM).
Then, a look-up table between the contact force and maximum pressure fromsingle shot analysis is established.
Step 2-DEM analysis:. The surface of the CAD model is imported in DEMsoftware. The CoR between shot and target surface is assumed to be 0.57as calculated before in multiple shot simulation. The factory that representsthe nozzle is designed to generate the shots at any angle to the target platewith a specified velocity. The mass flow rate and the duration of simulationis adjusted to be in line with the actual process. The gravity effects can alsobe added if required. The rate of delivery of shots is assumed to be around40000/sec which is equivalent to the mass flow rate of shots. The deflectorrod is given a translational velocity so that it moves from one end of the holeto the other along the axis of the hole. The shots from the nozzle impact therod and then deflected on the hole surface. There can be impacts betweenshots as well. The shots that leave the domain are ignored for further analysisas discussed before. The FE mesh of a part of the hole is shown in Figure.17.
The DEM program calculates the forces due to the shot impacts andthe location of such collisions. It provides the following results during thesimulation:
• Contact point coordinates
• Contact force component magnitudes
20

• Friction force component magnitudes
Since, friction does not play a big role in the magnitude of residual stresses,the effect of friction is ignored. The remaining data are used to apply thepressure loading on the FEM model.
Step 3-Transfer of data from DEM to FEM. These forces are transferred insuitable format to the FEM software using a set of translator program. APERL language based script has been developed to transfer these data fromthe native DEM format to FEM loads format. The process of capturing thesedata into FEM format is depicted in the flow chart (Figure.18). The PERLscript needs:
• the surface nodes and the connectivity of the elements on the surfacefrom FE model.
• the contact point coordinates and the components of contact forcesfrom the results obtained from DEM.
First the set of FE nodes that form the target surface are sorted in X, Yand then Z directions. The sorting is done to speed-up the selection of nodefrom FEM model for every contact point determined through DEM analysis.Next the contact locations and the forces are extracted from the DEM out-put. From the coordinates of every contact point from DEM simulation, thenearest node on the FEM model is determined. Based on the indentationradius from single shot FEM results, the adjoining nodes and connected ele-ments in the bolt hole FE model are selected. These zones define the pressureapplication areas. From the contact force calculated from DEM analysis, thepressure distribution is interpolated. To perform the interpolation, first aforce factor is determined as the ratio of maximum force from FEM to themaximum force from DEM. From the look-up table calculated from singleshot impact analysis, the pressure distribution for every impact is determinedbased on the force factor.
During the DEM simulation, the output from DEM is generated at fixedtime intervals. In DEM results, the forces due to single impact at a contactlocation can spread over multiple time intervals. The program captures suchimpacts and combine them to a single impact by extracting the contactlocation and maximum force components for each impact. If the impactoccurs on an edge or corner of the tessellation in DEM, the program has theability to eliminate redundant data and it retains only one set of data.
21

Figure 18: Data extraction process from DEM to FEM. The contact forces and locationsare extracted from DEM and converted to equivalent pressures for FEM analysis.
Figure 19: Loading zone identification. The circular pressure zone is modeled as a octag-onal zone to follow the mesh pattern.
Step 4- FEM Analysis. The work-piece is modeled in FE software with finemesh that can capture the pressure variations as the contact occurs. Thesurfaces on the sides of the hole mesh are applied with symmetry boundaryconditions appropriately. The pressure zone is assumed to be octagonal. Asthe meshing is performed with 8-noded C3D8R brick elements, the size of theoctagonal zone is chosen to be close to a circular pressure zone(Figure.19).The analysis is done as a transient explicit dynamic analysis to predict the
22

Figure 20: RCS distribution during multi-shot simulation. It can be observed that theRCS is very similar to the observed phenomenon.
stresses accurately so that inertial effects are also captured.
4. Results and Discussions
4.1. Residual compressive stress
Multiple impact simulation is performed on the bolt hole. Figure.20 showsRCS distribution. These values are captured in the location where a singleshot impact is present. Due to the orientation and velocity component, aload factor of 0.7422 is used at this location. Figure.21 depicts the impactlocations of the shots during the simulation. As can be seen in the figure, thefirst round of impact simulation of bolt hole peening has a very low coverage.To get 100% coverage, the DEM simulations have to be repeated more times,but FEM simulation has to be performed only once.
4.2. Reduction of computing resources
Different measures that have been implemented have resulted in signif-icant reduction of memory and hard disk requirements and improving thesimulation time.
23

Figure 21: Impact locations on bolt hole. These locations are generated during DEMsimulation and transferred to FEM simulation through the translator programs.
FEM model size. The DEM-FEM approach has eliminated the need to modelthe shots in FEM, thus reducing the model size many folds. Still, the numberof elements for the target in FEM required to predict the stresses accuratelyremains very high as we want to capture the RCS variation due to contactpressure during impact. This necessitates very high computer memory anddisk space. Including the infinite elements appropriately has helped to avoidthe modeling of inner material without sacrificing any accuracy.
FEM simulation time. The simulation time in FEM has been significantlyreduced by avoiding contact detection. Further speeding up of FEM runs hasbeen accomplished by grouping shots that are far away from each other. Ifthe RCS fields of far-away shots are not influenced by each other, then thoseimpacts are assumed to start at the same time. Figure.22 shows that twoshots impacting simultaneously have no bearing on each other’s stress regionwhen the distance between them is equal to or more than 1.5 times the shotdiameter. Using this result, the impact locations of shots that are far away
24

from each other are scanned and grouped. The translator program groupssuch impacts to the same start-time to reduce the number of Amplitudecurves that are generated for ABAQUS/Explicit run.
Figure 22: Effect of simultaneous impacts of two shots. Beyond 1.5 times shot diameter,the stress fields from the two impacts have very less effect on each other.
Simulation time in DEM. The duration has been reduced by suitably addingmore nozzles that do not interfere with each other through their shot deliverycan significantly speed up the process. In a different example, the authorshave used two nozzles simultaneously to peen the root fillet of a blade airfoil(Figure.23). One nozzle has been used for leading edge and the other fortrailing edge.
Computing resources in DEM. The simulation of shot peening process usingDEM software demands large computer resources in terms of disk space. Itcan exceed the file size limits for simulations involving several time steps.This limitation has been overcome by splitting the simulation process intomultiple steps and finally merging the results files.
5. Conclusions
The contact forces due to random peening obtained from DEM are appliedon the FEM model to make the residual stresses to be more realistic. Thenecessary computing resources are reduced by efficient contact detection inDEM (that eliminates the same in FEM) and elimination of shots outside
25

Figure 23: Speeding the simulation for fillet region. Two nozzles, one for pressure faceand another for suction face, are employed to reduce the simulation time.
the domain in DEM. Besides, splitting the DEM runs helps to manage diskspace efficiently and adding multiple nozzles in DEM to speed-up the peening.Significant saving also has been achieved by modeling of infinite elements inFEM to reduce the model size and effective combining of start time of far-away shots. At the same time, the accuracy of results by using appropriatematerial models in FEM is maintained, by using strain-rate dependent targetproperties and corresponding CoR.
Thus, combining DEM results and FEM provides an efficient tool tomodel the real-life feature of components such as bolt holes. Thus, thisprocess paves way for shot peening simulations on large components to getrealistic stresses.
The next ongoing steps are to get 100% coverage and to superpose thepredicted values of RCS and cold work on the surface of the components.The seminal work done by Han et al.[9] can be used to superpose the stressesand strains. The superposition step is important so as to subject the part
26
with RCS under service loads such as aircraft engine mission. In such cases,the material model needs to be revalidated to cover the relaxation behaviorof the material.
Acknowledgments. We like to thank GE Aviation for supporting the workand EDEM solutions for technical discussions. We also like to acknowledgethe help provided by our colleagues Sai Krishna and Mrinal Shukla.
References
[1] A. Niku-Lari, Shot peening, in: ICSP-1, Paris, 1981, pp. 1–21.
[2] B. Baskaran, S. M. Sivakumar, O. Prakash, Y. Potdar, B. Maffeo, P. Do-mas, Overview of the effetcs of surface enhancement processes on plasticstrain, work hardening and residual stresses, in: ICSP-10, Vol. 2008049,Tokyo, Japan, 2008, pp. 81–86.
[3] R. C. McClung, A literature survey on the stability and significanceof residual stresses during fatigue, Fatigue and Fracture of EngineeringMaterials and Structures 30 (3) (2007) 173–205.
[4] T. Wang, J. Platts, Finite element impact modelling for shot peen form-ing, in: ICSP-8, Garmisch-Partenkirchen, Germany, 2002, pp. 540–546.
[5] P. Cundall, O. Strack, A discrete numerical model for granular assem-blies, Geotechnique 29 (1979) 47–65.
[6] A. Munjiza, The Combined Finite-Discrete Element Method, Wiley,2004.
[7] K. Han, D. Peric, A. Crook, D. Owen, A combined finite/discrete ele-ment simulation of shot peening processes part I- study of 2D interactionlaws, Engineering Computations 17 (5) (2000) 593–619.
[8] K. Han, D. Peric, D. Owen, J. Yu, A combined finite/discrete elementsimulation of shot peening processes part II-3D interaction laws, Engi-neering Computations 17 (6-7) (2000) 680–702.
[9] K. Han, D. Owen, D. Peric, Combined Finite/Discrete element and Ex-plicit/Implicit simulations of peen forming processes, Engineering Com-putations 19 (1-2) (2002) 92–118.
27
[10] T. Hong, J. Ooi, J. Favier, B. Shaw, A numerical simulation to relatethe shot peening process parameters to the induced residual stresses, in:ICSP-9, Paris, France, 2005, pp. 100–106.
[11] B. Baskaran, S. M. Sivakumar, Y. Potdar, D. Paul, A. Srikanth,P. Weitzman, Shot peening modeling by combining DEM and FEM,in: ICSP-10, Vol. 2008049, Tokyo, Japan, 2008, pp. 131–142.
[12] ABAQUS User Manual Version 6.9, Hibbitt, Karlsson & Sorenson, Inc,2009.
[13] EDEM 1.3 User Guide, DEM Solutions, 2007.
[14] K. Johnson, Contact Mechanics, Cambridge University Press, 1987.
[15] J. Schwarzer, V. Schulze, O. Vohringer, Finite element simulation of shotpeening: A method to evaluate the influence of peening parameters onsurface characteristics, in: ICSP-8, Garmisch-Partenkirchen, Germany,2002, pp. 507–515.
[16] D. Lombardo, P. G. Bailey, The reality of shot peen coverage and dimpleinteractions, in: ICSP-6, San Francisco, USA, 1996, pp. 493–504.
28