should you believe in the shanghai ranking?
TRANSCRIPT
Scientometrics manuscript No.(will be inserted by the editor)
Should you believe in the Shanghai ranking?An MCDM view
Jean-Charles Billaut · Denis Bouyssou · Philippe Vincke
Received: date / Accepted: date. This version 5 October 2009
Abstract This paper proposes a critical analysis of the “Academic Ranking of World Universities”, publishedevery year by the Institute of Higher Education of the Jiao Tong University in Shanghai and more commonlyknown as the Shanghai ranking. After having recalled how the ranking is built, we first discuss the relevanceof the criteria and then analyze the proposed aggregation method. Our analysis uses tools and concepts fromMultiple Criteria Decision Making (MCDM). Our main conclusions are that the criteria that are used are notrelevant, that the aggregation methodology is plagued by a number of major problems and that the wholeexercise suffers from an insufficient attention paid to fundamental structuring issues. Hence, our view is thatthe Shanghai ranking, in spite of the media coverage it receives, does not qualify as a useful and pertinenttool to discuss the “quality” of academic institutions, let alone to guide the choice of students and family or topromote reforms of higher education systems. We outline the type of work that should be undertaken to offersound alternatives to the Shanghai ranking.
Keywords Shanghai ranking · Multiple criteria decision analysis · Evaluation models · Higher education
1 Introduction
In 2003, a group of people belonging to the Institute of Higher Education from the Jiao Tong University inShanghai published on their web site their first “Academic Ranking of World Universities” (ARWU 2003–09),more commonly known as the Shanghai ranking 1. This ranking consisted in an ordered list of 500 universitiesin the whole world. Since then, this group publishes each year an updated version of the ranking. A descriptionof the ranking can be found in Liu and Cheng (2005), whereas the story behind its creation is detailed in Liu(2009).
This paper is an abridged version of Billaut et al. (2009)
Jean-Charles BillautUniversite Francois Rabelais Tours, Laboratoire d’Informatique, 64 Avenue Jean Portalis, F-37200 Tours, France, E-mail: [email protected]
Denis BouyssouCNRS–LAMSADE, UMR 7024 & Universite Paris Dauphine, Place du Marechal de Lattre de Tassigny, F-75775 Paris Cedex 16,France, tel: +33 1 44 05 48 98, fax: +33 1 44 05 40 91, E-mail: [email protected]
Philippe VinckeUniversite Libre de Bruxelles, 50 avenue F. D. Roosevelt, CP. 130, B-1050 Bruxelles, Belgium, E-mail: [email protected]
1 Since then, the authors of the Shanghai ranking have also produced, starting in 2007, a ranking of institutions distinguishing5 different fields within Science, see http://www.arwu.org/ARWU-FIELD2008.htm. Since the methodology for these “fieldrankings” is quite similar to the one used for the “global ranking” analyzed in this paper, we will not further analyze them here.

2
This ranking was almost immediately the subject of an extraordinary media coverage. Not only politicaldecision makers used the results of the ranking so as to promote reforms of higher education systems butmany academic institutions began to use their position in this ranking in their institutional communication.Apparently, this looks like a true success story.
Yet, almost immediately after the release of the first ranking, this enterprize has been the subject of fierceattacks. One of the earlier one was due to van Raan (2005a), which started a vigorous exchange with the au-thors of the Shanghai ranking (Liu et al. 2005; van Raan 2005b). Since then the attacks have been numerousand strong both in the academic literature (Buela-Casal et al. 2007; Dill and Soo 2005; Gingras 2008; Ioan-nidis et al. 2007; van Raan 2006; Vincke 2009; Zitt and Filliatreau 2006) and in various reports and positionpapers (Bourdin 2008; Brooks 2005; HEFCE 2008; Dalsheimer and Despreaux 2008; Desbois 2007; Kivinenand Hedman 2008; Kavelmark 2007; Marginson 2007; Saisana and D’Hombres 2008; Stella and Woodhouse2006) 2. In views of such attacks, one could have expected a sharp decrease in the popularity of the Shanghairanking. It could even have triggered its authors to stop publishing it. Quite the contrary happened. Each year,a new version of the ranking is released and each year the media coverage of the ranking seems to increase.Moreover, projects of transformation of higher education systems often appeal to the results of the Shanghairanking. For instance, the present French Minister of Research and Higher Education was given by the FrenchPresident the mission “to have two institutions among the world top 20 and ten among the world top 100” 3
This paper wishes to be a contribution to the analysis of the strengths and weaknesses of the Shanghairanking. Our point of view will be that of persons specialized in Operations Research and having worked in thefield of evaluation and decision models with multiple criteria (Bouyssou et al. 2000, 2006; T’kindt and Billaut2006), while most of the previous analyses of the Shanghai ranking have concentrated on bibliometric aspects,starting with the important contribution of van Raan (2005a).
This paper is organized as follows. In Section 2, we will briefly describe how the authors of the Shanghairanking operate. Section 3 will discuss the various criteria that are used. Section 4 will present a MultipleCriteria Decision Making (MCDM) view on the Shanghai ranking. A final section will discuss our findings.
2 How the Shanghai ranking is built?
This section describes how the Shanghai ranking is built, based upon ARWU (2003–09) and Liu and Cheng(2005). We concentrate on the last edition of the ranking published in 2008 4 although the methodology hasvaried over time.
2.1 Who are the authors of the ranking?
The authors of the Shanghai ranking 5 are a group of people belonging to the Institute of Higher Eduction of theJiao Tong University in Shanghai. This group is headed by Professor Nian Cai Liu. According to Liu (2009),this group started its work on the ranking of universities in 1998, following an initial impulse of the Chinesegovernment (the “985 Project” referred to in Liu 2009).
The authors of the ranking admit (Liu et al. 2005, p. 108) that they had, when they started to work onthe subject, no particular expertise in bibliometry. They claim (Liu and Cheng 2005, p. 135) that they receiveno particular funding for producing the ranking and that they are guided mainly by academic considerations.This is at variance with the situation for rankings such as the one produced by the Times Higher EducationSupplement (2008).
2 Furthermore, several special issues of the journal Higher Education in Europe have been devoted to the debate around univer-sity rankings
3 letter dated 5 July 2007, our translation from French, source http://www.elysee.fr/, last accessed 18 September 2009.Unless otherwise stated, all URL mentioned below have been accessed at this date.
4 See http://www.arwu.org/rank2008/ARWU2008Methodology(EN).htm. The 2009 edition of the ranking is scheduledto be released in November 2009.
5 We will often simply refer to them in this paper as “the authors of the ranking”.

3
The announced objective of the authors of the ranking is to have a tool allowing them understand the gapbetween Chinese universities and “world-class universities”, with the obvious and legitimate aim of reducingthis gap. Because of the difficulty to obtain “internationally comparable data”, they decided to rank orderuniversities based on “academic or research performance” (Liu and Cheng 2005, p. 133).
2.2 How were the universities selected?
The authors claim to have analyzed around 2000 institutions worldwide (Liu and Cheng 2005, p. 127–128).This is supposed to include all institutions having Nobel prize and Fields medal laureates, a significant numberof papers published in Nature or Science, of highly cited researchers as given by Thomson Scientific (formerlyISI), and a significant amount of publications indexed in the Thomson Scientific databases. The authors of theranking claim that this includes all major universities in each country. The published ranking only includes500 institutions. The first 100 are ranked ordered. The remaining ones are rank by groups of 50 (till the 201thposition) and then 100.
2.3 The criteria
The authors use six criteria belonging to four distinct domains. They are presented below.
2.3.1 Quality of Education
This domain uses a single criterion: the number of alumni of the institution having received a Nobel prize(Peace and Literature are excluded, the Bank of Sweden prize in Economics included) or a Fields medal. Analumni is defined as a person having obtained a Bachelor, a Master or a Doctorate in the institution. If a laureatehas obtained a degree from several institutions, each one receives a share. All prizes and medals do not havethe same weight: they are “discounted” using a simple linear scheme (an award received after 1991 counts for100 %, an award received between 1981 and 1990 counts for 90 %, . . . ). When several persons are awardedthe prize or the medal, each institution receives a share.This defines the first criterion labeled ALU.
2.3.2 Quality of Faculty
This domain has two criteria. The first one counts the number of academic staff from the institution havingreceived a Nobel prize (with the same definition as above) or a Fields medal. The conventions for declaringthat someone is a member of the “academic staff” of an institution remain fuzzy. The following discountingscheme is applied: 100% for winners in after 2001, 90% for winners in 1991–2000, 80% for winners in 1981–1990, . . . , 10% for winners in 1911–1920. The case of multiple winners is treated as with criterion ALU. Whena person has several affiliations, each institution receives a share. This defines criterion AWA.
The second criterion in this domain is the number of highly cited researchers in each of the 21 areas ofScience identified by Thomson Scientific. These highly cited researchers, in each of the 21 domains, consist ina list of 250 persons who have received the largest number of citations in the domain according to the ThomsonScientific databases (see http://www.isihighlycited.com). This is computed over a period of 20 years. Thisdefines criterion HiCi.
2.3.3 Research output
This domain has two criteria. The first one is the number of papers published in Nature and Science by themembers of the academic staff of an institution during the last 5 years. This raises the problem of process-ing papers having multiple authors. The rule here is to give a weight of 100% to the corresponding authoraffiliation, 50% for first author affiliation (second author affiliation if the first author affiliation is the same as

4
corresponding author affiliation), 25% for the next author affiliation, and 10% for other author affiliations. Thisdefines criterion N&S. Since this criterion is little relevant for institutions specialized in Social and HumanSciences, it is “neutralized” for them.
The second criterion counts the number of papers published by the members of the academic staff of aninstitution. This count is performed using Thomson Scientific databases over a period of one year. Since it iswell known that the coverage of the Thomson Scientific databases is not satisfactory for Social and HumanSciences, a coefficient of 2 is allocated to each publication indexed in the Social Science Citation Index. Thisdefines criterion PUB.
2.3.4 Productivity
This domain has a single criterion. It consists in the “total score of the above five indicators divided by the num-ber of Full Time Equivalent (FTE) academic staff” (Liu and Cheng 2005, p. 129). This criterion is “ignored”when the number of FTE academic staff could not be obtained 6. This defines criterion Py.
2.4 Data collection
Data are mostly collected on the web. This involves the official site of the Nobel Prizes (http://nobelprize.org/nobel_prizes/), the official site of the International Mathematical Union (http://www.mathunion.org/general/prizes, and various Thomson Scientific sites (http://www.isihighlycited.com and http:
//www.isiknowledge.com). The authors of the ranking (ARWU 2003–09) do not exactly specify the source ofthe data for the number of FTE academic staff of each institution 7. The data used by the authors of the rankingare not made publicly available.
2.5 Normalization and aggregation
Each of the above six criteria is measured by a positive number. Each criterion is then normalized as follows. Ascore of 100 is given to the best scoring institution and all other scores are normalized accordingly. This leadsto a score between 0 and 100 for each institution.
The authors say that “adjustments are made” when the statistical analyses reveal “distorting effects” (Liuand Cheng 2005, p. 129). The nature and the scope of these adjustments are not made public (Florian 2007,shows that these adjustments are nevertheless important).
The authors use a weighted sum to aggregate these normalized scores. The weights of the six criteria areALU: 10%, AWA: 20%, N&S: 20%, HiCi: 20%, PUB: 20%, and Py: 10%. Hence each institution receives ascore between 0 and 100. The final scores are then normalized again so that the best institution receives a scoreof 100. This final normalized score is used to rank order the institutions.
2.6 The 2008 results
Table 1 gives the list of the best 20 universities in the world according to the 2008 edition of the Shanghairanking. Table 2 does the same for European universities.
A cursory look at Table 1 reveals the domination of US universities in the ranking. Within Europe, thedomination of the UK is striking.
6 In ARWU (2003–09), the authors of the ranking say that this number was obtained for “institutions in USA, UK, France,Japan, Italy, China, Australia, Netherlands, Sweden, Switzerland, Belgium, South Korea, Czech, Slovenia, New Zealand, etc.”. Wedo not know if this means that this number was obtained for all institutions in these countries and only for them.
7 More precisely, they mention in ARWU (2003–09) that this number was obtained “from national agencies such as NationalMinistry of Education, National Bureau of Statistics, National Association of Universities and Colleges, National Rector’s Confer-ence”.

5
Ran
kIn
stitu
tion
Cou
ntry
AL
UA
WA
HiC
iN
&S
PUB
PySc
ore
1H
arva
rdU
SA10
0.0
100.
010
0.0
100.
010
0.0
74.1
100.
02
Stan
ford
USA
40.0
78.7
86.6
68.9
71.6
66.9
73.7
3U
CB
erke
ley
USA
69.0
77.1
68.8
70.6
70.0
53.0
71.4
4C
ambr
idge
UK
90.3
91.5
53.6
56.0
64.1
65.0
70.4
5M
ITU
SA71
.080
.665
.668
.761
.653
.969
.66
Cal
Tech
USA
52.8
69.1
57.4
66.1
49.7
100.
065
.47
Col
umbi
aU
SA72
.465
.756
.552
.370
.546
.662
.58
Prin
ceto
nU
SA59
.380
.461
.940
.544
.859
.358
.99
Chi
cago
USA
67.4
81.9
50.5
39.5
51.9
41.3
57.1
10O
xfor
dU
K59
.057
.948
.452
.066
.045
.756
.811
Yal
eU
SA48
.543
.657
.055
.762
.448
.754
.912
Cor
nell
USA
41.5
51.3
54.1
52.3
64.7
40.4
54.1
13U
CL
osA
ngel
esU
SA24
.442
.857
.448
.975
.736
.052
.414
UC
San
Die
goU
SA15
.834
.059
.753
.066
.747
.450
.315
UPe
nnsy
lvan
iaU
SA31
.734
.458
.341
.369
.039
.249
.016
UW
ash
Seat
tleU
SA25
.731
.853
.149
.574
.128
.048
.317
UW
isc
Mad
ison
USA
38.4
35.5
52.6
41.2
68.1
28.8
47.4
18U
CSa
nFr
anci
sco
USA
0.0
36.8
54.1
51.5
60.8
47.5
46.6
19To
kyo
Uni
vJa
pan
32.2
14.1
43.1
51.9
83.3
35.0
46.4
20Jo
hns
Hop
kins
USA
45.8
27.8
41.3
48.7
68.5
24.8
45.5
Table 1 The best 20 universities in the world in the Shanghai ranking (2008). Source: ARWU (2003–09).
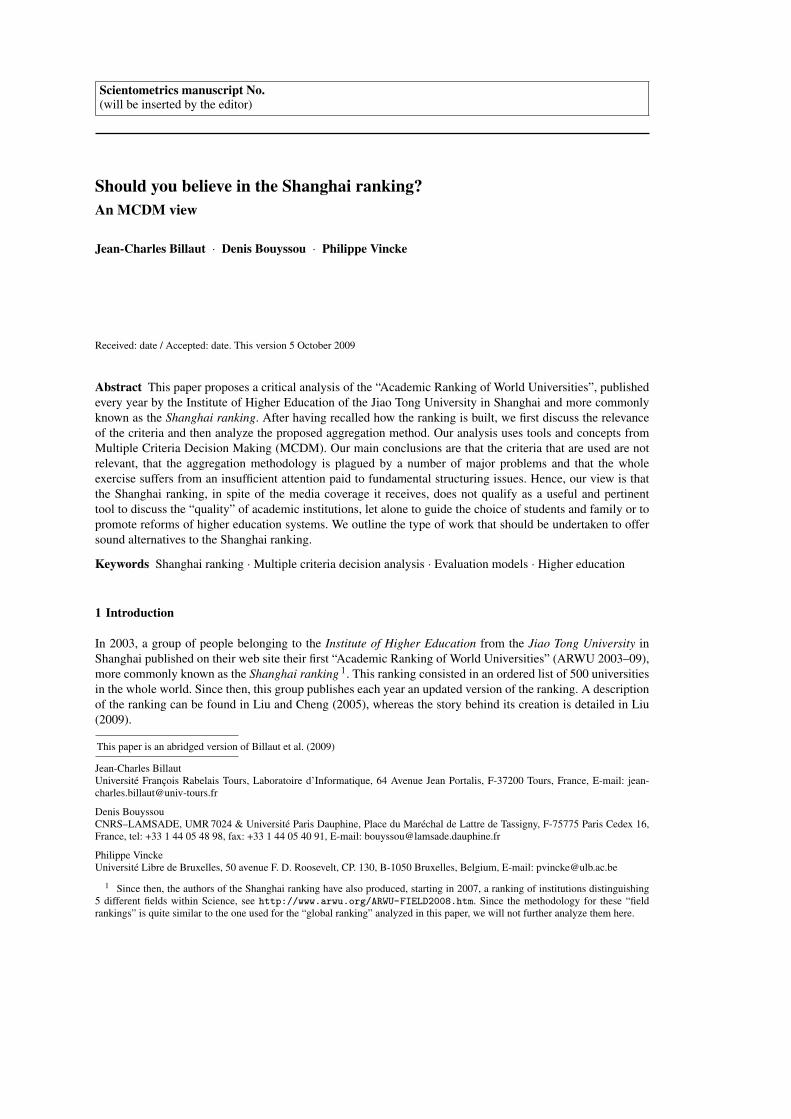
Figure 1 shows the distribution of the global normalized score for the 500 institutions included in theShanghai ranking. The curve becomes very flat as soon as one leaves the top 100 institutions.
We would like to conclude this brief presentation of the Shanghai ranking by giving three quotes takenfrom Liu and Cheng (2005, p. 135). The Shanghai ranking uses “carefully selected objective criteria”, is “basedon internationally comparable data that everyone can check”, and is such that “no subjective measures weretaken”.
3 An analysis of the criteria
We start our analysis of the Shanghai ranking by an examination of the six criteria that it uses. This analysismainly wishes to be a synthesis of the already large literature on the subject that was mentioned in Section 1 andmakes much use of van Raan (2005a). However, whereas the reviewed literature mainly draws on bibliometricconsiderations, we will also be influenced by the literature on MCDM on the structuration of objectives andthe construction of criteria.

6
Ran
kIn
stitu
tion
Cou
ntry
AL
UA
WA
HiC
iN
&S
PUB
PySc
ore
4C
ambr
idge
UK
90.3
91.5
53.6
56.0
64.1
65.0
70.4
10O
xfor
dU
K59
.057
.948
.452
.066
.045
.756
.822
UC
ollL
ondo
nU
K31
.232
.238
.644
.365
.835
.444
.024
Swis
sFe
dIn
stTe
ch–
Zur
ich
Switz
erla
nd35
.936
.336
.138
.153
.656
.043
.127
Impe
rial
Col
lU
K18
.637
.439
.938
.261
.839
.442
.440
UM
anch
este
rU
K24
.418
.928
.228
.360
.530
.433
.642
UPa
ris
06Fr
ance
36.6
23.6
23.1
27.3
58.2
21.3
33.1
45U
Cop
enha
gen
Den
mar
k27
.424
.226
.325
.454
.533
.433
.047
UU
trec
htN
ethe
rlan
ds27
.420
.928
.228
.853
.326
.032
.449
UPa
ris
11Fr
ance
33.3
46.2
14.6
20.4
47.0
23.1
32.1
51K
arol
insk
aIn
stSt
ockh
olm
Swed
en27
.427
.331
.818
.350
.125
.731
.653
UZ
uric
hSw
itzer
land
11.2
26.8
24.7
27.5
50.2
32.4
31.0
55U
Edi
nbur
ghU
K20
.216
.726
.332
.349
.730
.030
.855
UM
unic
hG
erm
any
33.1
22.9
16.3
25.6
52.7
31.8
30.8
57T
UM
unic
hG
erm
any
41.1
23.6
25.3
18.9
44.8
30.6
30.5
61U
Bri
stol
UK
9.7
17.9
28.2
28.1
47.8
33.5
29.5
64U
Osl
oN
orw
ay23
.133
.417
.917
.046
.729
.829
.067
UH
eide
lber
gG
erm
any
17.7
27.2
17.9
20.4
49.2
29.3
28.4
68U
Hel
sink
iFi
nlan
d16
.817
.921
.920
.853
.830
.128
.370
Mos
cow
Stat
eU
Rus
sia
49.1
34.2
0.0
8.3
53.2
33.4
28.1
Table 2 The best 20 universities in Europe in the Shanghai ranking (2008). Source: ARWU (2003–09).
3.1 Criteria linked to Nobel prizes and Fields medals
Two criteria (ALU and AWA) are linked to a counting of Nobel prizes and of Fields medals. These two criteriaare especially problematic.
Let us first observe that, for criterion AWA, the prize and medals are attributed to the hosting institution atthe time of the announcement. This may not be too much of problem for Fields medals (they are only grantedto people under 40). This is however a major problem for Nobel prizes. Indeed, a close examination of thelist of these prizes reveals that the general rule is that the prize is awarded long after the research leading to ithas been conducted. A classic example of such a situation is Albert Einstein. He conducted his research whilehe was employed by the Swiss Patent Office in Zurich. He received the Nobel Prize long after, while he wasaffiliated to the University of Berlin. Even when the winner of a Nobel prize has not moved, the lag betweenthe time at which the research was conducted and the time at which the award was announced is such that thecriterion captures more the past qualities of an institution than its present research potential. Therefore, it doesnot seem unfair to say that the link between AWA and the quality of research conducted in an institution is, at
7
0
10
20
30
40
50
60
70
80
90
100
1 25 50 75 100 125 150 175 200 225 250 275 300 325 350 375 400 425 450 475 500
rank
score
Fig. 1 Distribution of normalized scores for the 500 universities in the Shanghai ranking (2008). Source: ARWU (2003–09).
best, extremely approximative. The same is clearly true for criterion ALU since the time lag is here even longer.At best, this criterion might give some indication on the ability an institution had several decades ago to giveextremely bright people a stimulating environment. It has little to do with the present ability of an institutionto provide an excellent education to its students.
One may also wonder why prizes attributed long ago are linked with the present quality of an institution.Although the discounting scheme adopted by the authors of the ranking tends to limit the impact of thesevery old prizes and medals, they still have some effect. Moreover, the discounting scheme that is adopted iscompletely arbitrary (e.g., why use a linear and not an exponential scheme?)
The options taken by the authors of the ranking on these two criteria involve many other biases. A bias infavor of countries having known few radical political changes since 1901. A bias towards institutions havingbeen created long ago and having kept the same name throughout their history. This is not the case for mostinstitutions in continental Europe (think of the many wars and radical political changes that have happened inEurope since 1901). This has led to really absurd situations. For instance the two universities (Free university ofBerlin and Humboldt University, using their names in English) created in Berlin after the partition of Germanyand, therefore, the splitting of the University of Berlin, quarrelled over which one should get the Nobel Prizeof Albert Einstein (see Enserink 2007, on this astonishing case). It turned out that depending on the arbitrarychoice of the university getting this prize, these two institutions had markedly different positions in the ranking.Unfortunately, Germany is not an isolated example as revealed by our analysis of the French case in Billautet al. (2009).
Finally, as pointed to us by a referee, these two criteria are based on Prizes and Medals that are far fromcovering all important scientific fields. Distinctions such as the “A. M. Turing Award” 8 in the area of ComputerScience or the “Bruce Gold Medal” 9 in the area of Astronomy, are among the many examples of highlyprestigious awards that are ignored in the Shanghai ranking.
Summarizing, the two criteria ALU and AWA are only very loosely connected with what they are tryingto capture. Their evaluation furthermore involves arbitrary parameters and raises many difficult counting prob-lems. Hence, these criteria are plagued by a significant imprecision and inaccurate determination (Bouyssou1989; Roy 1988). Finally they are based on distinctions that do not cover every important scientific field.
8 Awarded every year since 1966 by the Association for Computing Machinery, see http://awards.acm.org/homepage.cfm?awd=140.
9 Awarded every year since 1898 by the Astronomical Society of the Pacific, see http://www.phys-astro.sonoma.edu/bruceMedalists/.

8
21 categories used by Thomson Scientific
Agricultural Sciences Materials ScienceEngineering Plant & Animal ScienceNeuroscience Computer ScienceBiology & Biochemistry MathematicsGeosciences Psychology / PsychiatryPharmacology Ecology / EnvironmentChemistry MicrobiologyImmunology Social Sciences, GeneralPhysics Economics & BusinessClinical Medicine Molecular Biology & GeneticsSpace Sciences
Table 3 The 21 categories used by Thomson Scientific (source: http://www.isihighlycited.com/isi_copy/Comm_newse04.htm).
3.2 Highly cited researchers
As stressed in van Raan (2005a), the most striking fact here is the complete reliance of the authors of theranking on choices made by Thomson Scientific. Is the division of Science into 21 domains relevant? In viewof Table 3, it is apparent that the choice of these 21 domains seems to favor medicine and biology. This maybe a reasonable option for a commercial firm like Thomson Scientific, since theses fields generate many “hot”papers. The fact that this choice is appropriate in order to evaluate universities would need to be justified and,unfortunately, the authors of the ranking remain silent on this point. Moreover, these 21 categories do nothave the same size. Speaking only in terms of the number of journals involved in each categories (but keep inmind that journals may have quite different sizes) they are indeed quite different. Space Science involves 57journals, Immunology 120, . . . , Plant & Animal Science 887, Engineering 977, Social Science General 1299,and Clinical Medicine 1305 (source: http://www.isihighlycited.com/isi_copy/Comm_newse04.htm).
This criterion clearly uses Thomson Scientific citation counts. Bibliometricians have often stressed thatthese citation counts are somewhat imprecise. Indeed, the matching of cited papers involves “losses” (e.g., dueto incorrect spelling or wrong page numbers). Van Raan (2005a) evaluates the average loss of citations to 7%,while it may be as high as 30% in certain fields. Bizarrely, Liu et al. (2005) answering these comments, simplydid not acknowledge that criterion HiCi uses citation counts.
Finally, let us observe that Thomson Scientific uses a period of 20 years to determine the names of highlycited researchers in each category. Hence, in most categories, the persons in these lists are not particularlyyoung and have often changed institutions several times during their careers.
Summarizing, combining the exclusive reliance on a division of Science into 21 categories suggested byThomson Scientific, the use of a rather long period of reference, and the difficulties inherent to a precisecounting of citations reveals that this criterion is only extremely loosely connected to the present ability of aninstitution to produce research with high impact.
3.3 Papers in Nature and Science
Probably the most surprising fact with this criterion is the weighting scheme for multiple authors (this is theusual rule in the “hard sciences”). With 100% for the corresponding author, 50% for the first author, 25% forthe next author affiliation, and 10% for other author affiliations, one quickly sees that all papers published inNature and Science do not have the same weight. A paper signed by many co-authors will have a greater weightthan a paper signed by a single person (therefore it is in the interest of an institution that any paper published inNature and Science is co-signed by many co-authors from the same institution). We have to say that this seemshighly counter-intuitive and even paradoxical. We should also mention that the problems of affiliation that weexamine below are also present for this criterion.

9
3.4 Articles indexed by Thomson Scientific
As stressed in van Raan (2005a), the authors of the ranking entirely rely for the evaluation of this criterion onthe Thomson Scientific databases. This raises a number of important problems.
First, the attribution of the papers to the right institution is far from being an easy task. The authors of theranking solve it saying that “institutions or research organizations affiliated to a university are treated accordingto their own expression in the author affiliation of an article” (Liu and Cheng 2005, p. 134). This is likely tolead to many problems. For instance, it is well known that authors do not always pay much attention to thestandardization of their affiliation when they publish a paper. The problem is especially serious when it comesto papers published by university hospitals (they often have a specific name that is distinct from the name ofthe university and have a distinct address, see van Raan 2005a, Vincke 2009). A similar phenomenon occurswhen an institution has an official name that is not in English. A famous example is the difficulty to distinguishthe Universite Libre de Bruxelles from the Vrije Universiteit Brussel. Both are located in Brussels and have thesame postal code. Both names are the same in English (Free University of Brussels). Hence this first problemis likely to cause much imprecision on the evaluation of criterion PUB. Attaching to each author a correctaffiliation is a difficult task requiring a deep knowledge of the peculiarities of the institutional arrangements ineach country.
Second, it is well known that the coverage of the Thomson Scientific database is in no way perfect (Adam2002). The newly created SCOPUS database launched by Elsevier, has a vastly different coverage (although,clearly, the intersection between the two databases is not empty). Counting using Thomson Scientific insteadof SCOPUS is a perfectly legitimate choice, provided that the impact of this choice on the results is carefullyanalyzed. This is not the case in the Shanghai ranking.
Third, it is also well known that the coverage of most citation database has a strong slant towards publi-cations in English (see van Leeuwen et al. 2001; van Raan 2005a, for an analysis of the impact of this biason the evaluation of German universities). Yet, there are disciplines (think of Law) in which publications ina language that is not the language of the country make very little sense. Moreover, there are whole parts ofScience that do not use articles in peer-reviewed journals as the main media for the diffusion of research. Inmany parts of Social Science, books are still a central media, whereas in Engineering or Computer Science,conference proceedings dominate. The authors of the ranking have tried to correct for this bias against SocialSciences by multiplying by a factor 2 all papers indexed in the Social Science Citation Index. This surely goesin the right direction. But it is also quite clear that this coefficient is arbitrary and that the impact of varying itshould be carefully analyzed.
Finally, we may also wonder why the authors of the ranking have chosen to count indexed papers instead oftrying to measure the impact of the papers. Browsing through the Thomson Scientific databases quickly revealsthat most of indexed papers are almost never cited and that a few of them concentrate most citations, this beingtrue independently of the impact of the journal. The bibliometric literature has emphasized the importance oftaking the impact of researchinto account in order to produce relevant and meaningful indices (see, e.g., theworks of Moed 2006; Moed et al. 1995; van Raan 1996, 2006).
Summarizing, criterion PUB raises several important problems and involves many arbitrary choices.
3.5 Productivity
Criterion Py consists in the “total score of the above five indicators divided by the number of Full Time Equiv-alent (FTE) academic staff”. It is ignored when this last number could not be obtained. Two main things haveto be stressed here.
First this criterion is clearly affected by all the elements of imprecision and inaccurate determination an-alyzed above for the first five criteria. Moreover, the authors of the ranking do not fully detail which sourcesthey use to collect information on the number of Full Time Equivalent (FTE) academic staff. The authors ofthe ranking rely here on a variety of sources (National Ministry of Education, National Bureau of Statistics,National Association of Universities and Colleges, National Rector’s Conference, see above). Since the notion

10
of “member of academic staff” is not precisely defined and may be interpreted in several quite distinct ways(e.g., how to count invited or emeritus professors?), we have no reason to believe that information collectedthrough these various sources is fully consistent and reliable.
Second, it is not 100% clear what is meant by the authors when they refer to the “total score of the abovefive indicators”. Are these scores first normalized? Are these scores weighted? (we suspect that this is thecase). Using which weights? (we suspect that these weight are simply the weights of the first five indicatorsnormalized to add up to 1).
3.6 A varying number of criteria
Institutions are evaluated in the Shanghai ranking using six criteria. . . but not all of them. In fact we have seenthat there are several possible cases:
– institutions not specialized in Social Sciences and for which FTE academic staff data could be obtained areevaluated on 6 criteria: ALU, AWA, HiCi, N&S, PUB, and Py.
– institutions not specialized in Social Sciences and for which FTE academic staff data could not be obtainedare evaluated on 5 criteria: ALU, AWA, HiCi, N&S, and PUB.
– institutions specialized in Social Sciences and for which FTE academic staff data could be obtained areevaluated on 5 criteria: ALU, AWA, HiCi, PUB, and Py.
– institutions specialized in Social Sciences and for which FTE academic staff data could not be obtained areevaluated on 4 criteria: ALU, AWA, HiCi, and PUB.
This raises many questions. First MCDM has rarely tackled the situation in which alternatives are not evaluatedon the same family of criteria. This raises many interesting questions. For instance the right way to meaning-fully “neutralize” a criterion does not seem to be entirely obvious. Second, the authors of the ranking do notmake publicly available the list of institutions that they consider to be specialized in Social and Human Sci-ences. They neither give the precise list of institutions for which criterion Py could be computed. Hence notonly the family of criteria varies but it is impossible to know which family is used to evaluated what.
3.7 A brief summary on criteria
We have seen that all criteria used by authors of the ranking are only loosely connected with what they intendedto capture. The evaluation furthermore involves several arbitrary parameters and implies taking many micro-decisions that are not documented. In view of Figure 1, we surely expect all these elements to quite severelyimpact the robustness of the results of the ranking. Quite unfortunately, since the authors of the ranking do notmake “raw data” publicly available (a practice which does not seem to be fully in line with their announcedacademic motives), it is impossible to analyze the robustness of the final ranking with respect to these elements.
We have seen above that the authors claim that the ranking: uses “carefully selected objective criteria”, is“based on internationally comparable data that everyone can check”, and is such that “no subjective measureswere taken”.
It seems now clear that the criteria have been chosen mainly based on availability, that each one of themis only loosely connected with what should be captured and that their evaluation involves the use of arbitraryparameters and arbitrary micro-decisions. The impact of these elements on the final result is not examined. Theraw data that are used are not made publicly available so that they cannot be checked.
We would finally like to mention that there is a sizeable literature on the question of structuring objectives,associating criteria or attributes to objective, discussing the adequateness and consistency of a family of criteria.This literature has two main sources. The first one originates in the psychological literature (Ebel and Frisbie1991; Ghiselli 1981; Green et al. 1988; Kerlinger and Lee 1999; Kline 2000; Nunally 1967; Popham 1981) hasconcentrated on the question of the validity and reliability and has permeated the bulk of empirical research inSocial Sciences. The second originates from MCDM (Bouyssou 1990; Fryback and Keeney 1983; Keeney andRaiffa 1976; Keeney 1981, 1988a,b, 1992; Keeney and McDaniel 1999; Keeney et al. 1999; Roy 1996; Roy

11
and Bouyssou 1993; von Winterfeldt and Edwards 1986) has concentrated on the question of the structurationof objectives and the question of the construction of attributes or criteria to measure the attainment of theseobjectives. It seems to have been mostly ignored by the authors of the ranking 10.
4 An MCDM view on the Shanghai ranking
In the previous section, we have proposed a critical analysis of the criteria used by the authors of the ranking,mainly synthesizing the existing literature on the subject. We now turn to questions linked with the method-ology used by the authors to aggregate these criteria. As far as we know these important aspects, that arewell known in the literature on MCDM, have never been tackled so far in the literature related to “universityrankings” (an early publication of some of these arguments was made in Vincke 2009, based on our joint work).
4.1 A rhetorical introduction
Suppose that you are giving a Master course on MCDM. The evaluation of students is based on an assignmentconsisting in proposing and justifying a particular MCDM technique on an applied problem. The subject givento your students this year consists in devising a technique that would allow to “rank order countries accordingto their ‘wealth’”. Consider now the case of three different students.
The first student has proposed a rather complex technique that has the following feature. The fact thatcountry a is rank before or after country b does not only depend on the data collected on countries a and bbut also with what happens with a third country c. Our guess is that you will find that the work of this studentis of very poor quality. Indeed, the relative position of countries a and b should only depend upon their ownperformances. Although such a dependence on “irrelevant alternatives” may be rationalized in certain contexts(see Luce and Raiffa 1957; Sen 1993), we do not think that this is the case here.
Consider a second student that has proposed a simple technique that works as follows. For each countryshe has collected the GNP (Gross national Product) and the GNPpc (Gross national Product per capita) of thiscountry. She then suggests to rank order the countries using a weighted average of the GNP and the GNPpcof each country. Our guess is that you will find that the work of this student is of very poor quality. Eitheryou want to measure the “total wealth” of a country and you should use the GNP or you want to measure the“average richness” of its inhabitants and you should use the GNPpc. Combining theses two measures using aweighted average makes no sense: the first is a “production” measure, the second is a “productivity” measure.Taking α times production plus (1−α) times productivity is something that you can compute but that has
10 Let us mention here several other problems with the criteria used by the authors of the ranking. First they have chosen topublish their ranking on an annual basis. This is probably a good choice if what is thought is media coverage. However, given thepace of most research programs, we cannot find any serious justification for such a periodicity. As observed in Gingras (2008), theability of a university to produce excellent research, is not likely to change much from one year to another. Therefore, changes fromone edition of the ranking to the next one are more likely to reflect random fluctuations than real changes. This is all the more truethat several important points in the methodology and the criteria have changed over the years (Saisana and D’Hombres 2008, offeran overview of these changes). Second, the choice of an adequate period of reference to assess the “academic performance” of aninstitution is a difficult question. It has been implicitly answered by the authors of the ranking in a rather strange way. Lackingany clear analysis of the problem, they mix up in the model several very different time periods: one century for criteria ALU andAWA, 20 years for criterion HiCi, 5 years for criterion N&S, and 1 year for criterion PUB. There may be a rationale behind thesechoices but it is not made explicit by the authors of the ranking. As observed in van Raan (2006), “academic performance” can meantwo very different things: the prestige of an institution based on its past performances and its present capacity to attract excellentresearchers. These two elements should not be confused. Third, five of the six criteria used by the authors of the ranking are countingcriteria (prizes and medals, highly cited researchers, papers in N&S, papers indexed by Thomson Scientific). Hence, it should be nosurprise that all these criteria are strongly linked to the size of the institution. As Zitt and Filliatreau (2006) have forcefully shown,using so many criteria linked to the size of the institution is the sign that big is made beautiful. Hence, the fact that criteria arehighly correlated should not be a surprise. Although the authors of the ranking view this fact as a strong point of their approach,it is more likely to simply reflect the impact of size effects. Fourth, Since the criteria used by the authors of the ranking are linkedwith “academic excellence”, we should expect that they are poorly discriminatory between institutions that are not ranked amongthe top ones. A simple statistical analysis reveals that this is indeed the case, see Billaut et al. (2009)

12
absolutely no meaning, unless, of course, if α is 0 or 1. The reader who is not fully convinced that this doesnot make sense is invited to test the idea using statistics on GNP and GNPpc that are widely available on theweb: the results of such an experiment are quite perplexing.
Consider now a third student who has proposed a complex model but that has:– not questioned the relevance of the task,– not reflected on what “wealth” is and how it should be measured,– not investigated the potential impacts of her work,– only used readily available information on the web without questioning its relevance and precision,– has mixed this information with highly subjective parameters without investigating their influence of the
results.Clearly you will find that the work of this student is of very poor quality. Indeed, she has missed the entiredifficulty of the subject reducing it to a mere number-crunching exercise.
We are sorry to say that the authors of the ranking do not seem to be in a much better position than any ofour three students. We explain below why we think that they have, in their work, combined all what we havefound to be highly questionable in the work of these three students.
4.2 The aggregation technique used is flawed
One of the first thing that is invariably taught in any basic course on MCDM is the following: if you aggregateseveral criteria using a weighted sum, the weights that are used should not be interpreted as reflecting the“importance” of the criteria. This may seem strange but is in fact very intuitive. Weights, or rather scalingconstants as we call them in MCDM, are indeed linked to the normalization of the criteria. If normalizationchanges, weights should change. A simple example should help the reader not familiar with MCDM understandthis point. Suppose that one of your criterion is a measure of length. You may choose to measure this criterionin meters, but you may also choose to measure it in kilometers. If you use the same weights in both cases, youwill clearly end up with absurd results.
This has two main consequences. First, weights in a weighted sum cannot be assessed on the basis of avague notion of “importance”. The comparison of weights used in a weighted sum do not reflect a comparisonin terms of importance of the criteria. Indeed, if the weight of a criterion measured in meters is 0.3 this weightshould be multiplied by 1 000 if you decide to measure it in kilometers. Therefore the comparison of thisweight with the weights of other criteria does not reflect a comparison of importance (it may well happen thatthe weight of criterion length, when this criterion is measured in meters, is smaller than the weight of anothercriterion, while the opposite comparison will prevail when this criterion is measured in kilometers). This hasmany important consequences on the correct way to assess weights in a weighted sum (see Bouyssou et al.2006; Keeney and Raiffa 1976). In any case, it does not make sense to ask someone directly for weights, in aweighted sum, based on a vague notion of “importance” (as the authors of the ranking do on their web site, seehttp://www.arwu.org/rank/2004/Questionnaire.htm.). This also raises the problem on how the authorsof the ranking have chosen their set of weights. They offer no clue on this point. It seems safe to consider thatthe weights have been chosen arbitrarily. The only rationale we can imagine for this choice is that, in the firstversion of the ranking, the authors used only five criteria with equal weights. Although the use of equal weightsmay be justified under certain circumstances (see Einhorn and Hogarth 1975), we have no reason to believethat they apply here.
The second and more devastating consequence is the following. If you change the normalization of thecriteria, you should absolutely change the weights. If you do not do so, this amounts to changing the weights. . .and you will end up with absurd results. Since, each year, the authors of the ranking normalize their criteriagiving the score of 100 to the best scoring institution on each criterion, and, since each year the non-normalizedscore of the best scoring institution on this criterion is likely to change, the weights should change each yearso as to cope with this new normalization. But the authors of the ranking do not change the weights to reflectthis change of normalization 11.
11 Keeney (1992, p. 147) calls this the “most common critical mistake”.

13
alternatives g1 g2 gn1 gn
2 Score Rank
h 2 000 500 100.0 100.0 100.0 1a 160 435 8.0 87.0 47.5 2b 400 370 20.0 74.0 47.0 3c 640 305 32.0 61.0 46.5 4d 880 240 44.0 48.0 46.0 5e 1 120 175 56.0 35.0 45.5 6f 1 360 110 68.0 22.0 45.0 7g 1 600 45 80.0 9.0 44.5 8
Table 4 Weighted sum: example with equal weights
alternatives g1 g2 gn1 gn
2 Score Rank
h 2 000 700 100.00 100.00 100.00 1a 160 435 8.00 62.14 35.07 8b 400 370 20.00 52.86 36.43 7c 640 305 32.00 43.57 37.79 6d 880 240 44.00 34.29 39.14 5e 1 120 175 56.00 25.00 40.50 4f 1 360 110 68.00 15.71 41.86 3g 1 600 45 80.00 6.43 43.21 2
Table 5 Weighted sum with equal weights: h increases on g2
Let us illustrate what can happen with a simple example using two criteria. Let us consider the data inTable 4. In this table, eight alternatives (or institutions) a, b, c, d, e, f , g and h are evaluated on two criteria g1and g2 (the average values that are used in this example roughly correspond to the average values for criteriaPUB and 10 × HiCi). These criteria are normalized so as to give a score of 100 to the best scoring alternativeon each criterion (here, h, as in Harvard, on both criteria). This defines the two normalized criteria gn
1 and gn2.
For instance we have gn2(e) = 35 = (175×100)/500. Let us aggregate these two criteria with a weighted sum
using equal weights. This defines the ‘Score’ column in Table 4 (it is not necessary to normalize again theglobal score, since the score of h is already 100). If we use this global score to rank order the alternatives, weobtain the following ranking (a � b means that a is preferred to b):
h � a � b � c � d � e � f � g.
Consider now a similar situation in which everything remains unchanged except that the performance ofh on g2 increases: it is now 700 instead of 500. This leads to the data in Table 5. The two criteria are againnormalized so as to give a score of 100 to the best scoring alternative on each criterion (here again, h on bothcriteria). But because the score of h on g2 has changed, this impacts all normalized scores on gn
2. If you decideto aggregate the two normalized criteria using the same weights as before, you end up with the followingranking:
h � g � f � e � d � c � b � a.
Observe that the modification of the score of h on g2 has inverted the ranking of all other alternatives. Theintuition behind this “paradox” should be clear. Since the score of h on g2 has changed, we have changedthe normalization of criterion gn
2. Because the normalization has changed, the weight of this criterion shouldchange if we want to be consistent: instead of using weights equal to 0.5 and to 0.5, we should now use differentweights so as to reflect this change of normalization.
Observe that the failure to change weights when normalization changes has very strange effects besides theones just mentioned. If an institution is weak on some criterion, so that a competitor is ranked just before it, itsinterest is that the best scoring alternative on this particular criterion improves its performance: if the weightsare kept unchanged, this will mechanically decrease the importance of this criterion and will eventually allowit to be ranked before its competitor. Therefore if an institution is weak on some criterion, its interest is that

14
g1 g2
a 5 19b 20 4c 11 11d 3 3
Table 6 Weighted sum: unsupported efficient alternatives
the difference between its performance and the performance of the best scoring institution on this criterionincreases!
Clearly, the above numerical examples have been chosen with care. They nevertheless show that it is im-possible to assert that in the Shanghai ranking improving its performances on some criteria will necessarilylead to an improved position in the ranking. This should quite severely undermine the confidence we shouldhave in the results of this ranking. A rather tortuous argument could be put forward in order to try to salvage theresults of the Shanghai ranking saying that the data are such that, whatever the weights, the results are alwaysthe same. In view of Figure 1, it seems clear that such an argument does not apply here.
Let us conclude with a final remark on the aggregation technique that is used. Even if the authors of theranking had not fallen in the “normalization trap” explained above (and, clearly, there are very simple steps thatcould be taken to correct this point, e.g., choosing a normalization of the criteria that does not change everyyear), the weighted sum would remain a poor way to aggregate criteria. Almost all of Bouyssou et al. (2000) isdevoted to examples explaining why this is so. Let us simply recall here the classical problem of the existenceof unsupported efficient alternatives, in the parlance of MCDM. An alternative is said to be dominated ifthere is an alternative that has better evaluations on all criteria and a strictly better one on some criterion. Analternative is efficient if it is not dominated. It seems clear that all efficient alternatives are potentially interestingalternatives. A good aggregation technique should therefore allow any one of them to be ranked first with anadequate choice of parameters. Yet, with a weighted sum, there are efficient alternatives that cannot be rankedfirst, whatever the choice of weights.
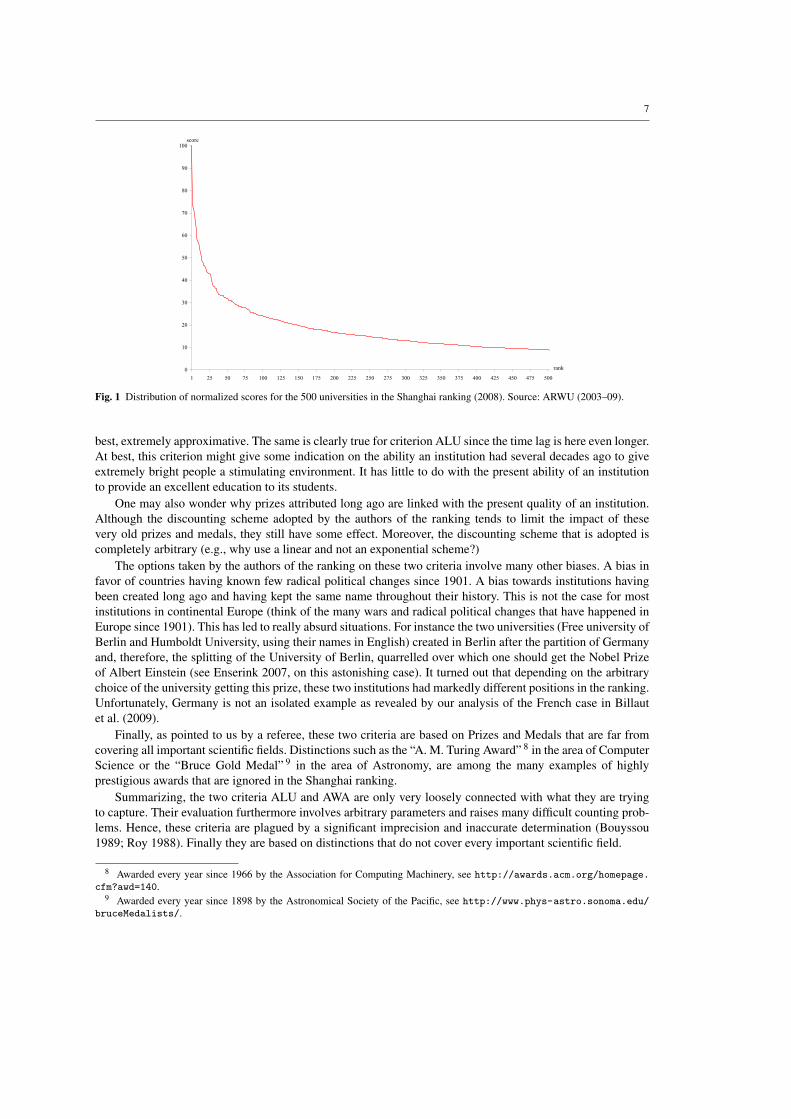
Table 6 gives an example (taken from Bouyssou et al. 2000) of such a situation, using two criteria to bemaximized. Observe that there are three efficient alternatives in this example: a, b, and c (alternative d is clearlydominated by all other alternatives). Intuitively, alternative c appears to be a very good candidate to be rankedfirst: it performs reasonably well on all criteria, while a (resp. b) is excellent on criterion 2 (resp. 1) but seemspoor on criterion 1 (resp. 2). However, if the two criteria are aggregated using a weighted sum, it is impossibleto find weights that would rank c on top. Indeed, suppose that they are weights α and 1−α that would allow todo so. Ranking c before a implies 11α +11(1−α)> 5α +19(1−α), i.e., α > 8/15 ≈ 0.53. Ranking c beforeb implies 11α + 11(1−α) > 20α + 4(1−α), i.e., α < 7/16 ≈ 0.44. Figure 2 shows that this impossibilityis due to the fact that c is dominated by a convex combination of a and b. Recent research in MCDM haveexhibited a wealth of aggregation techniques that do not have such a major deficiency (Belton and Stewart2001; Bouyssou et al. 2000).
4.3 The aggregation technique that is used is nonsensical
Criteria ALU, AWA, HiCi, N&S, and PUB are counting criteria. It is therefore clear that they are globallylinked to the ability of an institution to produce a large amount of good papers and good researchers. Theycapture, up to the remarks made in Section 3, the “research potential” of an institution. This is semanticallyconsistent. However, criterion Py is quite different. If the first five criteria capture “production” the last onecaptures “productivity”. But common sense and elementary economic analysis strongly suggest that taking aweighted average of production and productivity, although admissible from a purely arithmetic point of view,leads to a composite index that is meaningless (we use the word here in its ordinary sense and not in itsmeasurement-theoretic sense, see Roberts 1979). The only argument that we can think of in favor of such ameasure is that the weight of the last criterion is rather small (although, we have seen above that weights in a

15
g1
g2
a
b
c
d
Figure 2: Unsupported efficient alternatives
ertheless, the very fact that production is mixed up with productivity seems to us highlyproblematic and indicates a poor reflection on the very meaning of what an adequatecomposite index should be. The projects of the authors of the ranking, as announced inLiu et al. (2005, p. 108), to build a ranking with a weight of 50% for the criterion Py, area clear sign that this semantic problem has not been fully understood by the authors ofthe ranking. This should severely undermines the confidence we can have in the resultsof the ranking.
4.4 Neglected structuring issuesWhen trying to build an evaluation model, good practice suggests (Bouyssou et al.,2000, JRC/OECD, 2008) that the reflection should start with a number of simple butcrucial questions:
1. What is the definition of the objects to be evaluated?
2. What is the purpose of the model? Who will use it?
3. How to structure objectives?
4. How to achieve a “consistent family of criteria”?
5. How to take uncertainty, imprecision, and inaccurate definition into account?
Concerning the last three questions, we have seen in Section 3 that the work of theauthors of the Shanghai ranking could be subjected to severe criticisms. This is espe-cially true for the last question: since raw data are not made publicly available and the
26
Fig. 2 Unsupported efficient alternatives
weighted sum should be interpreted with great care). Nevertheless, the very fact that production is mixed upwith productivity seems to us highly problematic and indicates a poor reflection on the very meaning of whatan adequate composite index should be. The projects of the authors of the ranking, as announced in Liu et al.(2005, p. 108), to build a ranking with a weight of 50% for the criterion Py, are a clear sign that this semanticproblem has not been fully acknowledged by the authors of the ranking. This should severely undermines theconfidence we can have in the results of the ranking.
4.4 Neglected structuring issues
When trying to build an evaluation model, good practice suggests (Bouyssou et al. 2000; JRC/OECD 2008)that the reflection should start with a number of simple but crucial questions:
1. What is the definition of the objects to be evaluated?2. What is the purpose of the model? Who will use it?3. How to structure objectives?4. How to achieve a “consistent family of criteria”?5. How to take uncertainty, imprecision, and inaccurate definition into account?
Concerning the last three questions, we have seen in Section 3 that the work of the authors of the rankingcould be subjected to severe criticisms. This is especially true for the last question: since raw data are notmade publicly available and the many micro-decisions that led to these data are not documented, it is virtuallyimpossible to analyze the robustness of the proposed ranking. The partial analyses conducted in Saisana andD’Hombres (2008) show that this robustness is likely to extremely weak.
Let us concentrate here on the first two questions keeping in mind a number of good practices for theconstruction of an evaluation model.
4.4.1 What is a “university”?
This question might sound silly to most our readers coming from the US and the UK. However for a readercoming from continental Europe this question is not always an easy one. Let us take here the example of France,which is, admittedly, a particularly complex example. In France co-exit:
– Public universities (usually named Universites). What should be observed here is that the history of mostof these universities has been long and somewhat erratic. After 1968, most of them were split into severalsmaller ones. Moreover, there are many newly created universities in France that are rather small and do notoffer programs in all areas of Science and/or at all levels of the Bachelor-Master-Doctorate scale. Finally,

16
when analyzing the French system, it should be kept in mind that these universities rarely attract the beststudents. They rather choose to enter the Grandes Ecoles system. Tuition fees in these universities aregenerally small.
– Grandes Ecoles (mainly in Engineering, Management and Political Science) are very particular institu-tions. They are usually quite small and most of them only grant Master degrees. They are highly selectiveinstitutions that are recruiting students after a nationwide competitive exam. They have a long tradition anda very active network of alumni. Only very few of them are actively involved in Doctoral programs. Tuitionfees in Grandes Ecoles vary a lot. Some of them are quite expensive (mostly management schools) whilein some others, the fees are comparable to that of a public university. Finally, in some of them, (e.g., theEcoles Normales Superieures), students are paid.
– Large public and private research institutes that may have common research centers, among them or withuniversities or Grandes Ecoles. Among the public research centers we should mention: CNRS, INSERM(specialized in biomedical research), INRA (specialized in agricultural sciences) and INRIA (specializedin Computer Science). A very significant part of research in France is conducted in such institutes, althoughthey have no student and grant no diploma. Moreover, there are large and renowned private research centers,the most famous one being the Institut Pasteur (many of the French Nobel prizes in Medicine are linked toit).
With such a complex institutional landscape, what should count as a university is far from being obvious. Itseems that this was not obvious to the authors of the ranking, since they included in the first three editions(2003–2005) of the ranking the College de France, an institution that has no student and grants no diploma: ifsuch an institution can count as a university then almost all organizations can. The French situation is especiallycomplex but is far from being exceptional. Germany and Italy have strong Public Research centers, besides theiruniversities, too.
Any evaluation system should minimally start with a clear definition of the objects to be evaluated. Such adefinition is altogether lacking in the Shanghai ranking.
4.4.2 What is a “good” university?
The authors of the ranking are interested in “world-class” universities. But, as they have not proposed a defini-tion of what a university is, they do not offer a definition of what a “world class” university is. Nevertheless thecriteria they use allow to implicitly define what they mean here. The only thing of importance is “excellence”in research. Moreover this excellence is captured using very particular criteria evaluated in a very particularway (see Section 3). Why ignore research outputs such as patents, books or PhD theses? Why count papersinstead of trying to measure impact?, etc.
Perhaps the most perplexing thing in the implicit definition of a world class university used by the authorsof the ranking is that it mostly ignores inputs and institutional constraints.
Some universities have a more-or-less complete freedom to organize their governance, to hire and fireacademic and non-academic staff, to decide on salaries, to select students, to decide on tuition fees. Someothers have almost no freedom in all these respects (this is mostly the case for French universities). Theycannot select students, they cannot decide on tuition fees, they are not fully involved in the selection of theiracademic staff, and firing someone is difficult. Given such differences in institutional constraints, should wesimply ignore them, as is implicitly done in the ranking? This is only reasonable if one admits that there is “onebest model” of a world-class university. This hypothesis would need detailed empirical justification that is notoffered by the authors of the ranking.
Similarly the “inputs” consumed by institutions in their “scientific production process” are mostly ignored.The only input that is explicitly taken into account is the number of FTE academic staff, when it could be ob-tained. But there are many other important inputs that should be included, if one is to judge on the efficiency ofa scientific production process. Let us simply mention here that tuition fees, funding (Harvard’s annual budgetis over 3×10⁹ USD in 2007, Harvard University 2007, p. 38; this is larger than the GDP of Laos), quality ofcampus, libraries (Harvard’s libraries possess over 15×106 volumes, Harvard University 2007), academic free-

17
dom to research and publish on any subject of interest, etc. are also very important ingredients in the successof a university. Ignoring all these inputs implies a shallow and narrow view on academic excellence 12.
4.4.3 What is the purpose of the model? Who can profitably use it?
To us, the very interest of ranking “universities” is not obvious at all. Indeed, who can benefit from such aranking?
Students and families looking for information are much more likely to be interested in a model that willevaluate programs. We are all aware of the fact that a good university may be especially strong in some areasand quite weak in others. Moreover, it seems clear that (although we realize that each family might want toconsider its child as a future potential Nobel Prize winner) students and families are likely to be interested inrather trivial things such as tuition fees, quality of housing, sports facilities, quality of teaching, reputation ofthe program in firms, average salaries after graduation, strength of the alumni network, campus life, etc. Foran interesting system offering such details, we refer to Berghoff and Federkeil (2009) and Centre for HigherEducation Development (2008).
Recruiters are likely to be little impressed by a few Nobel prizes granted long ago to members of a givendepartment, if they consider recruiting someone with a Master degree coming from a totally different depart-ment. Clearly, they will be mostly interested in the “employability” of students with a given degree. Besides thecriteria mentioned above for students and families, things like the mastering of foreign languages, internationalexperience, internships, etc. are likely be of central importance to them.
Likewise, a global ranking of universities is quite unlikely to be of much use to deans and rectors willingto work towards an increase in quality. Clearly, managers of a university will be primarily interested in theidentification of weak and strong departments, the identification of the main competitors, and the indication ofpossible directions for improvement. Unless they have a contract explicitly specifying that they have to increasethe position of their institution in the Shanghai ranking (as astonishing as it may sound, this has happened), wedo not see how a ranking of an institution as a whole can lead to a useful management tool.
Finally, political decision makers should be primarily interested in an evaluation system that would helpthem decide on the efficiency of the higher education system of a country. If a country has many good medium-sized institutions, it is unlikely that many of them will be standing high in the Shanghai ranking. But this doesnot mean that the system as a whole is inefficient. Asking for “large” and “visible” institutions in each countrymay involve quite an inefficient use of resources. Unless the authors of the ranking can produce clear empiricalevidence that scientific potential is linked with size and that medium-sized institutions simply cannot producevaluable research, we do not understand why all this may interest political decision makers, except, of course,to support other strategic objectives.
4.4.4 Good evaluation practices
As detailed in Bouyssou et al. (2000) and Bouyssou et al. (2006), there are a number of good practices thatshould be followed when building an evaluation model. We want only to mention two of them here.
The first one is fairly obvious. If you evaluate a person or an organization, you should allow that person ororganization to check the data that are collected on her/it. This seems quite obvious. Not doing so, inevitablyleads to a bureaucratic nightmare in which each one is evaluated based on data that remain “behind the curtain”.We have seen that this elementary good practice has been forgotten by the authors of the ranking: since rawdata are not made publicly available, it is impossible for the institutions that are evaluated to check them.
The second good practice we would like to mention is less clear-cut, but is nevertheless crucial. Whenan evaluation system is conceived, its creators should not expect the persons or the organizations that areevaluated to react passively to the system. This is the baseline of any introductory management course. Personsand organizations will adapt their behavior, consciously or not, in reaction to the evaluation system. This
12 Let us remark that we disagree here with Principle 8 in International Ranking Expert Group (2006): a production process,whether it is or not scientific, cannot be analyzed without explicitly considering outputs and inputs.

18
feedback is inevitable and perverse effects due to such adaptations are inescapable (all this has been welldocumented in the management literature, Berry 1983; Boudon 1979; Dorner 1996; Hatchuel and Molet 1986;Mintzberg 1979; Moisdon 2005; Morel 2002). A good practice is therefore the following. Try to anticipate themost obvious perverse effects that can be generated by your evaluation system. Try to conceive a system inwhich the impacts of the most undesirable perverse effects are reduced. It does not seem that the authors of theranking have followed this quite wise advice. The only words of wisdom are here that “Any ranking exerciseis controversial, and no ranking is absolutely objective” and that “People should be cautious about any rankingand should not rely on any ranking either, including the ‘Academic Ranking of World Universities’. Instead,people should use rankings simply as one kind of reference and read the ranking methodology carefully beforelooking at the ranking lists” (ARWU 2003–09). Sure enough. But beyond that, we surely expect the developersof an evaluation system to clearly analyze the potential limitations of what they have created in order to limit,as far as possible, its illegitimate uses and the authors of the ranking remain silent on this point.
Suppose that you manage a university and that you want to increase your position in the ranking. This issimple enough. There are vast areas in your university that do not contribute to your position in the ranking. Wecan think here of Law, Humanities and most Social Sciences. Drop all these fields. You will surely save muchmoney. Use this money to buy up research groups that will contribute to your position in the ranking. Severalindices provided by Thomson Scientific are quite useful for this purpose: after all, the list of the potential nextfive Nobel prizes in Medicine is not that long. And, anyway, if the group is not awarded the prize, it will publishmuch in journals that count in the ranking and its members are quite likely to be listed among the highly citedresearchers in the field. This tends to promote a view of Science that much resembles professional sports inwhich a few wealthy teams compete worldwide to attract the best players. We are not fully convinced that thisis the best way to increase human knowledge, to say the least.
Manipulations are almost as simple and as potentially damaging for governments. Let us take for examplethe case of the French government, since we have briefly evoked above the complex organization of the Frenchhigher education system. Most French universities were split in several smaller parts in the early seventies.The idea was then to create organizations that would be easier to manage. Indeed, the venerable Universitede Paris gave rise to no less than 13 new universities. But we have seen that this is surely detrimental in theranking. So you should give these universities strong incentives to merge again. Neglecting the impact of thelast criterion, a simple calculation shows that merging the universities in Paris that are mainly oriented towards“hard sciences” and Medicine (there is clearly no interest to merge with people doing such futile things asLaw, Social Sciences and Humanities), i.e., Paris 5, 6, 7 and 11 (these are not the official names but their mostcommon names), would lead (using the data from the 2007 Shanghai ranking) to an institution that wouldroughly be at the level of Harvard University. Bingo! You are not spending one more Euro, you have surelynot increased the scientific production and potential of your country, you have created a huge organizationthat will surely be rather difficult to manage. . . but you have impressively increased the position of France inthe Shanghai ranking. Can you do even more? Sure, you can. Public research centers, although quite efficient,count for nothing in the ranking. You can surely suppress them and transfer all the money and persons to thehuge organization you have just created. Then, you will surely end up much higher than Harvard University. . .No need to say that all these manipulations may lead, in the long term, to disastrous results.
5 Where do we go from here?
Let us now summarize our observations on the Shanghai ranking and try to draw some conclusions based onour findings, both on a scientific and a more strategic level.
5.1 An assessment of the Shanghai ranking
In what was probably the first serious analysis of the Shanghai ranking, van Raan (2005a, p. 140) stated that“From the above considerations we conclude that the Shanghai ranking should not be used for evaluation

19
purposes, even not for benchmarking” and that “The most serious problem of these rankings is that they areconsidered as ‘quasi-evaluations’ of the universities considered. This is absolutely unacceptable”. We surelyagree. The rather radical conclusions of van Raan were mainly based on bibliometric considerations, to whichthe authors of the ranking proved unable to convincingly answer (Liu et al. 2005; van Raan 2005b).
Our own analysis adopted a point of view that reflects our slant towards MCDM. Adding an MCDM pointof view to the bibliometric analysis of van Raan (2005a) inevitably leads to an even more radical conclusion.Indeed, we have seen all criteria used by authors of the ranking are only loosely connected with what theyintended to capture. The evaluation of these criteria involves several arbitrary parameters and many micro-decisions that are not documented. Moreover, we have seen that the aggregation method that is used is flawedand nonsensical. Finally, the authors of the ranking have paid almost no attention to fundamental structuringissues. Therefore, it does not seem unfair to say that the Shanghai ranking is a poorly conceived quick anddirty exercise. Again any of our MCDM student that would have proposed such a methodology in her Master’sThesis would have surely failed according to our own standards.
5.2 What can be done?
An optimistic point of view would be that, after having read our paper, the authors of the ranking would decideto immediately stop their work, apologizing for having created so much confusion in the academic world, andthat all political decision makers would immediately stop using “well known international rankings” as meansto promote their own strategic objectives. However, we live in the real world and our bet is that this will nothappen. Since the authors of Shanghai ranking more or less decided to ignore the point of view of van Raan(2005a) (as well as the ones expressed in further critical papers mentioned in Section 1), it is much likely thatthey will ignore ours. Therefore, we expect that they will continue for a long time to produce an annual ranking.Also, we should not expect too much of the willingness of political decision makers to abandon easy-to-usearguments that look striking enough in the general media. Therefore, we will have to live in a world in whichextremely poor rankings are regularly published and used. What can be done then? Well, several things.
The first, and the more easy one, should be to stop being naive. “What is the best car in the world?”,“Where is the most pleasant city in Europe?”, “What is the best wine in the world?”, etc. All these questionsmay be interesting if your objective is to sell many copies of a newspaper or a book. However, it is clear thatall these questions are meaningless unless they are preceded by a long and difficult structuring work. Clearlythe “best car in the world” is a meaningless concept unless you have identified stakeholders, structured theirobjectives, studied the various ways in which attributes can be conceived to measure the attainment of theseobjectives, applied meaningful procedures to aggregate this information and performed an extensive robustnessanalysis. Doing so, you might arrive at a model that can really help someone choose a car, or, alternatively,help a government to prepare new standards for greenhouse gas emissions. Without this work, the question ismeaningless. If the question is meaningless for cars, should we expect a miracle when we turn to incrediblymore complex objects such as universities? Certainly not. There is no such thing as a “best university” inabstracto. Hence, a first immediate step that we suggest is the following. Stop talking about these “all purposerankings”. They are meaningless. Lobby in our own institution so that these rankings are never mentioned ininstitutional communication. This is, of course, especially important for our readers “lucky” enough to belongto institutions that are well ranked. They should resist the temptation of saying or thinking “there is almostsurely something there” and stop using the free publicity offered by these rankings.
Since the production of poor rankings is unlikely to stop, a more proactive way to fight them is to producemany alternative rankings that produce vastly different results. It is not of vital importance that these newrankings are much “better” in some sense that the Shanghai ranking. Their main usefulness will be to “dilute”its devastating effects. A very interesting step in the direction was taken in ENSMP (2007). The Ecole NationaleSuperieure des Mines de Paris (ENSMP) is a French Grande Ecole, being very prestigious in France. Its size issuch that it is clear that it will never appear in good position in the Shanghai ranking. Hence, the ENSMP hasdecided to produce an alternative ranking. It can be very simply explained since it is based on a single criterion:the number of alumni of an institution having become the CEO of one of the top 500 leading companies as

20
identified by the Fortune magazine (we refer to ENSMP 2007, for details on how this number is computed).We do not regard this ranking as very attractive. Indeed, the performances of the various institutions are basedon things that happened long ago (it is quite unusual to see someone young becoming the CEO of a very largecompany). Therefore this number has little relation with the present performance of the institution. Moreover,this criterion is vitally dependent upon the industrial structures of the various countries in the world (institutionscoming from countries in which industry is highly concentrated have a clear advantage) and “network effects”will have a major impact on it (we know that these effects are of utmost importance to understand the FrenchGrandes Ecoles system). Yet, we do not consider that the ENSMP ranking is much worse than the Shanghairanking. On the contrary, it quite clearly points out the arbitrariness of many of the criteria used by the authorsof the ranking. Finally and quite interestingly, the ENSMP ranking gives results that are vastly different fromthe Shanghai ranking. The top 10 institutions in this ranking have no less than 5 French institutions (and, amongthese 5, 3 are not even present in the top 500 of the Shanghai ranking). Diluting the effects of the Shanghairanking clearly calls for many more rankings of this kind.
5.3 Why don’t you propose your own ranking?
We have been rather critical on the Shanghai ranking. The reader may legitimately wonder why we do not nowsuggest another, better, ranking. We will refrain here from doing so for various reasons.
First, this is not our main field of research. We are not experts in education systems. We are not experts inbibliometry. Contrary to the authors of the ranking, we do think that a decent ranking should obviously be theproduct of a joint research team involving experts in evaluation, education systems and bibliometry.
Second, we do not underestimate the work involved. Although we think that the Shanghai ranking is ofpoor quality, we realize that producing it is a huge task. A better ranking will inevitably involve even morework, based on the reasonable assumption that there is no free lunch.
Third, we are not at all convinced that this exercise is really useful. We have explained above why wewould tend to rank programs or national education systems instead of universities. We have also given severalclues on what should be done and what should absolutely not be done. We hope that these guidelines will behelpful for readers willing to take up to this task.
It seems likely that the combination of Operational Research (OR) with sophisticated bibliometric tech-niques will offer good promises for meaningful evaluation systems. Because the issue of bibliometric tech-niques has been extensively dealt with elsewhere (Moed 2006; Moed et al. 1995; van Raan 2005c, 2006; Zittet al. 2005), let us mention here a few potentially useful OR techniques.
We have already mentioned how the absence of a minimal knowledge of aggregation techniques and theirproperties, as studied in MCDM, may vitiate an evaluation technique. We would like here to add that OR hasalso developed quite sophisticated tools to help structuring problems (Checkland 1981; Checkland and Scholes1990; Eden 1988; Eden et al. 1983; Friend and Hickling 1987; Ostanello 1990; Rosenhead 1989) and to usethis work together with sophisticated aggregation tools (Ackermann and Belton 2006; Bana e Costa et al. 1999;Belton et al. 1997; Montibeller et al. 2008; Phillips and Bana e Costa 2007). A parallel development concernsmethods designed to assess the efficiency of “decision making units” that transform several inputs into severaloutputs, known as Data Envelopment Analysis (DEA) (Banker et al. 1984; Charnes et al. 1978; Cherchye et al.2008; Cook and Zhu 2008; Cooper et al. 1999; Norman and Stoker 1991). The potential of such techniquesfor building evaluation models in the area of higher education has been already recognized (Bougnol andDula 2006; Johnes 2006; Leitner et al. 2007; Turner 2005, 2008). We suspect that a wise combination of theabove two approaches is quite likely to lead to interesting evaluation models. It could well be combined withthe promising interactive approach developed by the Center for Higher Education in Germany (Berghoff andFederkeil 2009; Centre for Higher Education Development 2008) in which users have the freedom to select thecriteria they are willing to consider 13.
13 During the preparation of this text, a European research consortium (CHERPA) won a call for tenders launched by the EuropeanUnion on the question of university rankings. We wish much success to this international consortium and we, of course, hope thatthey will find parts of this text useful to them.

21
Acknowledgements We wish to thank Florence Audier, Ghislaine Filliatreau, Thierry Marchant, Michel Zitt, and an anonymousreferee for their useful comments on an earlier draft of this text.
References
F. Ackermann and V. Belton. Problem structuring without workshops? Experiments with distributed interaction in a PSM. Journalof the Operational Research Society, 58:547–556, 2006.
D. Adam. Citation analysis: The counting house. Nature, 415(6873):726–729, 2002.ARWU. Academic ranking of world universities, 2003–09. Shanghai Jiao Tong University, Institute of Higher Education, http:
//www.arwu.org.C. A. Bana e Costa, L. Ensslin, E. C. Correa, and J.-C. Vansnick. Decision Support Systems in action: Integrated application in a
multicriteria decision aid process. European Journal of Operational Research, 113:315–335, 1999.R. D. Banker, A. Charnes, and W. W. Cooper. Some models for estimating technical and scale inefficiencies in data envelopment
analysis. Management Science, 30(9):1078–1092, 1984.V. Belton and T. J. Stewart. Multiple criteria decision analysis: An integrated approach. Kluwer, Dordrecht, 2001.V. Belton, F. Ackermann, and I. Shepherd. Integrated support from problem structuring through alternative evaluation using COPE
and V•I•S•A. Journal of Multi-Criteria Decision Analysis, 6:115–130, 1997.S. Berghoff and G. Federkeil. The CHE approach. In D. Jacobs and C. Vermandele, editors, Ranking universities, pages 41–63,
Brussels, 2009. Edition de l’Universite de Bruxelles.M. Berry. Une technologie invisible ? Le role des instruments de gestion dans l’evolution des systemes humains. Memoire, Centre
de Recherche en Gestion. Ecole Polytechnique, 1983.J.-C. Billaut, D. Bouyssou, and Ph. Vincke. Should you believe in the Shanghai ranking? An MCDM view. Cahier du LAMSADE
# 283, LAMSADE, 2009. Available from http://hal.archives-ouvertes.fr/hal-00388319/en/.R. Boudon. Effets pervers et ordre social. PUF, Paris, 1979.M.-L. Bougnol and J. H. Dula. Validating DEA as a ranking tool: An application of DEA to assess performance in higher education.
Annals of Operations Research, 145:339–365, 2006.J. Bourdin. Le defi des classements dans l’enseignement superieur. Rapport au Senat 442, Republique francaise, 2008.D. Bouyssou. Modelling inaccurate determination, uncertainty, imprecision using multiple criteria. In A.G. Lockett and G. Islei,
editors, Improving Decision Making in Organisations, LNEMS 335, pages 78–87. Springer-Verlag, Berlin, 1989.D. Bouyssou. Building criteria: A prerequisite for MCDA. In C. A. Bana e Costa, editor, Readings in multiple criteria decision aid,
pages 58–80. Springer-Verlag, Heidelberg, 1990.D. Bouyssou, Th. Marchant, M. Pirlot, P. Perny, A. Tsoukias, and Ph. Vincke. Evaluation and decision models: A critical perspec-
tive. Kluwer, Dordrecht, 2000.D. Bouyssou, Th. Marchant, M. Pirlot, A. Tsoukias, and Ph. Vincke. Evaluation and decision models: Stepping stones for the
analyst. Springer, New York, 2006.R. L. Brooks. Measuring university quality. The Review of Higher Education, 29(1):1–21, 2005.G. Buela-Casal, O. Gutierez-Martınez, M. P. Bermudez-Sanchez, and O. Vadillo-Munoz. Comparative study of international aca-
demic rankings of universities. Scientometrics, 71(3):349–365, 2007.Centre for Higher Education Development. CHE ranking. Technical report, CHE, 2008. http://www.che.de.A. Charnes, W. W. Cooper, and E. Rhodes. Measuring the efficiency of decision making units. European Journal of Operational
Research, 2:429–444, 1978. Correction: European Journal of Operational Research, 3:339.P. Checkland. Systems thinking, systems practice. Wiley, New York, 1981.P. Checkland and J. Scholes. Soft systems methodology in action. Wiley, New York, 1990.L. Cherchye, W. Moesen, N. Rogge, T. van Puyenbroeck, M. Saisana, A. Saltelli, R. Liska, and S. Tarantola. Creating composite
indicators with DEA and robustness analysis: the case of the technology achievement index. Journal of Operational ResearchSociety, 59:239–251, 2008.
W. A. Cook and J. Zhu. Data Envelopment Analysis: Modeling Operational Processes and Measuring Productivity. CreateSpace,2008.
W. W. Cooper, L. M. Seiford, and K. Tone. Data Envelopment Analysis. A comprehensive text with models, applications, referencesand DEA-solver software. Kluwer, Boston, 1999.
N. Dalsheimer and D. Despreaux. Analyses des classements internationaux des etablissements d’enseignement superieur. Education& formations, 78:151–173, 2008.
D. Desbois. Classement de Shanghai : peut-on mesurer l’excellence academique au niveau mondial ? La revue trimestrielle dureseau Ecrin, 67:20–26, 2007.
D. Dill and M. Soo. Academic quality, league tables, and public policy: A cross-national analysis of university ranking systems.Higher Education, 49:495–533, 2005.
D. Dorner. The logic of failure. Perseus Books, Jackson, 1996.R. L. Ebel and D. A. Frisbie. Essentials of educational measurement. Prentice-Hall, New York, 1991.C. Eden. Cognitive mapping. European Journal of Operational Research, 36:1–13, 1988.C. Eden, S. Jones, and D. Sims. Messing about in problems. Pergamon Press, Oxford, 1983.H. J. Einhorn and R. Hogarth. Unit weighting schemes for decision making. Organizational Behavior and Human Performance,
13:171–192, 1975.

22
M. Enserink. Who ranks the university rankers? Science, 317(5841):1026–1028, 2007.ENSMP. Professional ranking of world universities. Technical report, Ecole Nationale Superieure des Mines de Paris (ENMSP),
2007.R. Florian. Irreproducibility of the results of the Shanghai academic ranking of world universities. Scientometrics, 72:25–32, 2007.J. K. Friend and A. Hickling. Planning under pressure: The strategic choice approach. Pergamon Press, New York, 1987.D. G. Fryback and R. L. Keeney. Constructing a complex judgmental model: An index of trauma severity. Management Science,
29:869–883., 1983.E. E. Ghiselli. Measurement theory for the behavioral sciences. W. H. Freeman, San Francisco, 1981.Y. Gingras. Du mauvais usage de faux indicateurs. Revue d’Histoire Moderne et Contemporaine, 5(55-4bis):67–79, 2008.P. E. Green, D. S. Tull, and G. Albaum. Research for marketing decisions. Englewood Cliffs, 1988.Harvard University. Harvard university fact book, 2006–2007. Technical report, Harvard University, 2007.A. Hatchuel and H. Molet. Rational modelling in understanding and aiding human decision making: About two case studies.
European Journal of Operational Research, 24:178–186, 1986.CHERI / HEFCE. Counting what is measured or measuring what counts? league tables and their impact on higher education
institutions in England. Report to HEFCE by the Centre for Higher Education Research and Information (CHERI) 2008/14,Open University, and Hobsons Research, 2008.
International Ranking Expert Group. Berlin principles on ranking of higher education institutions. Technical report, CEPES-UNNESCO, 2006.
J. P. A. Ioannidis, N. A. Patsopoulos, F. K. Kavvoura, A. Tatsioni, E. Evangelou, I. Kouri, D. G. Contapoulos Ioannidis, andG. Liberopoulos. International ranking systems for universities and institutions: a critical appraisal. BioMed Central, 5(30),2007.
J. Johnes. Measuring efficiency: A comparison of multilevel modelling and data envelopment analysis in the context of highereducation. Bulletin of Economic Research, 58(2):75–104, 2006.
JRC/OECD. Handbook on constructing composite indicators. methodology and user guide. Technical report, JRC/OECD, OECDPublishing, 2008. ISBN 978-92-64-04345-9.
T. Kavelmark. University ranking systems: A critique. Technical report, Irish Universities Quality Board, 2007.R. L. Keeney. Measurement scales for quantifying attributes. Behavioral Science, 26:29–36, 1981.R. L. Keeney. Structuring objectives for problems of public interest. Operations Research, 36:396–405, 1988a.R. L. Keeney. Building models of values. European Journal of Operational Research, 37(2):149–157, 1988b.R. L. Keeney. Value-focused thinking. A path to creative decision making. Harvard University Press, Cambridge, 1992.R. L. Keeney and T. L. McDaniel. Identifying and structuring values to guide integrated ressource planning at BC gas. Operations
Research, 47(5):651–662, September-October 1999.R. L. Keeney and H. Raiffa. Decisions with multiple objectives: Preferences and value tradeoffs. Wiley, New York, 1976.R. L. Keeney, J. S. Hammond, and H. Raiffa. Smart choices: A guide to making better decisions. Harvard University Press, Boston,
1999.F. N. Kerlinger and H. B. Lee. Foundations of behavioral research. Wadsworth Publishing, New York, 4 edition, 1999.O. Kivinen and J. Hedman. World-wide university rankings: A scandinavian approach. Scientometrics, 74(3):391–408, 2008.P. Kline. Handbook of psychological testing. Routledge, New York, 2 edition, 2000.T. N. van Leeuwen, H. F. Moed, R. J. W. Tijssen, M. S. Visser, and A. F. J. van Rann. Language biases in the coverage of the
Science Citation Index and its consequences for international comparisons of national research performance. Scientometrics,51(1):335–346, 2001.
K.-H. Leitner, J. Prikoszovits, M. Schaffhauser-Linzatti, R. Stowasser, and K. Wagner. The impact of size and specialisation onuniversities’ department performance: A DEA analysis applied to Austrian universities. Higher Education, 53(4):517–538,2007.
N. C. Liu. The story of academic ranking of world universities. International Higher Education, 54:2–3, 2009.N. C. Liu and Y. Cheng. The academic ranking of world universities. Higher Education in Europe, 30(2):127–136, 2005.N. C. Liu, Y. Cheng, and L. Liu. Academic ranking of world universities using scientometrics: A comment to the “fatal attraction”.
Scientometrics, 64(1):101–109, 2005.R. D. Luce and H. Raiffa. Games and Decisions. Wiley, New York, 1957.S. Marginson. Global university rankings: where to from here? Technical report, Asia-Pacific Association for International Educa-
tion, 2007.H. Mintzberg. The structuring of organizations. Prentice Hall, Englewood Cliffs, 1979.H. F. Moed, R. E. De Bruin, and T. N. van Leeuwen. New bibliometric tools for the assessment of national research performance:
Database description, overview of indicators and first applications. Scientometrics, 33:381–422, 1995.H. M. Moed. Bibliometric rankings of world universities. Technical Report 2006-01, CWTS, Leiden University, 2006.J.-C. Moisdon. Vers des modelisations apprenantes ? Economies et Societes. Sciences de Gestion, 7-8:569–582, 2005.G. Montibeller, F. Ackermann, V. Belton, and L. Ensslin. Reasoning maps for decision aiding: An integrated approach for problem
structuring and multi-criteria evaluation. Journal of the Operational Research Society, 59:575–589, 2008.C. Morel. Les Decisions Absurdes. Bibliotheque des Sciences Humaines. Gallimard, Paris, 2002.M. Norman and B. Stoker. Data Envelopment Analysis: The Assessment of performance. Wiley, London, 1991.J. C. Nunally. Psychmometric Theory. McGraw-Hill, New York, 1967.A. Ostanello. Action evaluation and action structuring: Different decision aid situations reviewed through two actual cases. In C. A.
Bana e Costa, editor, Readings in multiple criteria decision aid, pages 36–57. Springer-Verlag, Berlin, 1990.

23
L. D. Phillips and C. A. Bana e Costa. Transparent prioritisation, budgeting and resource allocation with multi-criteria decisionanalysis and decision conferencing. Annals of Operations Research, 154:51–68, 2007.
W. J. Popham. Modern educational measurement. Prentice-Hall, New York, 1981.A. F. J. van Raan. Advanced bibliometric methods as quantitative core of peer review based evaluation and foresight exercises.
Scientometrics, 36:397–420, 1996.A. F. J. van Raan. Fatal attraction: Ranking of universities by bibliometric methods. Scientometrics, 62:133–145, 2005a.A. F. J. van Raan. Reply to the comments of Liu et al. Scientometrics, 64(1):111–112, 2005b.A. F. J. van Raan. Measurement of central aspects of scientific research: performance, interdisciplinarity, structure. Measurement:
Interdisciplinary Research and Perspectives, 3(1):1–19, 2005c.A. F. J. van Raan. Challenges in the ranking of universities. In J. Sadlak and N. C. Liu, editors, World-Class University and Ranking:
Aiming Beyond Status, pages 81–123, Bucharest, 2006. UNESCO-CEPES. ISBN 92-9069-184-0.F. S. Roberts. Measurement theory with applications to decision making, utility and the social sciences. Addison-Wesley, Reading,
1979.M. J. Rosenhead. Rational analysis for a problematic world. Wiley, New York, 1989.B. Roy. Main sources of inaccurate determination, uncertainty and imprecision in decision models. In B. Munier and M. Shakun,
editors, Compromise, Negotiation and group decision, pages 43–67. Reidel, Dordrecht, 1988.B. Roy. Multicriteria methodology for decision aiding. Kluwer, Dordrecht, 1996. Original version in French “Methodologie
multicritere d’aide a la decision”, Economica, Paris, 1985.B. Roy and D. Bouyssou. Aide multicritere a la decision : methodes et cas. Economica, Paris, 1993.M. Saisana and B. D’Hombres. Higher education rankings: Robustness issues and critical assessment. How much confidence can we
have in higher education rankings? Technical Report EUR 23487 EN 2008, IPSC, CRELL, Joint Research Centre, EuropeanCommission, 2008.
A. K. Sen. Internal consistency of choice. Econometrica, 61:495–521, 1993.A. Stella and D. Woodhouse. Ranking of higher education institutions. Technical report, Australian Universities Quality Agency,
2006.Times Higher Education Supplement. THES ranking, 2008.V. T’kindt and J.-C. Billaut. Multicriteria Scheduling. Springer Verlag, Berlin, 2nd revised edition, 2006.D. Turner. Benchmarking in universities: League tables revisited. Oxford Review of Education, 31(3):353–371, 2005.D. Turner. World university rankings. International Perspectives on Education and Society, 9:27–61, 2008.Ph. Vincke. University rankings. In D. Jacobs and C. Vermandele, editors, Ranking universities, pages 11–26, Brussels, 2009.
Edition de l’Universite de Bruxelles.D. von Winterfeldt and W. Edwards. Decision analysis and behavioral research. Cambridge University Press, Cambridge, 1986.M. Zitt and G. Filliatreau. Big is (made) beautiful: Some comments about the Shanghai-ranking of world-class universities. In
J. Sadlak and N. C. Liu, editors, World-Class University and Ranking: Aiming Beyond Status, pages 141–160, Bucharest,2006. UNESCO-CEPES. ISBN 92-9069-184-0.
M. Zitt, S. Ramanana-Rahary, and E. Bassecoulard. Relativity of citation performance and excellence measures: From cross-fieldto cross-scale effects of field-normalisation. Scientometrics, 63(2):373–401, 2005.