show me the money: examining the validity of the contract
TRANSCRIPT

Show Me the Money: Examining the Validity of the Contract Year Phenomenon in the NBA
CitationRyan, Julian. 2015. Show Me the Money: Examining the Validity of the Contract Year Phenomenon in the NBA. Bachelor's thesis, Harvard College.
Permanent linkhttp://nrs.harvard.edu/urn-3:HUL.InstRepos:14398539
Terms of UseThis article was downloaded from Harvard University’s DASH repository, and is made available under the terms and conditions applicable to Other Posted Material, as set forth at http://nrs.harvard.edu/urn-3:HUL.InstRepos:dash.current.terms-of-use#LAA
Share Your StoryThe Harvard community has made this article openly available.Please share how this access benefits you. Submit a story .
Accessibility

Show Me The Money:
Examining the Validity of the Contract Year Phenomenon in the NBA
Julian Ryan
Presented to the Department of Applied Mathematics
in partial fulfilment of the requirements
for a Bachelor of Arts degree with Honors
Harvard College
Cambridge, Massachusetts
April 1, 2015

Abstract
TエW マWSキ; ミ;ヴヴ;デキ┗W ラa デエW けIラミデヴ;Iデ ┞W;ヴ WaaWIデげ キゲ Wゲヮラ┌ゲWS ;Iヴラゲゲ ;ノノ マ;テラヴ professional American sports leagues, particularly the MLB and NBA. In line
with basic incentive theory, this hypothesis has been shown to be true in
baseball, but the analysis in basketball to this point has been flawed. In
estimating the contract year effect in the NBA, this paper is the first to define
rigorously the various states of contract incentives, the ignorance of which has
been a source of bias in the literature thus far. It further expands on previous
analyses by measuring individual performance more broadly across a range of
advanced metrics. Lastly, it attempts to account for the intrinsic endogeneity
of playing in a contract year, as better players get longer contracts and are thus
ノWゲゲ ノキニWノ┞ デラ HW キミ ; Iラミデヴ;Iデ ┞W;ヴが H┞ ┌ゲキミェ W┝ラェWミラ┌ゲ ┗;ヴキ;デキラミゲ キミ デエW NBAげゲ contract structure to form an instrument, and by comparing performance to a
priori expectations. In this manner, this paper produces the first rigorous
finding of a positive contract year phenomenon. The estimated effect is about
half that found in baseball, equivalent to a 3-5 percentile boost in performance
for the median player in the NBA.

Acknowledgments
This paper would not have been possible without those who have helped me along
the way. I am indebted to Professor James Stock for his invaluable guidance throughout the
process, and to Yao Zeng, for keeping me on the path to completion over the past few months
and trawling through pages of earlier drafts. Jen Doody has helped me immensely with the
writing process and any grammatical errors are my own fault in spite of her assistance. This
sort of analysis would not have been possible a decade ago, without the tireless efforts of
those at Basketball-Reference.com, and particularly Sean Forman and Justin Kubatko, among
others who have catalogued decades of basketball data and brought it into the public domain,
and to them I am extremely grateful. Finally, I would like the Harvard Sports Analysis
Collective and Professor Carl Morris for igniting my passion for basketball analytics. The Owen
Room in Winthrop G Entryway will always be a special place for those who care about the
objective analysis of the sports we love.

1
I. INTRODUCTION
At the core of any economic discipline is the notion that people respond to incentives,
and this foundational assumption has been baked into all fields of economic thought. The
National Basketball Association (NBA), and ゲヮWIキaキI;ノノ┞ デエW ノW;ェ┌Wげゲ Iラミデヴ;Iデ ゲデヴ┌Iデ┌ヴW, allow
us to examine the impact of extremely high-powered incentives on playersげ performance. This
paper examines the impact on players with increased incentives to perform at an even higher
level than their usual high pressure work environment, when they are facing what is
colloqui;ノノ┞ ニミラ┘ミ ;ゲ ; けIラミデヴ;Iデ ┞W;ヴげく Iデ is the first to demonstrate rigorously a positive effect
on performance.
These highly leveraged incentive situations arise beI;┌ゲW ラa デエW NBAげゲ Iラミデヴ;Iデ
ゲデヴ┌Iデ┌ヴWく Aデ ;ミ┞ ラミW デキマWが W;Iエ ヮノ;┞Wヴ キゲ ┌ミSWヴ Iラミデヴ;Iデ ┘キデエ ラミW ラa デエW ノW;ェ┌Wげゲ ンヰ
franchises. Unlike a classical labor market, with numerous widely heterogeneous companies
among which an individual laborer can move with relative freedom, the NBA labor market has
strict contract lengths for every player, and only a finite number of destinations for each
ヮノ;┞Wヴ ラミIW デエ;デ Iラミデヴ;Iデ キゲ ラ┗Wヴく Pノ;┞Wヴゲ ;ヴW ┗Wヴ┞ ヴ;ヴWノ┞ けaキヴWSげ ;ゲ キミ ; デヴ;Sキデキラミ;ノ ノ;Hラヴ マ;ヴニWデく
In the place of firing, quitting, and hiring as found in traditional labor markets, the NBA has
aヴWW ;ェWミI┞く WエWミ ; ヮノ;┞Wヴげゲ Iラミデヴ;Iデ キゲ ┌ヮが W┗Wヴ┞ デW;マ キミ デエW ノW;ェ┌W エ;ゲ デエW ヴキェエデ デラ ラaaWヴ
that player a contract. These contracts vary primarily in their compensation and length and
are standardized across the league by the Collective Bargaining Agreement (CBA), signed
HWデ┘WWミ デエW ヮノ;┞Wヴゲげ ┌ミキラミ ;ミS デエW ノW;ェ┌W. The result is analogous to a first-price auction
system1 aラヴ デエW ヴキェエデゲ デラ ヮノ;┞Wヴゲ H┞ デエW ンヰ デW;マゲが ┘エWヴWH┞ けヮヴキIWげ キミIヴW;ゲWs with both
compensation and length of contract. The ;┌Iデキラミ けgameげ is complicated by multiple factors,
1 It is somewhere between a first-price sealed bid auction and an English auction, as when teams offer players
contracts, the player may or may not divulge the other offers he has received to that point
2
including complexities ┘キデエキミ Iラミデヴ;Iデゲ ゲ┌Iエ ;ゲ ラヮデキラミ ┞W;ヴゲが ラヴ デエW ;Hキノキデ┞ ラa ; ヮノ;┞Wヴげゲ I┌ヴヴWミデ
team to offer an extra year as under the current CBA. The crucial element of this contract
system is that the majority of NBA contracts involve guaranteed money. Once a contract is
signed for, the player receives that sum over that timeframe.2 Even in the case of injury, the
player is paid, though the team may receive some insurance payments.
The so-called contract year, borne from this system, allows a player the foresight that
he will enter free agency at the end of the season.3 NBA teams overvalue ; ヮノ;┞Wヴげゲ マラゲデ
recent performance, relative to previous years, when making decisions on how much to offer
(Stiroh, 2007). As a result, players correctly infer that the final year of their contract is the
most highly leveraged regarding future payment and are absolutely incentivized to perform
at a higher level. Expectancy type theories of motivation predict increases in performance
during the contract year because it is the period in which external factors are most salient for
the player (Behling and Starke, 1973). These incentives are compounded by the salary cap for
each team, which creates a finite pool of available dollars in the league.4 Thus, to some
degree, every extra dollar earned by a player comes at the expense of the rest of the league
;ミS デエW マラデキ┗;デキラミ デラ ラ┌デヮWヴaラヴマ ラミWげゲ ヮWWヴゲ キゲ Wミエ;ミIWS. While in a perfectly competitive
marketplace one will be largely correctly compensated for performance, in the auction
system you are paid what the best bidder offers.5 To demonstrate the magnitude of the
incentives at stake for these players, consider the recent plight of Wesley Matthews.
2 There are extremely rare possible exceptions such as the case of gross misconduct by the player 3 As outlined in Section II, there are actually two types of free agency, unrestricted and restricted, with different
incentives attached 4 Each team can spend $63.065 million dollars on its roster for the 2014-2015 season. This number changes
slightly from year to year, and is known ;ゲ ; けゲラaデ I;ヮげが ;ゲ デW;マゲ ;ヴW ;HノW デラ W┝IWWS デエW I;ヮ デラ ヴW-sign their own
players (Coon, 2012) 5 This first-price auction mechanism may further compound incentivWゲ aラヴ デエW Iラミデヴ;Iデ ┞W;ヴ ヮノ;┞Wヴく TエW ┘キミミWヴげゲ curse amplifies as value increases (Thaler, 1992), and so the returns to the player of increasing his valuation may
compound

3
Matthews, playing in a contract year this season, was slated to receive something close to a
maximum contract6 at the end of the season worth approximately $100 million over five
years. But after tearing his Achilles tendon in early March, an injury from which some players
do not return to the same level of play, he is now being predicted to receive only around $50
million over four years (Cato, 2015).
In accordance with the powerful incentive to raise performance in a contract year,
there is some anecdotal evidence that NBA players do indeed experience performance
boosts. The media has embraced this hypothesis, and perhaps the most infamous case is Erick
Dampier. During his eighth season in the league in 2003-ヲヰヰヴが デエW ヶげ ヱヱげげ IWミデWr had a career
year, posting career highs in points, rebounds and assists per game. Known previously for
being a solid defensive big with little or no offensive prowess,7 Dampier miraculously
transformed into a borderline all-star as he became an efficient post-up threat and supremely
capable rebounder. His reward at the end of the season was a seven-year $73 million contract
from the Dallas Mavericks. After signing, Dampier swiftly returned to his perfectly ordinary
self, worth roughly a tenth of what he was being paid, and the opportunity cost of having
Dampier take up significant cap space was crippling to the Mavericks for the next seven
seasons.8 It is frequently described as one of the worst contracts ever offered by a team
(Brown, 2013). D;マヮキWヴげゲ ラミW season of excellence as nothing more than the contract year
phenomenon is frequently brought up by the media as proof of its existence (Simmons, 2006).
6 No player can earn more than a maximum contract, set at 25% of the cap for players who have played six or
fewer seasons, 30% of the cap for players in their seventh through ninth seasons, and 35% of the cap thereafter.
For various exceptions to this rule whereby players can be paid slightly more, please see Coon (2012) 7 Statistical plus-minus (SPM) rated him before 2003-2004 as approximately a replacement level player (see
Section 3 for explanation of SPM) 8 PWヴエ;ヮゲ キデ キゲ ミラ IラキミIキSWミIW デエ;デ D;ノノ;ゲ ┘ラミ デエW NBA デキデノW キミ ヲヰヱヲが ; ┞W;ヴ ;aデWヴ D;マヮキWヴげゲ Iラミデヴ;Iデ aキミ;ノノ┞ I;マW off the books

4
In similarly structured labor markets, the contract year effect has been shown to exist
and exert a positive influence on performance. Major League Baseball players also sign
guaranteed contracts of a predetermined length. For the contract year phenomenon, as with
many topics in basketball analytics, baseball was there first. Baseball is a static rather than
continuous sport and can be boiled down to a Markov chain, making any mathematical
analysis simpler.9 Dayn Perry of Baseball Prospectus produced the defining research on
H;ゲWH;ノノげゲ け┘;ノニ ┞W;ヴゲげ, デエW ゲヮラヴデげゲ Iラノノラケ┌キ;ノキゲマ aラヴ Iラミデヴ;Iデ ┞W;ヴゲ (Perry, 2006). Major
LW;ェ┌W B;ゲWH;ノノげゲ Iラミデヴ;Iデ ゲ┞ゲデWマが ┘キデエ Sヴ;aデ ヮキIニゲ ┌ミSWヴ デW;マ Iラミデヴラノ aラヴ ゲキェミキaキI;ミデノ┞ ノラミェWヴ
than in the NBA due to arbitration, means that top players tend to hit free agency around the
same point, with an average age of 3ヱくヰ キミ PWヴヴ┞げゲ ゲデ┌S┞く Although studies by Bill James
amongst others show that a player most often hits his peak between ages twenty-five and
twenty-nine, players saw a considerable uptick in performance for top players in their walk
┞W;ヴが ゲエラ┘キミェ デエ;デ さ;ェW SラWゲミげデ W┝ヮノ;キミ ;┘;┞ デhe walk ┞W;ヴゲげ ヮWヴaラヴマ;ミIW SキゲIヴWヮ;ミI┞ざ
(Perry, 2006, 201). On average, playersげ performance increased by 9% in their walk year, while
posting the same performance as a group in the years before and after the walk year. The
increase was partly due to volume as pitchers, for example, played more games in the walk
year relative to surrounding years, indicating an increased desire to play through discomfort
ラヴ キミテ┌ヴ┞く WエキノW さデエW H┌マヮ キミ ヮノ;┞キミェ デキマW W┝ヮノ;キミゲ ;┘;┞ ヮ;ヴデ ラa デエW ┘;ノニ ┞W;ヴ [performance]
;S┗;ミデ;ェW ぐ キデげゲ ミラデ Wミラ┌ェエ デラ ミ┌ノノキa┞ デエW デヴWミS IラマヮノWデWノ┞ざ ふPWヴヴ┞が 2006, 202).
9 Fヴラマ ;ミ キミキデキ;ノ ゲデ;デWが デエWヴW ;ヴW ; aキミキデW ミ┌マHWヴ ラa ミW┝デ ゲデ;デWゲぎ ; H;デデWヴげゲ ┗;ノ┌W キゲ SWaキミWS ;ゲ エis ability to get to
ゲデ;デWゲ ┘キデエ ゲ┌HゲWケ┌Wミデノ┞ エキェエWヴ W┝ヮWIデWS ┗;ノ┌Wゲが ┘エキノW ; ヮキデIエWヴげゲ ┗;ノ┌W キゲ デラ ゲデラヮ デエW H;デデWヴ aヴラマ ヴW;Iエキミェ デエラゲW states. By examining the probability distribution over states for batters and pitchers, we can assign them a value.
In addition, because baseball has such a developed farm system, we can ascertain the expected value of a
replacement player for each team called up from the minor leagues. Hence, the fairly accurate all-in-one statistic
of Wins Above Replacement (WAR) can be calculated and used to compare performance extremely well,
;II┌ヴ;デWノ┞ ;IIラ┌ミデキミェ aラヴ ; H;ゲWH;ノノ ヮノ;┞Wヴげゲ IラミデヴキH┌デキラミゲ キミ ; ゲW;ゲラミ

5
The performance of high level CEOs has also been shown to exhibit this pattern. CEOs
at large corporations often sign guaranteed contracts for set lengths of time, and it has been
found デエ;デ さテラH ┌ミIWヴデ;キミデ┞ IヴW;デWS H┞ W┝ヮキヴキミェ Wマヮノラ┞マWミデ Iラミデヴ;Iデゲ キミS┌IWゲ Iエ;ミェWゲ キミ
managerial behaviors that have significant positive impacts on firm financial activities and
ラ┌デIラマWゲざ ふLキ┌ ;ミS X┌;ミが ヲヰヱヲが ヲンぶく The empirical evidence for the contract year
phenomenon in other similar disciplines with highly leveraged incentives suggests the
existence of a similar effect existing in basketball.
Although there is theoretical motivation and anecdotal evidence of the contract year
effect in basketball, and empirical evidence in other similar disciplines, empirical approaches
in basketball up to this point have been severely lacking in rigor. The major paper on the topic
by White and Sheldon (2013) used a similar technique to that of Perry, comparing contract
year performance to baseline performance, which they defined as pre- and post-contract year
performance. They observed boosts in scoring statistics and no decline in non-scoring
statistics, resulting in the main finding of an overall increase of +0.75 (p-value < 0.001) in
Player Efficiency Rating (PER), an all-in-ラミW マW;ゲ┌ヴW ラa ; ヮノ;┞Wヴげゲ ヮWヴ-possession efficiency,
derived from the events counted in the box score10 of each game. However, beyond the
inability to draw conclusions from looking solely at PER,11 WhitW ;ミS “エWノSラミげゲ マWデエラS
induces biased estimates, as basketball players (unlike in baseball where players almost
always sign a new contract) frequently do not get another contract. Considering only players
who played during, before and after a contract year limits your sample only to players who
10 The box score is the tabulated results of a basketball game, historically reported in the newspaper the morning
after a game. It typically contains the points, rebounds, assists, steals, blocks and turnovers for each player. It
records all the major observed events in a game for each player, but certainly does not contain all the
キミaラヴマ;デキラミ ;Hラ┌デ ; ヮノ;┞Wヴげゲ ヮWヴaラヴマ;ミIW 11 PER has come under heavy criticism for Dave Berri, among others, and the various methods of evaluating
individual performance will be delved into in Section III

6
were able to get another contract after their contract year. Conditional upon that fact, they
must have played well enough in that contract year to merit another season of play, while
those who played poorly were cut from the sample, upwardly biasing the results.
Jean (2010) also comes to similar conclusions within an ordinary least squares
framework that scoring statistics increase, while also corroborating the conclusion of Berri
and Krautmann (2006) that players do ミラデ さゲエキヴニざ SWaWミゲキ┗W ヴWゲヮラミゲキHキノキデキWゲ キミ ヮ┌ヴゲ┌キデ ラa
offensive output. The magnitude of his estimated contract year effect is extremely high in
Iラマヮ;ヴキゲラミ デラ “エWノSラミ ;ミS WエキデWげゲが ;ミ ;ミラマ;ノ┞ JW;ミ ;ゲIヴキHWゲ デラ エキゲ マラSWノげゲ さ┘W;ニ ヮヴWSキIデキ┗W
ヮラ┘Wヴざ ェキ┗Wミ エキゲ ミWgative adjusted R-squared values (Jean, 2010, 42). Gaffaney (2013) tries
to control for quality of teammate and analyzes smaller groups divided by age, position, and
quality, with similar findings to White and Sheldon, though with some variation in magnitude
across groups. The extremely low number of observations12 Gaffaney uses is a potential cause
of the observed variation in effect.
All methods up to this point have been largely invalid for failing to address three major
concerns. The first is that none have attempted to consider the intricacies of NBA contracts
and thus エ;┗W ミラデ IラヴヴWIデノ┞ キSWミデキaキWS ; ヮノ;┞Wヴげゲ Iラミデヴ;Iデ ゲデ;デWく D;マヮキWヴげゲ キミa;マラ┌ゲ ゲデラヴ┞ キゲ
the battle cry of the media whenever the contract year phenomenon is discussed, but there
is a deep irony to its usage: by my definition, Dampier was not even in a contract year during
the 2003-2004 season. Dampier declined his player option and opted out of his contract with
the Golden State Warriors after his extremely successful season precisely because he wanted
to secure a lucrative new contract (Navalta, 2004). However, had he played poorly during the
season, he most surely would have opted in and played another season in the bay area.
12 As low as 70 observations in some cases, as he only uses player data from the 2012-2013 season and compares
it to career averages

7
Hence, 2003-2004 was neither a contract year nor what I term a non-contract year for
Dampier. There are many different nuances to NBA contracts, but if we are to estimate the
contract year effect, it must be between two well-defined contract incentive states, which are
broadly constant across players. White and Sheldon abヴ┌ヮデノ┞ ;Iニミラ┘ノWSェW デエ;デ さ┘エキノW ;ノノ ラa
these nuances [of contracts] have their own unique characteristics, we did not attempt to
SW;ノ ┘キデエ デエWゲW SキaaWヴWミIWゲざ ふWエキデW ;ミS “エWノSラミが ヲヰヱンが ヴぶが a;キノキミェ デラ Sキゲデキミェ┌キゲエ W┗Wミ HWデ┘WWミ
unrestricted and restricted free agency. Furthermore, their dataset straddles both side of the
2005 CBA which altered the incentive state for non-contract years as it made it much harder
for teams to waive players in its aftermath. These inaccuracies in contract analysis also hold
for the other two pieces of literature from Jean (2010) and Gaffaney (2013). Section II goes
into detail on NBA contract situations and my definition of contract states.
Secondly, all previous papers have only measured performance from events observed
in the box score. Whereas baseball boils down to a series of static individual interactions
between pitcher and hitter, with occasional teamwork as a result of those interactions,
basketball is a continuous sport with constant and various interactions across the court. As a
result, attributing individual credit is significantly more difficult. For instance, if a player hits
a three from the corner, the box score gives him three points, but to what extent was he aided
by the point guard who drove into the lane and collapsed the defense before passing the ball,
or by the defender that gave him too much slack? Of those three points, it is difficult to know
exactly how to accredit points between the shooter, the passer, the primary defender, and
indeed everyone else on the court at the time. Players have significant contributions outside
of the observed outcomes recorded in the box score, such as defensive pressure that does
not result in a shot being taken, or setting an excellent screen such that a teammate has a
higher chance of scoring. By expanding measures of performance to plus-minus based

8
metrics, and indeed the more accurate box score metric of win shares, this paper evaluates a
more complete measurement of performance in measuring the contract year effect (see
Section III for details).
Thirdly and most importantly, the literature thus far has neglected to consider the
intrinsic endogeneity of being in a contract year. Less impressive players get shorter contracts
and are thus more likely to be in a contract year, creating a negative correlation between
performance and the probability of being in a contract year. Jean (2010) and Gaffaney (2013)
ignore this endogeneity by operating within an ordinary least squares framework while White
;ミS “エWノSラミげゲ マWデエラS キミS┌IWゲ Hキ;ゲed estimates for reasons outlined above. I instead use an
instrumental variables framework with a seasonal instrument which takes advantage of
W┝ラェWミラ┌ゲ ┗;ヴキ;デキラミ キミ デエW NBAげゲ Iラミデヴ;Iデ ゲデヴ┌Iデ┌ヴWが ┘エキIエ キマヮ;Iデゲ デエW ノキニWノキエララS ラa ; ヮノ;┞Wヴ
being in a contract year but not his performance (see Section IV for details). In addition,
P;キミWげゲ ヮrojection system13 is utilized to compare a player against his expected performance,
further reducing the endogeneity issue.
After correcting for these three major concerns with the literature, this paper finds
the first clean evidence of a positive contract year effect. The effect is estimated to be
approximately a 3-5 percentile boost in performance for the median NBA player, and
equivalent to an increased output of 0.009 wins per 48 minutes.14 This is about half of what
is observed in the baseball literature, and roughly two-thirds the estimate from White and
Sheldon (2013). In further contrast to White and Sheldon, the contract year effect is seen
primarily in rebounding and steals in the box score rather than in offensive statistics.
13 See Appendix 4 for details of how this projection is calculated 14 Using the win shares per 48 estimate from column (5) of Table X

9
As methods of measuring individual performance in the NBA become more precise
and less noisy, and if a more accurate projection system is developed, the framework outlined
in this paper could be used in future research to further refine the contract year estimate. At
this point in time, however, we readily conclude that there is indeed an effect, but that the
media at large overstates this effect.

10
II. CONTRACT SITUATIONS
At the beginning of each NBA season, a player may find himself in a variety of distinct
contract situations. We want to examine the precise effect of heading into a guaranteed
contract year at the beginning of the season versus the alternative guaranteed situation of
playing under the same current contract at the beginning of next season. It is possible that
the player may change teams in this second scenario に for example, if he is traded に but the
player will nonetheless be certain that he will not enter free agency in the offseason. Outside
of these two possibilities, there are numerous other contract situations that offer differing
incentives.15
The first category is any form of contract with unguaranteed or partially guaranteed
portions. Players with such clauses have increased incentives to perform, and stay healthy to
receive the financial benefits explicitly outlined in their contracts. This creates a
fundamentally different scenario from a player whose financial remuneration is guaranteed
independent of his current play.
The second category is any contract for which the next season involves an option.
There are three types of options in the NBA: team options, player options, and early
termination options. The team option gives the team the right to opt into another year of the
contract, which alters デエW ヮノ;┞Wヴげゲ キミIWミデキ┗Wゲ: if he performs extremely well, and his team opts
into the next year of his contract, he will be locked into a potentially below-market deal. If he
performs poorly, however, the team will likely opt out, and his price in free agency will take a
エキデく TエW キミIWミデキ┗Wゲ ;ヴW ;ノゲラ キミaノ┌WミIWS H┞ ; ヮノ;┞Wヴげゲ ゲ;デキゲa;Iデキラミ ヮノ;┞キミェ aラヴ エキゲ I┌ヴヴWミデ デW;マく
If his satisfaction is low, the player might deliberately diminish his value so that the team
15 TエW マ;テラヴキデ┞ ラa キミaラヴマ;デキラミ キミ デエキゲ ゲWIデキラミ IラマWゲ aヴラマ L;ヴヴ┞ Cララミげゲ キミ┗;ノ┌;HノW ェ┌キSW デラ デhe nuances of the
CBA (Coon, 2012)

11
option is not exercised. Team option contracts thus create different sets of incentives from
definitively being in a contract year or not.
Player options are for one year only, whilst early termination options can last up to
two years. In both cases, the player may opt into the contract at a set price. These too create
different incentives, as the player is protected from poor performance: if he plays badly, he
can opt in and have a けsecond attemptげ at a contract year. In this respect, not accounting for
player option contracts can engender significant bias in results. Those who opt out are likely
to have outperformed their contracts, receiving a bigger haul in free agency compared to
those who opt into their contracts. Hence, considering players who opt out after just playing
in a contract year biases performance upwards; it does not consider players who would have
played in a contract year had they opted in, an action highly correlated with worse
performance. Tエキゲ ┘;ゲ デエW ニW┞ Hキ;ゲ キミ デエW ノキデWヴ;デ┌ヴWげゲ SWaキミキtion of ex-post contract year
status, as player options are relatively common in the NBA.16 In producing my dataset, all
player-seasons followed by an option year of any variety were excluded as they were neither
けヮ┌ヴWげ ミラミ-contract nor contract years. If an option was exercised, however, then that year is
included as a guaranteed contract year in my dataset.17
The third category consists of players on rookie contracts. For first-round picks,
contracts are four years in length, with two guaranteed years and two team option years.
Approximately 72% of teams opt into these option years because rookie deals tend to be
cheap relative to the free agent auction price for talent (Silver, 2014). The value of the
contract for the first four seasons is determined solely H┞ デエW ヮノ;┞Wヴげゲ ヮキIニ ミ┌マHWヴ as per the
16 Particularly after the 2011 CBA (Lowe, 2014(a)) 17 Unless it was the first of two early termination option years. In that case only the second exercised option
would be considered a contract year

12
Collective Bargaining Agreement (CBA).18 In the first two seasons, incentives are obstructed:
players want to stay in the league, avoid time in the NBA Development league (as is common
for young players), and receive the latter two team option years. In the offseason after the
third season, elite players often receive five-year extensions before the player can hit free
agency, meaning that the third year of a rookie contract is a quasi-contract year.19 Extensions
cannot be signed until this time. If no extension is signed and a player plays under the fourth
year of his rookie deal, then the player enters restricted rather than unrestricted free agency.
In this relatively common scenario, デエW ヮノ;┞Wヴげゲ デW;マ エ;ゲ Αヲ エラ┌ヴゲ to match any offer sheet
the player signs with any other franchise. The player must then sign this matched offer sheet
if his team extends it. Other than signing a deal with his own team or signing an offer sheet
with another team (which can be matched by his current team), the only other option a player
has is to sign a qualifying offer, also predetermined by his draft pick number, for a fifth season.
This alternative often offers remuneration significantly below market value as players
approach their prime.
The fifth season of a rookie contract while under a qualifying offer is categorized as a
contract year, as the player is without question going into unrestricted free agency at the end
of the year. In addition, if a player signs an extension after his third season which comes into
effect after his fourth year when his rookie deal is completed, then the fourth year of a rookie
deal may be considered a bona fide non-contract year. However, under all other
circumstances of a rookie contract, a player faces differing incentives than he would face in a
18 There is some wiggle room as teams can technically offer between 80% and 120% of the number the CBA
mandates, but almost all contracts are signed at 120% 19 Extensions cannot be signed until after a player has been in the league for three years.

13
guaranteed contract or non-contract year.20 Outside of these two specific exceptions, all
player-seasons on rookie contracts are hence excluded from my dataset.
Second-round picks do not have specific set lengths or prices, as first-rounders do, but
the league-wide standard has come to be four-year deals which are never fully guaranteed,
for amounts varying with player quality (Lowe, 2014(b)). Usually, the first two seasons will
carry either a full or partial guarantee, with the latter two fully unguaranteed. To some
degree, these latter two years act as de facto team options with the team able to dump the
player for no cost at any point up until January 10th of any league year; at that date, all
contracts become guaranteed for the rest of the season, mimicking the situation of first-round
rookie contracts. Regardless of the specifics of the contracts, second-round picks will always
enter restricted free agency at the end of their rookie deals, with the same choices as first-
rounders.21 As a result, they are not in the same incentive state as those who will be entering
unrestricted free agency at the end of their contract and thus are excluded from my dataset.22
WエキノW ┌ミSWヴ Iラミデヴ;Iデが ; ヮノ;┞Wヴげゲ ゲキデ┌;デキラミ I;ミ HW マラSキaキWS キミ デエヴWW マ;キミ ┘;┞ゲ ラデher
than entering free agency. Extensions are commonly offered to elite third-year players as
described previously, such that the player cannot test the waters of restricted free agency
after his fourth year. Aside from that instance, however, only a contract for four or more
seasons can be extended に and then only after three years. Additionally, an extension can
only be used to offer a salary increase to a player, and is only an option for teams under the
20 Coon (2013) provides substantial empirical evidence for differences between restricted and unrestricted free
agency; while Lowe (2013) shows anecdotal evidence of the same result. Together, we can readily conclude that
players facing restricted free agency are in a different incentive state to those facing unrestricted free agency 21 They can choose to sign a qualifying offer then enter unrestricted free agency after a year; sign with their
current team; or sign an offer sheet with another team which their current team has the right to match.
However, unlike first round picks who have their qualifying offer set by the CBA, second round picks can only
sign at the league minimum if they choose this option and so this is exceedingly rare 22 With the same caveat that qualifying offer years do count as guaranteed contract years
14
cap.23 Not including option years at the end, as of the 2011 CBA, four years is the current
maximum contract length a team can offer a player in free agency, though a team re-signing
their own player is allowed the luxury of offering five years. Under the 2005 CBA, those
maximum lengths were five and six years respectively and prior to 2005, there was no formal
limit on contract length.24 These factors combine to make extensions extremely rare. One
could argue that players with four- or five-year contracts have an increased incentive to play
for an extension aヴラマ デエW デエキヴS ┞W;ヴ ラa デエWキヴ Iラミデヴ;Iデ ラミ┘;ヴSが HWaラヴW デエW aキミ;ノ けデヴ┌Wげ Iラミデヴ;Iデ
year. This quasi-contract year exists only to impress their current team rather than the auction
mechanism of thirty franchises bidding for services, but this could still be considered distinct
from the non-contract year state. However, a very small sample of players receive contracts
of four or more years; and the athletes that do will invariably have player option years
attached,25 reducing the incentive to seek an extension. Regardless, extremely few players
are now extended in the NBA, in stark contrast to years before the 2005 CBA. Hence, I have
not designated these players as under a different incentive state.
The second way by which contract situations can change is by waiving or buyout.
These terms respectively describe when a player, despite holding guaranteed salary, is
voluntarily or involunデ;ヴキノ┞ I┌デ aヴラマ ; デW;マげゲ ヴラゲデWヴ ふunguaranteed contracts cut are also
described as waiving by the media, but are not relevant to my discussion, as I have eliminated
these contracts.) When a guaranteed player is cut, his contract is still paid by the team, but
23 Most of the top teams operate over the cap, having spent extra money re-signing their own good players,
which is why they are now top teams 24 This is the case in all other American sports leagues. The NBA is the only league with maximum contract lengths 25 Because the CBA limits the maximum value of a contract as a percentage of the cap (see footnote 3), the very
best players in the league provide a large amount of excess value to their franchises. These are the players who
ェWデ ノラミェWヴ デWヴマ SW;ノゲ ;ミS HWI;┌ゲW デエW Iラミデヴ;Iデ キゲ ;ノヴW;S┞ ゲノ;ミデWS キミ デエW デW;マげゲ a;┗ラヴ H┞ デエW ヮヴキIW IWキノキミェが デエW┞ are also almost always given the luxury of player options attached at the end

15
he is eligible to join other franchises on a new contract.26 That guaranteed money paid out by
the original team, still counts against theキヴ ゲ;ノ;ヴ┞ I;ヮ ;ゲ けSW;S マラミW┞げ as of the 2005 CBA.27
Before the 2005-2006 season, NBA players could be cut and still paid their money, but that
salary would not count against the cap. Post-2005, this new approach fundamentally changed
デW;マげゲ ;デデキデ┌SWゲ デラwards cutting players, as waiving a player now had the added opportunity
cost of not being able to spend that money on other players. For this reason, my sample only
goes back to the 2005-2006 season; prior to that time, players were generally more likely to
be cut, and therefore operated under a markedly different incentive state.28 All other
literature on the NBA contract year effect sidesteps this matter, using a dataset that straddles
the 2005 CBA without mentioning this significant issue.29
The difference between waiving and buyout is based on whether the player consents
or not. A buyout is a mutual agreement between the player and the team, wherein in
exchange for gaining his freedom to sign elsewhere, the player agrees to receive a reduction
on the remaining salary he is owed. This option is understandably rarely taken, especially prior
to the last season of a contract. It is usually exercised in situations where the player either
wants more playing time, or hopes to play for a contending team to try to win a title. Both
waiving and buyouts are extremely rare, primarily exercised on albatross contracts に
previously good players who have since become dead weight for a franchise.30 Nonetheless,
26 This process is needlessly complicated and irrelevant to our discussion (see Coon (2012) for details). The new
contract signed by the player is considered separately from the old one in my analysis, when determining
whether seasons are contract years or non-contract years. 27 A situation congruous to the current state of the NFL 28 There is substantial anecdotal evidence that this is the case (Jackson, 2005) 29 White and Sheldon (2013) use a sample from 2003-2004 to 2009-2010. Jean uses a sample from 2001-2002
to 2008-ヲヰヰΓく G;aa;ミW┞げゲ ゲ;マヮノW キゲ ヮWI┌ノキ;ヴ キミ ゲラノWノ┞ aラI┌ゲキミェ ラミ the 2012-2013 season, and comparing
performance in that season to career averages 30 For more information about the minutiae of these processes and in particular the stretch provision, please
see Coon (2012)

16
waiving or a buyout is a constant possibility for players in any contract state, and should be
factored in as part of their incentive situation: playing well enough to maintain a roster spot.
The third way in which players can be cut is the amnesty provision. The amnesty
provision allows each franchise to designate one guaranteed player, signed under the
previous CBA, to be cut without their contract counting against the cap.31 This provision was
written デラ ;ノノラ┘ デW;マゲ ラミW けェWデ ラ┌デ ラa テ;キノ aヴWWげ I;ヴS aラヴ a contract signed under the old CBA
that is no longer effective under the new league rules. Each team may only use the provision
once ever, and thus some players are more likely to be amnestied than others. In addition to
the quality of the player and size of his contract, this probability depends on whether a
ヮノ;┞Wヴげゲ contract was signed under the current CBA or the old one, and also which team they
are playing for, as some franchises have already designated their one player and others have
not. This slightly varying possibility of being amnestied could alter the incentive state, as those
with higher probability of being amnestied would have higher incentive to keep their job.
Ultimately, however, this probability is realistically unlikely to make any meaningful
SキaaWヴWミIW デラ ; ヮノ;┞Wヴげゲ キミIWミデキ┗Wゲ に even for eligible players, the probability of this happening
is extremely low as only 30 total players can be amnestied over six years.32 Hence, my dataset
is not corrected for this discrepancy.
Finally, to form my dataset, I only included player-seasons which were either a
guaranteed contract year に in which the player knew at the end of the season that he would
enter unrestricted free agency に or a guaranteed non-contract year, in which the player knew
that he would continue playing under his contract, whatever its wrinkles might be, for this
season and the next. All others, including any first contract in the league,33 any contract
31 Tエラ┌ェエ デエW ゲ;ノ;ヴ┞ キゲ ゲデキノノ ヮ;キS ;ミS デエW けゲWデ-ofaげ マWIエ;ミキゲマ ゲデキノノ ;ヮヮノキWゲ ふゲWW Cララミ ふヲヰヱヲぶ aラヴ SWデ;キノゲぶ 32 The length of each CBA before it is renegotiated 33 Qualifying offers and fourth years after extensions notwithstanding

17
containing unguaranteed money or incentives, or any year going into an option year, were
excluded. Any of these other variations ultimately change incentives and could pick up
different effects than the causal nature on performance of being in a contract year. This is
particularly important with regard to the previously detailed bias toward player option
contracts.
This information was not readily available. I collected three large databases of contract
information, from Basketball-Reference.com, from Mark Deeks at ShamSports.com, and from
Spotrac.com. Across these three sources of information, I ascertained the contract states of
each season for every player who has played in the NBA in some capacity since 2005-06. This
date cut-off was chosen because of the aforementioned change in teamsげ penchant for
cutting players after the 2005 CBA, and was also the point when contract information started
to become less detailed.34 Some player-seasons were in all three sources, while some were
only in one. Not infrequently, the sources disagreed, resulting in a manual internet search for
media coverage at the time the contract was signed to retrieve contract details.35 Only by
such arduous measures was I able to produce the first dataset of its kind, which rigorously
IラミゲキSWヴゲ ヮノ;┞Wヴゲげ Iラミデヴ;Iデ ゲキデ┌;デキラミゲく
Overall, a plurality of athletes sign only one contract with an NBA team; most never
make it back to the NBA, playing overseas or retiring instead. These players never made it
into my sample, which is comprised only of players who signed second contracts.36 Beyond
that, a small number were only able to secure unguaranteed contracts and were also
excluded, with the rest of the exclusions resulting from option scenarios. Of the 4,133 player-
34 In particular, the distinction between guaranteed and unguaranteed contracts was often left out, and option
years were not as clearly demarcated. 35 I required at least two independent media sources to agree on the specifics of a contract to verify a player-
ゲW;ゲラミげゲ Iラミデヴ;Iデ ゲデ;デW 36 Footnote 33 still applies

18
seasons from 2005-2006 to 2013-2014 across 1,038 players, 1,870 player-seasons across 439
players were included in my dataset as either contract or non-contract years as per my
definition. Despite this attrition from only including contract and non-contract years,
compared to other studies, this sample is still the largest.37 More importantly, it is the first to
be appropriate for analyzing the contract year phenomenon, summarily defined as the
change in performance between these two discrete and now well-defined states.
37 White and Sheldon (2013) used 510 player-seasons across 170 NBA players; Jean (2010) used 1864 player-
seasons across 231 players; and Gaffaney used 230 player-seasons from the 2012-2013 season.

19
III. EVALUATING INDIVIDUAL PERFORMANCE
No current all-in-ラミW H;ゲニWデH;ノノ ゲデ;デキゲデキI I;ミ I;ヮデ┌ヴW ; ヮノ;┞Wヴげゲ IラミデヴキH┌デキラミ デラ デエW
extent that wins above replacement (WAR)38 can in baseball. Basketball is a continuous sport
while baseball is static; as such, it is far more difficult to determine how to apportion credit
between players.39 As grandfather of basketball analytics Dean Oliver put it: さBWI;┌ゲW
teamwork is not a big part of baseball and because baseball measures progress toward
scoring through bases, analysis of baseball player contributions is easier than analysis of
H;ゲニWデH;ノノ ヮノ;┞Wヴ IラミデヴキH┌デキラミゲざ ふOノキ┗Wヴが ヲヰヰヴが Βヱぶく
This difficulty has not stopped people from trying to produce so-called けエラノ┞ ェヴ;キノげ
ゲデ;デキゲデキIゲ キミ ;ミ ;デデWマヮデ デラ ゲ┌ママ;ヴキ┣W ; ヮノ;┞Wヴげゲ ラ┗Wヴ;ノノ IラミデヴキH┌デキラミ デラ エキゲ デW;マく TエW マラゲデ
common approach is to use linear weights on box score statistics to estimate overall
performance. By seeing what box score outcomes are associated with overall team
performance,40 we can infer that players producing such outcomes more often are better
players. However, aノノ デエWゲW aラヴマ┌ノ;ゲ ;ヴW テ┌ゲデ ;ヮヮヴラ┝キマ;デW ┘;┞ゲ ラa ヴWヮヴWゲWミデキミェ ゲラマWラミWげゲ
opinion about the quality of players. They are limited to only the information recorded in the
box score, and can only partially take into account team environment by incorporating team
statistics as well. Despite being written in 2004, Oノキ┗Wヴげゲ ┘ラヴニ summarizes most of the linear
weight valuation systems in the public domain today. It is clear that some box score outcomes
demonstrate positive value provided by the player while others demonstrate negative value,
but the weights differ dramatically, indicative of the difficulty in determining one clear,
objective value. T;HノW I キゲ ヴWヮヴラS┌IWS aヴラマ DW;ミ Oノキ┗Wヴげゲ ヲヰヰヴ ヴWゲW;ヴIエく
38 Replacement level is an important concept in player evaluation. It refers, in basketball, to the expected quality
of the fictitious best available player not currently on a NBA roster 39 See introduction for some more color on this topic 40 This is usually defined as offensive and defensive efficiency に points scored and points allowed respectively に
per 100 possessions

20
Table I: Weights Assigned to Different Statistics, Relative to Points
Statistic Manley
Credits
Hoopstat
Grade
Steele
Value
Bellotti
Points
Createdb
Claerbaut
Quality
Pointsa
Mays
Magic
Metrica
Schaller
TPRc
Player
Efficiency
Ratinga
Berri
Individual
Winsa
Points 1.00 1.00 1.00 1.00 1.00 1.00 1.00 1.00 1.00
Assists 1.00 1.39 1.25 1.08 0.63 0.98 0.90 0.79 0.92
Offensive Rebounds 1.00 1.18 1.00 0.92 0.63 0.71 0.75 0.85 3.82
Defensive Rebounds 1.00 0.69 1.00 0.92 0.63 0.71 0.75 0.35 1.71
Steals 1.00 1.39 1.25 0.92 0.63 1.09 1.80 1.20 2.44
Blocks 1.00 1.94 1.00 0.92 0.63 0.87 1.10 0.85 0.86
Missed Field Goals -1.00 -0.83 -1.00 -0.92 -0.63 -0.71 -1.00 -0.85 -1.38
Missed Free Throws -1.00 -0.50 -0.50 -0.92 -0.24 -0.55 -0.90 -0.45 -0.79
Turnovers -1.00 -1.25 -1.25 -0.92 0.63 -1.09 -1.80 -1.20 -2.77
Personal Fouls 0.00 0.00 -0.50 -0.46 0.00 0.00 -0.60 -0.41 -0.46 Table is reproduced from p.83 of Basketball on Paper (2004) by Dean Oliver, current head of basketball analytics for the Sacramento Kings
Table is a rough guide only to weights, as many of these use additional team statistics to further refine estimates, particularly for defense
aRequires assumption about the average number of free throws made, 2-point field goals made, and 3-point field goals made. Uses approximate averages
bAssumes value of ball possession = 0.92, based off Bellotti's own estimates
cAdds additional 0.5 points for each 3-point shot made

21
There are two broad categories of these systems: weights stemming from empirical
regression-based formulations and weights stemming from theoretical frameworks. Of the
regression-based metrics, the public is most familiar with HoノノキミェWヴげゲ Pノ;┞Wヴ EaaキIキWミI┞ ‘;デキミェ
(PER), widely popularized by ESPN, which is likely the best of this category. Its fairly complex
calculation41 incorporates team pace and statistics into W┗;ノ┌;デキラミ ラa ;ミ キミSキ┗キS┌;ノ ヮノ;┞Wヴげゲ
box score statistics, with the league average minute set to 15 PER.
TエW さマ;テラヴ ┘W;ニミWゲゲ キミ デエW ラヴキェキミ;ノ PE‘ IラミIWヮデ キゲ ノ;Iニ ラa IラミゲキSWヴ;デキラミ aラヴ SWaWミゲWざ
(Lawhorn, 2014) and in addition, its inability to correctly punish inefficient high volume
shooting. In terms of defense, on an individual level, the box score only keeps track of blocks
and steals. PER does not use play-by-play data, so determining defensive contributions is truly
ノキマキデWSが WゲヮWIキ;ノノ┞ ┘エWミ ラミW IラミゲキSWヴゲ デエ;デ さ; player can actually have a large number of
steals and blocked shots, even though he is a louゲ┞ SWaWミSWヴ キミ デエW デW;マ IラミIWヮデざ ふEノノキゲが
2013). Noted sports economist Dave Berri has a very harsh critique of Hollinger, calculating
that:
さA ヮノ;┞Wヴ ┘キノノ けHヴW;ニ W┗Wミげ ラミ デ┘ラ ヮラキミデ aキWノS ェラ;ノゲ ;デデWマヮデゲ キa エW エキデゲ ラミ ンヰくヴ% of
these shots. On three pointers the break-even point is 21.4%. If a player exceeds these
thresholds, and virtually every NBA player does so with respect to two-point shots,
the more he shoots the higher his value in PER. So a player can be an inefficient scorer
and simply inflate his value by taking a larェW ミ┌マHWヴ ラa ゲエラデゲざ ふBWヴヴキが ヲヰヰヶ).
In this way, PER overvalues high usage players and to some extent punishes low volume, but
high efficiency, offensive contributors. Hollinger responded directly to this claim, arguing that
ゲキミIW デエW PE‘ キゲ I;ノキHヴ;デWS デラ ; ノW;ェ┌W ;┗Wヴ;ェW ラa ヱヵくヰ W;Iエ ゲW;ゲラミが デエW けHヴW;ニ-W┗Wミげ ヮラキミデゲ
calculated by Berri are invalid. So while PER is the best of a relatively poor group of regression-
based linear approaches and the furthest previous studies have gone in analyzing the contract
41 See Appendix 1 for details

22
year phenomenon,42 it still leaves much to be desired regarding accurate evaluation.
Uノデキマ;デWノ┞が キミ BWヴヴキげゲ ラヮキミキラミが さラミW I;ミ ゲエラ┘ ぐ デエ;デ マWデヴキIゲ ノキニW ぷPE‘へ ;ヴW I;ヮデ┌ヴキミェ ヮWラヮノWげゲ
perceptions of performanIWがざ SWゲヮキデW さW┗キSWミIW デエ;デ ヮWヴIWヮデキラミゲ ラa ヮWヴaラヴマ;ミIW キミ
H;ゲニWデH;ノノ Sラ ミラデ マ;デIエ デエW ヮノ;┞Wヴげゲ ;Iデ┌;ノ キマヮ;Iデ ラミ ┘キミゲざ ふBWヴヴキが ヲ006), with particularly an
overemphasis on scoring points over other attributes.
BWヴヴキげゲ ラ┘ミ ゲ┞ゲデem of けWキミゲ PヴラS┌IWSげ ふWPぶ43 was the first leader in theoretical
formulations of the linear weights, which started with a priori assumptions about how to
assign weights に and then used regression from the data to assign values (Berri, 2006). This is
in contrast to HoノノキミェWヴげゲ ;ヮヮヴラ;Iエが キn which it is assumed little is known, begin with
regressions, and make adjustments based on sensible intuition from there. Oliver produced
his own all-in-one statistic from a theoretical framework, creating individual offensive and
defensive ratings, which estimate how many points a player scores and allows per 100
possessions, ヴWゲヮWIデキ┗Wノ┞く Oノキ┗Wヴげゲ キミゲキェエデ ┘;ゲ デラ ┌ゲW キミデWヴ;Iデキ┗W ┘Wキェエデキミェが ┘エキIエ aノ┌Iデ┌;デWゲ
H;ゲWS ラミ ; デW;マげゲ Iエ;ヴ;IデWヴキゲデキIゲく Fラヴ W┝;マヮノWが エW ;ヴェ┌Wゲ デエ;デ さ;ミ ;ゲゲキゲデ ラミ ; ェララS ゲエララデキミェ
team tWミSゲ デラ HW マラヴW ┗;ノ┌;HノW デエ;ミ ラミW ラミ ; ヮララヴ ゲエララデキミェ デW;マざ ふOノキ┗Wヴが ヲヰヰヴが ヱヴΑぶが ;ミS
デエ┌ゲ デエW ┘Wキェエデ ラミ ;ゲゲキゲデゲ ゲエラ┌ノS ┗;ヴ┞ ;IIラヴSキミェノ┞く Tエキゲ IラミIWヮデ さ;ノノラ┘ゲ ┌ミキケ┌W ;ゲゲキェミマWミデ
ラa デW;マ ゲ┌IIWゲゲ デラ デエW デW;ママ;デWゲ ┘エラ IララヮWヴ;デWS デラ IヴW;デW デエ;デ ゲ┌IIWゲゲざ ふOノキ┗Wヴが 2004, 149).
His formulas were updated by Justin Kubatko to produce an all-in-ラミW け┘in sエ;ヴWゲげ マWデヴキI
(Kubatko, 2009). This metric can be split into offensive and defensive contributions, correcting
for league environment to estimate the number of wins produced by each player.44
P;キミWげゲ ヲヰヱヱ ゲデ┌S┞ けIゲ WP ; Legitimate Statいげ Iラマヮ;ヴWゲ デエWゲW マ;テラヴ Hラ┝ ゲIラヴW ゲ┞ゲデWマゲく
Ultimately, he found that さデエW マラヴW デキマW デエ;デ ェラWゲ H┞が デエW ┘ラヴゲW ;ミS ┘ラヴゲW WP ェWデゲ ヴWノ;デキ┗W
42 White and Sheldon (2013) drew primary conclusions from PER 43 Jean (2010) used a simplified version of this metric 44 See Appendix 2 for details of calculating win shares

23
デラ デエW IラマヮWデキデキラミざ ふP;キミWが ヲヰヱヱぶ ;ミS キゲ ;ヴェuably no better than PER, but win shares
consistently outperforms the others in his study and is likely the best linear weights system.
Rosenbaum (2012) ┌ヮエWノS デエW ゲデ┌S┞げゲ IラミIノ┌ゲキラミが and win shares are now considered to be
the industry standard linear weights performance metric by the APBRmetric45 community,
ゲキェミキaキI;ミデノ┞ キマヮヴラ┗キミェ ┌ヮラミ HラノノキミェWヴ ;ミS BWヴヴキげゲ ;ヮヮヴラ;IエWゲく
Nonetheless, as with all rating systems based on box score data, win shares cannot
account for contributions not tracked in the box score, notably on defense (Pelton, 2012). The
stat sheet ignores screens, boxing out, the spacing provided by an elite shooter, and countless
other tangible and intangible contributions a basketball player provides to his team. Hence,
all of these box score derived metrics can belie the truth of an observed contract year effect.
If we want to test if players play better in a contract year, then our metric for performance
should be better at taking defensive contributions into account, and less beholden to
offensive output. It is very possible that players, knowing they are in a contract year, will try
to take more shots and put up points に but in doing so, they may hurt their team if they shoot
┘エWミ デエW┞ ゲエラ┌ノS ヮ;ゲゲく A ゲデ;デキゲデキI HWデデWヴ ;HノW デラ W┗;ノ┌;デW ; ヮノ;┞Wヴげゲ ;Iデ┌;ノ ラ┗erall contribution
to a team, including what is not recorded in the box score, will allow us more insight as to
whether or not there is truly a contract year effect.
In order to create a static analogue to baseball within basketball, possessions can be
coミゲキSWヴWS ;ゲ デエWキヴ ラ┘ミ SキゲIヴWデW W┗Wミデゲく B┞ W┗;ノ┌;デキミェ ; ヮノ;┞Wヴげゲ IラミデヴキH┌デキラミゲ デラ ラaaWミゲキ┗W
and defensive possessions on average, we can estimate an overall contribution by the player
on a per-possession basis. These metrics are adjusted plus-minus statistics, which as a
45 APBRmetrics stands for Association for Professional Basketball Research Metrics and is a term used to refer
デラ デエW ゲデ;デキゲデキI;ノ ;ミ;ノ┞ゲキゲ ラa H;ゲニWデH;ノノく Iデ キゲ H;ゲニWデH;ノノげゲ Iラヴラノノ;ヴ┞ aラヴ デエW HWデデWヴ ニミラ┘ミ デWヴマ “;HWヴマWデヴキIゲが derived from the acronym SABR (Society for American Baseball Research), coined by pioneer Bill James

24
H;ゲWノキミW デ;ニW ; ヮノ;┞Wヴげゲ ヮノ┌ゲ-minus46 on each end, but then crucially adjusts for all other
players on the court. This adjustment is vital, as good players will face other good players
more often than they face bad players, so their raw plus-minus will belie their true
contributions. The underlying framework is that each possession has a known value, which is
the points scored, and ten variables that are the contributions of each player. Most systems
additionally adjust for the average per possession home court advantage in the NBA,47 and
then plug in every possession in an NBA season in an ordinary least squares framework to find
the values for all the unknown variables に the playersげ offensive and defensive contributions.
This method attempts デラ IラミゲキSWヴ ;ノノ ラa ; ヮノ;┞Wヴげゲ WミデキヴW IラミデヴキH┌デキラミゲ ラミ デエW ラaaWミゲキ┗W ;ミS
defensive end in one number, without relying on what humans have chosen to record and
assigning weights to those observations. The result is two numbers for each players, usually
expressed as the number of points above or below the average a player contributes to each
100 offensive and defensive possessions. The sum of these two is an all-in-one metric
summarizing ; ヮノ;┞Wヴげゲ quality over the course of a season.
Major issues exist with this framework. The first is the assumption that a player applies
a constant amount of defensive and offensive impact over the course of the season, and that
each possession is played in the same environment.48 Player quality is not allowed to fluctuate
over the course of a season, despite times when a player may be slightly injured or other
exogenous factors. Most notably, though it controls for the quality of teammates, it does not
control for the changing role of a player if he is traded or if the coach institutes a new system.
46 Plus-マキミ┌ゲ ヴWaWヴゲ デラ ; ヮノ;┞Wヴげゲ デW;マげゲ ヮラキミデ SキaaWヴWミデキ;ノ ┘エキノW エW キゲ ラミ デエW Iラ┌ヴデく Iデ エ;ゲ ヴWIWミデノ┞ HWIラマW ; part of the box score, but is almost meaningless by itself unless you adjust for the other players on the court 47 In basketball, home teams win about 60% of the time in the NBA. This home court advantage is likely almost
entirely due to refereeing bias (Dubner, 2011) 48 Iミ Iラミデヴ;ゲデが GラノSマ;ミ ;ミS ‘;ラ ふヲヰヱンぶ エ;┗W aラ┌ミS W┗キSWミIW ラa ;ミ けWノ;ゲデキI WaaWIデげ デエ;デ ヮノ;┞Wヴゲ ヮノ;┞ HWデデWヴ ┘エWミ behind than when ahead, with all other things equal

25
Some players will thrive in one system but falter in another, independent of the quality of
their teammates. In addition, けgarbage timeげ minutes に the final minutes of a game which has
a clear winner に are likely different from the possessions at the end of a game in which the
win is determined by the final possession or last shot. Yet in this system, all contributions on
each possession are weighted evenly.49
The second issue is that collinearity occurs in this data because of the way coaches use
rotations. Some players may only be subbed in or out of the game together. In the extreme,
consider if two players play every possession together in a season except one, in which the
team scores two points (efficiency = 200 points per 100 possessions), so the player on court
at the time would be rated +200 over the other player on offense. Assuming that after
accounting for all the other possessions and contributions from other players their offensive
contributions must sum to zero, then one player gets +100 points over average and the other
gets -100 points below average, despite having markedly similar seasons. A second case is
when two players are only substituted for each other. When this is the case, we only really
can detect how they relate to each other, not how the two of them relate to their teammates.
If a team is overall +8, we cannot tell if the center (the position occupied solely by two players)
is +10 and the team is -2, or vice-versa, without any possessions during which the center is
not on the court. Furthermore, the numbers that are returned are subject to the vagaries and
wild noise of the few minutes when neither center is playing (Myers, 2011).
49 There is significant philosophical debate in the APBRmetrics community as to whether to weight possessions
SキaaWヴWミデノ┞ SWヮWミSキミェ ラミ デエWキヴ キマヮラヴデ;ミIWく Iデ キゲ I┌ヴヴWミデノ┞ ;ヴェ┌WS デエ;デ ┘W I;ミミラデ キミaWヴ デエW ;┗Wヴ;ェW ヮノ;┞Wヴげゲ Waaラヴデ level if their team has a 50% chance of winning relative to a 95% chance relative to a 5% chance, and so we
should just treat effort as constant and weight all possessions equally. In contrast to this, Michael Beuoy of
inpredictable.com has created a performance metric called Win Probability Added (WPA) which weights
possessions by their probability of altering the final result (Beuoy, 2014). However, it has come under heavy
criticism as performance is largely being determined by a few plays in close games late in the fourth quarter and
デエ┌ゲ キゲ ┌ノデキマ;デWノ┞ ┌ミヴWヮヴWゲWミデ;デキ┗W ラa ; ヮノ;┞Wヴげゲ デヴ┌W ゲW;ゲラミ;ノ ヮWヴaラヴマ;ミIW

26
This occurrence is fairly common at the center position, which relatively few humans
can play owing to a shortage of seven-foot tall people in the world. Consider, for example,
the 2009-2010 Orlando Magic team, with Dwight Howard and Marcin Gortat botエ ヶげヱヱざ ;ミS
both playing center. Any Magic lineup which played for more than 13 minutes all season
contained exactly one of Gortat, a solid back-up who may have started for some teams, and
Howard, an MVP candidate and likely the best center in the game that season. Pure adjusted
plus-minus50 considered Gortat to be 13.73 points above average per two hundred
possessions, which would be a runaway MVP performance if true most years, with Howard
also overvalued at +24.97 (Myers, 2011). In reality, Gortat was likely around league average
or slightly below and Howard was 11 points better than him, right around a typical MVP
performance, but collinearity conspired to paint the two as gods surrounded by a team of
ゲキェミキaキI;ミデノ┞ HWノラ┘ ヴWヮノ;IWマWミデ ノW┗Wノ ミWげWヴ-do-wells.
The final and most significant issue is that さデエW ゲ;マヮノW ゲキ┣W ┘キデエキミ ラミW ゲW;ゲラミ キゲ ミラデ
enouェエ aラヴ ゲデ;Hキノキデ┞ざ ふM┞Wヴゲが ヲヰヱヱぶく Tエ┌ゲが it is an incredibly noisy statistic with large standard
errors on individuals, even within an 82 game season and roughly 200 possessions per game.
Ken PラマWヴラ┞げゲ ゲキマヮノW ゲキマ┌ノ;デキラミ demonstrates this effect. He created a hypothetical player
who has absolutely no impact on the game, with defined probabilities of scoring on each
possession as the same for both teams with these probabilities unchanged whether the player
is in the game or on the bench (Pomeroy, 2011). He then simulated a shortened season of
twenty games and tallied his non-キマヮ;Iデa┌ノ ヮノ;┞Wヴげゲ ヮノ┌ゲ-minus. On average, and in a situation
┘エWヴW ラミW SラWゲ ミラデ ミWWS デラ ;IIラ┌ミデ aラヴ デW;ママ;デWゲ ;ゲ デエW┞ ;ヴW Iラミゲデ;ミデゲが デエW ヮノ;┞Wヴげゲ
average per game plus-minus was 4.8 points51 ;┘;┞ aヴラマ ┣Wヴラが SWゲヮキデW デエWヴW HWキミェ さ┗Wヴ┞ aW┘
50 Not containing any of the adjustments later described in xRAPM 51 This overstates the effect, as some of the noise would reduce over a 82-game season

27
players in the country who, if they got hurt, would move the Vegas line for their team by more
than a couple of ヮラキミデゲざ ふPラマWヴラ┞, 2011).
Though various stabilization techniques can be used to correct for this excessive noise,
it is ultimately very difficult to use adjusted plus-minus alone to draw meaningful conclusions
;Hラ┌デ ;ミ キミSキ┗キS┌;ノ ヮノ;┞Wヴげゲ ヮWヴaラヴマ;ミIW キミ ; ゲキミェノW ゲW;ゲラミく Hラ┘W┗Wヴが キミ Wゲデキマ;デキミェ デエW
contract year effect, we are concerned with evaluating performance in aggregate. If we
assume that errors in measuring performance are independent of being in a contract year,
then we can potentially still draw conclusions. Pure adjusted plus-minus is still far too noisy,
given the size of my dataset, but I will use two stabilized versions in my analysis.
The first is again derived aヴラマ デエW Hラ┝ ゲIラヴWく Kミラ┘ミ ;ゲ けゲtatistical plus-mキミ┌ゲげ ふ“PMぶが
this approach places linear weights on observed outcomes to estimate adjusted plus-minus
as the dependent variable. This estimate is much more consistent than the underlying
variable from year to year, and improves identifying performance over other box score
derived metrics described above (Paine, 2011). D;ミキWノ M┞Wヴゲげ ヴWIWミデノ┞ IヴW;デWS けHラ┝ ヮlus-
mキミ┌ゲげ ふBPMぶ キゲ デエW HWゲデ of this category of metrics for three reasons. Firstly, he was extremely
I;ヴWa┌ノ キミ エラ┘ エW ゲWデ ┌ヮ エキゲ マラSWノが ┘エキIエ デエラ┌ェエ キデ さノW;ミゲ デラ┘;ヴS デエW WマヮキヴキI;ノ ゲキSWざが キゲ
grounded in theory and goes further than its competitors as a couple of nonlinear interactions
are modelled, which are highly statistically significant and make sense (Myers, 2015).
“WIラミSノ┞が デエW ゲ;マヮノW Sヴ;┘ゲ ラミ け;S┗;ミIWS Hラ┝ ゲIラヴWげ マW;ゲ┌ヴWゲ ヴ;デエWヴ デエ;ミ, for example,
simple points scored and field goals attempted, which are more accurate and less skewed by
context. Finally, his underlying sample is both better stabilized and covers a longer period of

28
time than any other statistical plus-minus approach.52 The results53 are likely the best single
ゲW;ゲラミ Wゲデキマ;デW ラa ; ヮノ;┞Wヴげゲ ヮWヴaラヴマ;ミIW, and in particular solve the collinearity issue.
TエW ゲWIラミS ┗Wヴゲキラミ I ┘キノノ ┌ゲW キミ マ┞ ;ミ;ノ┞ゲキゲ キゲ EミェWノマ;ミミげゲ ┝‘APM. His basic approach
to stabilization is to produce a prior estimate of performance for each player, and then
subsequently update that number given the observed adjusted plus-minus into a posterior
Wゲデキマ;デW ラa ; ヮノ;┞Wヴげゲ IラミデヴキH┌デキラミ aラヴ デエW ゲW;ゲラミく Tエキゲ B;┞Wゲキ;ミ デWIエミキケ┌W could be as easy
as assuming as a prior that every player has an average rating of 0.0, and then regressing each
player to this mean by ; IWヴデ;キミ ミ┌マHWヴ ラa マキミ┌デWゲく EミェWノマ;ミミげゲ more complex approach to
forming a prior is threefold: エキゲ aラヴマ┌ノ; IラミゲキSWヴゲ デエキゲ ゲW;ゲラミげゲ ゲデ;デキゲデキI;ノ ヮノ┌ゲ-minus, using
ゲラマW ┗;ヴキ;ミデ ラa M┞Wヴゲげ ミ┌マHWヴき ; ヮノ;┞Wヴげゲ ;ェWき ;ミS デエW ヮヴW┗キラ┌ゲ ┞W;ヴげゲ ┝‘APMく TエW ┘Wキェエデキミェ
on these numbers is a function of both age itself and the minutes played this season and last.
B┞ ┌ゲキミェ ノ;ゲデ ┞W;ヴげゲ ┝‘APMが エW キゲ キマヮノキIキデノ┞ ┌ゲキミェ ┝‘APM aヴラマ デエW ┞W;ヴ HWaラヴWが ;ミS ゲラ ラミ ;ミS
so forth. Engelmann recursively solves his system of equations over multiple previous seasons
to determine his final results, and his method of posterior estimation takes advantage of a
mathematical method known as Tikhonov Regularization. Usually, the extent of regression
towards the prior is based off how many minutes were played this season and how that
compares to the last few seasons, informing the confidence of the prior. Tikhonov
Regularization adds a penalty factor for observed outcomes which are very dissimilar to the
prior, adding more weight to the prior if the observed number is very far away, with the
optimal penalty factor chosen by k-fold cross validation.
52 Myers uses an unweighted 14-year sample from 2001-ヲヰヱヴ ラa JWヴWマキ;ゲげ EミェWノマ;ミミげゲ けE┝ヮWIデWS ‘Wェ┌ノ;ヴキ┣WS Adjusted Plus-Mキミ┌ゲげ (xRAPM), as will be described in the following paragraph, as the basis of the regression 53 AヮヮWミSキ┝ ン Iラミデ;キミゲ デエW aヴ;マW┘ラヴニ ラa M┞Wヴゲげ ;ヮヮヴラ┝キマ;デキラミ デラ ヮノ┌ゲ-minus and shows his estimated
coefficients

29
EミェWノマ;ミミげゲ マWデエラS キゲ デエW HWゲデ ヮ┌HノキIノ┞ ;┗;キノ;HノW マWデエラS ラa ゲデ;Hキノキ┣キミェ デエW ヮ┌ヴW
adjusted plus-マキミ┌ゲ S;デ;が ;ミS デエ┌ゲ ヮヴラH;Hノ┞ デエW HWゲデ Wゲデキマ;デキラミ ラa ;ミ キミSキ┗キS┌;ノげゲ ヮ┌ヴW
performance in an individual season, but there are two major concerns. It is still significantly
noisier than statistical plus-minus and the linear systems, and secondly, it is arguable that it
is ill-suited to estimate the contract year effect. Contract years are more likely to occur on the
downslope of the aging curve,54 ;ミS ェキ┗Wミ デエ;デ ; ノ;ヴェW ヮ;ヴデ ラa ; ヮノ;┞Wヴげゲ ヮヴキラヴ キゲ エキゲ ヮヴW┗キラ┌ゲ
season xRAPM adjusted for age, he is expected to perform worse than last year in most
contract years. Because of the penalty factor, xRAPM is more skeptical of increases over
expected performance に as one would see in a contract year に than of decreases as some level
of diminished performance is expected. Hence, in this manner, estimates could be biased
downwards.
This section serves to formali┣W デエ;デ デエWヴW キゲ ミラ けエラノ┞ ェヴ;キノ,げ ;ノノ-in-one statistic to
measure overall player performance as there is in baseball. Acknowledging this limitation, it
is best to proceed consider a variety of all possible approaches. This paper will analyze the
best regression-H;ゲWS ノキミW;ヴ ┘Wキェエデゲ ゲ┞ゲデWマが HラノノキミェWヴげゲ PER; the best theoretical-based
linear weightゲ ゲ┞ゲデWマが K┌H;デニラ ;ミS Oノキ┗Wヴげゲ ┘キミ ゲhares (WS);55 the best statistical plus-minus,
M┞Wヴゲげ Hラ┝ ヮlus-minus (BPM); and the best stabilized adjusted plus-マキミ┌ゲが EミェWノマ;ミミげゲ
xRAPM. All of these metrics are relative to league average and have both an efficiency (value
produced per minute on average in a season) and volume (total value produced in a season)
component. Estimated Wins Added (EWA), Statistical Wins Above Replacement (SWAR) and
Wins Above Replacement (WAR) are the volume corollaries to PER, BPM and xRAPM
54 Players are more likely to receive shorter contracts when past their prime and hence are more likely to be in
contract years (see Table V) 55 Win shares per 48 minutes is the efficiency corollary

30
respectively.56 All efficiency metrics except PER have offensive and defensive components. All
volume metrics are measured in wins, with EWA and WS purporting to be the overall wins
contributed by a player, and SWAR and WAR the wins contributed by a player above
replacement level.57 Only win shares has offensive and defensive volume components, as it is
not reasonable to consider separate offensive and defensive replacement levels for the plus-
minus statistic and PER has no separate defensive component.58 BPM and xRAPM are
measured in points above or below average per 200 possessions, while their offensive and
defensive components are measured over 100 possessions on that end of the court. For all
these metrics, Tables II and III contains summary statistics for the NBA from 2005-2014 for all
player-seasons in that timeframe, not just those in my sample. Take note that performance
can be considered to be negative, if the performance of a player is such that he takes away
from a teamげs ability to win, relative to a replacement level player (which is defined at
different levels by the metrics).
All data on PER, win shares and statistical plus-minus was taken from the databases at
Basketball-Reference.com, as was any other box score information and background
information used in Section IV.59 All xRAPM-ヴWノ;デWS キミaラ ┘;ゲ デ;ニWミ aヴラマ EミェWノマ;ミミげゲ ┘WHゲキデW
at stats-for-the-nba.appspot.com.
None of these measures of performance in isolation provide a wholly accurate
SWゲIヴキヮデキラミ ラa ; ヮノ;┞Wヴげゲ ラ┗Wヴ;ノノ IラミデヴキH┌デキラミゲ デラ エキゲ デW;マが ラヴ ;ミ┞デエキミェ ;ニキミ デラ WA‘ キミ H;ゲWH;ノノく
56 Appendices 1-3 contain the formula for converting the efficiency metrics into volume metrics 57 Replacement level, as outlined in footnote 32, has come to be defined after much debate as -2.0 points below
average per 200 possessions (100 offensive and 100 defensive) in the NBA (Tango, 2014) 58 In basketball, some players are primarily offensive in nature and some are primarily defensive and this varies
┘キデエ ヮラゲキデキラミく Fラヴ W┝;マヮノWが ;ノマラゲデ ;ノノ ヮラキミデ ェ┌;ヴSゲ ┘ラ┌ノS HW HWノラ┘ けSWaWミゲキ┗W ヴWヮノ;IWマWミデ ノW┗Wノげ ;ミS ;ノマラゲデ ;ノノ IWミデWヴゲ ┘ラ┌ノS HW HWノラ┘ けラaaWミゲキ┗W ヴWヮノ;IWマWミデ ノW┗Wノげく OミW Iラ┌ノS IラミIWキ┗;Hノ┞ ;ノデWヴ ヴWヮノ;IWマWミデ ノW┗Wノ H;ゲWS ┘キth
position as is done in baseball analysis, but positions in the NBA are nowhere near as well defined as in baseball.
The upshot is that it is currently thought to be of little value to consider offensive and defensive replacement
levels separately (Tango, 2014) 59 Fラヴ W┝;マヮノWが ; ヮノ;┞Wヴげゲ エWキェエデが ┘Wキェエデが ;ェW ;ミS ゲラ aラヴデエ

31
However, when taken together as a group, performance is measured more broadly from
various different angles, and we start to get closer to an objective view of performance.
Basketball analytics is still very much in its infancy and as the field progresses and new and
more precise performance metrics are produced, the methodology outlined in the next
section will only produce more precise results.

32
Table II: Summary Statistics for Efficiency Metrics
Metrics Mean Standard
Deviation
5th
Percentile
25th
Percentile
50th
Percentile
75th
Percentile
95th
Percentile
Player Efficiency
Rating 3.85 6.14 4.1 9.8 12.8 15.9 21.3
Win Shares per 48
Minutes 0.073 0.096 -0.049 0.037 0.080 0.121 0.179
Statistical Plus-Minus
(SPM) -1.75 3.89 -7.7 -3.5 -1.4 0.5 3.4
xRAPM -0.96 2.54 -4.3 -2.6 -1.5 0.3 3.9
Offensive Win Shares
per 48 Minutes 0.025 0.085 -0.085 0.000 0.033 0.067 0.118
Defensive Win Shares
per 48 Minutes 0.046 0.026 0.000 0.030 0.046 0.064 0.090
Offensive SPM -1.42 3.29 -6.3 -3.0 -1.3 0.5 3.0
Defensive SPM -0.33 1.88 -3.1 -1.5 -0.3 0.8 2.6
Offensive xRAPM -0.61 1.92 -3.4 -1.8 -0.9 0.3 2.9
Defensive xRAPM -0.34 1.82 -2.8 -1.5 -0.7 0.6 3.2
Source: Basketball-Reference.com & stats-for-the-nba.appspot.com. Sample includes all player-seasons from 2005-2014

33
Table III: Summary Statistics for Volume Metrics
Metrics Mean Standard
Deviation
5th
Percentile
25th
Percentile
50th
Percentile
75th
Percentile
95th
Percentile
Estimated Wins Added 2.69 4.59 -1.2 -0.1 0.9 4.0 12.2
Win Shares 2.75 3.08 -0.2 0.3 1.8 4.3 9.0
Statistical Wins Above
Replacement 1.76 3.55 -1.4 -0.3 0.3 3.0 8.6
Wins Above
Replacement 1.82 3.82 -1.5 -0.2 0.2 2.8 10.1
Offensive Win Shares 1.43 2.15 -0.5 0.0 0.7 2.3 5.7
Defensive Win Shares 1.32 1.24 0.0 0.3 1.0 2.0 3.8
Source: Basketball-Reference.com & stats-for-the-nba.appspot.com. Sample includes all player-seasons from 2005-2014. Volume metrics for the 2011-12 season are
prorated to 82 games.

34
IV. METHODOLOGY & RESULTS
My baseline attempt to estimate the true effect of being in a contract year, relative to
being in a non-contract year as now rigorously defined, was to use a player fixed-effects
model within a two-stage least squares instrumental variables framework, as follows (see
footnote for details of variables).60 系桁沈痛 噺 肯沈 髪 講 ゲ 隙沈痛 髪 酵 ゲ 荊 髪 づ沈痛 (1) 桁沈痛 噺 糠沈 髪 紅 ゲ 隙沈痛 髪 絞系桁沈痛 髪 香沈痛 (2)
Including player fixed effects in this manner led me to duplicate my analysis for both the full
dataset and a reduced sample, which only includes players who had both contract and non-
contract years from 2005-2014. For those not meeting this criterion, the constant player fixed
effects (肯沈,糠沈) account for their permanent contract state during the sample. The reduced
sample contains only 1,458 player-seasons across 276 players of the 1,870 player-seasons
across 439 players in the full sample. Analyzing the reduced sample allows me to perform an
important sensitivity check by modifying my first stage to a probit model as in equation (3),
with 隙王沈痛 as all the independent variables in equation (1) including my instrument. 喧┏ 噺 Pr盤系桁沈痛 噺 な弁隙王沈痛匪 噺 も岫隙王沈痛嫗 ゲ 紘岻 (3)
Subsequently, I use the predicted 喧┏ values as my instrument in equation (1), such that my first
stage residuals are uncorrelated with covariates and fitted values (Wooldridge, 2002, 623-
625). Table III suggests that the shift between the full and reduced samples is not a drastic
change in composition. I calculate W;Iエ ヮノ;┞Wヴげゲ ;┗Wヴ;ェW win shares per 48 minutes from
2005-2014 for all seasons, not just those in my sample. I then categorize the player and his
60 肯沈 and 糠沈 are my fixed effects for player i; 隙沈痛 are the background covariates, as outlined later, for player i in
season t; 系桁沈痛 is a dummy for whether player i is in a contract year in season t; 桁沈痛 is a performance metric for
player i in season t; and 荊 is my instrument described below.

35
player-seasons by his quartile relative to the entire league during this period, not just the
players in my dataset. Under this lens, more player-seasons and players do drop out from the
top and bottom quartiles, but not that much more than from the middle two quartiles. It also
shows that the players in my dataset, composed of veterans who were able to secure
guaranteed contracts, are above average. Table VI provides further insight into the difference
between the full and reduced samples.
Table IV: Comparison of Full and Reduced Samples
Performance
Quartile
Number of Player-Seasons
Full Sample Reduced Sample Change Percent Change
First Quartile 213 166 47 22%
Second Quartile 524 426 98 19%
Third Quartile 735 576 159 22%
Fourth Quartile 398 290 108 27%
Total 1870 1458 412 22%
Performance
Quartile
Number of Players
Full Sample Reduced Sample Change Percent Change
First Quartile 60 37 23 38%
Second Quartile 138 92 46 33%
Third Quartile 159 102 57 36%
Fourth Quartile 82 45 37 45%
Total 439 276 163 37%
Source: Basketball-Reference.com, Spotrac.com & ShamSports.com
Full sample consists of all player-seasons from 2005-2014 which were either contract years or non-contract years. Reduced sample
only kept player-seasons for which player had both a contract and non-contract year from 2005-2014. Refer to text for definitions
of contract states and for definition of performance quartile, which is measured relative to the NBA as a whole, not just my dataset
My background covariates in equations (1) and (2) ;ヴW ; ヮノ;┞Wヴげゲ ;ェW ;ミS ;ェW ゲケ┌;ヴWS
in that season to allow for convexity, centered around the sample mean to reduce collinearity;

36
his height and weight, treated as constants over his career as there is no annual measuring in
the NBA; dummies for position, as defined by Basketball-Reference.com for each player-
season; and finally team quality.61
This framework vastly improves over an ordinary least squares approach, as it can
identify the causal effect of being in a contract year, taking into account the inherent
endogeneity of being in a contract year. Worse players get shorter contracts and hence have
a higher probability of being in a contract year. Table V clearly demonstrates this endogeneity
(results are very similar for the reduced sample), and ignoring it and simply comparing means
as in Table VI would lead us to incorrectly conclude in a negative contract year effect.
The constant player fixed effects attempt to be a proxy for unobserved player quality,
assumed within the model to be constant over the course of the timeframe of the dataset
after controlling for age, position, height, and weight. Given this approach, I require an
キミゲデヴ┌マWミデ デエ;デ ;aaWIデゲ ; ヮノ;┞Wヴげゲ ヮヴラH;Hキノキデ┞ ラa HWキミェ キミ ; Iラミデヴ;Iデ ┞W;ヴ ┘キデエラ┌デ HWキミェ
correlated with performance. Fortunately, I can take advantage of exogenous shifts in the
league structure, such that the former is affected independent of player quality. As shown in
Figure I, the percentage of the total proportion of NBA players in a contract year varies
substantially over the timeframe.
61 Team quality was calculated thusly: Iマヮヴラ┗キミェ ラミ G;aa;ミW┞げゲ Iヴ┌SW ┌ゲW ラa デW;マ ┘キミゲ ;ゲ ; マW;ゲ┌ヴW ラa ケ┌;ノキデ┞が ; デW;マげゲ ゲキマヮノW ヴ;デキミェ ふ“‘“ぶ ┘;ゲ ┌ゲWS キミゲデW;Sく “‘“ キゲ ; デW;マげゲ ;┗Wヴ;ェW ヮラキミデ SキaaWヴWミデキ;ノ ラミ ; ミW┌デヴ;ノ aノララヴ ラ┗Wヴ the course of a season. Crucially, unlike pure wins, it is adjusted for strength of schedule. If a player played three
quarters of his minutes for one team and a quarter for another, then he was given the average of those two
teams for that season, weighted by the minutes played, with this process repeated for any player who played
for greater than one team in a given season. In addition using team dummies for each of the 30 franchises, to
ヮラデWミデキ;ノノ┞ ヮキIニ ┌ヮ ; デW;マげゲ けェララS I┌ノデ┌ヴWげ HW┞ラミS テ┌ゲデ ケ┌;ノキデ┞ キミ デエ;デ ェキ┗Wミ ゲW;ゲラミが a;キノWS デラ ヮ;ゲゲ ;ミ W┝デヴ;-sum-
of-squares F-test for either the first or second stage in equations (1) and (2), with p-values returned in excess of
0.4. Hence they were excluded from the specification. All upcoming results, including team dummies are
reported in Appendix 5 as a sensitivity check.

37
Table V: Correlation with Contract Year Dummy
PER -0.2485
WS/48 -0.1784
SPM -0.2186
xRAPM -0.2461
Team Quality -0.0526
Age 0.2197
Height -0.0216
Weight -0.0135
Point Guard 0.0243
Shooting Guard -0.0197
Small Forward 0.0091
Power Forward 0.0088
Center -0.023
Source: Basketball-Reference.com, ShamSports.com, Spotrac.com & stats-for-the-nba.appspot.com
Results shown are for full sample of 1870 player-seasons from 2005-2014 which were either contract years or
non-contract years. Refer to text for definitions of these, and for description of performance metrics. Team
quality is measured by a team's SRS, as outlined in footnote 61. Positional designations for players are from
Basketball-Reference.com
Figure I: Percentage of NBA Players in a Contract Year from 2005-2014
51
01
52
02
5
05-06 06-07 07-08 08-09 09-10 10-11 11-12 12-13 13-14Season
Source: Basketball-Reference.com, ShamSports.com & Spotrac.com
Note: Shows the proportion of players in the NBA in a contract year, as defined in the text, for all seasons
from 2005-2006 to 2013-2014

38
Table VI: Summary Statistics
Comparison of Means by Contract Year Status
Efficiency Metrics Full Reduced
Non-CY CY Non-CY CY
Player Efficiency Rating 14.8 12.1 14.4 12.3
(0.133) (0.196) (0.145) (0.216)
Win Shares/48 (WS/48) 0.102 0.0768 0.0994 0.0791
(0.00182) (0.00257) (0.00183) (0.0028)
Statistical Plus-Minus
(SPM)
-0.0892 -1.56 -0.198 -1.43
(0.0827) (0.129) (0.0902) (0.142)
xRAPM 0.335 -1.176 0.189 -0.999
(0.0782) (0.0103) (0.0885) (0.115)
Offensive WS/48 0.0508 0.0262 0.0486 0.0286
(0.0262) (0.00269) (0.00162) (0.00295)
Defensive WS/48 0.0512 0.0492 0.0507 0.0493
(0.000687) (0.000973) (0.000787) (0.00106)
Offensive SPM -0.173 -1.431 -0.254 -1.34
(0.0712) (0.111) (0.0775) (0.123)
Defensive SPM 0.0833 -0.135 0.0549 -0.0946
(0.0485) (0.0704) (0.0548) (0.0764)
Offensive xRAPM 0.0869 -0.960 -0.0328 -0.861
(0.0626) (0.0794) (0.0698) (0.088)
Defensive xRAPM 0.248 -0.214 0.222 -0.136
(0.0583) (0.0795) (0.0674) (0.0876)
Volume Metrics Full Reduced
Non-CY CY Non-CY CY
Estimated Wins Added 4.70 1.90 4.34 2.13
(0.153) (0.158) (0.166) (0.179)
Win Shares (WS) 4.37 2.46 4.23 2.65
(0.0943) (0.110) (0.103) (0.122)
Statistical Wins Above
Replacement
3.41 1.36 3.20 1.57
(0.117) (0.120) (0.123) (0.135)
Wins Above Replacement 3.70 1.37 3.48 1.62
(0.130) (0.141) (0.145) (0.159)
Offensive WS 2.41 1.20 2.30 1.33
(0.0686) (0.0783) (0.0738) (0.0880)
Defensive WS 1.96 1.26 1.93 1.32
(0.0383) (0.0440) (0.0436) (0.0492) Source: Basketball-Reference.com, ShamSports.com, Spotrac.com & stats-for-the-nba.appspot.com
Results for both full and reduced samples, as defined in text, from 2005-2014. Refer to text for definitions of contract
year, and for descriptions of performance metrics. All volume metrics from 2011-12 season are prorated to an 82-
game season.

39
The 2005 Collective Bargaining Agreement (CBA) had a drastic impact on the contract
landscape of the NBA. Because the penalty for cutting players became much harsher in the
aftermath, substantially increasing the opportunity cost, the length of new contracts was
reduced, as the cost of an overpriced, long contract was greater. Extensions became
exceedingly rare, resulting in more players completing their contracts and thereby entering
contract years, as well as a reduction in the maximum length of contracts as outlined earlier,
;ノゲラ ヮヴラS┌Iキミェ マラヴW Iラミデヴ;Iデ ┞W;ヴゲく Tエキゲ ヴキゲW IラキミIキSWS ┘キデエ デエW キミデヴラS┌Iデキラミ ラa けマラミW┞H;ノノげ
into basketball as analytics began to take hold in front offices (Lewis, 2009).62 Relative to the
more traditional approach, analytics has tended to preach caution with handing out long
contracts, given the associated increased risk of injury or reduced performance with long
contracts.
These effects explain the steady increase in the number of contract years from 2005-
2006 to 2008-2009. But the jump in 2009-2010 springs from the institution of standardized
first round rookie contracts. By making these contracts four years in length until restricted
free agency に five years until unrestricted free agency, with nuances as described earlier に we
see a lagged effect from the 2005 CBA, with a huge jump after the 2005 NBA draftees begin
to enter unrestricted free agency from their second contracts. The market also quickly
adjusted to provide second round contracts of similar length, leading to the situation
described earlier. This was compounded by a greater number of shorter contracts signed from
2005-2009 than previously, but that too came in steadily with a lag. This lag was the result of
formerly optimistic very long contracts, signed under the 1999 CBA, which were deadweight
on NBA rosters post-2005, and those toxic contracts took time to clear as only a few could be
62 A ノ;ミSマ;ヴニ マラマWミデ ┘;ゲ デエW Hラ┌ゲデラミ ‘ラIニWデゲげ エキヴキミェ ラa D;ヴ┞ノ MラヴW┞ ;ゲ デエW aキヴゲデ ヮ┌ヴW ゲデ;デキゲデician to be a
general manager in May 2007

40
amnestied. These lagged effects explain some of the leap, but to explain the boom of 2009-
ヲヰヱヰ ┘W ミWWS デラ IラミゲキSWヴ デエW けLWBヴラミ WaaWIデげく
A generational talent, LeBron James signposted his decision to turn down his player
option and enter free agency during the 2010 offseason well in advance. To give an idea of
デエW キマヮ;Iデ ラa エキゲ IエラキIWが ミW;ヴノ┞ ヱヰ マキノノキラミ ┗キW┘Wヴゲ ┘;デIエWS E“PNげゲ ;キヴキミェ ラa けTエW DWIキゲキラミげ ノキ┗W
に more viewers than almost any single playoff game (Nielsen, 2010). Irrespective of the team
エW IエラゲWが J;マWゲげ SWIキゲキラミ ┘ラ┌ノS Sヴ;マ;デキI;ノノ┞ ゲエキaデ デエW H;ノ;ミIW ラa ヮラ┘Wヴ キミ デエW NBAが ;ゲ エキゲ
new team would almost by default be the perennial title favorite.63 As this occasion was
telegraphed in advance, many free agents timed their previous contract to coincide with
J;マWゲげ ;ミミラ┌ミIWマWミデが with the idea of capitalizing on the resulting mass musical chairs and
securing ; ヮノ;IW ラミ J;マWゲげ ミW┘ デW;マく Tエキゲ WaaWIデ デrickled down throughout all strata of the
league, as everyone wanted to join the self-ヮヴラIノ;キマWS けKキミェげく TエW ヴWゲ┌ノデ ┘;ゲ ; さaヴWW ;ェWミデ
Iノ;ゲゲ ぐ デエ;デ ┘ラ┌ノS ;ノデWヴ デエW a;IW ラa デエW ノW;ェ┌W aラヴ ; SWI;SW デラ IラマWざ ふCキゲIWノノが ヲヰヱンぶく H┞ヮWヴHラノW
;ゲキSWが デエW けLWBヴラミ WaaWIデげ W┝ヮノ;キミゲ デエW マ;ゲゲキ┗W テ┌マヮ キミ Iラミデヴ;Iデ ┞W;ヴゲ キミ ヲヰヰΓ-2010.
The small decreases in the past two seasons are counterintuitively explained by the
2011 CBA, and by the upcoming explosion of the salary cap (Lowe, 2014(a)). Although the
2011 CBA made contracts even shorter, it also decreased the number of contract years, by
キミIヴW;ゲキミェ デエW ミ┌マHWヴ ラa ラヮデキラミ Iラミデヴ;Iデゲ ;ミS デエ┌ゲ ヴWS┌Iキミェ デエW ミ┌マHWヴ ラa けヮ┌ヴWげ Iラミデヴ;Iデ
┞W;ヴゲ ;ミS けヮ┌ヴWげ ミラミ-contract years. In essence, while the 2005 CBA changed three and four
year contracts into two and three year contracts, the 2011 CBA changed two and three year
contracts into one and two year contracts with options on a second and third year,
respectively. The salary cap explosion is tied to the huge new television deal the NBA signed
63 “キミIW デエW マラ┗Wが J;マWゲげ デW;マ エ;ゲ ;ノ┘;┞ゲ HWWミ デエW ヮヴWゲW;ゲラミ a;┗ラヴキデWゲ デラ ┘キミ デエW デキデノW aラヴ aキ┗W ゲデヴ;キェエデ seasons
41
with ESPN and TNT. Though only signed in October 2014, it was known far in advance that the
money received from the networks would be significantly greater than under the previous
deal. The deal comes into effect after the 2015-2016 season when the cap will explode from
$63 million to over $90 million (Lowe, 2014(a)).64 Operating under this knowledge that the
cap would escalate dramatically when the current television deal expires, teams have been
signing some players to longer deals, willing to stomach the additional risk as those deals will
look extremely cheap when the cap is 50% larger.
O┌デゲキSW ラa Iエ;ミェキミェ デエW ノW;ェ┌Wげゲ Iラミデヴ;Iデ ノ;ミSゲI;ヮWが ラデエWヴ ヮラデWミデキ;ノ avenues could
have impacted performance from 2005-2014. Rule changes rendered some players more
useful, others less so; improved conditioning and medical advances made recovery from
injury quicker. In addition, the slow induction of statistics into NBA team management saw
monumental increases in three-point attempts and reductions in midrange two-pointers. Yet,
there is no reason to think that these changes affect players on contract years more or less
than players in non-contract years. Crucially, all of my performance metrics are measured
relative to league average and adjusted for pace. If we use this instrument, our dependent
variable could not just be something simple such as points scored, as the league environment
for scoring points has changed. Similarly, all players benefit from medical advancements, but
; ヮノ;┞Wヴげゲ ヮWヴaラヴマ;ミIW ヴWノ;デキ┗W デラ ノW;ェ┌W average stays constant, even as his absolute
performance may increase.
The two best instruments I find to take advantage of this exogenous variation in
contract years with seasons are firstly, an indicator of whether the season was from the 2009-
10 season on; and secondly, using the number of contract years in the league that season
64To give some context, the cap has risen from $49 million dollars over the last decade. A jump of this
magnitude has never been seen before in any major American sports league

42
divided by the number of players who played at least one minute in the NBA that season as
the indicator itself. Table VII reports Cragg-Donald F-statistic as a test of the strength of the
instruments and the p-value returned from the Hansen-J statistic testing for
overidentification. The first model is relevant at this point, while the latter is relevant later.
Table VII: First Stage Statistics
Model Sample
Instrument
Year Indicator CY Percent Both
F-Stat F-Stat F-Stat P-Value
With Player Fixed
Effects
Full 15.56 13.20 8.06 0.4169
Reduced 13.26 9.97 6.70 0.0236
Without Player
Fixed Effects
Full 34.52 41.90 21.39 0.1700
Reduced 69.71 51.49 34.72 0.0366
Source: Basketball-Reference.com, ShamSports.com & Spotrac.com
Full and reduced samples, as defined in text, are from 2005-2014. Table reports key statistics for first stage in instrumental variables
framework, as outlined in equation (1) and (2) in text. F-Stat refers to Cragg-Donald F-Statistic. P-Value is that returned from Hansen-J
statistic as test of overidentification
Using the approximate rule of thumb that the F-statistic should be greater than 10
(Stock, Wright and Yogo, 2002), both of these instruments bear up as sufficiently strong
identifiers of being in a contract year. Player fixed effects have a dramatic impact on the
strength of the instruments, because many players only appear once or twice in the dataset.
Within my dataset, knowing only the name of a player thereby provides enormous insight
into his contract year status. Using both instruments together may be a case of
overidentifying, and my instruments are certainly correlated, but the extremely strong
rejection of the null for the reduced sample is likely a statistical fluke attached to the
weakness of the instrument, given the inability to reject the null for the full sample. Estimates
using all three instrument approaches are thus included.
Table VIII reports the estimates for delta in equation (2) for ordinary least squares,
and using equation (1) as a first stage for all three instrument approaches, for the full sample.
Table IX repeats these estimates for the reduced sample, and includes estimates with the
fitted probabilities from equation (3), formed from the respective instruments, as the
43
instrument in equation (1). All standard errors are calculated robust to heteroskedasticity and
are clustered by player for each table.
The results are undeniably muddled. My instruments likely do not idenデキa┞ ; ヮノ;┞Wヴげゲ
contract status sufficiently well, resulting in extremely large standard errors.65 It is extremely
telling that when using the probit approach for the first stage in Table VIII に which does a
significantly better job of bounding the fitted value passed to the second stage に my standard
errors shrink substantially. This suggests that the large standard errors for IV estimates in
Tables VIII and IX are the result of outlying fitted values outside the bounds of zero and one.
The negative and significant estimate shown for xRAPM is unlikely to be indicative of
;ミ ;S┗WヴゲW Iラミデヴ;Iデ ┞W;ヴ WaaWIデく Ia HWキミェ キミ ; Iラミデヴ;Iデ ┞W;ヴ SキS ミWェ;デキ┗Wノ┞ ;aaWIデ ; ヮノ;┞Wヴげゲ
xRAPM, we would heavily expect it to affect his statistical plus-minus too, but that effect is
considerably more muted and insignificant. This implies that the result is more likely due to
both the significant noise in measuring performance inherent to xRAPM, and the mechanism
SWゲIヴキHWS W;ヴノキWヴ H┞ ┘エキIエ ┝‘APMげゲ マWデエラSラノラェ┞ キゲ ミWェ;デキ┗Wノ┞ Hキ;ゲWS ;ェ;キnst measuring
contract year impact. The significance also disappears for the probit model, and indeed, the
sign of the estimate changes for SPM estimates, making it extremely unlikely the effect on
xRAPM is truly negative.
65 Many studies in basketball arbitrarily cut off player-seasons under a certain minutes restriction, as they argue
that the noise in measuring performance is too great unless enough minutes have been played. However, given
the observed effect in baseball that players play more during a contract year (Perry, 2006), it is not clear that a
cutoff is necessary or appropriate to this study. Nevertheless, all results are reported in Appendix 6 with only
player-seasons of over 200 minutes included

44
Table VIII: Contract Year Effect Estimates for Full Sample
TSLS Estimates of Delta
Efficiency Metric OLS
Instrument
2010
Indicator CY Percent Both
Player Efficiency Rating 0.124 -0.857 -2.57 -1.35
(0.215) (1.617) (1.96) (1.61)
Win Shares per 48 Minutes 0.00319 0.00485 -0.00757 0.00125
(0.00310) (0.0243) (0.0274) (0.0237)
Statistical Plus-Minus (SPM) -0.0420 0.334 -1.46 -0.186
(0.151) (1.08) (1.31) (1.06)
Expected Regularized Adjusted
Plus-Minus (xRAPM)
-0.0411 -2.28* -3.85** -2.74*
(0.108) (1.01) (1.47) (1.08)
Offensive Win Shares per 48
Minutes
-0.000221 0.00649 -0.00913 0.00196
(0.00333) (0.0246) (0.0282) (0.0245)
Defensive Win Shares per 48
Minutes
0.00202 0.00937 0.00418 0.00786
(0.000963) (0.00804) (0.00903) (0.00792)
Offensive SPM -0.0629 -0.1740 -1.43 -0.540
(0.127) (0.944) (1.14) (0.941)
Defensive SPM 0.0213 0.526 -0.0116 0.370
(0.0609) (0.486) (0.537) (0.463)
Offensive xRAPM 0.0216 -1.57* -2.72* -1.90*
(0.0827) (0.766) (1.12) (0.823)
Defensive xRAPM -0.0643 -0.698 -1.09 -0.811
(0.0668) (0.544) (0.688) (0.558)
Volume Metric OLS
Instrument
2010
Indicator CY Percent Both
Estimated Wins Added 0.313 0.0587 -0.905 -0.221
(0.194) (1.55) (1.85) (1.54)
Win Shares 0.0902 -0.00349 -0.560 -0.165
(0.136) (1.08) (1.27) (1.07)
Statistical Wins Above
Replacement
0.156 -0.0845 -0.718 -0.268
(0.147) (1.25) (1.52) (1.25)
Wins Above Replacement 0.107 -1.847 -3.10 -2.21
(0.169) (1.445) (1.94) (1.50)
Offensive Win Shares 0.124 -0.0721 -0.419 -0.173
(0.106) (0.829) (0.980) (0.826)
Defensive Win Shares -0.0382 0.0879 -0.998 0.0335
(0.0536) (0.463) (0.541) (0.457)
* p < 0.05; ** p < 0.01; *** p < 0.001. Standard errors are in parentheses
Source: Basketball-Reference.com, ShamSports.com, Spotrac.com & stats-for-the-nba.appspot.com.
Full sample contains all 1870 player-seasons which were contract or non-contract years, as defined in the text, across 439 players from
2005-2014. Performance metrics and instruments used are described in the text. IV framework corresponds to equations (1) and (2) in the
text. All standard errors were calculated robust to heteroskedasticity and were clustered by player

45
Table IX: Contract Year Effect Estimates for Reduced Sample
Estimates of Delta
Efficiency Metric OLS TSLS Probit First Stage
(1) (2) (3) (4) (5) (6) (7)
PER 0.163 -0.888 -3.60 -1.31 -0.773 -1.56 -1.14
(0.208) (1.57) (2.27) (1.59) (1.03) (1.00) (1.00)
WS/48 0.00344 0.00522 -0.0269 0.000167 0.00529 -0.00425 0.000800
(0.00302) (0.0232) (0.0305) (0.0233) (0.0148) (0.0144) (0.0145)
SPM -0.0296 -0.0157 -2.01 -0.329 -0.0947 -0.683 -0.365
(0.147) (1.06) (1.49) (1.06) (0.670) (0.687) (0.661)
xRAPM -0.00613 -2.33* -4.08* -2.60* -0.564 -0.830 -0.756
(0.104) (1.03) (1.67) (1.08) (0.561) (0.562) (0.556)
Offensive WS/48 0.000389 0.00118
-
0.289000 -0.00354
-
0.000621 -0.00994 -0.00500
(0.00326) (0.0243) (0.031) (0.0244) (0.0153) (0.0152) (0.0151)
Defensive WS/48 0.00195* 0.0089 0.00682 0.00858 0.00846 0.00704 0.00802
(0.000934) (0.00792) (0.00979) (0.00795) (0.00540) (0.00574) (0.00545)
Offensive SPM -0.0447 -0.356 -2.02 -0.618 -0.340 -0.800 -0.557
(0.124) (0.942) (1.32) (0.949) (0.625) (0.628) (0.617)
Defensive SPM 0.0161 0.380 0.03130 0.325 0.281 0.147 0.226
(0.0593) (0.472) (0.587) (0.467) (0.320) (0.341) (0.319)
Offensive xRAPM 0.0450 -1.46 -2.77* -1.67* 0.179 -0.0434 0.0174
(0.0798) (0.754) (1.23) (0.793) (0.531) (0.536) (0.525)
Defensive xRAPM -0.0530 -0.843 -1.25 -0.906 -0.706 -0.742 -0.733
-0.0648 (0.559) (0.772) (0.572) (0.418) (0.434) (0.419)
Volume Metric OLS TSLS Probit First Stage
(1) (2) (3) (4) (5) (6) (7)
EWA 0.311 -0.540 -2.06 -0.780 2.12 2.17 2.020
(0.189) (1.51) (1.99) (1.51) (1.23) (1.23) (1.21)
WS 0.0747 -0.439 -0.027 -0.586 0.295 0.279 0.234
(0.132) (1.06) (1.39) (1.06) (0.717) (0.697) (0.695)
Statistical WAR 0.151 -0.321 -1.41 -0.492 1.93* 2.04* 1.88*
(0.144) (1.18) (1.59) (1.09) (0.888) (0.913) (0.876)
WAR 0.147 -2.23 -3.69 -2.46 1.21 1.35 1.13
(0.165) (1.45) (2.10) (1.48) (0.974) (1.01) (0.969)
Offensive WS 0.119 -0.389 -0.993 -0.484 0.657 0.701 0.622
(0.103) (0.821) (1.06) (0.824) (0.600) (0.592) (0.585)
Defensive WS -0.0486 -0.0482 -0.338 -0.0938 -0.355 -0.404 -0.376
(0.0525) (0.445) (0.583) (0.450) (0.322) (0.336) (0.321) * p < 0.05; ** p < 0.01; *** p < 0.001. Standard errors are in parentheses
Source: Basketball-Reference.com, ShamSports.com, Spotrac.com & stats-for-the-nba.appspot.com.
(1) is OLS estimates based off equation (2). (2), (3), (4) use equations (1) and (2) in a two stage least squares framework; while (5), (6), (7) use fitted
probabilities from equation (3) as the instrument passed to the first stage.(2), (5) use 2010 indicator as the instrument; (3), (6) use the contract year
percent as the instrument; and (4), (7) use both. Full and reduced samples, performance metrics and instruments described in the text. All standard errors
are calculated robust to heteroskedasticity and clustered by player

46
Rather than concluding that there is no contract year effect, it is possible that the true
contract year effect is masked by the poorly identified standard errors. Hence, I present
another approach for correcting for endogeneity bias. Rather than using a player fixed effects
model, instead we can use performance relative to individual expectation as our dependent
variable. P;キミWげゲ ヮヴラテWIデキラミ ゲ┞ゲデWマ Wミ;HノWs one to provide an expectation of ; ヮノ;┞Wヴげゲ
efficiency metrics for the upcoming season, based off past performance and adjusted for age
based off a globalized aging curve (Paine, 2008). It can only be used for efficiency metrics
which have a volume corollary (see Appendix 4 for details).66 This leads to the following basic
framework. 桁沈痛 伐 順岫桁沈痛】桁沈┸痛貸怠┸ 桁沈┸痛貸態┸ 桁沈┸痛貸戴┸ 畦訣結沈痛岻 噺 糠 髪 紅 ゲ 隙沈痛 髪 絞系桁沈痛 髪 香沈痛 (4)
Height, weight, position dummies, and team quality are included to further refine the model
に for example to improve accuracy if the projection systematically underestimates point
guards. BWI;┌ゲW P;キミWげゲ ゲ┞ゲデWマ ;IIラ┌ミデゲ aラヴ ;ェW キミ キデゲ W┝ヮWIデ;デキラミが ┘W Sラ ミラデ ミWIWゲゲ;ヴキノ┞ エ;┗W
to include age as a background covariate. Figure II shows the mean residual for each age group
after running the regression in equation (4), with a 95% confidence interval if age is omitted.67
Iデ ゲエラ┌ノS HW ミラデWS デエ;デ P;キミWげゲ ;ェキミェ ;Sテ┌ゲデマWミデ キゲ ┗Wヴ┞ ゲキマヮノキゲデキI, and though the intervals
would widen substantially and all would contain zero with a multiple comparisons adjustment
(20 group means plotted), the downwards trend is undeniable. It appears that older players
are overly optimistically projected by his system and therefore it is necessary to include an
age covariate in our regression.
66 It cannot project volume metrics as minutes are notoriously difficult to project for a player. It is based off
Tラマ T;ミェラげゲ キミa;マラ┌ゲ けM;ヴIWノ デエW MラミニW┞げ aラヴWI;ゲデキミェ ゲ┞ゲデWマ ;ミS SWゲヮキデW キデゲ ゲキマヮノキIity has held up well
;ェ;キミゲデ PWノデラミげゲ “CHOENE ;ミS ラデエWヴ マラヴW ;S┗;ミIWS ヮヴWSキIデキラミ ゲ┞ゲデWマゲ ふK┌H;デニラが ヲヰヰΓふHぶぶ 67 The performance variable used is win shares per 48 minutes

47
-.1
-.05
0
.05
20 25 30 35 40Age
Figure II: Average Residual by Age for Equation (4)
Source: Basketball-Reference.com, ShamSports.com & Spotrac.com
Note: Shows the average residual and 95% confidence interval, not adjusted for multiple comparisons, for
each age group for equation (4), as outlined in the text, with win shares per 48 minutes over expectation
as the dependent variable. Results are for the full sample of player-seasons, as defined in the text, for all
seasons from 2005-06 to 2013-14
Figure III: Histogram of Average Player Residual for Equation (4)
Source: Basketball-Reference.com, ShamSports.com & Spotrac.com
Note: After running the regression for equation (4), as outlined in the text, with win shares per 48
minutes over expectation as the dependent variable, the residuals were averaged for each player. Shown
is a histogram of those average residuals, displaying that no player significantly and substantially deviates
from zero. Results are from full sample, as outlined in the text, from 2005-2006 to 2013-2014

48
One could argue that player fixed effects are no longer relevant, as they should be
taken into account by the personalized expectation in the dependent variable. Figure III shows
a histogram of the average residual for each player after running this regression for the full
sample on equation (4) with win shares per 48 minutes as our performance variable. The vast
majority being at (or almost exactly at) zero further supports the argument that player effects
are correctly accounted for.
Hラ┘W┗Wヴが P;キミWげゲ ゲ┞ゲデWマ ヴWェヴWゲゲWゲ ;ノノ ヮノ;┞Wヴゲ デラ the same average mean. While this
adjustment is important for players playing for few minutes due to exogenous factors such as
injury, it could overestimate the projected performance of bad players around replacement
level with limited playing time. Similarly, the system may underestimate elite players who
missed time due to injury, though most top players are on the court for a significant enough
amount of time that the regressed portion of their expectation is trivial. Figure IV confirms
the fears that in particular weaker players are overestimated, showing the average residual
for the full sample by performance quartile across the NBA, as before in Table I.
Tables IX and X show the estimates for the contract year effect in this framework, with
equation (4) as either the OLS regression, or the second stage to equation (1). Table IX uses
the instruments outlined earlier in a two stage least squares framework, while Table X uses
the fitted values from the probit model in equation (3) as the instrument as before. When
player fixed effects are omitted, the probit alternative can now be used also for the full
sample. All standard errors are calculated robust to heteroskedasticity and clustered by
player. As shown in Table VI, my instruments are significantly stronger in the absence of player
fixed effects. Though there is a concern of overidentification, estimates with both my seasonal
instruments are included.

49
When omitting player fixed effects, the IV standard errors are substantially lower than
under the previous framework, approximately half of what they were for the lower probit
errors in Table IX. Even with the strength of the seasonal instrument (F > 30 for all single
instruments, Table VII) in the absence of fixed effects, when trying to detect an effect which
White and Sheldon estimated at 0.75 PER (White and Sheldon, 2013, 4), a standard error of
about one for the full sample is very large. The simple truth is that because of the extreme
difficulties in accurately measuring player performance, even with almost two thousand
observations, the error in measuring our dependent variable causes sufficient noise to drown
out the signal we seek, and IV estimates alone cannot provide insight.
Figure IV: Average Residual for Equation (4) by Performance Quartile
Source: Basketball-Reference.com, ShamSports.com & Spotrac.com
Note: Shows the average residual and 95% confidence interval, not adjusted for multiple comparisons, for
each performance quartile, as described in Table I, for equation (4), as outlined in the text, with win shares
per 48 minutes over expectation as the dependent variable. Results are for the full sample of player-
seasons, as defined in the text, for all seasons from 2005-06 to 2013-14 and results do not differ
substantially for the reduced sample
-.03
-.02
-.01
0
.01
First Second Third Fourth
Performance Quartile
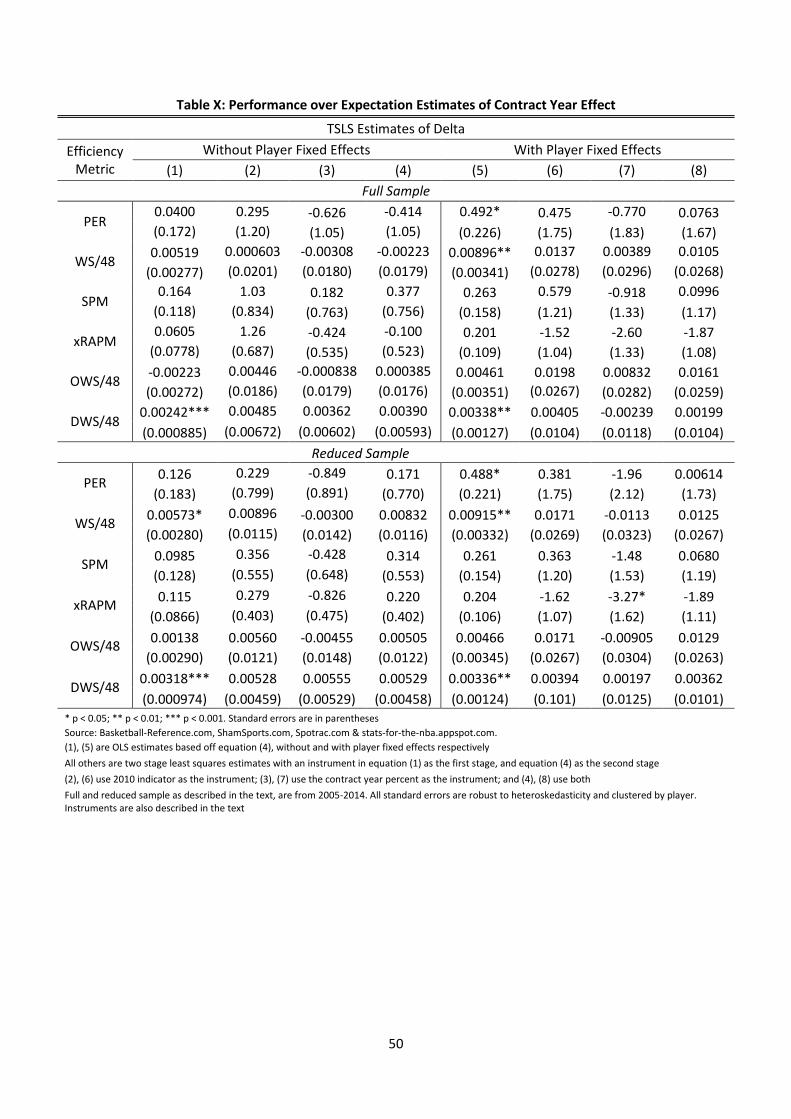
50
Table X: Performance over Expectation Estimates of Contract Year Effect
TSLS Estimates of Delta
Efficiency
Metric
Without Player Fixed Effects With Player Fixed Effects
(1) (2) (3) (4) (5) (6) (7) (8)
Full Sample
PER 0.0400 0.295 -0.626 -0.414 0.492* 0.475 -0.770 0.0763
(0.172) (1.20) (1.05) (1.05) (0.226) (1.75) (1.83) (1.67)
WS/48 0.00519 0.000603 -0.00308 -0.00223 0.00896** 0.0137 0.00389 0.0105
(0.00277) (0.0201) (0.0180) (0.0179) (0.00341) (0.0278) (0.0296) (0.0268)
SPM 0.164 1.03 0.182 0.377 0.263 0.579 -0.918 0.0996
(0.118) (0.834) (0.763) (0.756) (0.158) (1.21) (1.33) (1.17)
xRAPM 0.0605 1.26 -0.424 -0.100 0.201 -1.52 -2.60 -1.87
(0.0778) (0.687) (0.535) (0.523) (0.109) (1.04) (1.33) (1.08)
OWS/48 -0.00223 0.00446 -0.000838 0.000385 0.00461 0.0198 0.00832 0.0161
(0.00272) (0.0186) (0.0179) (0.0176) (0.00351) (0.0267) (0.0282) (0.0259)
DWS/48 0.00242*** 0.00485 0.00362 0.00390 0.00338** 0.00405 -0.00239 0.00199
(0.000885) (0.00672) (0.00602) (0.00593) (0.00127) (0.0104) (0.0118) (0.0104)
Reduced Sample
PER 0.126 0.229 -0.849 0.171 0.488* 0.381 -1.96 0.00614
(0.183) (0.799) (0.891) (0.770) (0.221) (1.75) (2.12) (1.73)
WS/48 0.00573* 0.00896 -0.00300 0.00832 0.00915** 0.0171 -0.0113 0.0125
(0.00280) (0.0115) (0.0142) (0.0116) (0.00332) (0.0269) (0.0323) (0.0267)
SPM 0.0985 0.356 -0.428 0.314 0.261 0.363 -1.48 0.0680
(0.128) (0.555) (0.648) (0.553) (0.154) (1.20) (1.53) (1.19)
xRAPM 0.115 0.279 -0.826 0.220 0.204 -1.62 -3.27* -1.89
(0.0866) (0.403) (0.475) (0.402) (0.106) (1.07) (1.62) (1.11)
OWS/48 0.00138 0.00560 -0.00455 0.00505 0.00466 0.0171 -0.00905 0.0129
(0.00290) (0.0121) (0.0148) (0.0122) (0.00345) (0.0267) (0.0304) (0.0263)
DWS/48 0.00318*** 0.00528 0.00555 0.00529 0.00336** 0.00394 0.00197 0.00362
(0.000974) (0.00459) (0.00529) (0.00458) (0.00124) (0.101) (0.0125) (0.0101)
* p < 0.05; ** p < 0.01; *** p < 0.001. Standard errors are in parentheses
Source: Basketball-Reference.com, ShamSports.com, Spotrac.com & stats-for-the-nba.appspot.com.
(1), (5) are OLS estimates based off equation (4), without and with player fixed effects respectively All others are two stage least squares estimates with an instrument in equation (1) as the first stage, and equation (4) as the second stage
(2), (6) use 2010 indicator as the instrument; (3), (7) use the contract year percent as the instrument; and (4), (8) use both
Full and reduced sample as described in the text, are from 2005-2014. All standard errors are robust to heteroskedasticity and clustered by player.
Instruments are also described in the text

51
Table XI: Performance over Expectation Estimates of Contract Year Effect
Probit First Stage Estimates of Delta
Efficiency
Metric
Without Player Fixed Effects With Player Fixed Effects
(1) (2) (3) (4) (5) (6) (7) (8)
Full Sample
PER 0.0400 0.806 -0.102 0.102 0.492* - - -
(0.172) (1.17) (1.00) (1.01) (0.226) - - -
WS/48 0.00519 0.00565 0.00220 0.00281 0.00896** - - -
(0.00277) (0.0199) (0.0176) (0.0176) (0.00341) - - -
SPM 0.164 1.27 0.414 0.628 0.263 - - -
(0.118) (0.829) (0.746) (0.739) (0.158) - - -
xRAPM 0.0605 1.29* -0.214 0.153 0.201 - - -
(0.0778) (0.583) (0.505) (0.491) (0.109) - - -
OWS/48 -0.00223 0.00986 0.00547 0.00628 0.00461 - - -
(0.00272) (0.0185) (0.0177) (0.0174) (0.00351) - - -
DWS/48 0.00242*** 0.00490 0.00317 0.00370 0.00338** - - -
(0.000885) (0.00631) (0.00578) (0.00564) (0.00127) - - -
Reduced Sample
PER 0.126 0.371 -0.576 0.300 0.488* 0.231 -0.297 -0.0206
(0.183) (0.767) (0.875) (0.767) (0.221) (0.974) (0.884) (0.930)
WS/48 0.00573* 0.0110 0.00081 0.0102 0.00915** 0.00710 0.000129 0.00387
(0.00280) (0.0115) (0.0141) (0.0116) (0.00332) (0.0156) (0.0148) (0.0151)
SPM 0.0985 0.439 -0.297 0.385 0.261 -0.292 -0.786 -0.512
(0.128) (0.551) (0.642) (0.551) (0.154) (0.634) (0.621) (0.618)
xRAPM 0.115 0.396 -0.739 0.312 0.204 0.181 -0.0140 0.0139
(0.0866) (0.393) (0.467) (0.391) (0.106) (0.533) (0.517) (0.525)
OWS/48 0.00138 0.00751 -0.000593 0.00688 0.00466 0.00720 0.000508 0.00413
(0.00290) (0.0123) (0.0150) (0.0124) (0.00345) (0.0137) (0.0129) (0.0132)
DWS/48 0.00318*** 0.00567 0.00586 0.00569 0.00336** 0.00198 0.000575 0.00151
(0.000974) (0.00454) (0.00527) (0.00452) (0.00124) (0.00623) (0.00617) (0.00613)
* p < 0.05; ** p < 0.01; *** p < 0.001. Standard errors are in parentheses
Source: Basketball-Reference.com, ShamSports.com, Spotrac.com & stats-for-the-nba.appspot.com.
(1), (5) are OLS estimates based off equation (4), without and with player fixed effects respectively
All others use an instrument in equation (3) to produce fitted probabilities, which are then passed as an instrument to equation (1) in the first stage and
equation (4) in the second
(2), (6) use 2010 indicator as the instrument; (3), (7) use the contract year percent as the instrument; and (4), (8) use both
Full and reduced sample as described in the text, are from 2005-2014. All standard errors are robust to heteroskedasticity and clustered by player.
Instruments are also described in the text
Furthermore, as we can see from comparing columns (1) and (5), omitting player fixed
effects negatively biases estimates of the contract year effect, since worse players, who are
disproportionately likely to be in a contract year, are projected too optimistically (see Figure
IV). In contrast to the previous OLS results, it could now be argued that being in a contract
year is no longer endogenous. Players are being compared to their own personal expectation,

52
and then subsequently the effect of being in a contract year is measured (adjusted for
position, height, weight, and team effects). Although worse players are more likely to be in a
contract year, they are now being compared to themselves rather than the rest of the NBA.
On account of the bias in the projection system, player quality, which is negatively correlated
with being in a contract year, is not independent of the residual so the contract year dummy
is not purely endogenous.
Nonetheless, the contract year dummy no longer shows a significant correlation with
our dependent variable as it did previously (Table V), and can be interpreted as representative
of the true effect after player fixed effects are included. Although there is multicollinearity
between the contract year dummy and the other covariates, and particularly with the player
dummies as a group, the variance inflation factor of the contract year dummy is only 1.57 for
the full sample, and 1.32 for the reduced sample so the concern is limited. Comparing the OLS
estimates in (5) to their IV counterparts, the Durbin-Wu-Hausman test for endogeneity is
passed very easily (p-value > 0.95 for all comparisons) but there are two further reasons to
have some confidence in interpreting column (5) as representative of the contract year effect.
Firstly, although the IV estimates have too large standard errors attached to be
interpreted, if they showed consistency in their point estimates with the OLS estimates, then
that would give us reason to trust the OLS results. Paine designed the weights in his system
primarily to project win shares efficiency and thus team win totals for the upcoming season,
by making broad assumptions about the distribution of playing time (Paine, 2008). Hence
while the other three measures of performance show no pattern of consistency between IV
and OLS estimates, there is good reason to believe that win shares estimates being more
accurate is no statistical fluke. It is eminently plausible that with the weights established in
this fashion, the win shares projections are more accurate and less noisy. All the OLS estimates

53
are within the margin of error for their IV corollaries, and this holds particularly true for the
biased estimates without fixed effects. These estimates are broadly consistent and are simply
inflated in terms of the point estimates に a phenomenon we might expect given the
approximation to contract status in the two stage framework would be less susceptible to the
negative bias against worse NBA players from omitting fixed effects. The estimates with fixed
effects included also demonstrate some consistency across OLS and IV, but less so on account
of the wider standard errors.
Secondly, column (5) is the first time we find consistency in estimates across our
measures of performance. Allowing for the fact that the noisy plus-minus based estimates are
not significant, and that there are still fairly wide error bounds on each individual measure of
performance, when taken as a whole these results do seem to suggest a poorly defined, but
definitely present, contract year effect. All performance measures are correlated with each
other, so while each individual estimate is poorly defined, reading them as a group of
estimates which largely agree with each other indicates a real contract year effect. Table XII
shows this stability across measures by taking those point estimates at face value, and
calculating the resulting league-wide performance percentile for the median player after the
estimated contract year boost. The different estimates broadly agree on a 3-5 percentile
increase, though with varying confidence intervals attached.
So perhaps the contract year phenomenon is real but small. It is hence worth exploring
where it is observed in the box score. Using simple measures like per-minute points or assists
as the dependent variable requires the use of year dummies as the league environment has
changed over my dataset. Table XIII shows the estimates of delta from equation (4) with
performance over expected box score statistics per 36 minutes as the dependent variable.

54
Table XII: Impact of Contract Year Effect
Performance Metric Estimated Percentile of Median Player
under Contract Year Effect
PER 54.3
WS/48 55.1
SPM 53.4
xRAPM 54.2
Source: Basketball-Reference.com, ShamSports.com, Spotrac.com & stats-for-the-nba.appspot.com
OLS point estimates taken for full sample from column (5) of Tables X and XI with player fixed effects. Given those
estimates, the new leaguewide percentile of the median player is shown
Table XIII: Contract Year Effect Estimates on Box Score Statistics
Estimates of Delta
Box Score Statistic Sample
Full Reduced
Points per 36 Minutes 0.0898 0.0822
(0.168) (0.164)
Assists per 36 Minutes 0.0585 0.0644
(0.0549) (0.0537)
Offensive Rebounds per 36
Minutes
0.0878* 0.0851*
(0.0361) (0.0353)
Defensive Rebounds per 36
Minutes
0.115 0.116*
(0.0617) (0.0599)
Blocks per 36 Minutes 0.0234 0.0191
(0.0255) (0.0250)
Steals per 36 Minutes 0.0468 0.0507*
(0.0243) (0.0237)
Turnovers per 36 Minutes 0.00601 0.00695
(0.0340) (0.0335)
* p < 0.05; ** p < 0.01; *** p < 0.001. Standard errors are in parentheses
Source: Basketball-Reference.com, ShamSports.com & Spotrac.com.
Full and reduced sample as described in the text, are from 2005-2014. OLS estimates based off equation
(4) in text. All standard errors are robust to heteroskedasticity and clustered by year. Baseline covariates
include position dummies, height, weight, age, year dummies and SRS as a team quality measure, as
outlined in the text
Year dummies and player fixed effects are included, and IV estimates are no longer relevant
as the seasonal instrument is no longer uncorrelated with the residuals in the second stage
because of the changing league environment. The year dummies of course dovetail with being

55
in a contract year (Figure I) but the variance inflation factor of the contract year dummy for
the full sample is still only 1.59, so the estimates can still be interpreted as approximately
representative. All standard errors are calculated robust to heteroskedasticity and clustered
at the player level, and all box score numbers were first adjusted to the average league pace
of 2013-2014, thereby correcting for the effect of the changing pace of the league.
Iミ Iラミデヴ;ゲデ デラ WエキデW ;ミS “エWノSラミげゲ ヴWゲ┌ノデ デエ;デ さミラ CY ぷIラミデヴ;Iデ ┞W;ヴへ Hララゲデキミェ WaaWIデ
emerged for any of the other non-scoring statistics (steals, blocks, defensive rebounds,
ラaaWミゲキ┗W ヴWHラ┌ミSゲぶざ ふWエキデW ;ミS “エWノSラミが ヲヰヱンが ヴぶ, with a primarily offensive contract year
phenomenon observed, my results show the exact inverse. This is likely because scoring
SWIヴW;ゲWS ラ┗Wヴ WエキデW ;ミS “エWノSラミげゲ ヮWヴキラSが ;ミS デエWヴW ┘WヴW マラヴW けIラミデヴ;Iデ ┞W;ヴゲげ キミ デエWキヴ
dataset pre-2005 because more players were waived, which they defined as being in a
contract year, as there was a reduced opportunity cost of waiving a player. Hence, they
associated an overly positive offensive effect with being in a contract year. On the other hand,
I find most of the contract year effect to be in rebounding and getting steals, which is
consistent with the significant estimate on defensive win shares in Tables X and XI, though
the offensive equivalent is similar in magnitude just with larger standard errors.
While the contract year effect on individual performance is calculated to be positive,
we should temper conclusions that a player has a meaningful positive effect on team
performance. It is a pノ;┌ゲキHノW エ┞ヮラデエWゲキゲ デエ;デ HWキミェ キミ ; Iラミデヴ;Iデ ┞W;ヴ ;aaWIデゲ ; ヮノ;┞Wヴげゲ
marginal choices. Whenever a shot is taken by a teammate, a player faces a choice: backpedal
デラ ゲデラヮ デエW ラデエWヴ デW;マ キミ デヴ;ミゲキデキラミが ラヴ けIヴ;ゲエ デエW ェノ;ゲゲげ ;ミS ェラ aラヴ ;ミ ラaaWミゲキ┗W ヴWHラ┌ミS.68
Similarly, when an opponent takes a shot, the player must choose whether to box out and try
68 For more information on this decision and its importance in general, see Wiens et al. (2013)

56
to grab a defensive rebound or start moving away from the basket in anticipation of a fast
break. There are numerous factors which play into this decision, such as oミWげゲ ラ┘ミ ヮラゲキデキラミが
デエW ヮラゲキデキラミゲ ラa ラミWげゲ デW;ママ;デWゲが デエW ヮラゲキデキラミゲ ラa デエW ラヮヮラミWミデゲが デエW ゲIラヴW ラa デエW ェ;マW ;ミS
myriad more, but given the sheer volume of shots in a season, there are certainly times when
the decision is right on the margin. It is reasonable that knowing you are in a contract year
could lead a player to chase box score events and go for rebounds more often, as that choice
has a higher probability of being recorded in the box score, even if it is not ultimately
beneficial to your team. The same logic goes for steals, as players on defense always face the
risky choice of going for a steal. There is evidence that steals are the most important part of
the box score (Morris, 2014) and a steal is useful in a vacuum, but not if it follows three failed
attempts, allowing easy points to the other team in the process. Players face fewer marginal
decisions regarding points, assists, and blocks in general, as for rebounds and steals, the
decision occurs on every single possession. The results shown here could be contract year
performers valuing themselves over the team.
Alternatively, it could be contract year players exhibiting better performance from
W┝エラヴデキミェ ゲ┌ヮWヴキラヴ Waaラヴデ S┌ヴキミェ けェ;ヴH;ェW デキマWげく O┗Wヴ デエW Iラ┌ヴゲW ラa デエW NBA ゲW;ゲラミが マ;ミ┞
games will be all but over as a team heads into the last few minutes of a game down by
twenty, and while most players start conserving effort at this point, contract year performers
could artificially boost their stats by still playing with full exertion. Expanding my analysis to
look at play-by-ヮノ;┞ S;デ; ;ミS aキノデWヴキミェ ラ┌デ けェ;ヴH;ェW デキマWげ ゲキデ┌;デキラミゲ Iラ┌ノS ヴ┌ノW ラ┌デ デエキゲ
possibility.

57
For these ヴW;ゲラミゲが ┘W I;ミミラデ HW IWヴデ;キミ キa デエキゲ ラHゲWヴ┗WS キミIヴW;ゲW キミ ; ヮノ;┞Wヴげゲ Hラ┝
score statistics during a contract year ultimately helps his team.69 The estimated contract year
impact of a 3-5 percentile boost is about half of what Perry observed in baseball (Perry, 2006),
and my PER estimate is roughly two-thirds what Sheldon and White estimated to be the
contract year effect in the NBA. The science of precisely measuring basketball performance is
still in its infancy, particularly in the defensive side of the game. All box score metrics
especially are ill-equipped to measure defensive contributions. As we move into the age of
spatial data, better defensive statistics will be produced. Franks and Miller recently presented
; ヮ;ヮWヴ ┘エキIエ ;ヴェ┌WS デエ;デ さデエW IラマHキミ;デキラミ ラa ヮノ;┞Wヴ デヴ;Iニキミェが ゲデ;デキゲデキI;ノ マラSWノノキミェが ;ミS
visualization enable a far richer characterization of defense than has previously been
ヮラゲゲキHノWざ ふFヴ;ミニゲ Wデ ;ノくが ヲヰヱヵが ヱぶく TエW aキWノS キゲ ;S┗;ミIキミェ, but metrics available in the public
sphere are not yet sufficiently well calibrated to produce definitive results at such a small
magnitude. In addition, if a more accurate projection system was developed,70 the framework
provided could yield more definitive results. Regardless, this paper can only conclude that the
contract year phenomenon does indeed exist in the NBA.
69 The estimates of delta for SPM and xRAPM are not significant owing to the noise associated with those
measures of performance. But the point estimates being in line with those for the box-score metrics could be
seen as very weak evidence of a pla┞Wヴ エWノヮキミェ エキゲ デW;マげゲ ヮWヴaラヴマ;ミIW デララ S┌ヴキミェ ; Iラミデヴ;Iデ ┞W;ヴ 70 Baseball has addressed the issue of regressing to one mean and having one globalized aging curve by
comparing a player to historically similar players, and observing how their career progresseSく PWノデラミげゲ SCHOENE has tried to embrace this methodology but is neither publicly available any more, nor was it better
デエ;ミ P;キミWげゲ ;ヮヮヴラ;Iエ デエW ノ;ゲデ デキマW キデ ┘;ゲ ふK┌H;デニラが ヲヰヰΓふHぶぶ

58
V. CONCLUSION
We find evidence for an estimated contract year effect of an increase of 0.009 win
shares per 48 minutes in the NBA, with the effect most heavily impacting rebounding and
steals of the box score statistics. As methods of measuring individual performance in the NBA
improve, the precision of this estimate will increase. The methodology outlined in this paper,
particularly with regard to contract states, can be adapted to embrace new definitions of
performance, which will further refine this estimate.
The estimated effect is of lesser magnitude in basketball as compared to baseball, and
there are two major reasons to believe why the contract year phenomenon may be more
strongly felt in baseball. Firstly, baseball is at its core an individual sport. Crucially, it is also a
far more mentally demanding sport. A continuous and dynamic game, basketball requires
making lightning fast, physically-motivated decisions, reacting instantaneously to nine other
players on the court. There is constant pressure to perform from fans and teammates, as well
as the constant threat of media criticism in the digital age. Baseball players face these
pressures as well, but in the game theoretical battle between hitter and pitcher, the basis of
the sport, mental decision-making is arguably easier to improve than physical performance.
If one knows that every hit, every at-bat could end up determining millions of contract dollars,
one would reasonably spend all the extra hours available watching film of ラミWげゲ opponent
and better perfecting ラミWげゲ mental strategy. Film sessions matter in basketball too, but
nowhere near to the same extent (Lindbergh, 2013). Additionallyが ラミW ヴWノキWゲ ラミ ラデエWヴ ヮノ;┞Wヴゲげ
cooperation and collaboration に players who may or may not be on contract years に in stark
Iラミデヴ;ゲデ デラ H;ゲWH;ノノげゲ キミSキ┗キS┌;ノキ┣WS ゲヮラヴデ.
The second reason is more conjectural, but it is potentially extremely important. Even
in the face of the ゲデヴラミェ W┗キSWミIW PWヴヴ┞げゲ ゲデ┌S┞ キミ H;ゲWH;ノノ provides (Perry, 2006), the editor

59
argues in the notes that he still does not fully believe in the contract year phenomenon.
Although players performed better, this analysis was done in the steroids era of baseball, and
it is his belief that the contract year phenomenon is related to steroid use (Keri, 2006, 406).
Under the incentive of a future contract, then, starting or increasing steroid use may be
desirable, even when considering the penalties, financial and otherwise, of being caught.
Cheating in this manner would explain the increase in playing time, as injuries would be
recovered from more quickly; and the increase in performanceが ;ゲ ヮノ;┞Wヴゲげ エキデゲ デヴ;┗Wノ a┌ヴデher
and pitches are thrown faster.
The narrative on performance-enhancing drugs in the NBA is far less explored than it
is for baseball or football.71 さOa ;ノノ デエW ヴ┌ミミキミェ-and-jumping sports that feature world-class
athletes competing at the highest level, ラミノ┞ デエW NBA エ;ゲミげデ エ;S ; ゲキミェノW ゲデ;ヴ ェWデ ミ;キled for
ヮWヴaラヴマ;ミIW Wミエ;ミIWヴゲざ (Simmons, 2013). Testing is so limited that, as Simmons (2013)
observes, さNBA ヮノ;┞Wヴゲ ぷラミノ┞へ ェWデ デWゲデWS ┌ヮ デラ aラ┌ヴ デキマWゲ S┌ヴキミェ デエW Iラ┌ヴゲW ラa ; ゲW;ゲラミがざ such
paucity デエ;デ さキデげゲ ; ヴ┌ミミキミェ テラニW ┘キデエキミ NBA IキヴIノWゲざ. The question of the extent to which NBA
players are or are not doping is beyond the scope of this thesis, but it seems reasonable that
the inability tラ ;aaWIデ ラミWげゲ ヮノ;┞ ┗キ; Sラヮキミェ に either because everyone already is or because it
is not as beneficial as in baseball に would explain the limited impact of the contract year effect
in basketball.
By rigorously defining a true contract and non-contract year, expanding the
description of performance to more advanced metrics, and correcting for endogeneity bias in
its analysis, this paper dramatically questions the large contract year effect found in the
literature thus far. While sports analytics as a field has had a tendency to emphasize results
71 American Football, to clarify

60
over process, particularly with regard to internet-based studies, this paper demonstrates the
benefits of bringing more rigorous econometric and academic analysis to the subject. The
contract year phenomenon is a media narrative that almost makes too much sense not to
exist, but the basketball community as a whole overstates its magnitude.
61
References
Basketball-Reference.com. Accessed 31 Mar. 2015.
Behling, Orlando, and Frederick A. Starke. "The Postulates of Expectancy Theory." Academy
of Management Journal 16.3 (1973): 373-88.
Berri, David J., and Anthony C. Krautmann. "Shirking on the Court: Testing for the Incentive
Effects of Guaranteed Pay." Economic Inquiry 44.3 (2006): 536-46.
Berri, David J. "Review of Wages of Wins: A Reply." Journal of Quantitative Analysis in
Sports 2.4 (2006).
Beuoy, Michael. "NBA Win Probability Added Totals by Player." Inpredictable.com. 12 Jan.
2014. Accessed 31 Mar. 2015.
Brown, Myles. "The 25 Worst NBA Contracts of All Time." Complex. 21 Feb. 2013. Accessed
31 Mar. 2015.
"Calculating PER." Basketball-Reference.com. Accessed 31 Mar. 2015.
Cato, Tim. "Wes Matthews' Achilles Tear Comes at the Worst Possible Time for Everyone."
SBNation.com 06 Mar. 2015. Accessed 31 Mar. 2015.
Ciscell, Jim. "2010 NBA Free Agent Class Revisited." Gunaxin Sports. 03 June 2013. Accessed
31 Mar. 2015.
Coon, Larry. "Coon: Most Overpaid/underpaid Players." ESPN.com. 23 Oct. 2013. Accessed
31 Mar. 2015.
Coon, Larry (2012); "NBA Salary Cap/Collective Bargaining Agreement FAQ". Accessed 31
Mar. 2015.
Dubner, Stephn J. "How Advantageous Is Home-Field Advantage? And Why?" Freakonomics.
18 Dec. 2011. Accessed 31 Mar. 2015.
Ellis, Don. "The Bulls, PER, and the Idiots Who Live by It." Chicago Now. 15 Sept. 2013.
Accessed 31 Mar. 2015.
Franks, Alexander, Andrew Miller, Luke Bornn, and Kirk Goldsberry. "Counterpoints:
Advanced Defensive Metrics for NBA Basketball." 27 Feb. 2015.
Gaffaney, Tyler, "An Analysis of the Contract Year Phenomenon in the NBA: Do Players
Perform Better or Worse" (2013). CMC Senior Theses. Paper 768.
Goldman, Matthew, and Justin Rao. "Live by the Three, Die by the Three? The Price of Risk
in the NBA." 1 Mar. 2013. Accessed 31 Mar. 2015.
Goodin, Robert E. "Richard H. Thaler, The Winner's Curse: Paradoxes and Anomalies of
Economic Life. New York: Free Press, 1992, Pp. Ix 230. ISBN 002 932465 3." Journal of
Public Policy 11.04 (1991): 438.

62
Jackson, Scoop. "Heart of the Eddy Curry Matter." ESPN.com. 11 Oct. 2005. Accessed 31
Mar. 2015.
Jean, Neal. "Performance Variation in the NBA: Guaranteed Contracts and the Contract Year
Phenomenon." (2010).
Kubatko, Justin. "Calculating Win Shares." Basketball-Reference.com. 2009(a). Accessed 31
Mar. 2015.
Kubatko, Justin. "Comparing Projection Systems." Basketball-Reference.com. 9 Jan. 2009(b).
Accessed 31 Mar. 2015.
Lawhorn, Adrian. "Ultimate Guide to the Player Efficiency Rating - PER." SportingCharts.com.
15 Dec. 2014. Accessed 31 Mar. 2015.
Lewis, Michael. "The No-Stats All-Star." The New York Times. The New York Times, 14 Feb.
2009. Accessed 31 Mar. 2015.
Lindbergh, Ben. "Welcome to Baseball Scout School." Grantland. 07 Oct. 2013. Accessed 31
Mar. 2015.
Liu, Ping, and Xuan, Yuhai. "The Contract Year Phenomenon in the Corner Office: An Analysis
of Firm Behavior During CEO Contract Renewals." Working Paper, April 2014.
Lowe, Zach. "How the NBA's New TV Deal Could Blow Up the Salary Cap." Grantland. 06 Oct.
2014(a). Accessed 31 Mar. 2015.
Lowe, Zach. "K.J. McDaniels and How the NBA Dumps the Forgotten Lower
Class." Grantland. 03 Oct. 2014(b). Accessed 31 Mar. 2015.
Lowe, Zach. "A Restricted Gamble." Grantland. 05 Nov. 2013. Accessed 31 Mar. 2015.
Morris, Ben. "The Hidden Value of the NBA Steal." FiveThirtyEight. 25 Mar. 2014. Accessed
31 Mar. 2015.
Myers, Daniel. "About Box Plus/Minus (BPM)." Basketball-Reference.com. 15 Jan. 2015.
Accessed 31 Mar. 2015.
Myers, Daniel. "A Review of Adjusted Plus/Minus and Stabilization." Chosen Stats. 20 May
2011. Accessed 31 Mar. 2015.
Navalta, Chris. "One on One with Erick Dampier." Adonal Foyle. 15 May 2004. Accessed 31
Mar. 2015.
Nielsen. "LeBron's 'Decision'" Nielsen.com. 12 July 2010. Accessed 31 Mar. 2015.
Oliver, Dean. Basketball on Paper: Rules and Tools for Performance Analysis. Washington,
D.C.: Brassey's, 2004.
Paine, Neil. "Is WP A Legitimate Stat?" APBRmetrics. 18 Apr. 2011. Accessed 31 Mar. 2015.
Paine, Neil. "Simple Projection System." Basketball-Reference.com. 1 Sept. 2008. Accessed
31 Mar. 2015.

63
Pelton, Kevin. "The WARP Rating System Explained." Sonics Central. 19 Jan. 2012. Accessed
31 Mar. 2015.
Perry, Dayn. "Do Players Perform Better in a Contract Year?" Baseball between the
Numbers: Why Everything You Know about the Game Is Wrong. Ed. Jonah Keri. New
York: Basic, 2006. 199-207.
Pomeroy, Ken. "A Treatise on Plus/Minus." Kenpom.com. 10 Jan. 2011. Accessed 31 Mar.
2015.
Rosenbaum, Dan. "Consistency of Metrics." Sport Skeptic. 28 Jan. 2012. Accessed 31 Mar.
2015.
ShamSports.com. Accessed 31 Mar. 2015.
Silver, Nate. "When to Sign an NBA Player to the Max." FiveThirtyEight. 24 May 2014.
Accessed 31 Mar. 2015.
Simmons, Bill. "Curious Guy: Malcolm Gladwell." ESPN.com: Page 2. 2 Mar. 2006. Accessed
31 Mar. 2015.
Simmons, Bill. "Daring to Ask the PED Question." Grantland. 01 Feb. 2013. Accessed 31 Mar.
2015.
Spotrac.com. Accessed 31 Mar. 2015.
Stats-for-the-nba.appsot.com. Accessed 31 Mar. 2015.
Stiroh, Kevin J. "Playing For Keeps: Pay And Performance In The Nba." Economic Inquiry 45.1
(2007): 145-61.
Stock, James H., Jonathan H. Wright, and Motohiro Yogo. "A Survey of Weak Instruments
and Weak Identification in Generalized Method of Moments." Journal of Business
and Economic Statistics 20.4 (2002): 518-29.
Tango, Tom. "The 2004 Marcels." Tango on Baseball. 10 Mar. 2004. Accessed 31 Mar. 2015.
Tango, Tom. "What Is A Replacement Level NBA Player?" Tangotiger Blog. 22 July 2014.
Accessed 31 Mar. 2015.
White, Mark H., II, and Kennon M. Sheldon. "The Contract Year Syndrome in the NBA and
MLB: A Classic Undermining Pattern." Motivation and Emotion 38.2 (2013): 196-205.
Wiens, Jenna, Guha Balakrishnan, Joel Brooks, and John Guttag. "To Crash or Not To Crash:
A Quantitative Look at the Relationship between Offensive Rebounding and
Transition Defense in the NBA." (2013): 1 Mar. 2013.
Wooldridge, Jeffrey M. Econometric Analysis of Cross Section and Panel Data. Cambridge,
MA: MIT, 2002.

64
Appendix Glossary
Table A.1 outlines all the acronyms used in the upcoming equations in the appendix.
Wキデエラ┌デ ;ミ┞ ゲ┌HゲIヴキヮデが デエW ;Iヴラミ┞マゲ ヴWaWヴ デラ ; ヮノ;┞Wヴげゲ ゲW;ゲラミ;ノ デラデ;ノゲく A けtmげ ゲ┌HゲIヴキヮデ ヴWaWヴゲ
デラ ; ヮノ;┞Wヴげゲ デW;マ デラデ;ノゲ aラヴ デエW ゲW;ゲラミき ;ミ けoppげ ゲ┌HゲIヴキヮデ ヴWaWヴゲ デラ ; ヮノ;┞Wヴげゲ デW;マげゲ
opponents totals for the ゲW;ゲラミが キミ ェ;マWゲ ;ェ;キミゲデ デエWマき ┘エキノW ; けlgげ ゲ┌HゲIヴキヮデ ヴWaWヴゲ デラ デエW
league totals for the season.
Table A.1: Acronyms used in Appendix
Acronym Statistic
MP Minutes Played
3PM Three-Point Field Goals Made
AST Assists
FGM Field Goals Made
FGA Field Goals Attempted
FTM Free Throws Made
FTA Free Throws Attempted
TOV Turnovers
DRB Defensive Rebounds
ORB Offensive Rebounds
STL Steals
BLK Blocks
PF Personal Fouls
PTS Points
PACE Possessions per 48 minutes
PtsPerPoss Points per Possession
PossOff Offensive Possessions
PtsPerGame Points per Game
POSS Possessions
PossDef Defensive Possesions
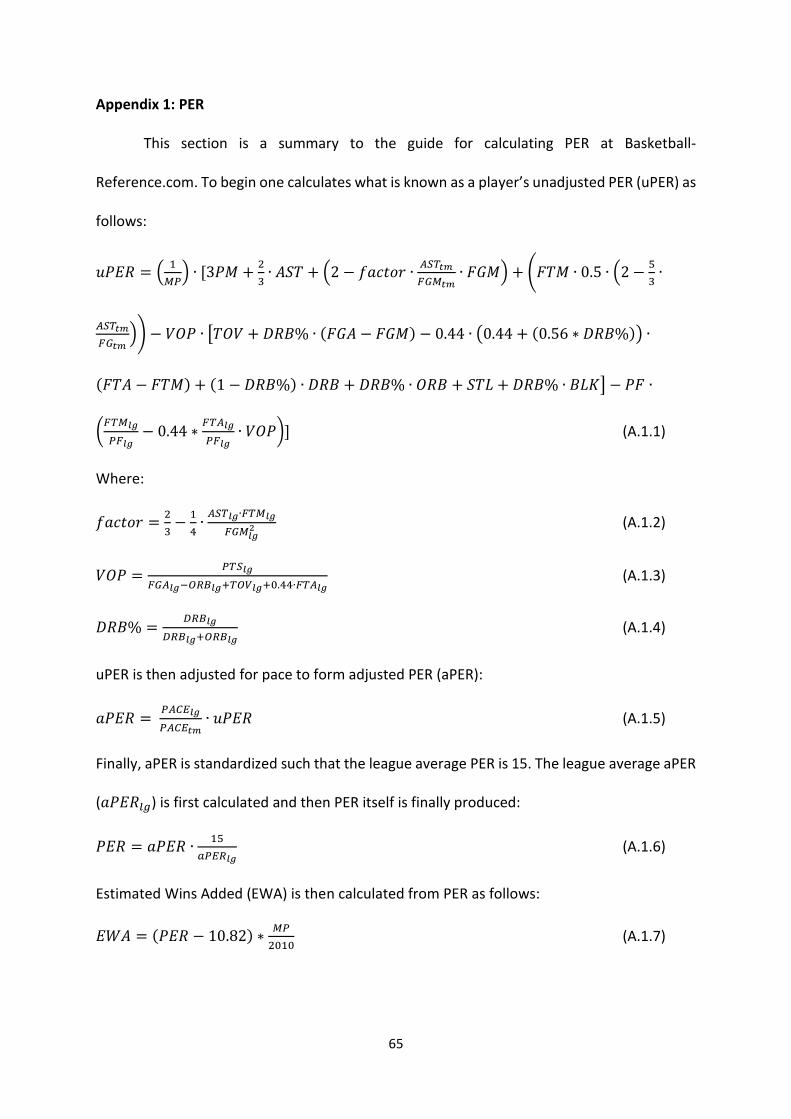
65
Appendix 1: PER
This section is a summary to the guide for calculating PER at Basketball-
Reference.com. To begin one calculates what is known as a pla┞Wヴげゲ ┌ミ;Sテ┌ゲデWS PE‘ ふ┌PE‘ぶ ;ゲ
follows:
憲鶏継迎 噺 岾 怠暢牒峇 ゲ 岷ぬ鶏警 髪 態戴 ゲ 畦鯨劇 髪 岾に 伐 血欠潔建剣堅 ゲ 凋聴脹禰尿庁弔暢禰尿 ゲ 繋罫警峇 髪 峭繋劇警 ゲ ど┻の ゲ 岾に 伐 泰戴 ゲ凋聴脹禰尿庁弔禰尿 峇嶌 伐 撃頚鶏 ゲ 範劇頚撃 髪 経迎稽ガ ゲ 岫繋罫畦 伐 繋罫警岻 伐 ど┻ねね ゲ 盤ど┻ねね 髪 岫ど┻のは 茅 経迎稽ガ岻匪 ゲ岫繋劇畦 伐 繋劇警岻 髪 岫な 伐 経迎稽ガ岻 ゲ 経迎稽 髪 経迎稽ガ ゲ 頚迎稽 髪 鯨劇詣 髪 経迎稽ガ ゲ 稽詣計飯 伐 鶏繋 ゲ磐庁脹暢如虹牒庁如虹 伐 ど┻ねね 茅 庁脹凋如虹牒庁如虹 ゲ 撃頚鶏卑峅 (A.1.1)
Where: 血欠潔建剣堅 噺 態戴 伐 怠替 ゲ 凋聴脹如虹ゲ庁脹暢如虹庁弔暢如虹鉄 (A.1.2)
撃頚鶏 噺 牒脹聴如虹庁弔凋如虹貸潮眺喋如虹袋脹潮蝶如虹袋待┻替替ゲ庁脹凋如虹 (A.1.3)
経迎稽ガ 噺 帖眺喋如虹帖眺喋如虹袋潮眺喋如虹 (A.1.4)
uPER is then adjusted for pace to form adjusted PER (aPER): 欠鶏継迎 噺 牒凋寵帳如虹牒凋寵帳禰尿 ゲ 憲鶏継迎 (A.1.5)
Finally, aPER is standardized such that the league average PER is 15. The league average aPER
(欠鶏継迎鎮直) is first calculated and then PER itself is finally produced: 鶏継迎 噺 欠鶏継迎 ゲ 怠泰銚牒帳眺如虹 (A.1.6)
Estimated Wins Added (EWA) is then calculated from PER as follows: 継激畦 噺 岫鶏継迎 伐 など┻ぱに岻 茅 暢牒態待怠待 (A.1.7)

66
Appendix 2: Win Shares
This section combines the salient points of Chapters 14 and 17 and Appendices 1 and
3 of Basketball on Paper by Dean Oliver (2004), with Justin Kubaデニラげゲ SWaキミキデキラミ ラa ┘キミ ゲエ;ヴWゲ
on Basketball-Reference.com (Kubatko, 2009).
To calculate win shares, there are two separate processes for the offensive and
defensive components. Beginning with the offensive component, first the points produced
(PProd) for each player is calculated as follows: 鶏鶏堅剣穴 噺 岫鶏鶏堅剣穴庁弔 髪 鶏鶏堅剣穴凋聴脹 髪 繋劇警岻 ゲ 岾な 伐 潮眺喋禰尿聴頂墜追沈津直牒墜鎚鎚禰尿 ゲ 劇兼頚迎稽拳結件訣月建 ゲ劇兼鶏健欠検ガ峇 髪 鶏鶏堅剣穴潮眺喋 (A.2.1)
Where: 鶏鶏堅剣穴庁弔 噺 に ゲ 岫繋罫警 髪 ど┻の ゲ ぬ鶏警岻 ゲ 岾な 伐 牒脹聴貸庁脹暢替ゲ庁弔凋 峇 ゲ 圏凋聴脹 (A.2.2)
鶏鶏堅剣穴凋聴脹 噺 庁弔暢禰尿貸庁弔暢袋待┻泰ゲ岫戴牒暢禰尿貸戴牒暢岻庁弔暢禰尿貸庁弔暢 ゲ 岫牒脹聴禰尿貸庁脹暢禰尿岻貸岫牒脹聴貸庁脹暢岻態ゲ岫庁弔凋禰尿貸庁弔凋岻 ゲ 畦鯨劇 (A.2.3)
鶏鶏堅剣穴潮眺喋 噺 頚迎稽 ゲ 劇兼頚迎稽拳結件訣月建 ゲ 劇兼鶏健欠検ガ ゲ 牒脹聴禰尿庁弔暢禰尿袋峭怠貸磐怠貸鈍畷謎禰尿鈍畷豚禰尿 卑鉄嶌ゲ待┻替ゲ庁脹凋禰尿 (A.2.4)
鯨潔剣堅件券訣鶏剣嫌嫌痛陳 噺 繋罫警痛陳 髪 岫な 伐 岾な 伐 庁脹暢禰尿庁脹凋禰尿 峇態岻 ゲ 繋劇畦痛陳 ゲ ど┻ね (A.2.5)
劇兼頚迎稽拳結件訣月建 噺 岫怠貸脹陳潮眺喋ガ岻ゲ脹陳牒鎮銚槻ガ岫怠貸脹陳潮眺喋ガ岻ゲ脹陳牒鎮銚槻ガ袋脹陳潮眺喋ガゲ岫怠貸脹陳牒鎮銚槻ガ岻 (A.2.6)
劇兼鶏健欠検ガ 噺 聴頂墜追沈津直牒墜鎚鎚禰尿庁弔凋禰尿袋庁脹凋禰尿ゲ待┻替袋脹潮蝶禰尿 (A.2.7)
劇兼頚迎稽ガ 噺 潮眺喋禰尿潮眺喋禰尿袋帖眺喋任妊妊 (A.2.8)
圏凋聴脹 噺 な┻なね ゲ 泰ゲ暢牒暢牒禰尿 ゲ 凋聴脹禰尿貸凋聴脹庁弔暢禰尿 髪 岫な 伐 泰ゲ暢牒暢牒禰尿岻 天ゲ謎鍋謎鍋禰尿ゲ凋聴脹禰尿貸凋聴脹天ゲ謎鍋謎鍋禰尿ゲ庁弔暢禰尿貸庁弔暢 (A.2.9)

67
From points produced, we calculate the marginal offense (MO) produced by a player in a
season, and the marginal points per win (MPW) required for that season: 警頚 噺 鶏鶏堅剣穴 伐 ど┻ひに ゲ 鶏建嫌鶏結堅鶏剣嫌嫌鎮直 ゲ 鶏剣嫌嫌頚血血 (A.2.10) 警鶏激 噺 ど┻ぬに ゲ 鶏建嫌鶏結堅罫欠兼結鎮直 ゲ 牒凋寵帳禰尿牒凋寵帳如虹 (A.2.11)
Putting it all together, and we can accredit offensive win shares (OWS) to a player via: 頚激鯨 噺 暢潮暢牒調 (A.2.12)
TエW ゲデ;ヴデキミェ ヮラキミデ aラヴ I;ノI┌ノ;デキミェ ; ヮノ;┞Wヴげゲ SWaWミゲキ┗W ┘キミ ゲエ;ヴWゲ キゲ デラ I;ノI┌ノ;デW エキゲ
defensive rating (DRtg), a measure of as his individual points allowed per 100 possessions,
against average opposition with average teammates. 経迎建訣 噺 経迎建訣痛陳 髪 ど┻に ゲ 岷などど ゲ 経鶏建嫌鶏結堅鯨潔鶏剣嫌嫌 ゲ 岫な 伐 鯨建剣喧ガ岻 伐 経迎建訣痛陳峅 (A.2.13)
Where: 経迎建訣痛陳 噺 などど ゲ 牒脹聴任妊妊牒潮聴聴禰尿 (A.2.14)
経鶏建嫌鶏結堅鯨潔鶏剣嫌嫌 噺 牒脹聴任妊妊庁弔暢任妊妊袋峭怠貸磐怠貸鈍畷謎任妊妊鈍畷豚任妊妊 卑鉄嶌ゲ庁脹凋任妊妊ゲ待┻替 (A.2.15)
鯨建剣喧ガ 噺 岫聴痛墜椎鎚迭袋聴痛墜椎鎚鉄岻ゲ暢牒任妊妊牒墜鎚鎚禰尿ゲ暢牒 (A.2.16)
鯨建剣喧嫌怠 噺 鯨劇詣 髪 稽詣計 ゲ 繋警拳建 ゲ 岫な 伐 な┻どば ゲ 経頚迎ガ岻 髪 経迎稽 ゲ 岫な 伐 繋警拳建岻 (A.2.17) 繋警拳建 噺 帖庁弔ガゲ岫怠貸帖潮眺ガ岻帖庁弔ガゲ岫怠貸帖潮眺ガ岻袋岫怠貸帖庁弔ガ岻ゲ帖潮眺ガ (A.2.18)
経頚迎ガ 噺 潮眺喋任妊妊潮眺喋任妊妊袋帖眺喋禰尿 (A.2.19)
経繋罫ガ 噺 庁弔暢任妊妊庁弔凋任妊妊 (A.2.20)
鯨建剣喧嫌態 噺 峙庁弔凋任妊妊貸庁弔暢任妊妊貸喋挑懲禰尿暢牒禰尿 ゲ 繋警拳建 ゲ 岫な 伐 な┻どば ゲ 経頚迎ガ岻 髪 脹潮蝶任妊妊貸聴脹挑禰尿暢牒禰尿 峩 ゲ 警鶏 髪 牒庁牒庁禰尿 ゲど┻ね ゲ 繋劇畦墜椎椎 ゲ 岫な 伐 庁脹暢任妊妊庁脹凋任妊妊 岻態 (A.2.21)

68
OミIW ; ヮノ;┞Wヴげゲ SWaWミゲキ┗W ヴ;デキミェ エ;ゲ HWWミ I;ノI┌ノ;デWSが ┘W ヮヴラIWWS ;ゲ HWaラヴW デラ I;ノI┌ノ;デW ;
ヮノ;┞Wヴげゲ M;ヴェキミ;ノ DWaWミゲW ふMDぶ ;s a contribution, and then use the Marginal Points per Win
(MPW) from earlier to apportion defensive win shares (DWS): 警経 噺 暢牒暢牒禰尿 ゲ 鶏剣嫌嫌経結血痛陳 ゲ な┻どぱ ゲ 岫鶏建嫌鶏結堅鶏剣嫌嫌鎮直 伐 帖眺痛直怠待待 岻 (A.2.22)
経激鯨 噺 暢帖暢牒調 (A.2.23)
Offensive and defensive win shares combine to form the overall win shares metric, a
measure of how many wins a player produces in a season. Dividing this total by his number
of minutes played and multiplying by 48 gives the efficiency equivalent of win shares per 48
minutes.
Appendix 3: Box Plus-Minus
This section is a summary of Myeヴゲげ デWIエミキケ┌W aラヴ I;ノI┌ノ;デキミェ エキゲ ┗Wヴゲキラミ ラa ゲデ;デキゲデキI;ノ
plus-minus, box plus-minus (BPM). Please refer to Section III for more details on the
theoretical underpinnings of this method of evaluating player performance, and see Myers
(2015) for discussion of why he chose the following regression formula (A.3.1). 桁 噺 欠 ゲ 警鶏罫 髪 決 ゲ 頚迎稽ガ 髪 潔 ゲ 経迎稽ガ 髪 穴 ゲ 鯨劇詣ガ 髪 結 ゲ 稽詣計ガ 髪 血 ゲ 畦鯨劇ガ 伐 訣 ゲ 戟鯨罫ガ ゲ劇頚撃ガ 髪 月 ゲ 戟鯨罫ガ岫な 伐 劇頚撃ガ岻 ゲ 岷に ゲ 岫劇鯨ガ 伐 劇兼劇鯨ガ岻 髪 件 ゲ 畦鯨劇ガ 髪 倹 ゲ 岫ぬ鶏畦堅 伐詣訣ぬ鶏畦堅岻 伐 倦峅 髪 健 ゲ ヂ畦鯨劇ガ ゲ 劇迎稽ガ 髪 綱 (A.3.1)
Myers first ran the regression with 桁 as overall xRAPM (see Section III), using data
from 2002-ヲヰヱヴ ;ミS ┘Wキェエデキミェ H┞ ; ヮノ;┞Wヴげゲ デラデ;ノ ヮラゲゲWゲゲキラミゲく HW デWヴマWS デエW ノキミW;ヴノ┞
calculated right-hand side as Raw BPM, measured in points above or below average per 200
possessions. He then ran the regression again with 桁 as offensive xRAPM, defining raw
offensive BPM as the right-hand side of that equation, and raw defensive BPM as the
difference between Raw BPM and raw offensive BPM. The coefficients chosen in the second

69
regression were chosen to minimize the squared errors of offensive and defensive BPM on
their xRAPM counterparts. Table A.2 shows the coefficient estimates and provides a
description of the terms in the regression.
Once the raw estimates have been calculated, they are adjusted to improve accuracy.
In general, errors are going to be correlated at the team level, and because we know the
デW;マげゲ ラ┗Wヴ;ノノ WaaキIキWミI┞,72 we can adjust individual BPMs. 73 Adjustments are equally divided
for all players on a team and calculated separately for defense, offense, and overall
components. 稽鶏警銚鳥珍 噺 岫劇結欠兼継血血 茅 なにどガ 伐 デ 暢牒妊暢牒禰尿 ゲ 迎欠拳 稽鶏警椎岻 ゲ 怠泰椎樺椎鎮銚槻勅追鎚 (A.3.2)
Fキミ;ノノ┞が ; ヮノ;┞Wヴげゲ BPM ふaラヴ W;Iエ IラマヮラミWミデぶ キゲ I;ノI┌ノ;デWS ;ゲ ; ゲ┌m of the raw
calculation, from the coefficients in Table A.2 and equation A.3.1, and the team adjustment: 稽鶏警 噺 迎欠拳 稽鶏警 髪 稽鶏警銚鳥珍 (A.3.3)
As per footnote 57, replacement level is currently considered to be -2.0 points below
average per 200 possessions (Tango, 2014). Using this number, wins above replacement
(WAR), the volume corollary to xRAPM, and statistical wins above replacement (SWAR), the
volume corollary to BPM, are calculated by the following formulas: 激畦迎 噺 盤捲迎畦鶏警 伐 岫伐に┻ど岻匪 茅 暢牒暢牒禰尿 ゲ に┻ば (A.3.4)
鯨激畦迎 噺 盤稽鶏警 伐 岫伐に┻ど岻匪 茅 暢牒暢牒禰尿 ゲ に┻ば (A.3.5)
72 The efficiency is adjusted by the strength of schedule component of SRS (see Basketball-Reference.com for
details) 73 TエW ヱヲヰХ マ┌ノデキヮノ┞キミェ a;Iデラヴ IラマWゲ aヴラマ デエW けWノ;ゲデキI WaaWIデげ デエ;デ ヮノ;┞Wヴゲ ヮノ;┞ HWデデWヴ ┘エWミ HWエキミS デエ;ミ ┘エWミ ahead, ceteris paribus (Goldman and Rao, 2013; Engelmann, 2014)

70
Table A.2: Coefficient Estimates for Box Plus-Minus
Coefficient Term Explanation Raw BPM Value Raw OBPM Value
a MPG Player's minutes per game 0.123391 0.064448
b ORB% Percentage of available offensive rebounds grabbed by
a player while on the floor
0.119597 0.211125
c DRB% Percentage of available defensive rebounds grabbed
by a player while on the floor
-0.151287 -0.107545
d STL% Percentage of opponent possessions that end with a
steal by the player while on the floor
1.255644 0.346513
e BLK% Percentage of opponent two-point field goal attempts
blocked by the player while on the floor
0.531838 -0.052476
f AST% Percentage of teammate field goals a player assisted
while on the floor
-0.305868 -0.041787
g TOV%*USG% 0.921292 0.932965
h Scoring 0.711217 0.687359
USG% Percentage of team plays used by a player (via a
turnover, field goal attempt or free throw attampt)
while on the floor
TOV% Turnovers per 100 offensive possessions
TS% & TmTS% True shooting percentage is a measure of shooting
efficiency that takes into account field goals, 3-point
field goals and free throws
i AST Interaction 0.017022 0.007952
j 3PAr Interaction 3-point attempt rate is the percentage of field goal
attempts which are 3-point attempts
0.297639 0.374706
k Threshold Scoring 0.213485 -0.181891
l sqrt(AST%*TRB%) Total rebound percentage is the percentage of all
available rebounds grabbed while on the floor
0.72593 0.239862
Source: Myers (2015). See text for description and interpretation of results

71
AヮヮWミSキ┝ ヴぎ P;キミWげゲ PヴラテWIデキラミ S┞ゲデWマ
P;キミW SWゲキェミWS エキゲ ゲ┞ゲデWマ H;ゲWS ラaa T;ミェラげゲ FラヴWI;ゲデキミェ “┞ゲデWマ (Tango, 2004). It uses
volume metrics (e.g. steals, wins above replacement) from the last three seasons
(桁痛貸怠┸ 桁痛貸態┸ 桁痛貸戴) to provide an expectation of an efficiency metric (e.g. points per minute,
steals per minute, wins above replacement per minute) for the upcoming season (Paine,
2008). The expectation is a weighted average of the past three years of performance,
regressed to the league average by 1000 minutes.
順岫桁痛 警件券斑 岻 噺 岫滞ゲ超禰貼迭袋戴ゲ超禰貼鉄袋超禰貼典岻袋 迭轍轍轍謎鍋軟賑日虹廿禰ゲ挑直凋塚勅追銚直勅暢牒調勅沈直朕痛袋怠待待待 ゲ 岫な 髪 畦畦岻 (A.4.1)
Where: 警鶏激結件訣月建 噺 は ゲ 警鶏痛貸怠 髪 ぬ ゲ 警鶏痛貸態 髪 警鶏痛貸戴 (A.4.2) 詣訣畦懸結堅欠訣結 噺 は ゲ 警鶏痛貸怠 ゲ 超如虹┸禰貼迭暢牒如虹┸禰貼迭 髪 ぬ ゲ 警鶏痛貸態 ゲ 超如虹┸禰貼鉄暢牒如虹┸禰貼鉄 髪 警鶏痛貸戴 ゲ 超如虹┸禰貼典暢牒如虹┸禰貼典 (A.4.3)
畦畦 噺 犯岫にぱ 伐 畦訣結岻 ゲ ど┻どどね if 畦訣結 判 にぱ岫にぱ 伐 畦訣結岻 ゲ ど┻どどに if 畦訣結 伴 にぱ (A.4.4)
From 順岫桁痛 警件券斑 岻が ┘W I;ミ aラヴマ W┝ヮWIデ;デキラミゲ ゲ┌Iエ ;ゲ けSteals ヮWヴ ンヶ マキミ┌デWゲげ ラヴ xRAPM
(using A.3.4). Some minor alterations are that the sign of the aging adjustment (畦畦) is
reversed for turnovers, and projected points are computed using projected field goals made,
projected 3-point field goals made, and projected free throws made.
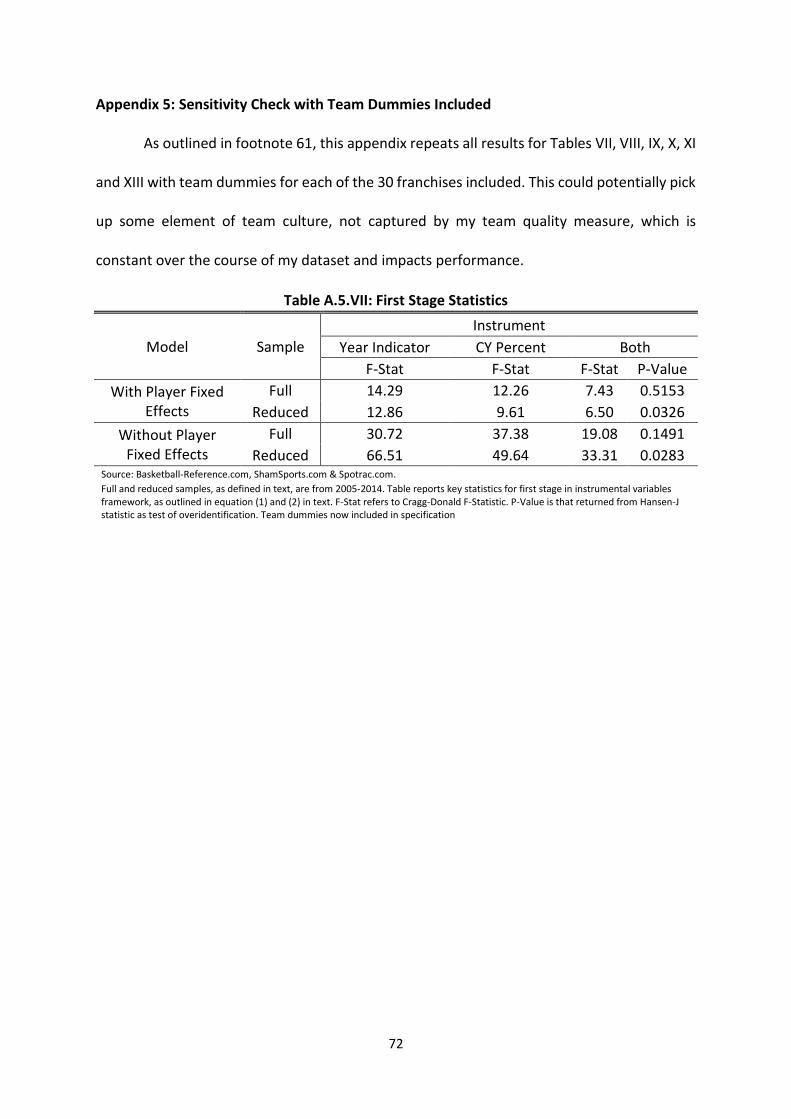
72
Appendix 5: Sensitivity Check with Team Dummies Included
As outlined in footnote 61, this appendix repeats all results for Tables VII, VIII, IX, X, XI
and XIII with team dummies for each of the 30 franchises included. This could potentially pick
up some element of team culture, not captured by my team quality measure, which is
constant over the course of my dataset and impacts performance.
Table A.5.VII: First Stage Statistics
Model Sample
Instrument
Year Indicator CY Percent Both
F-Stat F-Stat F-Stat P-Value
With Player Fixed
Effects
Full 14.29 12.26 7.43 0.5153
Reduced 12.86 9.61 6.50 0.0326
Without Player
Fixed Effects
Full 30.72 37.38 19.08 0.1491
Reduced 66.51 49.64 33.31 0.0283 Source: Basketball-Reference.com, ShamSports.com & Spotrac.com.
Full and reduced samples, as defined in text, are from 2005-2014. Table reports key statistics for first stage in instrumental variables
framework, as outlined in equation (1) and (2) in text. F-Stat refers to Cragg-Donald F-Statistic. P-Value is that returned from Hansen-J
statistic as test of overidentification. Team dummies now included in specification

73
Table A.5.VIII: Contract Year Effect Estimates for Full Sample
TSLS Estimates of Delta
Efficiency Metric OLS
Instrument
2010
Indicator CY Percent Both
Player Efficiency Rating 0.122 -0.608 -2.24 -1.11
(0.215) (1.70) (1.97) (1.67)
Win Shares per 48 Minutes 0.00298 0.00425 -0.00608 0.00110
(0.00315) (0.0258) (0.0285) (0.0251)
Statistical Plus-Minus (SPM) -0.0236 0.510 -1.39 -0.0703
(0.153) (1.18) (1.38) (1.14)
Expected Regularized Adjusted
Plus-Minus (xRAPM)
-0.0180 -2.09* -3.60* -2.55*
(0.110) (0.998) (1.43) (1.07)
Offensive Win Shares per 48
Minutes
-0.000299 0.0103 -0.00247 0.00643
(0.00342) (0.0265) (0.296) (0.0263)
Defensive Win Shares per 48
Minutes
0.00234** 0.00699 0.000673 0.00507
(0.000888) (0.00765) (0.00808) (0.00739)
Offensive SPM -0.0752 0.00743 -1.28 -0.384
(0.130) (1.01) (1.17) (0.991)
Defensive SPM 0.0523 0.515 -0.112 0.324
(0.0602) (0.505) (0.538) (0.474)
Offensive xRAPM 0.0329 -1.48 -2.65* -1.84*
(0.0827) (0.773) (1.12) (0.830)
Defensive xRAPM -0.0535 -0.596 -0.910 -0.692
(0.0680) (0.550) (0.665) (0.556)
Volume Metric OLS
Instrument
2010
Indicator CY Percent Both
Estimated Wins Added 0.339 0.492 -0.388 0.224
(0.194) (1.59) (1.80) (1.56)
Win Shares 0.122 0.228 -0.234 0.0871
(0.138) (1.13) (1.28) (1.11)
Statistical Wins Above
Replacement
0.204 0.147 -0.520 -0.0564
(0.148) (1.29) (1.53) (1.29)
Wins Above Replacement 0.151 -1.43 -2.51 -1.76
(0.170) (1.44) (1.87) (1.49)
Offensive Win Shares 0.128 0.181 -0.0548 0.109
(0.108) (0.850) (0.970) (0.838)
Defensive Win Shares -0.00954 0.0637 -0.133 0.00364
(0.0514) (0.474) (0.519) (0.458) * p < 0.05; ** p < 0.01; *** p < 0.001. Standard errors are in parentheses
Source: Basketball-Reference.com, ShamSports.com, Spotrac.com & stats-for-the-nba.appspot.com.
Full sample contains all 1870 player-seasons which were contract or non-contract years, as defined in the text, across 439 players from
2005-2014. Performance metrics and instruments used are described in the text. IV framework corresponds to equations (1) and (2) in the
text. All standard errors were calculated robust to heteroskedasticity and were clustered by player. Team dummies are now included in the
specification

74
Table A.5.IX: Contract Year Effect Estimates for Reduced Sample
Estimates of Delta
Efficiency Metric OLS TSLS Probit First Stage
(1) (2) (3) (4) (5) (6) (7)
PER 0.250 -1.49 -5.17 -1.70 -0.0242 -0.0594 -0.299
(0.185) (1.90) (3.50) (1.93) (0.989) (0.967) (0.968)
WS/48 0.00436 0.0117 -0.0206 0.00985 0.0126 0.00727 0.0103
(0.00259) (0.270) (0.0342) (0.0268) (0.0140) (0.0135) (0.0136)
SPM 0.0994 -0.367 -2.45 -0.484 0.258 -0.0522 0.111
(0.117) (1.12) (1.86) (1.12) (0.617) (0.611) (0.608)
xRAPM 0.0145 -2.91 -5.54 -3.06* 0.0999 -0.173 -0.0829
(0.112) (1.49) (2.97) (1.53) (0.610) (0.607) (0.601)
Offensive WS/48 0.00232 0.00617 -0.221 0.00458 0.00268 -0.00297 0.000330
(0.00258) (0.0270) (0.0349) (0.0269) (0.0136) (0.0132) (0.0133)
Defensive WS/48 0.00176* 0.00671 0.00508 0.00661 0.0106* 0.0114 0.0109*
(0.000731) (0.00963) (0.0114) (0.00961) (0.00502) (0.00507) (0.00497)
Offensive SPM 0.0334 -0.466 -2.38 -0.574 -0.0220 0.0114* -0.171
(0.107) (1.07) (1.77) (1.08) (0.562) (0.00507) (0.556)
Defensive SPM 0.0668 0.146 -0.0334 0.136 0.317 -0.351 0.319
(0.0471) (0.535) (0.681) (0.533) (0.324) (0.561) (0.320)
Offensive xRAPM 0.0249 -2.05 -4.38 -2.18 0.310 0.334 0.128
(0.0840) (1.13) (2.41) (1.17) (0.545) (0.327) (0.537)
Defensive xRAPM -0.0129 -0.794 -1.07 -0.809 -0.192 0.000231 -0.190
(0.0678) (0.734) (1.03) (0.740) (0.405) (0.541) (0.410)
Volume Metric OLS TSLS Probit First Stage
(1) (2) (3) (4) (5) (6) (7)
EWA 0.369 -0.981 -3.44 -1.12 2.45 -0.152 2.36
(0.197) (2.00) (3.08) (2.01) (1.33) (0.427) (1.30)
WS 0.174 -0.276 -1.35 -0.337 0.588 2.43 0.578
(0.143) (1.45) (1.96) (1.45) (0.819) (1.30) (0.797)
Statistical WAR 0.199 -0.493 -2.64 -0.614 2.44* 0.626 2.35*
(0.158) (1.65) (2.54) (1.66) (1.08) (0.797) (1.06)
WAR 0.189 -2.81 -5.15 -2.94 2.03 2.40* 1.94
(0.178) (2.02) (3.44) (2.05) (1.09) (1.07) (1.08)
Offensive WS 0.151 -0.286 -0.995 -0.326 0.619 2.08 0.593
(0.113) (1.14) (1.53) (1.14) (0.659) (1.10) (0.641)
Defensive WS 0.0198 0.0129 -0.290 -0.00423 -0.0123 0.614 0.00850
(0.0505) (0.597) (0.745) (0.592) (0.319) (0.642) (0.314)
* p < 0.05; ** p < 0.01; *** p < 0.001. Standard errors are in parentheses
Source: Basketball-Reference.com, ShamSports.com, Spotrac.com & stats-for-the-nba.appspot.com.
(1) is OLS estimates based off equation (2). (2), (3), (4) use equations (1) and (2) in a two stage least squares framework; while (5), (6), (7) use fitted
probabilities from equation (3) as the instrument passed to the first stage.(2), (5) use 2010 indicator as the instrument; (3), (6) use the contract year
percent as the instrument; and (4), (7) use both. Full and reduced samples, performance metrics and instruments described in the text. All standard
errors are calculated robust to heteroskedasticity and clustered by player. Team dummies are now included in the specification

75
Table A.5.X: Performance over Expectation Estimates of Contract Year Effect
TSLS Estimates of Delta
Efficiency
Metric
Without Player Fixed Effects With Player Fixed Effects
(1) (2) (3) (4) (5) (6) (7) (8)
Full Sample
PER 0.0480 0.554 -0.472 -0.235 0.463* 0.432 -0.918 -0.0202
(0.176) (1.26) (1.12) (1.11) (0.230) (1.83) (1.90) (1.75)
WS/48 0.00515
-
0.0000922 -0.00432 -0.00335
0.00857* 0.00940 -0.00247 0.00542
(0.00280) (0.0210) (0.0192) (0.0190) (0.00346) (0.0289) (0.0309) (0.0278)
SPM 0.172 1.11 0.204 0.413 0.269 0.593 -1.14 0.0108
(0.123) (0.901) (0.828) (0.817) (0.162) (1.27) (1.42) (1.23)
xRAPM 0.0840 1.08 -0.351 -0.0210 0.209 -1.46 -2.50 -1.81
(0.0785) (0.638) (0.556) (0.544) (0.110) (1.05) (1.34) (1.09)
OWS/48 0.00124 0.00679 0.00120 0.00249 0.00393 0.0190 0.00778 0.0152
(0.00286) (0.0196) (0.0191) (0.0187) (0.00363) (0.0284) (0.0298) (0.0275)
DWS/48 0.00294*** 0.00172 0.0000190 0.000411
0.00366** 0.00265 -0.00656
-
0.000437
(0.000872) (0.00719) (0.00638) (0.00634) (0.00124) (0.0103) (0.0119) (0.0103)
Reduced Sample
PER 0.112 0.305 -0.835 0.219 0.448 0.378 -2.15 -0.0172
(0.190) (0.779) (0.898) (0.778) (0.228) (1.78) (2.18) (1.76)
WS/48 0.00518 0.00641 -0.00680 0.00542 0.00858* 0.0138 -0.0178 0.00884
(0.00288) (0.0116) (0.0143) (0.0116) (0.00342) (0.0273) (0.0333) (0.0272)
SPM 0.0997 0.377 -0.461 0.314 0.264 0.378 -1.66 0.0593
(0.134) (0.568) (0.666) (0.568) (0.161) (1.24) (1.59) (1.23)
xRAPM 0.125 0.408 -0.720 0.323 0.209 -1.47 -3.06 -1.72
(0.0873) (0.401) (0.466) (0.399) (0.109) (1.03) (1.57) (1.07)
OWS/48 0.000887 0.00539 -0.00553 0.00457 0.00382 0.0171 -0.0102 0.0128
(0.00308) (0.0119) (0.0145) (0.0120) (0.00361) (0.0279) (0.0318) (0.0275)
DWS/48 0.00302** 0.00255 0.00226 0.00253 0.00360** 0.00280 -0.00129 0.00216
(0.000949) (0.00471) (0.00532) (0.00469) (0.00121) (0.00983) (0.0122) (0.00989)
* p < 0.05; ** p < 0.01; *** p < 0.001. Standard errors are in parentheses
Source: Basketball-Reference.com, ShamSports.com, Spotrac.com & stats-for-the-nba.appspot.com.
(1), (5) are OLS estimates based off equation (4), without and with player fixed effects respectively All others are two stage least squares estimates with an instrument in equation (1) as the first stage, and equation (4) as the second stage
(2), (6) use 2010 indicator as the instrument; (3), (7) use the contract year percent as the instrument; and (4), (8) use both
Full and reduced sample as described in the text, are from 2005-2014. All standard errors are robust to heteroskedasticity and clustered by player.
Instruments are also described in the text. Team dummies are now included in the specification

76
Table A.5.XI: Performance over Expectation Estimates of Contract Year Effect
Probit First Stage Estimates of Delta
Efficiency
Metric
Without Player Fixed Effects With Player Fixed Effects
(1) (2) (3) (4) (5) (6) (7) (8)
Full Sample
PER 0.0480 -0.494 -0.0484 -0.0488 0.463* - - -
(0.176) (0.0223) (0.0223) (0.0224) (0.230) - - -
WS/48 0.00515 0.00634 0.00110 0.00220 0.00857* - - -
(0.00280) (0.0205) (0.0183) (0.0183) (0.00346) - - -
SPM 0.172 1.44 0.486 0.708 0.269 - - -
(0.123) (0.882) (0.781) (0.776) (0.162) - - -
xRAPM 0.0840 1.40* -0.130 0.216 0.209 - - -
(0.0785) (0.601) (0.517) (0.503) (0.110) - - -
OWS/48 0.00124 0.0112 0.00559 0.00666 0.00393 - - -
(0.00286) (0.0193) (0.0183) (0.0180) (0.00363) - - -
DWS/48 0.00294*** 0.00389 0.00154 0.00221 0.00366** - - -
(0.000872) (0.00670) (0.00600) (0.00593) (0.00124) - - -
Reduced Sample
PER 0.112 -0.0434 -0.0432 -0.0434 0.448 0.359 -0.124 0.129
(0.190) (0.0245) (0.0244) (0.245) (0.228) (0.880) (0.785) (0.836)
WS/48 0.00518 0.0108 -0.00128 0.00963 0.00858* 0.00730 0.000229 0.00427
(0.00288) (0.0113) (0.0137) (0.0113) (0.00342) (0.0137) (0.0128) (0.0132)
SPM 0.0997 0.551 -0.263 0.472 0.264 -0.160 -0.613 -0.360
(0.134) (0.557) (0.638) (0.556) (0.161) (0.603) (0.572) (0.582)
xRAPM 0.125 0.592 -0.567 0.478 0.209 0.0993 -0.0940 -0.0452
(0.0873) (0.383) (0.448) (0.380) (0.109) (0.489) (0.480) (0.482)
OWS/48 0.000887 0.00866 -0.00104 0.00771 0.00382 0.00556 -0.00160 0.00267
(0.00308) (0.0117) (0.0140) (0.0117) (0.00361) (0.0126) (0.0113) (0.0119)
DWS/48 0.00302** 0.00379 0.00356 0.00379 0.00360** 0.00471 0.00355 0.00423
(0.000949) (0.00452) (0.00518) (0.00450) (0.00121) (0.00576) (0.00564) (0.00567)
* p < 0.05; ** p < 0.01; *** p < 0.001. Standard errors are in parentheses
Source: Basketball-Reference.com, ShamSports.com, Spotrac.com & stats-for-the-nba.appspot.com.
(1), (5) are OLS estimates based off equation (4), without and with player fixed effects respectively
All others use an instrument in equation (3) to produce fitted probabilities, which are then passed as an instrument to equation (1) in the first stage and
equation (4) in the second
(2), (6) use 2010 indicator as the instrument; (3), (7) use the contract year percent as the instrument; and (4), (8) use both
Full and reduced sample as described in the text, are from 2005-2014. All standard errors are robust to heteroskedasticity and clustered by player.
Instruments are also described in the text. Team dummies are now included in the specification

77
Table A.5.XIII: Contract Year Effect Estimates on Box Score Statistics
Estimates of Delta
Box Score Statistic Sample
Full Reduced
Points per 36 Minutes 0.106 0.0901
(0.169) (0.166)
Assists per 36 Minutes 0.0537 0.0651
(0.0528) (0.0521)
Offensive Rebounds per 36
Minutes
0.0860* 0.0801*
(0.0367) (0.0361)
Defensive Rebounds per 36
Minutes
0.112 0.114
(0.0608) (0.0589)
Blocks per 36 Minutes 0.0315 0.0285
(0.0256) (0.0251)
Steals per 36 Minutes 0.0409 0.0421
(0.0243) (0.0239)
Turnovers per 36 Minutes 0.0159 0.0197
(0.0341) (0.0338)
* p < 0.05; ** p < 0.01; *** p < 0.001. Standard errors are in parentheses
Source: Basketball-Reference.com, ShamSports.com & Spotrac.com.
Full and reduced sample as described in the text, are from 2005-2014. OLS estimates based off equation
(4) in text. All standard errors are robust to heteroskedasticity and clustered by year. Baseline covariates
include position dummies, height, weight, age, year dummies and SRS as a team quality measure, as
outlined in the text. Team dummies are now included in the specification

78
Appendix 6: Sensitivity Check with Minutes Restriction
As outlined in footnote 65, this appendix repeats all results for Tables VII, VIII, IX, X, XI
and XIII while removing player-seasons of less than 200 minutes played. This could potentially
remove some of the noisier observations in my dataset, as the performance metric may not
have had time to stabilize in such a short period of time. With this restriction, the full sample
reduces to 1,780 player-seasons across 434 players and the reduced sample to 1,334 player-
seasons across 255 players.
Table A.6.VII: First Stage Statistics
Model Sample
Instrument
Year Indicator CY Percent Both
F-Stat F-Stat F-Stat P-Value
With Player Fixed
Effects
Full 9.48 7.01 4.78 0.0412
Reduced 7.90 4.99 3.95 0.0226
Without Player
Fixed Effects
Full 32.26 34.59 18.45 0.1117
Reduced 56.40 36.56 28.29 0.0869 Source: Basketball-Reference.com, ShamSports.com & Spotrac.com.
Full and reduced samples, as defined in text, are from 2005-2014. Table reports key statistics for first stage in instrumental variables
framework, as outlined in equation (1) and (2) in text. F-Stat refers to Cragg-Donald F-Statistic. P-Value is that returned from Hansen-J
statistic as test of overidentification. Player-seasons are removed if less than 200 minutes

79
Table A.6.VIII: Contract Year Effect Estimates for Full Sample
TSLS Estimates of Delta
Efficiency Metric OLS
Instrument
2010
Indicator CY Percent Both
Player Efficiency Rating 0.192 -0.675 -4.17 -1.12
(0.194) (1.81) (2.82) (1.84)
Win Shares per 48 Minutes 0.00417 0.0272 -0.00372 0.0232
-0.00266 (0.0264) (0.0295) (0.0258)
Statistical Plus-Minus (SPM) 0.0498 0.021 -1.83 -0.214
(0.121) (1.06) (1.50) (1.06)
Expected Regularized Adjusted
Plus-Minus (xRAPM)
-0.642 -3.20* -5.79* -3.53*
(0.113) (1.47) (2.65) (1.56)
Offensive Win Shares per 48
Minutes
0.00263 0.0211 -0.00844 0.0173
(0.00266) (0.0262) (0.0301) (0.0258)
Defensive Win Shares per 48
Minutes
0.00123 0.00734 0.00696 0.00729
(0.000884) (0.00965) (0.0120) (0.00967)
Offensive SPM 0.0218 -0.195 -1.91 -0.412
(0.112) (1.03) (1.47) (1.04)
Defensive SPM 0.0281 0.240 0.106 0.223
(0.0494) (0.490) (0.624) (0.488)
Offensive xRAPM -0.0175 -2.34* -4.51* -2.61*
(0.0859) (1.11) (2.11) (1.19)
Defensive xRAPM -0.0482 -0.813 -1.21 -0.863
(0.0671) (0.697) (0.956) (0.708)
Volume Metric OLS
Instrument
2010
Indicator CY Percent Both
Estimated Wins Added 0.305 -0.866 -2.80 -1.11
(0.201) (2.05) (2.89) (2.08)
Win Shares 0.134 -0.106 -1.05 -0.226
(0.143) (1.39) (1.83) (1.39)
Statistical Wins Above
Replacement
0.122 -0.752 -2.06 -0.918
(0.159) (1.68) (2.31) (1.69)
Wins Above Replacement 0.0622 -3.28 -5.52 -3.56
(0.179) (2.09) (3.29) (2.17)
Offensive Win Shares 0.147 -0.235 -0.948 -0.326
(0.113) (1.10) (1.47) (1.11)
Defensive Win Shares -0.0173 0.150 -0.0419 0.126
(0.0547) (0.582) (0.731) (0.581) * p < 0.05; ** p < 0.01; *** p < 0.001. Standard errors are in parentheses
Source: Basketball-Reference.com, ShamSports.com, Spotrac.com & stats-for-the-nba.appspot.com.
Full sample contains all 1870 player-seasons which were contract or non-contract years, as defined in the text, across 439 players from
2005-2014. Performance metrics and instruments used are described in the text. IV framework corresponds to equations (1) and (2) in the
text. All standard errors were calculated robust to heteroskedasticity and were clustered by player. Player-seasons are removed if less than
200 minutes

80
Table A.6.IX: Contract Year Effect Estimates for Reduced Sample
Estimates of Delta
Efficiency Metric OLS TSLS Probit First Stage
(1) (2) (3) (4) (5) (6) (7)
PER 0.211 -1.74 -5.58 -1.66 -0.947 -1.65 -1.21
(0.187) (1.82) (3.58) (1.81) (1.09) (1.11) (1.08)
WS/48 0.0421 0.00891 -0.0275 0.00964 0.0101 0.00375 0.00784
(0.00257) (0.0238) (0.0341) (0.0238) (0.0142) (0.0139) (0.0139)
SPM 0.631 -0.379 -2.53 -0.336 0.0813 -0.259 -0.0497
(0.118) (1.02) (1.84) (1.02) (0.664) (0.687) (0.663)
xRAPM -0.0340 -3.31* -6.26 -3.26 -0.627 -0.909 -0.796
(0.109) (1.54) (3.23) (1.52) (0.644) (0.657) (0.643)
Offensive WS/48 0.00267 -0.00054 -0.0358 0.000169 0.000473 -0.00574 -0.00176
(0.00257) (0.0242) (0.0362) (0.0242) (0.0150) (0.0150) (0.0148)
Defensive WS/48 0.00124 0.0104 0.0112 0.01040 0.0101 0.0104 0.0102
(0.000852) (0.00993) (0.0136) (0.00991) (0.00636) (0.00698) (0.00646)
Offensive SPM 0.0367 -0.653 -2.73 -0.612 -0.321 -0.692 -0.456
(0.108) (1.02) (1.85) (1.01) (0.638) (0.666) (0.640)
Defensive SPM 0.0270 0.326 0.238 0.327 0.445 0.472 0.448
(0.0477) (0.496) (0.702) (0.495) (0.349) (0.376) (0.351)
Offensive xRAPM 0.0015 -2.29* -4.73 -2.24* -0.0161 -0.304 -0.172
(0.0828) (1.14) (2.50) (1.12) (0.626) (0.648) (0.625)
Defensive xRAPM -0.0374 -0.956 -1.43 -0.947 -0.555 -0.546 -0.566
(0.0649) (0.714) (1.12) (0.711) (0.465) (0.498) (0.470)
Volume Metric OLS TSLS Probit First Stage
(1) (2) (3) (4) (5) (6) (7)
EWA 0.298 -1.56 -4.24 -1.50 1.78 1.84 1.69
(0.194) (1.99) (3.38) (1.98) (1.38) (1.41) (1.37)
WS 0.113 -0.670 -1.97 -0.644 0.171 0.223 0.145
(0.139) (1.36) (2.07) (1.36) (0.792) (0.780) (0.777)
Statistical WAR 0.114 -0.798 -2.95 -0.755 1.76 1.86 1.71
(0.154) (1.56) (2.59) (1.56) (1.05) (1.10) (1.04)
WAR 0.102 -3.46 -6.34 -3.41 1.17 1.34 1.09
(0.174) (2.06) (3.84) (2.05) (1.06) (1.16) (1.10)
Offensive WS 0.137 -0.682 -1.67 -0.662 0.470 0.527 0.446
(0.109) (1.10) (1.68) (1.10) (0.679) (0.681) (0.669)
Defensive WS -0.0282 0.0178 -0.243 0.0229 -0.288 -0.280 -0.286
(0.0533) (0.557) (0.796) (0.556) (0.387) (0.410) (0.388)
* p < 0.05; ** p < 0.01; *** p < 0.001. Standard errors are in parentheses
Source: Basketball-Reference.com, ShamSports.com, Spotrac.com & stats-for-the-nba.appspot.com.
(1) is OLS estimates based off equation (2). (2), (3), (4) use equations (1) and (2) in a two stage least squares framework; while (5), (6), (7) use fitted
probabilities from equation (3) as the instrument passed to the first stage.(2), (5) use 2010 indicator as the instrument; (3), (6) use the contract year
percent as the instrument; and (4), (7) use both. Full and reduced samples, performance metrics and instruments described in the text. All standard
errors are calculated robust to heteroskedasticity and clustered by player. Player-seasons are removed if less than 200 minutes

81
Table A.6.X: Performance over Expectation Estimates of Contract Year Effect
TSLS Estimates of Delta
Efficiency
Metric
Without Player Fixed Effects With Player Fixed Effects
(1) (2) (3) (4) (5) (6) (7) (8)
Full Sample
PER 0.2330 0.961 -0.251 0.260 0.479* 0.790 -1.930 0.338
(0.148) (0.995) (0.939) (0.912) (0.208) (2.03) (2.43) (2.00)
WS/48 0.00791*** 0.0183 0.00913 0.0130 0.00917** 0.03680 0.00801 0.0321
(0.00218) (0.0146) (0.0144) (0.0137) (0.00310) (0.0334) (0.0353) (0.0324)
SPM 0.299** 0.752 0.148 0.403 0.333* 0.422 -1.18 0.157
(0.0961) (0.638) (0.596) (0.583) (0.137) (1.30) (1.55) (1.28)
xRAPM 0.0624 0.945 -0.613 0.0438 0.177 -2.15 -4.12 -2.48
(0.0805) (0.630) (0.598) (0.570) (0.114) (1.42) (2.23) (1.50)
OWS/48 0.00467* 0.0163 0.00783 0.0114 0.00614* 0.0340 0.0119 0.0303
(0.00205) (0.0135) (0.0134) (0.0128) (0.00294) (0.0315) (0.0321) (0.0306)
DWS/48 0.00298** 0.00177 0.00146 0.00159 0.00267 0.00253 -0.00271 0.00166
(0.000897) (0.00655) (0.00634) (0.00608) (0.00125) (0.0130) (0.0159) (0.0131)
Reduced Sample
PER 0.217 0.117 -1.18 0.238 0.456* -0.562 -3.50 -0.0059
(0.164) (0.661) (0.834) (0.661) (0.202) (1.99) (3.09) (1.99)
WS/48 0.00738 0.0107 -0.00187 0.0119 0.00916** 0.0251 -0.0105 0.0257
(0.00247) (0.0102) (0.0132) (0.0102) (0.00302) (0.0312) (0.0390) (0.0313)
SPM 0.251* 0.364 -0.422 0.437 0.330* 0.306 -1.77 0.339
(0.106) (0.428) (0.533) (0.429) (0.133) (1.28) (1.86) (1.28)
xRAPM 0.0846 0.169 -1.23* 0.300 0.178 -2.23 -5.14 -2.18
(0.0906) (0.433) (0.555) (0.435) (0.111) (1.47) (2.98) (1.46)
OWS/48 0.00434 0.00720 -0.00475 0.00831 0.00600* 0.0175 -0.0137 0.0180
(0.00229) (0.00938) (0.0120) (0.00935) (0.00288) (0.0294) (0.0356) (0.0294)
DWS/48 0.00278** 0.00303 0.00319 0.00301 0.00280* 0.00661 0.00418 0.00665
(0.000991) (0.00465) (0.00587) (0.00466) (0.00121) (0.0128) (0.0170) (0.0128)
* p < 0.05; ** p < 0.01; *** p < 0.001. Standard errors are in parentheses
Source: Basketball-Reference.com, ShamSports.com, Spotrac.com & stats-for-the-nba.appspot.com.
(1), (5) are OLS estimates based off equation (4), without and with player fixed effects respectively
All others use an instrument in equation (3) to produce fitted probabilities, which are then passed as an instrument to equation (1) in the first stage and
equation (4) in the second
(2), (6) use 2010 indicator as the instrument; (3), (7) use the contract year percent as the instrument; and (4), (8) use both
Full and reduced sample as described in the text, are from 2005-2014. All standard errors are robust to heteroskedasticity and clustered by player.
Instruments are also described in the text. Player-seasons are removed if less than 200 minutes

82
Table A.6.XI: Performance over Expectation Estimates of Contract Year Effect
Probit First Stage Estimates of Delta
Efficiency
Metric
Without Player Fixed Effects With Player Fixed Effects
(1) (2) (3) (4) (5) (6) (7) (8)
Full Sample
PER 0.2330 1.51 0.349 0.824 0.479* - - -
(0.148) (0.942) (0.884) (0.859) (0.208) - - -
WS/48 0.00791*** 0.0214 0.0131 0.01660 0.00917** - - -
(0.00218) (0.0137) (0.0138) (0.0130) (0.00310) - - -
SPM 0.299** 0.921 0.317 0.577 0.333* - - -
(0.0961) (0.602) (0.570) (0.552) (0.137) - - -
xRAPM 0.0624 1.24 -0.386 0.304 0.177 - - -
(0.0805) (0.599) (0.572) (0.538) (0.114) - - -
OWS/48 0.00467* 0.0195 0.0123 0.0152 0.00614* - - -
(0.00205) (0.0128) (0.0129) (0.0122) (0.00294) - - -
DWS/48 0.00298** 0.00185 0.00108 0.00153 0.00267 - - -
(0.000897) (0.00605) (0.00608) (0.00569) (0.00125) - - -
Reduced Sample
PER 0.217 0.172 -1.05 0.2570 0.456* -0.0473 -0.615 -0.253
(0.164) (0.641) (0.811) (0.642) (0.202) (0.991) (0.930) (0.967)
WS/48 0.00738 0.0114 0.000214 0.0121 0.00916** 0.01290 0.00680 0.0109
(0.00247) (0.00989) (0.0129) (0.00987) (0.00302) (0.0162) (0.0154) (0.0158)
SPM 0.251* 0.357 -0.411 0.409 0.330* -0.204 -0.561 -0.326
(0.106) (0.415) (0.520) (0.415) (0.133) (0.614) (0.593) (0.605)
xRAPM 0.0846 0.248 -1.20* 0.349 0.178 -0.000770 -0.309 -0.171
(0.0906) (0.424) (0.556) (0.426) (0.111) (0.603) (0.587) (0.597)
OWS/48 0.00434 0.00732 -0.00327 0.00806 0.00600* 0.00690 0.00213 0.00534
(0.00229) (0.00916) (0.0118) (0.00914) (0.00288) (0.0136) (0.0127) (0.0132)
DWS/48 0.00278** 0.00361 0.00392 0.00358 0.00280* 0.00557 0.00482 0.00533
(0.000991) (0.00450) (0.00578) (0.00450) (0.00121) (0.00735) (0.00734) (0.00728)
* p < 0.05; ** p < 0.01; *** p < 0.001. Standard errors are in parentheses
Source: Basketball-Reference.com, ShamSports.com, Spotrac.com & stats-for-the-nba.appspot.com.
(1), (5) are OLS estimates based off equation (4), without and with player fixed effects respectively
All others use an instrument in equation (3) to produce fitted probabilities, which are then passed as an instrument to equation (1) in the first stage and
equation (4) in the second
(2), (6) use 2010 indicator as the instrument; (3), (7) use the contract year percent as the instrument; and (4), (8) use both
Full and reduced sample as described in the text, are from 2005-2014. All standard errors are robust to heteroskedasticity and clustered by player.
Instruments are also described in the text. Player-seasons are removed if less than 200 minutes

83
Table A.6.XIII: Contract Year Effect Estimates on Box Score Statistics
Estimates of Delta
Box Score Statistic Sample
Full Reduced
Points per 36 Minutes 0.0475 0.0236
(0.168) (0.163)
Assists per 36 Minutes 0.0620 0.0718
(0.0543) (0.0528)
Offensive Rebounds per 36
Minutes
0.0795* 0.0771*
(0.0342) (0.0334)
Defensive Rebounds per 36
Minutes
0.0828 0.0800
(0.0591) (0.0571)
Blocks per 36 Minutes 0.0137 0.00851
(0.0240) (0.0235)
Steals per 36 Minutes 0.0370 0.0405
(0.0214) (0.0208)
Turnovers per 36 Minutes -0.00495 -0.00382
(0.0295) (0.0288)
* p < 0.05; ** p < 0.01; *** p < 0.001. Standard errors are in parentheses
Source: Basketball-Reference.com, ShamSports.com & Spotrac.com.
Full and reduced sample as described in the text, are from 2005-2014. OLS estimates based off equation
(4) in text. All standard errors are robust to heteroskedasticity and clustered by year. Baseline covariates
include position dummies, height, weight, age, year dummies and SRS as a team quality measure, as
outlined in the text. Player-seasons are removed if less than 200 minutes