shrm customized paid leave benchmarking report...5 shrm customized paid leave benchmarking report...
TRANSCRIPT

SHRMCUSTOMIZEDPAID LEAVE BENCHMARKINGREPORT

THANK YOU FOR ORDERING A
SHRM CUSTOMIZED
PAID LEAVE BENCHMARKING REPORT
Your report is based on the following criteria:
SELECTION CRITERIA
Industry:
Staff Size:
Your organization’s industry
Your organization’s staff size
SHRM Customized Human Capital,
Health Care, Employee Benefits
Prevalence, and Talent Acquisition
Reports are also available. Please visit our
website at shrm.org/benchmarks
1
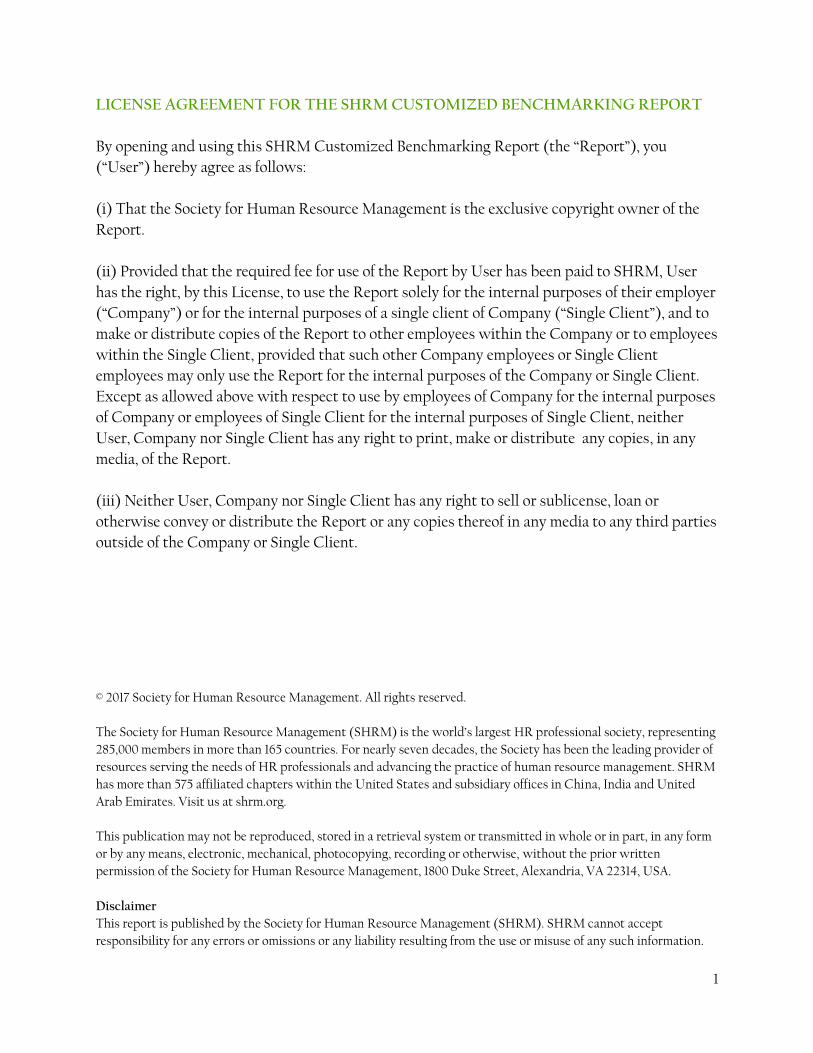
LICENSE AGREEMENT FOR THE SHRM CUSTOMIZED BENCHMARKING REPORT
By opening and using this SHRM Customized Benchmarking Report (the “Report”), you
(“User”) hereby agree as follows:
(i) That the Society for Human Resource Management is the exclusive copyright owner of the
Report.
(ii) Provided that the required fee for use of the Report by User has been paid to SHRM, User
has the right, by this License, to use the Report solely for the internal purposes of their employer
(“Company”) or for the internal purposes of a single client of Company (“Single Client”), and to
make or distribute copies of the Report to other employees within the Company or to employees
within the Single Client, provided that such other Company employees or Single Client
employees may only use the Report for the internal purposes of the Company or Single Client.
Except as allowed above with respect to use by employees of Company for the internal purposes
of Company or employees of Single Client for the internal purposes of Single Client, neither
User, Company nor Single Client has any right to print, make or distribute any copies, in any
media, of the Report.
(iii) Neither User, Company nor Single Client has any right to sell or sublicense, loan or
otherwise convey or distribute the Report or any copies thereof in any media to any third parties
outside of the Company or Single Client.
© 2017 Society for Human Resource Management. All rights reserved.
The Society for Human Resource Management (SHRM) is the world’s largest HR professional society, representing
285,000 members in more than 165 countries. For nearly seven decades, the Society has been the leading provider of
resources serving the needs of HR professionals and advancing the practice of human resource management. SHRM
has more than 575 affiliated chapters within the United States and subsidiary offices in China, India and United
Arab Emirates. Visit us at shrm.org.
This publication may not be reproduced, stored in a retrieval system or transmitted in whole or in part, in any form
or by any means, electronic, mechanical, photocopying, recording or otherwise, without the prior written
permission of the Society for Human Resource Management, 1800 Duke Street, Alexandria, VA 22314, USA.
Disclaimer
This report is published by the Society for Human Resource Management (SHRM). SHRM cannot accept
responsibility for any errors or omissions or any liability resulting from the use or misuse of any such information.
2
TABLE OF CONTENTS
License Agreement for the SHRM Customized Benchmarking Report 1
A Guide to Your SHRM® Customized Benchmarking Report 3
Customized Tables Based on Your Criteria 5
Paid Leave Glossary of Metric Terms, Definitions and Calculations 32
3
A GUIDE TO YOUR SHRM® CUSTOMIZED BENCHMARKING REPORT
Understanding the Data
As you compare your own data against data
from other organizations, please keep the
following in mind:
1. This report is based on data derived from
the SHRM Customized Benchmarking
Database, which contains organizational
data from a random sample of SHRM
members. The report is designed to target
companies that closely match the selected
criteria to allow for a more focused and
comparable analysis and interpretation.
Therefore, any interpretations of these data
should be kept within this context.
2. A deviation between your figure for any
benchmarking measure and the comparative
figure is not necessarily favorable or
unfavorable; it is merely an indication that
additional analyses may be needed.
Benchmarking measures that relate more
closely to the context of your organization’s
industry and organization staff size are
more descriptive and meaningful than
information that is more generic in nature,
such as all industries combined. The larger
the discrepancy between your figure and
those found in this report, the greater the
need for additional scrutiny.
3. In cases where you determine that
potentially serious deviations do exist, it
may be helpful to go back and calculate the
same benchmarking measure for your
organization over the past several years to
identify any trends that may exist.
4. The information in this report should be
used as a tool for decision-making rather
than an absolute standard. Because
companies differ in their overall business
strategy, location, staff size and other
factors, any two companies can be well
managed, yet some of their benchmarking
measures may differ greatly. No decision
should be made solely based on the results
of any one study.
Working with the Data
The information in this report is designed to
be a tool to help you evaluate decisions and
activities that affect your organization.
When reviewing these data, it is important

4
to realize that business strategy,
organizational culture, leadership behaviors
and industry pressures are just a few of the
many factors that drive various
organizational measures. Absolute measures
are not meaningful in isolation—they
should be compared with one or more
measures to determine whether a
satisfactory level exists. Other measures, for
example, might be your organization’s past
results in this area or comparatives based on
organizational staff size, industry or
geographic location.
Each table in the report contains
customized benchmarks in aggregated form.
There may be discrepancies between your
organization’s benchmarks and the average
or median numbers for a particular category.
It is particularly helpful to communicate to
stakeholders that just because your
organization has benchmarks that are
different from the average or median, it does
not mean they are favorable or unfavorable.
Rather, it may be the result of a particular
total organizational strategy, special
circumstances or other business initiatives
that cause differences with your
organization’s benchmarks.
Notes
The data in this report were collected from
November 2015 to January 2016 and reflect
the previous 12 months.
The number of respondents, indicated by
“n,” represents the organizations that
responded to the specific benchmark.
Therefore, the number of peer organizations
may vary from benchmark to benchmark.
The percentile is the percentage of
responses in a group that have values less
than or equal to that particular value. The
median is the 50th percentile. The average, or
mean, is the sum of the responses divided by
the total number of responses.
Some benchmarks are less frequently
collected by organizations or may be more
difficult to obtain. Some data are not
displayed when there are fewer than five
organizations for a specific metric.
5
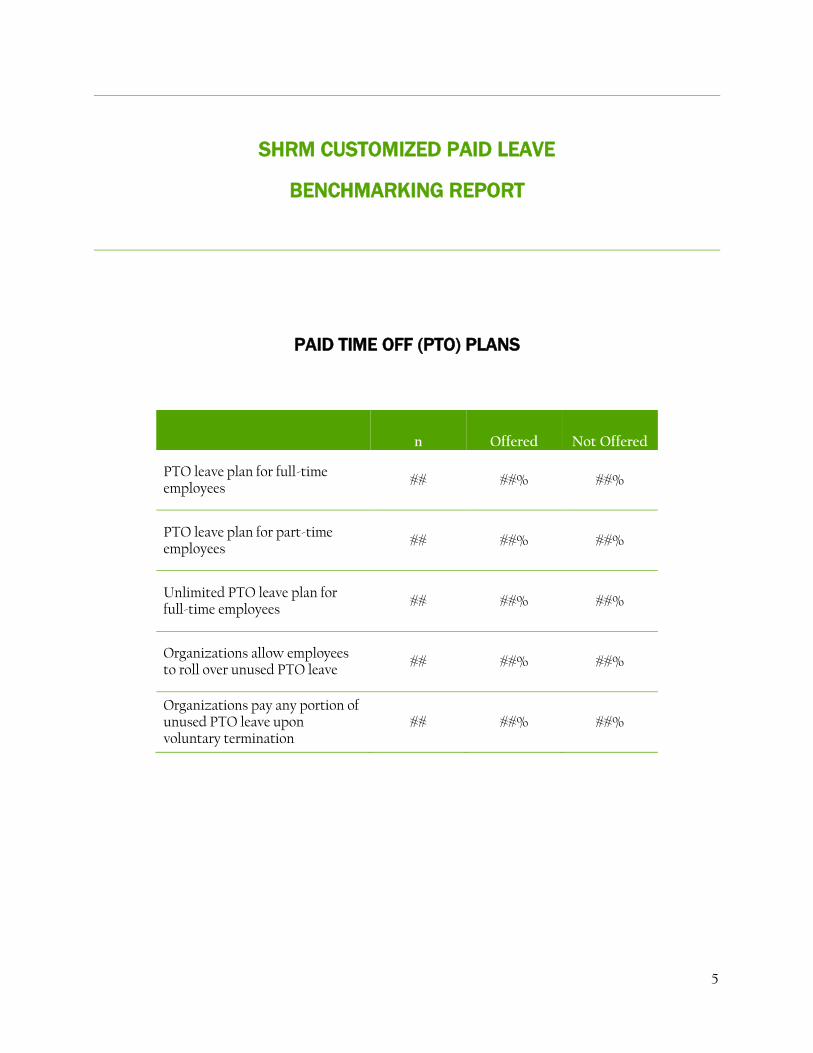
SHRM CUSTOMIZED PAID LEAVE
BENCHMARKING REPORT
PAID TIME OFF (PTO) PLANS
n Offered Not Offered
PTO leave plan for full-time employees
## ##% ##%
PTO leave plan for part-time employees
## ##% ##%
Unlimited PTO leave plan for full-time employees
## ##% ##%
Organizations allow employees to roll over unused PTO leave
## ##% ##%
Organizations pay any portion of unused PTO leave upon voluntary termination
## ##% ##%

6
SHRM CUSTOMIZED PAID LEAVE
BENCHMARKING REPORT
PAID TIME OFF PLANS
n PTO
Leave Accrual
By anniversary date ## ##%
By calendar year ## ##%
By fiscal year ## ##%
By month ## ##%
By pay period ## ##%
By other time period ## ##%
7
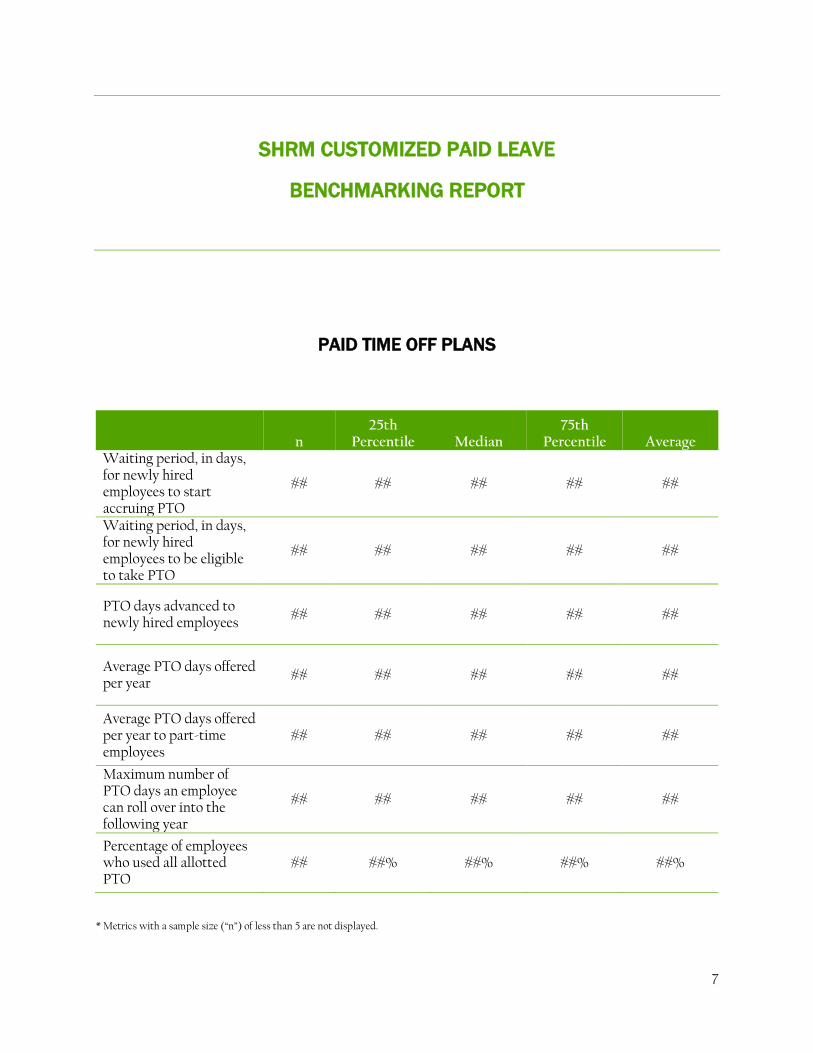
SHRM CUSTOMIZED PAID LEAVE
BENCHMARKING REPORT
PAID TIME OFF PLANS
n 25th
Percentile Median 75th
Percentile Average Waiting period, in days, for newly hired employees to start accruing PTO
## ## ## ## ##
Waiting period, in days, for newly hired employees to be eligible to take PTO
## ## ## ## ##
PTO days advanced to newly hired employees
## ## ## ## ##
Average PTO days offered per year
## ## ## ## ##
Average PTO days offered per year to part-time employees
## ## ## ## ##
Maximum number of PTO days an employee can roll over into the following year
## ## ## ## ##
Percentage of employees who used all allotted PTO
## ##% ##% ##% ##%
* Metrics with a sample size (“n”) of less than 5 are not displayed.

8
SHRM CUSTOMIZED PAID LEAVE
BENCHMARKING REPORT
PAID TIME OFF PLANS
n 25th
Percentile Median 75th
Percentile Average
PTO days for less than one year of service
## ## ## ## ##
PTO days for one year of service
## ## ## ## ##
PTO days for two years of service
## ## ## ## ##
PTO days for three years of service
## ## ## ## ##
* Metrics with a sample size (“n”) of less than 5 are not displayed.

9
SHRM CUSTOMIZED PAID LEAVE
BENCHMARKING REPORT
PAID TIME OFF PLANS
n 25th
Percentile Median 75th
Percentile Average
PTO days for four years of service
## ## ## ## ##
PTO days for five through nine years of service
## ## ## ## ##
PTO days for 10 through 19 years of service
## ## ## ## ##
PTO days for 20 or more years of service
## ## ## ## ##
* Metrics with a sample size (“n”) of less than 5 are not displayed.
10
SHRM CUSTOMIZED PAID LEAVE
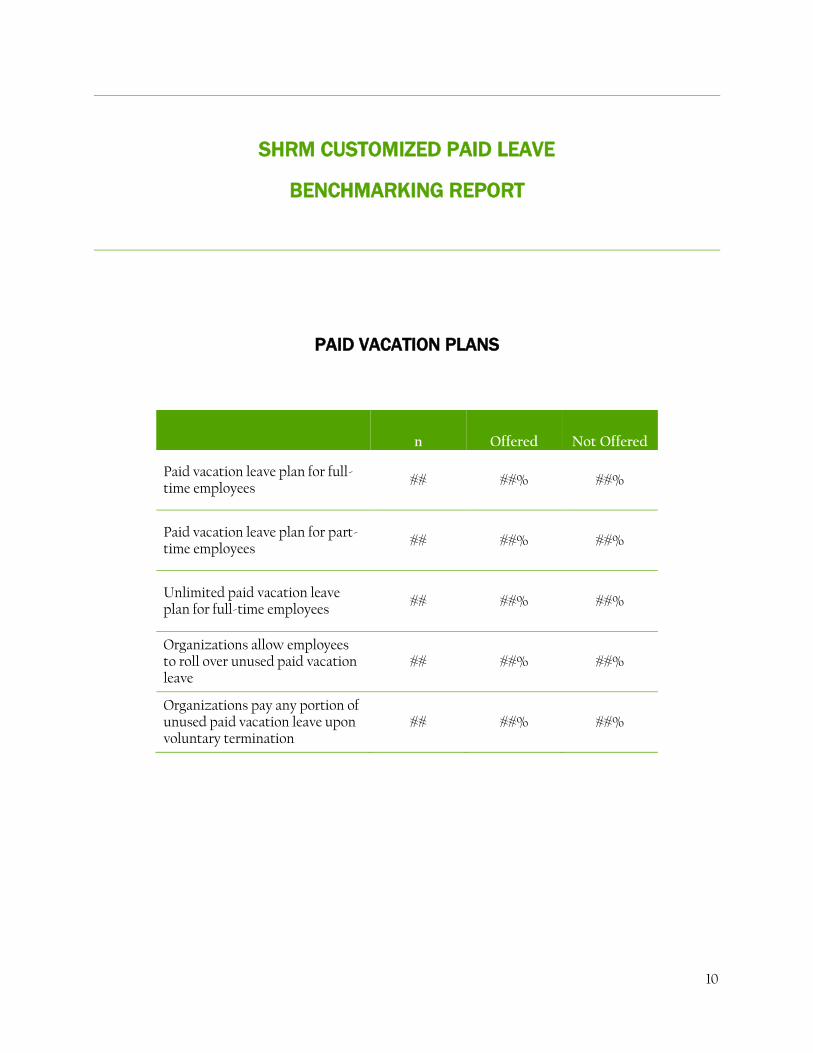
BENCHMARKING REPORT
PAID VACATION PLANS
n Offered Not Offered
Paid vacation leave plan for full-time employees
## ##% ##%
Paid vacation leave plan for part-time employees
## ##% ##%
Unlimited paid vacation leave plan for full-time employees
## ##% ##%
Organizations allow employees to roll over unused paid vacation leave
## ##% ##%
Organizations pay any portion of unused paid vacation leave upon voluntary termination
## ##% ##%

11
SHRM CUSTOMIZED PAID LEAVE
BENCHMARKING REPORT
PAID VACATION PLANS
n
Paid Vacation
Leave Accrual
By anniversary date ## ##%
By calendar year ## ##%
By fiscal year ## ##%
By month ## ##%
By pay period ## ##%
By other time period ## ##%
12
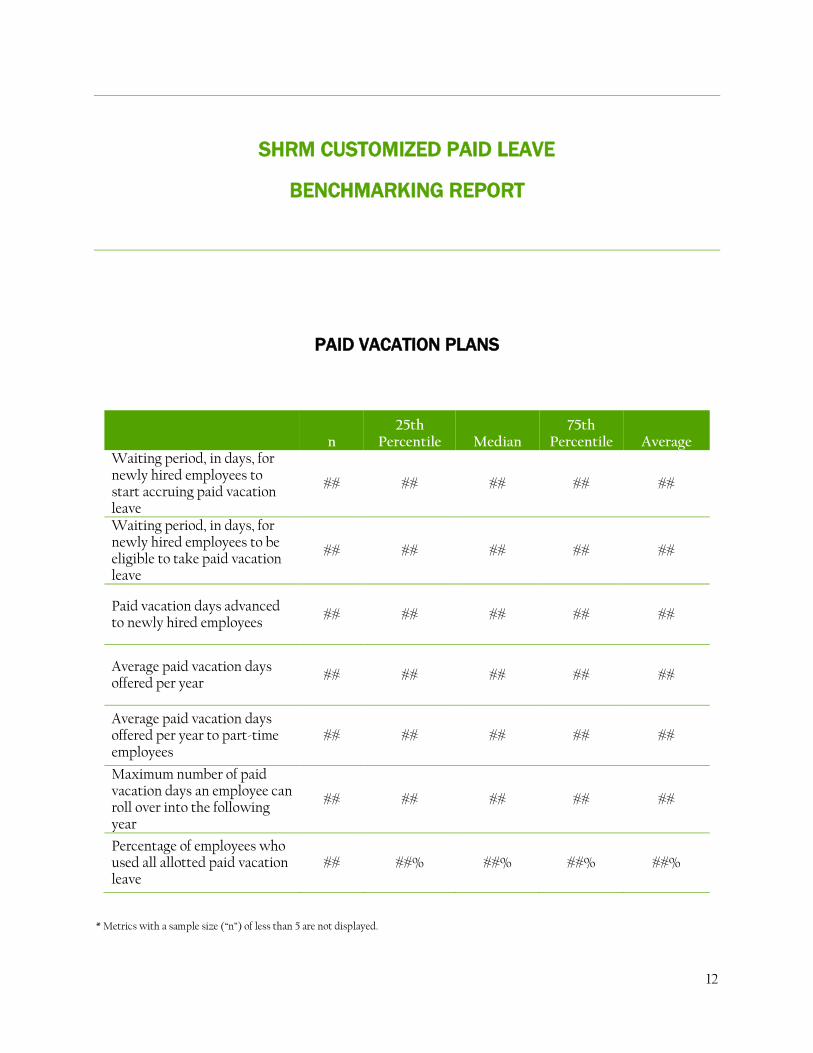
SHRM CUSTOMIZED PAID LEAVE
BENCHMARKING REPORT
PAID VACATION PLANS
n 25th
Percentile Median 75th
Percentile Average Waiting period, in days, for newly hired employees to start accruing paid vacation leave
## ## ## ## ##
Waiting period, in days, for newly hired employees to be eligible to take paid vacation leave
## ## ## ## ##
Paid vacation days advanced to newly hired employees
## ## ## ## ##
Average paid vacation days offered per year
## ## ## ## ##
Average paid vacation days offered per year to part-time employees
## ## ## ## ##
Maximum number of paid vacation days an employee can roll over into the following year
## ## ## ## ##
Percentage of employees who used all allotted paid vacation leave
## ##% ##% ##% ##%
* Metrics with a sample size (“n”) of less than 5 are not displayed.

13
SHRM CUSTOMIZED PAID LEAVE
BENCHMARKING REPORT
PAID VACATION PLANS
n 25th
Percentile Median 75th
Percentile Average
Paid vacation days for less than one year of service
## ## ## ## ##
Paid vacation days for one year of service
## ## ## ## ##
Paid vacation days for two years of service
## ## ## ## ##
Paid vacation days for three years of service
## ## ## ## ##
* Metrics with a sample size (“n”) of less than 5 are not displayed.

14
SHRM CUSTOMIZED PAID LEAVE
BENCHMARKING REPORT
PAID VACATION PLANS
n 25th
Percentile Median 75th
Percentile Average
Paid vacation days for four years of service
## ## ## ## ##
Paid vacation days for five through nine years
## ## ## ## ##
Paid vacation days for 10 through 19 years of service
## ## ## ## ##
Paid vacation days for 20 or more years of service
## ## ## ## ##
* Metrics with a sample size (“n”) of less than 5 are not displayed.

15
SHRM CUSTOMIZED PAID LEAVE
BENCHMARKING REPORT
PAID SICK LEAVE PLANS
n Offered Not Offered
Paid sick leave plan for full-time employees
## ##% ##%
Paid sick leave plan for part-time employees
## ##% ##%
Unlimited paid sick leave plan for full-time employees
## ##% ##%
Organizations allow employees to roll over unused paid sick leave
## ##% ##%
Organizations pay any portion of unused paid sick leave upon voluntary termination
## ##% ##%

16
SHRM CUSTOMIZED PAID LEAVE
BENCHMARKING REPORT
PAID SICK LEAVE PLANS
n
Paid Sick Leave
Accrual
By anniversary date ## ##%
By calendar year ## ##%
By fiscal year ## ##%
By month ## ##%
By pay period ## ##%
By other time period ## ##%
17
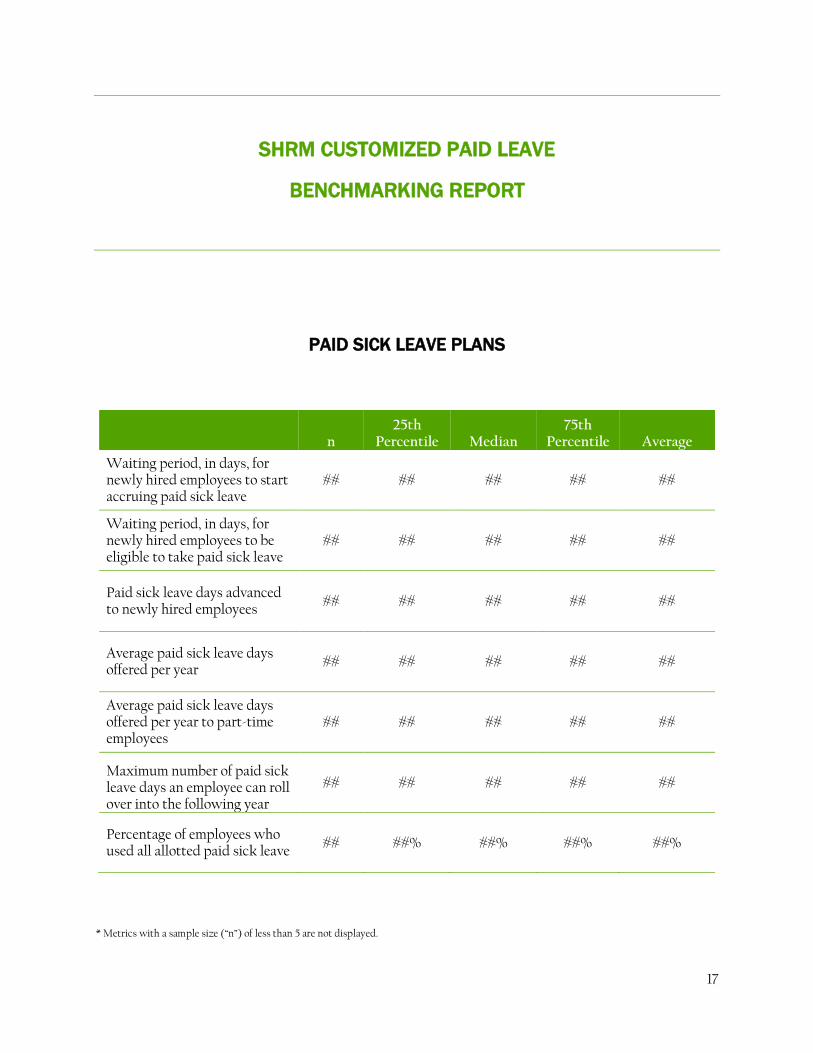
SHRM CUSTOMIZED PAID LEAVE
BENCHMARKING REPORT
PAID SICK LEAVE PLANS
n 25th
Percentile Median 75th
Percentile Average
Waiting period, in days, for newly hired employees to start accruing paid sick leave
## ## ## ## ##
Waiting period, in days, for newly hired employees to be eligible to take paid sick leave
## ## ## ## ##
Paid sick leave days advanced to newly hired employees
## ## ## ## ##
Average paid sick leave days offered per year
## ## ## ## ##
Average paid sick leave days offered per year to part-time employees
## ## ## ## ##
Maximum number of paid sick leave days an employee can roll over into the following year
## ## ## ## ##
Percentage of employees who used all allotted paid sick leave
## ##% ##% ##% ##%
* Metrics with a sample size (“n”) of less than 5 are not displayed.
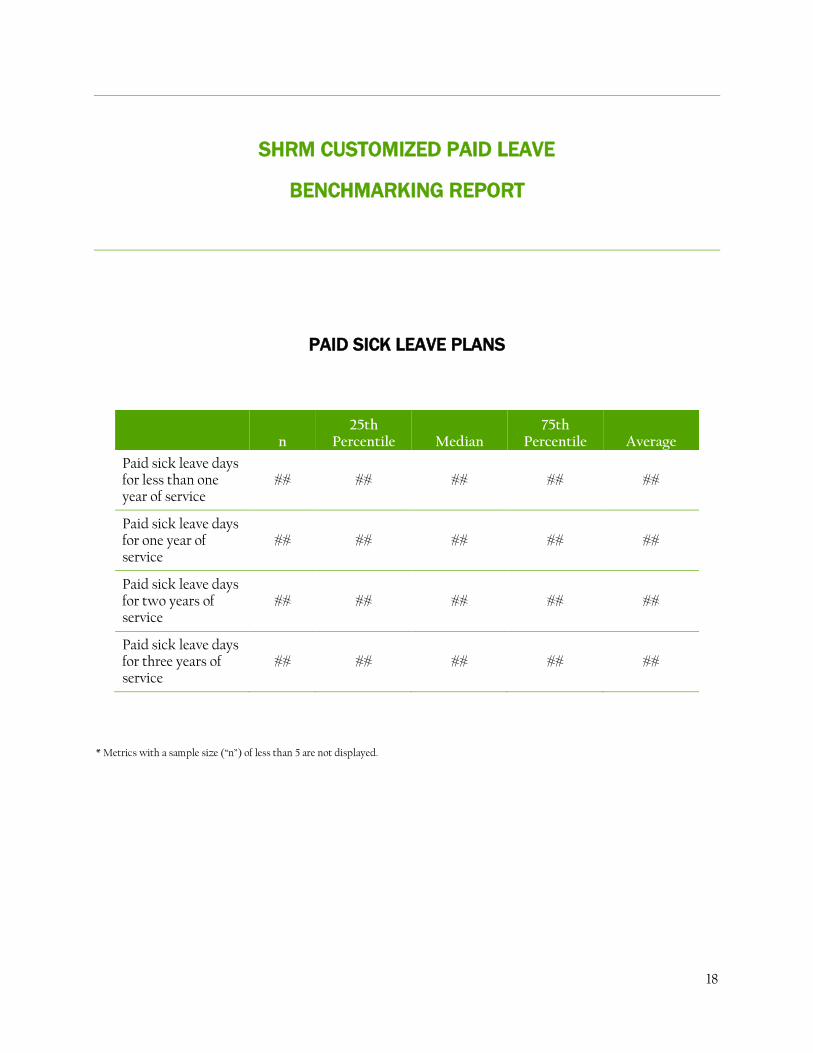
18
SHRM CUSTOMIZED PAID LEAVE
BENCHMARKING REPORT
PAID SICK LEAVE PLANS
n 25th
Percentile Median 75th
Percentile Average
Paid sick leave days for less than one year of service
## ## ## ## ##
Paid sick leave days for one year of service
## ## ## ## ##
Paid sick leave days for two years of service
## ## ## ## ##
Paid sick leave days for three years of service
## ## ## ## ##
* Metrics with a sample size (“n”) of less than 5 are not displayed.
19
SHRM CUSTOMIZED PAID LEAVE
BENCHMARKING REPORT
PAID SICK LEAVE PLANS
n 25th
Percentile Median 75th
Percentile Average
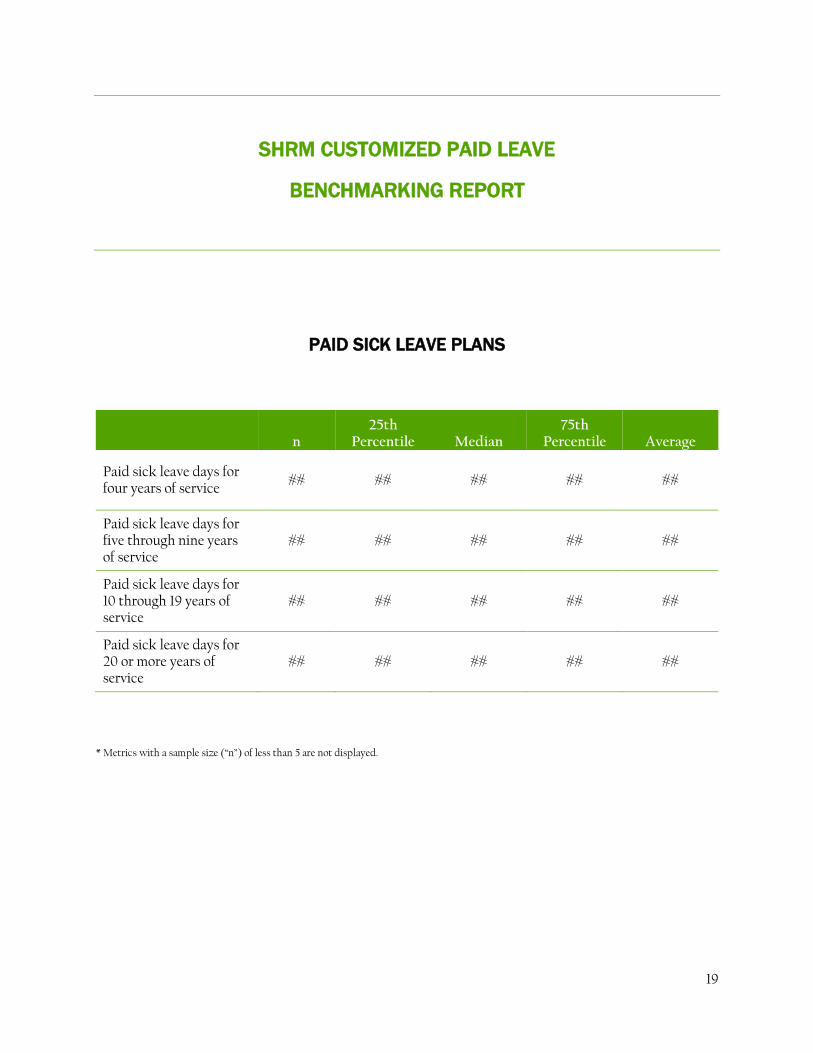
Paid sick leave days for four years of service
## ## ## ## ##
Paid sick leave days for five through nine years of service
## ## ## ## ##
Paid sick leave days for 10 through 19 years of service
## ## ## ## ##
Paid sick leave days for 20 or more years of service
## ## ## ## ##
* Metrics with a sample size (“n”) of less than 5 are not displayed.

20
SHRM CUSTOMIZED PAID LEAVE
BENCHMARKING REPORT
PAID PERSONAL LEAVE PLANS
n Offered Not Offered
Paid personal leave plan for full-time employees
## ##% ##%
Paid personal leave plan for part-time employees
## ##% ##%
Unlimited paid personal leave plan for full-time employees
## ##% ##%
Organizations allow employees to roll over unused paid personal leave
## ##% ##%
Organizations pay any portion of unused paid personal leave upon voluntary termination
## ##% ##%
21
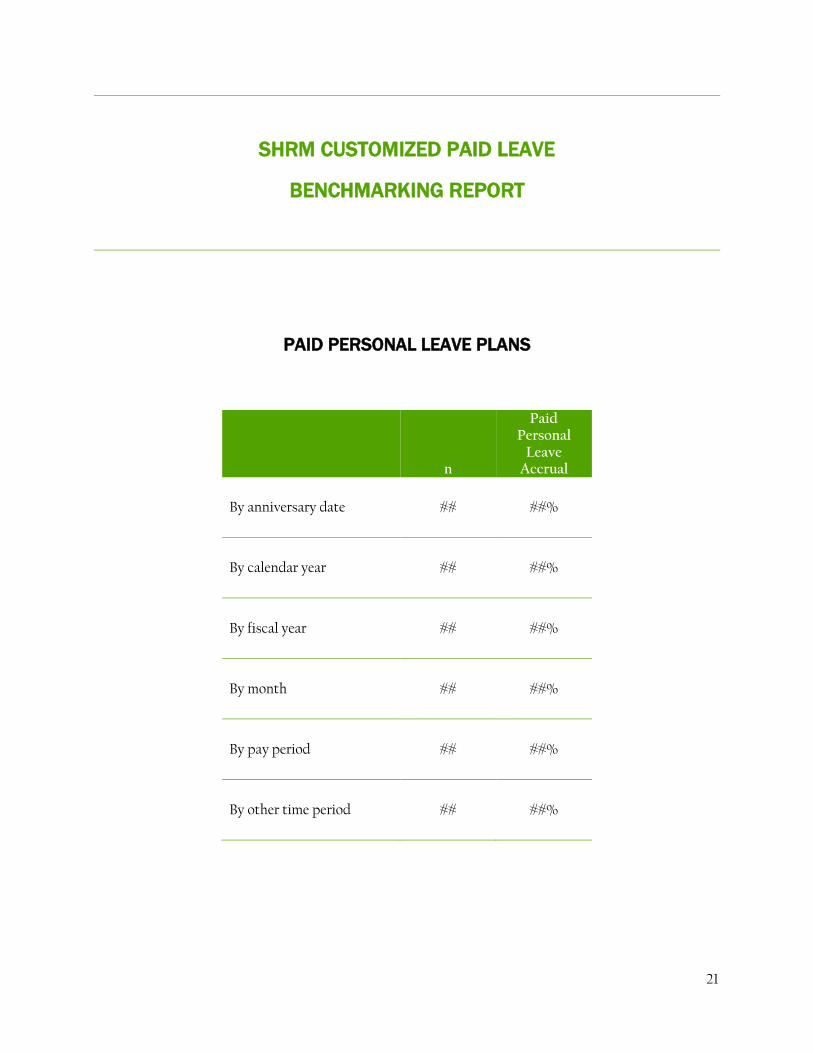
SHRM CUSTOMIZED PAID LEAVE
BENCHMARKING REPORT
PAID PERSONAL LEAVE PLANS
n
Paid Personal
Leave Accrual
By anniversary date ## ##%
By calendar year ## ##%
By fiscal year ## ##%
By month ## ##%
By pay period ## ##%
By other time period ## ##%
22
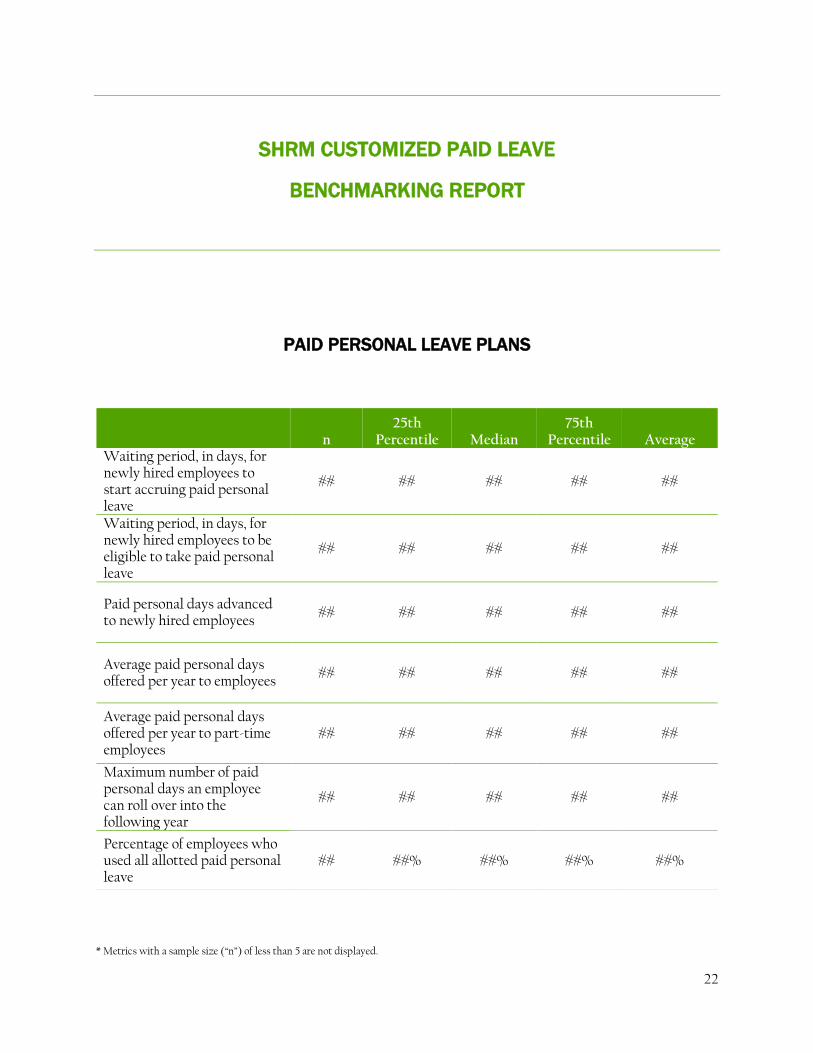
SHRM CUSTOMIZED PAID LEAVE
BENCHMARKING REPORT
PAID PERSONAL LEAVE PLANS
* Metrics with a sample size (“n”) of less than 5 are not displayed.
n 25th
Percentile Median 75th
Percentile Average Waiting period, in days, for newly hired employees to start accruing paid personal leave
## ## ## ## ##
Waiting period, in days, for newly hired employees to be eligible to take paid personal leave
## ## ## ## ##
Paid personal days advanced to newly hired employees
## ## ## ## ##
Average paid personal days offered per year to employees
## ## ## ## ##
Average paid personal days offered per year to part-time employees
## ## ## ## ##
Maximum number of paid personal days an employee can roll over into the following year
## ## ## ## ##
Percentage of employees who used all allotted paid personal leave
## ##% ##% ##% ##%

23
SHRM CUSTOMIZED PAID LEAVE
BENCHMARKING REPORT
PAID PERSONAL LEAVE PLANS
n 25th
Percentile Median 75th
Percentile Average
Paid personal leave days for less than one year of service
## ## ## ## ##
Paid personal leave days for one year of service
## ## ## ## ##
Paid personal leave days for two years of service
## ## ## ## ##
Paid personal leave days for three years of service
## ## ## ## ##
* Metrics with a sample size (“n”) of less than 5 are not displayed.
24
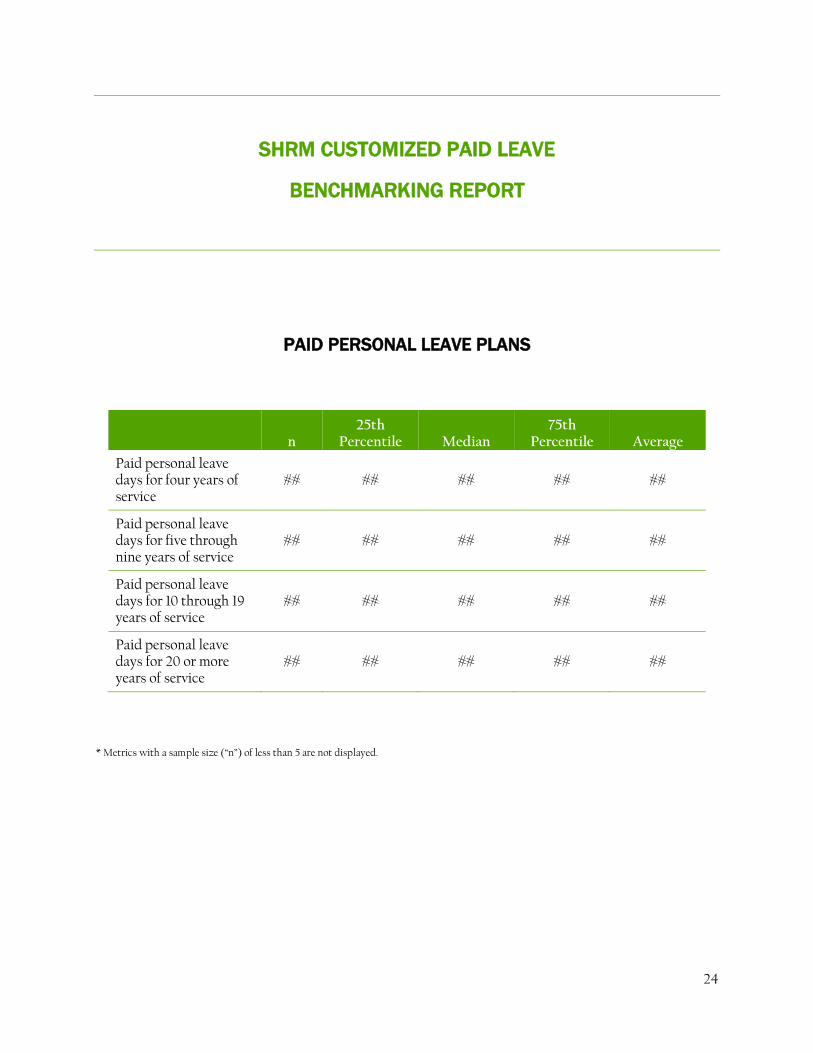
SHRM CUSTOMIZED PAID LEAVE
BENCHMARKING REPORT
PAID PERSONAL LEAVE PLANS
n 25th
Percentile Median 75th
Percentile Average
Paid personal leave days for four years of service
## ## ## ## ##
Paid personal leave days for five through nine years of service
## ## ## ## ##
Paid personal leave days for 10 through 19 years of service
## ## ## ## ##
Paid personal leave days for 20 or more years of service
## ## ## ## ##
* Metrics with a sample size (“n”) of less than 5 are not displayed.
25
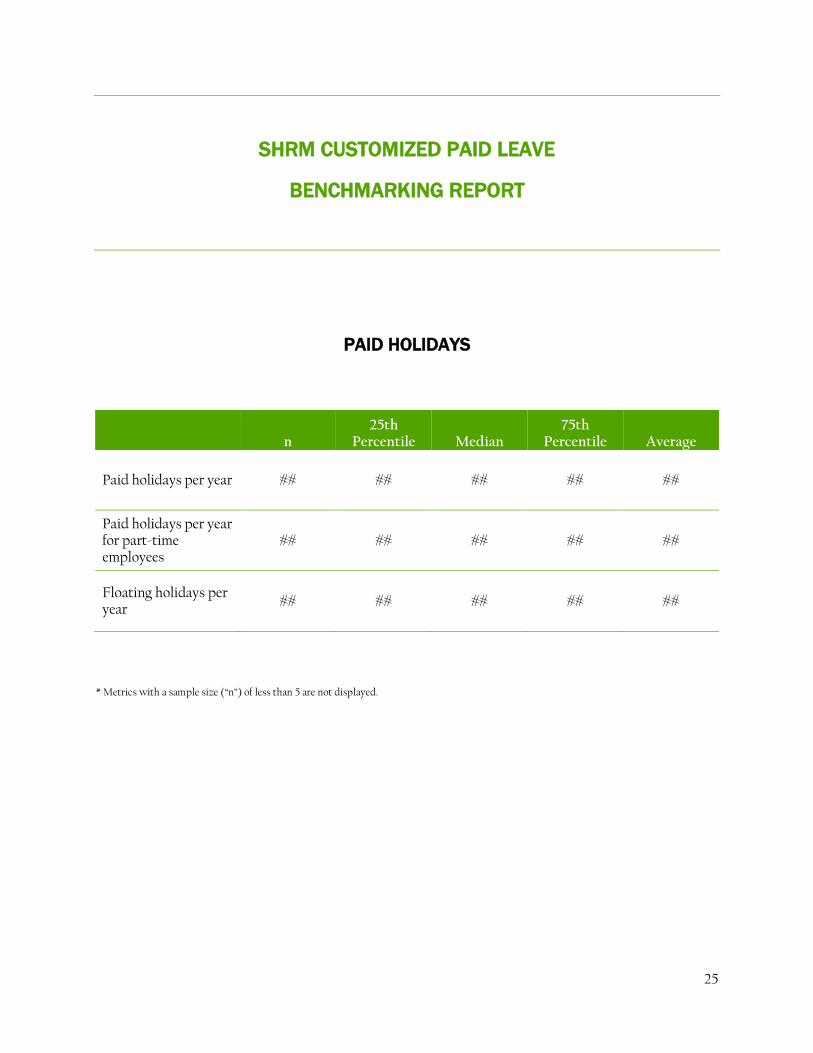
SHRM CUSTOMIZED PAID LEAVE
BENCHMARKING REPORT
PAID HOLIDAYS
n 25th
Percentile Median 75th
Percentile Average
Paid holidays per year ## ## ## ## ##
Paid holidays per year for part-time employees
## ## ## ## ##
Floating holidays per year
## ## ## ## ##
* Metrics with a sample size (“n”) of less than 5 are not displayed.

26
SHRM CUSTOMIZED PAID LEAVE
BENCHMARKING REPORT
PAID BEREAVEMENT LEAVE
n Offered Not
Offered
Paid bereavement leave for full-time employees
## ##% ##%
n 25th
Percentile Median 75th
Percentile Average
Days of paid bereavement leave for loss of a spouse
## ## ## ## ##
Days of paid bereavement leave for loss of a same-sex domestic partner
## ## ## ## ##
Days of paid bereavement leave for loss of an opposite-sex domestic partner
## ## ## ## ##
* Metrics with a sample size (“n”) of less than 5 are not displayed.
27
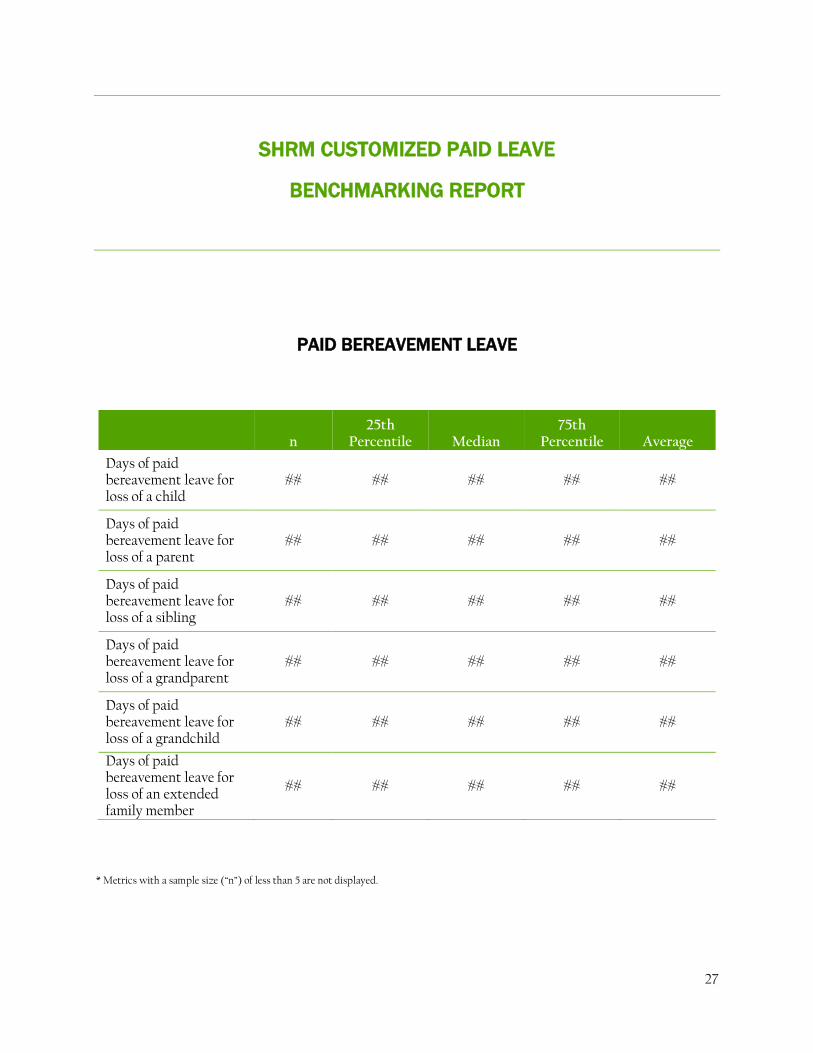
SHRM CUSTOMIZED PAID LEAVE
BENCHMARKING REPORT
PAID BEREAVEMENT LEAVE
n 25th
Percentile Median 75th
Percentile Average
Days of paid bereavement leave for loss of a child
## ## ## ## ##
Days of paid bereavement leave for loss of a parent
## ## ## ## ##
Days of paid bereavement leave for loss of a sibling
## ## ## ## ##
Days of paid bereavement leave for loss of a grandparent
## ## ## ## ##
Days of paid bereavement leave for loss of a grandchild
## ## ## ## ##
Days of paid bereavement leave for loss of an extended family member
## ## ## ## ##
* Metrics with a sample size (“n”) of less than 5 are not displayed.

28
SHRM CUSTOMIZED PAID LEAVE
BENCHMARKING REPORT
PAID SABBATICAL LEAVE
n Offered Not
Offered
Paid sabbatical program for full-time employees
## ##% ##%
n 25th
Percentile Median 75th
Percentile Average
Maximum number of paid sabbatical days available to eligible employees
## ## ## ## ##
* Metrics with a sample size (“n”) of less than 5 are not displayed.
29
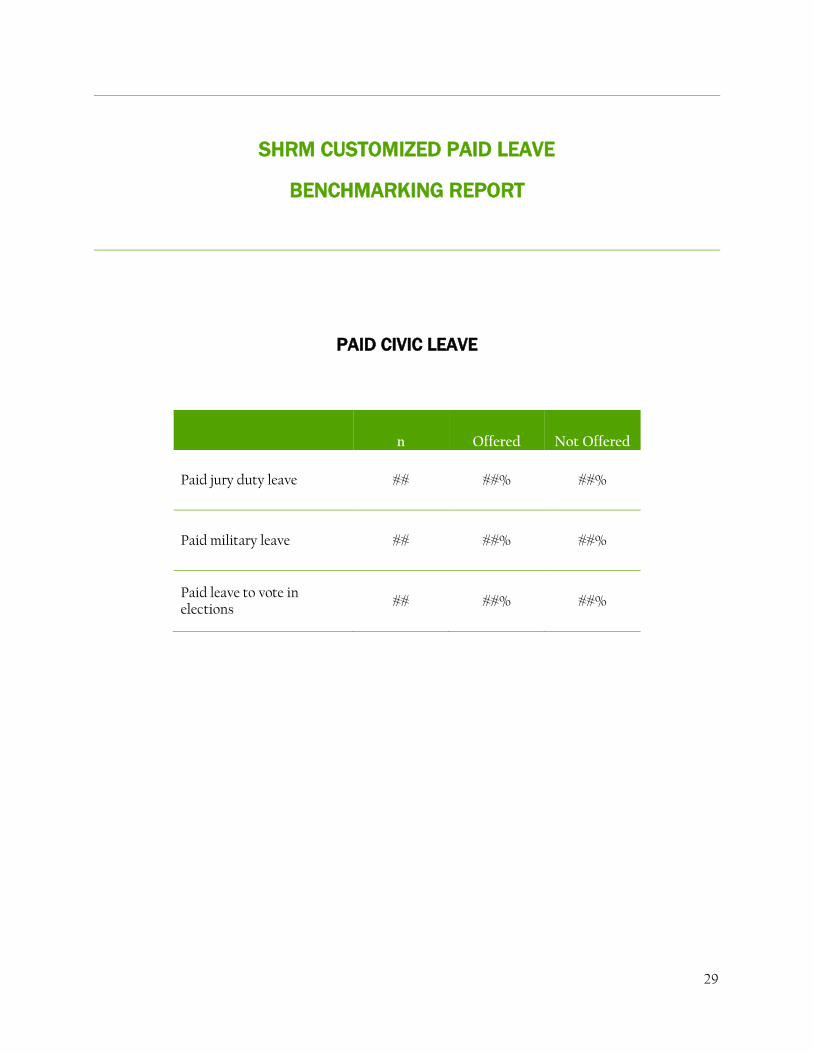
SHRM CUSTOMIZED PAID LEAVE
BENCHMARKING REPORT
PAID CIVIC LEAVE
n Offered Not Offered
Paid jury duty leave ## ##% ##%
Paid military leave ## ##% ##%
Paid leave to vote in elections
## ##% ##%

30
SHRM CUSTOMIZED PAID LEAVE
BENCHMARKING REPORT
PAID PARENTAL LEAVE
n Offered Not Offered
Paid maternity leave prevalence
## ##% ##%
Paid paternity leave prevalence
## ##% ##%
Paid adoption leave prevalence
## ##% ##%

31
SHRM CUSTOMIZED PAID LEAVE
BENCHMARKING REPORT
PAID PARENTAL LEAVE
n 25th
Percentile Median 75th
Percentile Average
Paid maternity leave days ## ## ## ## ##
Paid paternity leave days ## ## ## ## ##
Paid adoption leave days ## ## ## ## ##
32
PAID LEAVE GLOSSARY OF METRIC TERMS, DEFINITIONS AND
CALCULATIONS
Statistical Definitions
“ n ”
The letter “n” in tables and figures indicates
the number of respondents to each question.
In other words, when it is noted that n = 25,
it indicates that the number of respondents
was 25.
Percentile
The percentile is the percentage of
responses in a group that have values less
than or equal to that particular value. For
example, when data are arranged from
lowest to highest, the 25th percentile is the
point at which 75% of the data are above it
and 25% are below it. Conversely, the 75th
percentile is the point at which 25% of the
data are above it and 75% are below it.
Median (50th percentile)
The median is the midpoint of the set of
numbers or values arranged in ascending
order. It is recommended that the median is
used as a basis for all interpretations of the
data when the average and median are
discrepant.
Average
The average is the sum of the responses
divided by the total number of responses. It
is also known as the mean. This measure is
affected more than the median by the
occurrence of outliers (extreme values). For
this reason, the average reported may be
greater than the 75th percentile or less than
the 25th percentile.
Paid Time Off (PTO) Plans
Paid time off plans
A paid time off (PTO) plan includes sick,
vacation and personal days all in one plan.
This excludes paid holidays such as Labor
Day, Memorial Day and Thanksgiving.
PTO leave plan for full-time employees
This metric indicates the percentage of
organizations offering a PTO plan to full-
time employees.

33
PTO leave plan for part-time employees
This metric indicates the percentage of
organizations offering a PTO plan to part-
time employees.
Unlimited PTO leave plan for full-time
employees
This metric indicates the percentage of
organizations offering unlimited PTO to
full-time employees.
Organizations allow employees to roll
over unused PTO leave
This metric indicates the percentage of
organizations that allow full-time
employees to carry over unused PTO into
the subsequent year.
Organizations pay any portion of unused
PTO leave upon voluntary termination
This metric indicates the percentage of
organizations that compensate full-time
employees for unused PTO at the point of
voluntary separation.
Organizations with PTO leave accrual
by anniversary date
This metric indicates the percentage of
organizations in which full-time employees
accrue PTO leave annually by date of hire.
Organizations with PTO leave accrual by
calendar year
This metric indicates the percentage of
organizations in which full-time employees
accrue PTO leave annually by the calendar
year.
Organizations with PTO leave accrual by
fiscal year
This metric indicates the percentage of
organizations in which full-time employees
accrue PTO leave annually by the fiscal year.
Organizations with PTO leave accrual by
month
This metric indicates the percentage of
organizations in which full-time employees
accrue PTO leave monthly.
Organizations with PTO leave accrual by
pay period
This metric indicates the percentage of
organizations in which full-time employees
accrue PTO leave by pay period.
Organizations with PTO leave accrual by
other time period
This metric indicates the percentage of
organizations in which full-time employees
accrue PTO leave by methods different from
those already listed.
Waiting period, in days, for newly hired
employees to start accruing PTO
This metric indicates the period of time
from the date of hire until the date a full-
time employee begins to accrue PTO.
Waiting period, in days, for newly hired
employees to be eligible to take PTO
This metric indicates the period of time
from the date of hire until the date a full-
time employee is able to use PTO.
34
PTO days advanced to newly hired
employees
This metric indicates the amount of PTO
days advanced to newly hired full-time
employees before they have accrued PTO
leave.
Average PTO days offered per year
This metric indicates the average amount of
PTO days offered to full-time employees
annually.
Average PTO days offered per year to
part-time employees
This metric indicates the average amount of
PTO days offered to part-time employees
annually.
Maximum number of PTO days an
employee can roll over into the following
year
This metric indicates the maximum number
of unused PTO days full-time employees can
carry over into the subsequent year.
Percentage of employees who used all
allotted PTO
This metric indicates the percentage of full-
time employees who used all allotted PTO
days in a given year.
PTO days for less than one year of service
This metric indicates the number of PTO
days full-time employees with less than one
year of service accrue annually.
PTO days for one year of service
This metric indicates the number of PTO
days full-time employees with one year of
service accrue annually.
PTO days for two years of service
This metric indicates the number of PTO
days full-time employees with two years of
service accrue annually.
PTO days for three years of service
This metric indicates the number of PTO
days full-time employees with three years of
service accrue annually.
PTO days for four years of service
This metric indicates the number of PTO
days full-time employees with four years of
service accrue annually.
PTO days for five through nine years of
service
This metric indicates the average number of
PTO days full-time employees with five
through nine years of service accrue
annually.
PTO days for 10 through 19 years of
service
This metric indicates the average number of
PTO days full-time employees with 10
through 19 years of service accrue annually.
PTO days for 20 or more years of service
This metric indicates the average number of
PTO days full-time employees with 20 or
more years of service accrue annually.
Paid Vacation Plans
Paid vacation plans
A paid vacation plan is a stand-alone plan
that provides employees with paid leave
from work, which is typically taken in
increments of days or weeks. This excludes
35
paid holidays such as Labor Day, Memorial
Day and Thanksgiving.
Paid vacation leave plan for full-time
employees
This metric indicates the percentage of
organizations offering a paid vacation plan
to full-time employees.
Paid vacation leave plan for part-time
employees
This metric indicates the percentage of
organizations offering a paid vacation plan
to part-time employees.
Unlimited paid vacation leave plan for
full-time employees
This metric indicates the percentage of
organizations offering unlimited paid
vacation to full-time employees.
Organizations allow employees to roll
over unused paid vacation leave
This metric indicates the percentage of
organizations that allow full-time
employees to carry over unused paid
vacation into the subsequent year.
Organizations pay any portion of unused
paid vacation leave upon voluntary
termination
This metric indicates the percentage of
organizations that compensate full-time
employees for unused paid vacation at the
point of voluntary separation.
Organizations with paid vacation leave
accrual by anniversary date
This metric indicates the percentage of
organizations that accrue full-time
employee paid vacation leave annually by
date of hire.
Organizations with paid vacation leave
accrual by calendar year
This metric indicates the percentage of
organizations in which full-time employees
accrue paid vacation leave annually by the
calendar year.
Organizations with paid vacation leave
accrual by fiscal year
This metric indicates the percentage of
organizations in which full-time employees
accrue paid vacation leave annually by the
fiscal year.
Organizations with paid vacation leave
accrual by month
This metric indicates the percentage of
organizations in which full-time employees
accrue paid vacation leave monthly.
Organizations with paid vacation leave
accrual by pay period
This metric indicates the percentage of
organizations in which full-time employees
accrue paid vacation leave by pay period.
Organizations with paid vacation leave
accrual by other time period
This metric indicates the percentage of
organizations in which full-time employees
accrue paid vacation leave by methods
different from those already listed.
Waiting, period in days, for newly hired
employees to start accruing paid vacation
leave
This metric indicates the period of time
from the date of hire until the date a full-

36
time employee begins to accrue paid
vacation.
Waiting period, in days, for newly hired
employees to be eligible to take paid
vacation leave
This metric indicates the period of time
from the date of hire until the date a full-
time employee is able to use paid vacation.
Paid vacation days advanced to newly
hired employees
This metric indicates the amount of paid
vacation days advanced to newly hired full-
time employees before they have accrued
paid vacation leave.
Average paid vacation days offered per
year
This metric indicates the average amount of
paid vacation days offered to full-time
employees annually.
Average paid vacation days offered per
year to part-time employees
This metric indicates the average amount of
paid vacation days offered to part-time
employees annually.
Maximum number of paid vacation days
an employee can roll over into the
following year
This metric indicates the maximum number
of unused paid vacation days full-time
employees can carry over into the
subsequent year.
Percentage of employees who used all
allotted paid vacation leave
This metric indicates the percentage of full-
time employees that used all allotted paid
vacation leave days.
Paid vacation days for less than one year
of service
This metric indicates the number of paid
vacation days full-time employees with less
than one year of service accrue annually.
Paid vacation days for one year of service
This metric indicates the number of paid
vacation days full-time employees with one
year of service accrue annually.
Paid vacation days for two years of
service
This metric indicates the number of paid
vacation days full-time employees with two
years of service accrue annually.
Paid vacation days for three years of
service
This metric indicates the number of paid
vacation days full-time employees with
three years of service accrue annually.
Paid vacation days for four years of
service
This metric indicates the number of paid
vacation days full-time employees with four
years of service accrue annually.
Paid vacation days for five through nine
years of service
This metric indicates the average number of
paid vacation days full-time employees with
five through nine years of service accrue
annually.
37
Paid vacation days for 10 through 19 years
of service
This metric indicates the average number of
paid vacation days full-time employees with
10 through 19 years of service accrue
annually.
Paid vacation days for 20 or more years of
service
This metric indicates the average number of
paid vacation days full-time employees with
20 or more years of service accrue annually.
Paid Sick Leave Plans
Paid sick leave plans
A paid sick leave plan is a stand-alone plan
providing employees with paid leave for
absences from work caused by illness or
injury, appointments, and travel time to and
from health care facilities. These plans
sometimes provide paid leave for employees
caring for immediate family members.
Paid sick leave plan for full-time
employees
This metric indicates the percentage of
organizations offering a paid sick leave plan
to full-time employees.
Paid sick leave plan for part-time
employees
This metric indicates the percentage of
organizations offering a paid sick leave plan
to part-time employees.
Unlimited paid sick leave plan for full-
time employees
This metric indicates the percentage of
organizations offering unlimited paid sick
leave to full-time employees.
Organizations allow employees to roll
over unused paid sick leave
This metric indicates the percentage of
organizations that allow full-time
employees to carry over unused paid sick
leave into the subsequent year.
Organizations pay any portion of unused
paid sick leave upon voluntary
termination
This metric indicates the percentage of
organizations that compensate full-time
employees for unused paid sick leave at the
point of voluntary separation.
Organizations with paid sick leave
accrual by anniversary date
This metric indicates the percentage of
organizations in which full-time employees
accrue paid sick leave annually by date of
hire.
Organizations with paid sick leave
accrual by calendar year
This metric indicates the percentage of
organizations in which full-time employees
accrue paid sick leave annually by the
calendar year.
Organizations with paid sick leave
accrual by fiscal year
This metric indicates the percentage of
organizations in which full-time employees

38
accrue paid sick leave annually by the fiscal
year.
Organizations with paid sick leave
accrual by month
This metric indicates the percentage of
organizations in which full-time employees
accrue paid sick leave monthly.
Organizations with paid sick leave
accrual by pay period
This metric indicates the percentage of
organizations in which full-time employees
accrue paid sick leave by pay period.
Organizations with paid sick leave
accrual by other time period
This metric indicates the percentage of
organizations in which full-time employees
accrue paid sick leave by methods different
from those already listed.
Waiting period, in days, for newly hired
employees to start accruing paid sick
leave
This metric indicates the period of time
from the date of hire until the date a full-
time employee begins to accrue paid sick
leave.
Waiting period, in days, for newly hired
employees to be eligible to take paid sick
leave
This metric indicates the period of time
from the date of hire until the date a full-
time employee is able to use paid sick leave.
Paid sick leave days advanced to newly
hired employees
This metric indicates the amount of paid
sick leave days advanced to newly hired full-
time employees before they have accrued
paid sick leave.
Average paid sick leave days offered per
year
This metric indicates the average amount of
paid sick leave days offered to full-time
employees annually.
Average paid sick leave days offered per
year to part-time employees
This metric indicates the average amount of
paid sick leave days offered to part-time
employees annually.
Maximum number of paid sick leave days
an employee can roll over into the
following year
This metric indicates the maximum number
of unused paid sick leave days full-time
employees can carry over into the
subsequent year.
Percentage of employees who used all
allotted paid sick leave
This metric indicates the percentage of full-
time employees that used all allotted paid
sick leave days.
Paid sick leave days for less than one year
of service
This metric indicates the number of paid
sick leave days full-time employees with less
than one year of service accrue annually.
Paid sick leave days for one year of service
This metric indicates the number of paid
sick leave days full-time employees with one
year of service accrue annually.

39
Paid sick leave days for two years of
service
This metric indicates the number of paid
sick leave days full-time employees with
two years of service accrue annually.
Paid sick leave days for three years of
service
This metric indicates the number of paid
sick leave days full-time employees with
three years of service accrue annually.
Paid sick leave days for four years of
service
This metric indicates the number of paid
sick leave days full-time employees with
four years of service accrue annually.
Paid sick leave days for five through nine
years of service
This metric indicates the average number of
paid sick leave days full-time employees
with five through nine years of service
accrue annually.
Paid sick leave days for 10 through 19
years of service
This metric indicates the average number of
paid sick leave days full-time employees
with 10 through 19 years of service accrue
annually.
Paid sick leave days for 20 or more years
of service
This metric indicates the average number of
paid sick leave days full-time employees
with 20 or more years of service accrue
annually.
Paid Personal Leave Plans
Paid personal leave plans
A paid personal leave plan provides
employees with paid leave for any purpose
an employee chooses or any purpose that
may not be covered by a paid vacation or
paid sick leave plan. This excludes paid
holidays such as Labor Day, Memorial Day
and Thanksgiving.
Paid personal leave plan for full-time
employees
This metric indicates the percentage of
organizations offering a paid personal leave
plan to full-time employees.
Paid personal leave plan for part-time
employees
This metric indicates the percentage of
organizations offering a paid personal leave
plan to part-time employees.
Unlimited paid personal leave plan for
full-time employees
This metric indicates the percentage of
organizations offering unlimited paid
personal leave to full-time employees.
Organizations allow employees to roll
over unused paid personal leave
This metric indicates the percentage of
organizations that allow full-time
employees to carry over unused paid
personal leave into the subsequent year.
Organizations pay any portion of unused
paid personal leave upon voluntary
termination
This metric indicates the percentage of
organizations that compensate full-time
40
employees for unused paid personal leave at
the point of voluntary separation.
Organizations with paid personal leave
accrual by anniversary date
This metric indicates the percentage of
organizations in which full-time employees
accrue paid personal leave annually by date
of hire.
Organizations with paid personal leave
accrual by calendar year
This metric indicates the percentage of
organizations in which full-time employees
accrue paid personal leave annually by the
calendar year.
Organizations with paid personal leave
accrual by fiscal year
This metric indicates the percentage of
organizations in which full-time employees
accrue paid personal leave annually by the
fiscal year.
Organizations with paid personal leave
accrual by month
This metric indicates the percentage of
organizations in which full-time employees
accrue paid personal leave monthly.
Organizations with paid personal leave
accrual by pay period
This metric indicates the percentage of
organizations in which full-time employees
accrue paid personal leave by pay period.
Organizations with paid personal leave
accrual by other time period
This metric indicates the percentage of
organizations in which full-time employees
accrue paid personal leave by methods
different from those already listed.
Waiting period, in days, for newly hired
employees to start accruing paid personal
leave
This metric indicates the period of time
from the date of hire until the date a full-
time employee begins to accrue paid
personal leave.
Waiting period, in days, for newly hired
employees to be eligible to take paid
personal leave
This metric indicates the period of time
from the date of hire until the date a full-
time employee is able to use paid personal
leave.
Paid personal leave days advanced to
newly hired employees
This metric indicates the amount of paid
personal leave days advanced to newly hired
full-time employees before they have
accrued personal leave.
Average paid personal leave days offered
per year
This metric indicates the average amount of
paid personal leave days offered to full-time
employees annually.
Average paid personal leave days offered
per year to part-time employees
This metric indicates the average amount of
paid personal leave days offered to part-time
employees annually.

41
Maximum number of paid personal leave
days an employee can roll over into the
following year
This metric indicates the maximum number
of unused paid personal leave days full-time
employees can carry over into the
subsequent year.
Percentage of employees who used all
allotted paid personal leave
This metric indicates the percentage of full-
time employees that used all allotted paid
personal leave days.
Paid personal leave days for less than one
year of service
This metric indicates the number of paid
personal leave days full-time employees
with less than one year of service accrue
annually.
Paid personal leave days for one year of
service
This metric indicates the number of paid
personal leave days full-time employees
with one year of service accrue annually.
Paid personal leave days for two years of
service
This metric indicates the number of paid
personal leave days full-time employees
with two years of service accrue annually.
Paid personal leave days for three years of
service
This metric indicates the number of paid
personal leave days full-time employees
with three years of service accrue annually.
Paid personal leave days for four years of
service
This metric indicates the number of paid
personal leave days full-time employees
with four years of service accrue annually.
Paid personal leave days for five through
nine years of service
This metric indicates the average number of
paid personal leave days full-time employees
with five through nine years of service
accrue annually.
Paid personal leave days for 10 through 19
years of service
This metric indicates the average number of
paid personal leave days full-time employees
with 10 through 19 years of service accrue
annually.
Paid personal leave days for 20 or more
years of service
This metric indicates the average number of
paid personal leave days full-time employees
with 20 or more years of service accrue
annually.
Paid Holidays
Paid holidays per year
This metric indicates the number of paid
holidays an organization offers full-time
employees.
Paid holidays per year for part-time
employees
This metric indicates the number of paid
holidays an organization offers part-time
employees.
42
Floating holidays per year
This metric indicates the number of floating
holidays an organization offers employees in
a calendar year. A floating holiday provides
an employee paid time off to observe a
holiday not observed by the organization.
Paid Bereavement Leave
Paid bereavement leave for full-time
employees
This metric indicates the percentage of
organizations offering bereavement leave for
full-time employees. Bereavement leave
provides paid time off from work for an
employee to attend or arrange funeral or
memorial services for a deceased individual.
Days of paid bereavement leave for loss of
a spouse
This metric indicates the number of
bereavement days provided to an employee
for the death of a spouse.
Days of paid bereavement leave for loss of
a same-sex domestic partner
This metric indicates the number of
bereavement days provided to an employee
for the death of a same-sex domestic
partner.
Days of paid bereavement leave for loss of
an opposite-sex domestic partner
This metric indicates the number of
bereavement days provided to an employee
for the death of an opposite-sex domestic
partner.
Days of paid bereavement leave for loss of
a child
This metric indicates the number of
bereavement days provided to an employee
for the death of a child.
Days of paid bereavement leave for loss of
a parent
This metric indicates the number of
bereavement days provided to an employee
for the death of a parent.
Days of paid bereavement leave for loss of
a sibling
This metric indicates the number of
bereavement days provided to an employee
for the death of a sibling.
Days of paid bereavement leave for loss of
a grandparent
This metric indicates the number of
bereavement days provided to an employee
for the death of a grandparent.
Days of paid bereavement leave for loss of
a grandchild
This metric indicates the number of
bereavement days provided to an employee
for the death of a grandchild.
Days of paid bereavement leave for loss of
an extended family member
This metric indicates the number of
bereavement days provided to an employee
for the death of an extended family member
(e.g., cousin, aunt, uncle, niece, nephew).

43
Paid Sabbatical Leave
Paid sabbatical leave
Sabbatical leave is paid time from work to
accomplish professional development
objectives.
Paid sabbatical program for full-time
employees
This metric indicates the percentage of
organizations that offer sabbatical leave to
full-time employees.
Maximum number of paid sabbatical days
available to eligible employees
This metric indicates the maximum number
of paid days offered to full-time employees
eligible for sabbatical leave.
Paid Civic Leave
Paid civic leave
Paid civic leave refers to paid time from
work that is beyond what is required by law
to perform civic obligations such as jury
duty, military service or voter participation.
Paid jury duty leave
This metric indicates the percentage of
organizations that offer paid leave for jury
duty beyond what is required by law.
Paid military leave
This metric indicates the percentage of
organizations that offer paid leave for
military service beyond what is required by
law.
Paid leave to vote in elections
This metric indicates the percentage of
organizations that offer employees paid
leave to vote in elections during the work
day.
Paid Parental Leave
Paid maternity leave prevalence
The percentage of organizations that offer
female employees paid time off for the birth
of a child beyond what is required by law.
Paid paternity leave prevalence
The percentage of organizations that offer
male employees paid time off for the birth of
a child beyond what is required by law.
Paid adoption leave prevalence
The percentage of organizations that offer
employees paid time off for the adoption of a
child beyond what is required by law.
Paid maternity leave days
The number of days organizations offer
female employees paid time off for the birth
of a child beyond what is required by law.
Paid paternity leave days
The number of days organizations offer male
employees paid time off for the birth of a
child beyond what is required by law.
Paid adoption leave days
The number of days organizations offer
employees paid time off for the adoption of a
child beyond what is required by law.