shrm human capital benchmarking study · pdf file1 shrm human capital benchmarking study: 2009...
TRANSCRIPT
2009 Executive Summary
SHRM® Human Capital Benchmarking Study

ContentsIntroduction � � � � � � � � � � � � � � � � � � � � � � � � � � � � � � � � � � � � � � � � � � � � � � � � � � � � � � � � � � � � � � � � � � � � � � � � � � � � � � � � � � � � � � � � �1
Methodology � � � � � � � � � � � � � � � � � � � � � � � � � � � � � � � � � � � � � � � � � � � � � � � � � � � � � � � � � � � � � � � � � � � � � � � � � � � � � � � � � � � � � � � �3
Using Benchmarking Data � � � � � � � � � � � � � � � � � � � � � � � � � � � � � � � � � � � � � � � � � � � � � � � � � � � � � � � � � � � � � � � � � � � � � � � � � � � � � �4
Key Findings � � � � � � � � � � � � � � � � � � � � � � � � � � � � � � � � � � � � � � � � � � � � � � � � � � � � � � � � � � � � � � � � � � � � � � � � � � � � � � � � � � � � � � � �6
HR Departments and Expenses � � � � � � � � � � � � � � � � � � � � � � � � � � � � � � � � � � � � � � � � � � � � � � � � � � � � � � � � � � � � � � � � � � � � � � � � � �6
HR-to-Employee Ratios � � � � � � � � � � � � � � � � � � � � � � � � � � � � � � � � � � � � � � � � � � � � � � � � � � � � � � � � � � � � � � � � � � � � � � � � � � � � � � � �6
Employment � � � � � � � � � � � � � � � � � � � � � � � � � � � � � � � � � � � � � � � � � � � � � � � � � � � � � � � � � � � � � � � � � � � � � � � � � � � � � � � � � � � � � � � � �7
Compensation � � � � � � � � � � � � � � � � � � � � � � � � � � � � � � � � � � � � � � � � � � � � � � � � � � � � � � � � � � � � � � � � � � � � � � � � � � � � � � � � � � � � � � �8
Organizational Data � � � � � � � � � � � � � � � � � � � � � � � � � � � � � � � � � � � � � � � � � � � � � � � � � � � � � � � � � � � � � � � � � � � � � � � � � � � � � � � � � � �9
Profile of Organizations Responding to the Survey� � � � � � � � � � � � � � � � � � � � � � � � � � � � � � � � � � � � � � � � � � � � � � � � � � � � � � � � � � �17
Conclusion � � � � � � � � � � � � � � � � � � � � � � � � � � � � � � � � � � � � � � � � � � � � � � � � � � � � � � � � � � � � � � � � � � � � � � � � � � � � � � � � � � � � � � � � �19
Special Section: The Impact of Human Capital Metrics During a Multi-Year Recession � � � � � � � � � � � � � � � � � � � � � � � � � � � � � � �20
Human Capital Glossary of Metric Terms, Definitions and Calculations � � � � � � � � � � � � � � � � � � � � � � � � � � � � � � � � � � � � � � � � � � � 21
Endnotes � � � � � � � � � � � � � � � � � � � � � � � � � � � � � � � � � � � � � � � � � � � � � � � � � � � � � � � � � � � � � � � � � � � � � � � � � � � � � � � � � � � � � � � � � �25
SHRM Customized Benchmarking Service � � � � � � � � � � � � � � � � � � � � � � � � � � � � � � � � � � � � � � � � � � � � � � � � � � � � � � � � � � � � � � � �26
Also available:
SHRM CuStoMized BenCHMaRking SeRviCe
Database of more than 6,000 organizations n
To order a complete analysis of the results customized to your organization, please see page 26� n
SHRM® Human Capital Benchmarking Study 2009 Executive Summary
1 SHRM Human Capital Benchmarking Study: 2009 Executive Summary
Since the onset of the current recession, which officially began in December 2007,1 mainstays of U�S� business faced their greatest test of survival since the Great Depression more than 70 years ago� While failures of U�S� business icons became the moniker for “how bad the recession was,” it was thousands of businesses and millions of U�S� workers suffering the fallout of these failures�
Between 2007 and 2008, with no way to finance growth, many businesses faltered, and average profits dropped by 73% from a median of $3,000,000 to $800,000� Faced with reduced revenues, companies sharply dropped their hiring, and those few organizations that did hire did so cheaply as cost-per-hire fell by 38% from $1,820 to $1,125� As the economy further tightened, most organizations cut nonstaff costs, and when it got worse, reductions in force followed� Business layoffs numbered in the millions as unemployment in the United States jumped from 7�5 million to 14�7 million�2 In fact, 38% of organizations either laid off workers in 2008 or planned to do so in 2009�
Human capital management is comprehensive because it includes not only human resource (HR) practices, but also other work practices and people management strategies that increase organizational performance� The important distinction between human resource management and human capital management is that human capital extends well beyond the HR function to encompass the total people strategy of the organization� Human capital is owned by all of the business leaders and resides with everyone in the organization�3 The advantage of this is that businesses are starting to understand what HR professionals have known for years—that human resource programs and activities contribute to the bottom line�
The purpose of the 2009 SHRM Human Capital Benchmarking Study is to provide HR professionals with key human capital measures� In business where the need to measure is strong, benchmarking can help identify an organization’s human capital strengths and weaknesses, create a framework for managing change and encourage employees toward continuous improvement�
Yet for some HR professionals, when it comes to measuring activities around human capital, concrete measures can feel elusive� Numbers that relate to the context of a specific business, particularly the same industry, employee size, organizational revenue and geographic location, are usually difficult to find� But it is precisely this organizational profiling that is most beneficial in order to enable similar organizations to compare themselves with each other�
This executive summary contains key metrics on HR departments and their expenses, HR-to-employee ratios, employment, compensation, and organizational revenue from 1,205 organizations� SHRM’s database collection initiative in early 2009 yielded more than 5,000 additional organizations that together are part of the SHRM Customized Benchmarking Service, which is detailed on page 26� This executive summary and the SHRM Customized Benchmarking Service provide more than 140 benchmarks for many industries so that comparisons can be made, when possible, within a similar industry�
Introduction

SHRM Human Capital Benchmarking Study: 2009 Executive Summary 2
Key Metrics and Data Collected (number of organizations responding = 1,205)
HR Departments and ExpensesTotal HR staff n
HR-to-employee ratio* n
Percentage of HR staff in supervisory roles or n
higherPercentage of HR staff in professional/technical n
roles Percentage of HR staff in administrative support n
rolesReporting structure for head of HR n
HR positions organizations expect to hire in 2009 n
Areas of outsourcing n
HR ExpensesHR expenses n
HR expense to operating expense ratio n
HR expenses per FTE* n
Employment Number of positions filled* n
Time-to-fill* n
Cost-per-hire* n
Annual overall turnover rate* n
Annual voluntary turnover rate n
Annual involuntary turnover rate n
CompensationAnnual salary increase* n
Salaries as a percentage of operating expense* n
Average target bonus percentage for n
nonexecutives Average target bonus percentage for executives* n
Organizational DataRevenue n
Revenue per FTE* n
Net income n
Net income per FTE* n
Positions for succession planning n
Tuition/Education DataAnnual maximum tuition/education reimbursement n
allowed Percentage of employees participating in tuition/ n
education reimbursement
Expectations for Change in 2009Expectations for revenue change in 2009 n
Expectations in HR hiring in 2009* n
Expectations for changes in hiring in 2009* n
*Metrics reported in this executive summary.
For information about additional metrics, please see a sample customized report at the end of this publication� A glossary of metric terms, definitions and calculations is available on page 21�
Industries Surveyed
Administrative, support, waste management, remediation services n Manufacturing (durable goods) n
Arts, entertainment, recreation n Manufacturing (nondurable goods) n
Association—professional trade n Outsourcing n
Biotechnology n Pharmaceutical n
Construction and mining/oil and gas n Publishing/broadcasting n
Consulting n Real estate n
Educational services n Retail/wholesale trade n
Finance n Services—accommodation, food and drinking places n
Government/public administration—federal n Services—professional, scientific, technical n
Government/public administration—state and local n Telecommunications n
Health care services n Transportation and warehousing n
High-tech n Utilities n
Insurance n Other n
3 SHRM Human Capital Benchmarking Study: 2009 Executive Summary
PurposeThe 2009 SHRM Human Capital Benchmarking Study was conducted in order to collect human capital metrics across various industries� The study collected data on human resource departments and expenses, hiring trends, compensation, and turnover� In addition, organizational data, such as revenue, expenses and employee size, were obtained� Data were collected for 2008, along with expectations for change in 2009�
SurveyThe survey was created by SHRM’s Strategic Research Program and was revised from the prior year’s survey instrument� The results of the 2008 SHRM Human Capital Benchmarking Study led to several revisions to the questions asked, as well as to reformatting of several questions� This survey was reviewed by the SHRM Human Capital Measurement/HR Metrics Special Expertise Panel� The Panel is made up of SHRM members who are experts in the field of human capital measurement and metrics�
ParticipantsSHRM members who were HR managers, assistant or associate directors, directors, assistant or associate vice presidents, vice presidents or presidents were included in the sample� The members had to meet the following criteria: have a valid e-mail address and business phone number, have not been selected to participate in a SHRM survey in the past six months, and be residents of the United States�
ProcedureIn March 2009, an e-mail that included a link to the SHRM Human Capital Benchmarking Survey was sent to more than
4,990 randomly selected SHRM members� Of these, 1,205 HR professionals responded on behalf of their organizations, yielding a response rate of 24%� The survey was accessible for a period of six weeks�
In an effort to encourage participation in the study, respondents were informed that they would be entered in a drawing to be one of 40 respondents to receive a $25 American Express gift certificate� In addition, participants received an all-industry report that consisted of 43 metrics� Four reminders were sent, and selected participants who had not yet responded received follow-up telephone calls�
Quality ControlEvery effort was made to ensure the accuracy of the data� At the completion of data collection, the data were checked for duplicate responses� When a respondent submitted a survey more than once, the survey with the latest time was retained and all prior submissions were deleted� The data were then put through a rigorous accuracy check process�4 The survey included many quantitative questions that were checked to ensure that they were understood by respondents and the data submitted were consistent� For example, the number of HR full-time equivalent employees (FTEs) had to equal the sum of the categories of HR FTEs, and the number of HR FTEs had to be less than the total FTEs in the organization� The HR expenses had to be less than the total organizational expenses� Overall, there were few inconsistencies identified within the data� When inconsistencies were identified, steps were taken to resolve the discrepancy� If the data could not be verified and appeared inaccurate, they were excluded from the analysis� This was done to ensure that the highest quality data were included in the study�
Methodology

SHRM Human Capital Benchmarking Study: 2009 Executive Summary 4
Benchmarking is rapidly becoming an indispensable tool for HR professionals� It is a mechanism for measuring processes, practices and results against the competition or “peer” companies in order to improve performance� Used wisely, it can transform a company’s HR and people management strategies by showing how human capital practices influence organizational performance�
HR professionals can use benchmarking data to compare their organization against their competitors or other similar organizations� For example, HR professionals can compare their organization’s health care costs with similar organizations to see if the discrepancy is large enough to warrant further analysis� Benchmarking also protects areas or programs that are performing well� To illustrate, if line executives want recruiting costs lowered, benchmarking data may show that their current recruiting costs are in line with their industry� In fact, to lower costs far below their competitors’ might actually jeopardize the organization’s ability to find the right talent to compete in the market�
Benchmarking can also create support and momentum for organizational change� For example, making changes to existing pay practices may be difficult, unless there is objective benchmarking data that can support otherwise� For example, if the HR professional wants to alter an organization’s long-standing practice of not offering employee bonus plans, making that argument alone, without benchmarking data, is very difficult� Benchmarking data can help make the case�
CEOs and board-level executives also depend on quality benchmarking data to make strategic decisions that affect their organizations� In fact, benchmarking is more effective when used as part of an overall business strategy� It is less
effective, however, when companies use benchmarking only for short-term cost reductions and not part of a long-term strategy� An example of this occurs when an organization lowers training budgets to meet short-term budget goals� While this may achieve a short-term objective, it has a negative impact on developing the skills of the organization’s workforce� Thus, over the long term, the knowledge and skills of its human capital start to lag behind the market, and the organization loses its competitive advantage�
Understanding the DataAs you compare your own data against other organizations, keep the following in mind:
A deviation between your figure (for any human capital 1� measure) and the comparative figure is not necessarily favorable or unfavorable; it is merely an indication that additional analyses may be needed� Human capital measures that relate more closely to the context of your organization’s industry, revenue size, geographic location and employee size are more descriptive and meaningful than information that is more generic in nature, such as all industries combined� The larger the discrepancy between your figure and those found in this executive summary, the greater the need for additional scrutiny�
In cases where you determine that large deviations do 2� exist, it may be helpful to go back and calculate the same human capital measure for your organization over the past several years to identify any trends�
The information in this executive summary should be 3� used as a tool for decision-making rather than an absolute standard� Because companies differ in their overall business strategy, location, size and other factors, any two
Using Benchmarking Data
5 SHRM Human Capital Benchmarking Study: 2009 Executive Summary
companies can be well managed, yet some of their human capital measures may differ greatly� No decision should be made solely based on the results of any one study�
Working With the DataThe information in this executive summary is designed to be a tool to help you evaluate decisions and activities that affect your organization’s human capital� When reviewing these data, it is important to realize that business strategy, organizational culture, leadership behaviors and industry pressures are just a few of the many factors that drive various human capital measures� For example, an industry that generally hires nonskilled labor, such as construction, may have less costly benefits packages than the high-tech industry, which hires specialized knowledge workers� This is because organizations in the high-tech industry may need to have richer, more attractive benefits plans to make them more enticing to “hard-to-find” knowledge workers�
Absolute measures are not meaningful in isolation—they should be compared with one or more measures to determine whether a satisfactory level exists� Other measures, for example, might be your organization’s past results in this area or comparatives based on organizational size, industry or geographic location�
Notes and CaveatsNumber of organizations: The number of organizations (indicated by “n”) is noted in each table and indicates the number of organizations (not individuals) that provided data relevant to a particular table� The number of organizations varies from table to table because some organizations did not respond to all of the questions� Organizations may not have responded to a question on the survey because all or some part(s) of the question were not applicable or because the requested data were unavailable� This also accounts for the varying number of responses within a table�
Confidence level and margin of error: A confidence level and margin of error give readers some measure of how much they can rely on survey responses to represent all of SHRM members’ organizations� Given the level of response to the survey, SHRM Research is 95% confident that responses given by all responding organizations can be generalized to all SHRM members, in general, with a margin of error of approximately 3%� For example, 80% of the responding
organizations reported that they were for-profit� With a 3% margin of error, the reader can be 95% confident that between 77% and 83% of SHRM members come from for-profit organizations� It is important to know that as the sample size decreases, the margin of error increases�
Minimum respondents for summary calculations: No summary calculations were made for items with fewer than 10 participating organizations� Tables illustrating 25th percentile, median and 75th percentile should be interpreted with caution when the number of responding organizations is small�
Extreme values dropped: Due to the nature of the data in the current study, data that were three standard deviations above the average were excluded� In other words, 0�5% of the data were omitted from the analyses� The extreme outliers, or data anomalies, can skew the results, leading to much higher averages among the measures�
Table and figure percentages: Where relevant, data depicted in tables and figures may not add to exactly 100% due to rounding� In addition, percentages may exceed 100% due to multiple response options (i�e�, several organizations may respond to more than one category for the same question)�
Other categories: In some cases, participating organizations included “other” as a response to a survey question� Efforts were made to examine the verbatim content of the “other” responses and recategorize them into the categories listed� Oftentimes, verbatim content was distinctive to the organization, making it impossible to recategorize�
SHRM Human Capital Benchmarking Study: 2009 Executive Summary 6
HR DEPARTMENTS AND EXPENSESHR expense per FTE declined to a median of $1,063 in 2008, compared with $1,176 in the previous year� Faced with another year of low revenues and a continued hiring downturn, organizations decreased their investments in HR in 2008� In 2009, only 16% of the responding organizations anticipate hiring additional HR staff —a change from 36% in the previous year, indicating that organizations are doubtful that 2009 revenues will substantially increase to warrant additional HR staff�
Hires for generalist (36%) and administrative support (27%) positions are the top HR positions that organizations expect to hire in 2009� These positions also made up the bulk of HR hiring in 2007 and 2008, thereby continuing the trend that organizations are hiring HR professionals with broad human resource backgrounds and providing them increased administrative support instead of looking for individuals with staffing and recruitment skills� Yet it suggests that when the economy rebounds and hiring picks up, organizations will need to rebuild their recruiting capabilities, and recruiters will be in great demand�
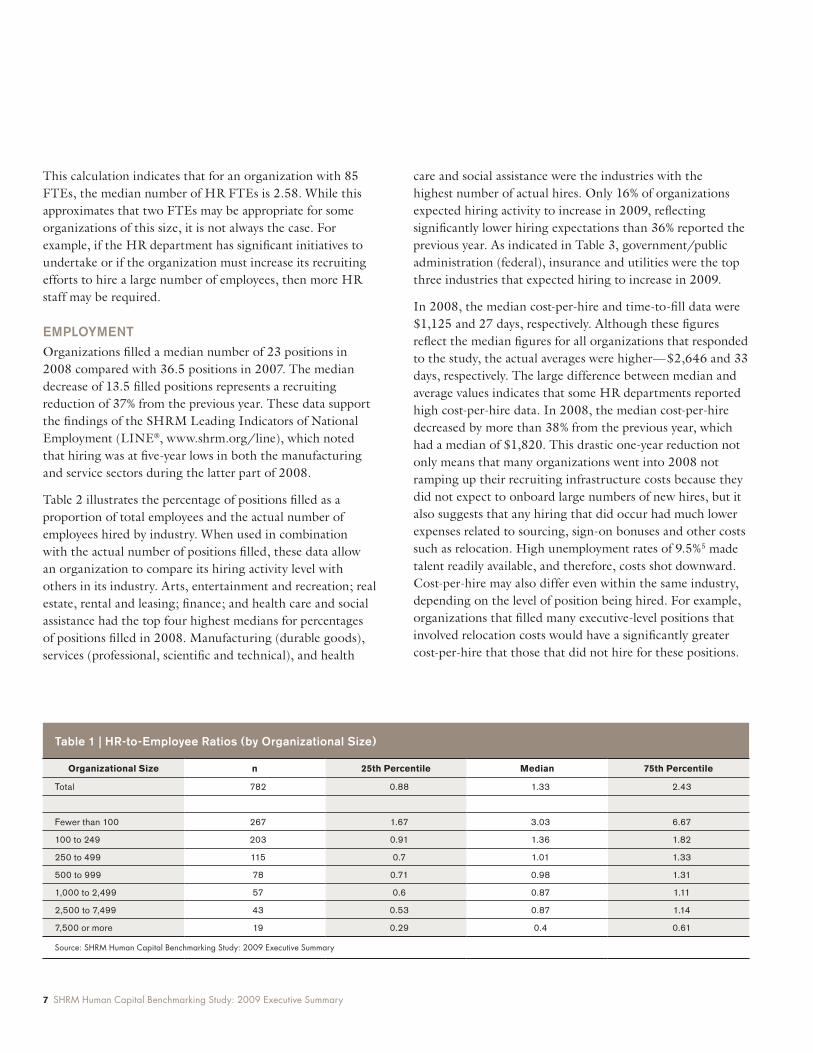
HR-TO-EMPLOYEE RATIOSWhile the median number of FTEs for the HR department in 2008 was three, the average was 9�2� The large difference between median and average values indicates that some HR departments reported a large number of staff� However, a more manageable way to compare HR staffing levels among organizations is to use the HR-to-employee ratio� This ratio represents the number of HR staff per 100 employees supported by HR in an organization� The number is calculated by dividing the number of HR FTEs by the total
number of employees in the organization and multiplying the outcome by 100:
HR-to-Employee Ratio =Total number of HR FTEs
x 100Total number of FTEs
Table 1 shows how HR-to-employee ratios change by organizational size� The data suggest that the primary driver in HR-to-employee ratios is organizational size� This ratio can be helpful to understand the number of HR FTEs that are typically supporting a specific-size organization�
To use the HR-to-employee ratios in Table 1, first locate the size of the organization that is being compared and then find the corresponding ratios located in the same row� The ratios are listed by the 25th, median and 75th percentiles� Although the median ratio will be used in this example, if the HR department has a larger scope of responsibilities, then using the ratio for the 75th percentile may be considered� Conversely, if the HR department has a narrow scope of responsibilities, then using the ratio for the 25th percentile may be appropriate�
Here is an example of how to compute the number of HR FTEs for a typical organization with 85 employees� Table 1 indicates that the median HR-to-employee ratio that corresponds to an organization with 85 employees is 3�03� The actual calculation is as follows:
85 (FTEs) x 3.03= 2.58 (HR FTEs)
100
Key Findings
7 SHRM Human Capital Benchmarking Study: 2009 Executive Summary
This calculation indicates that for an organization with 85 FTEs, the median number of HR FTEs is 2�58� While this approximates that two FTEs may be appropriate for some organizations of this size, it is not always the case� For example, if the HR department has significant initiatives to undertake or if the organization must increase its recruiting efforts to hire a large number of employees, then more HR staff may be required�
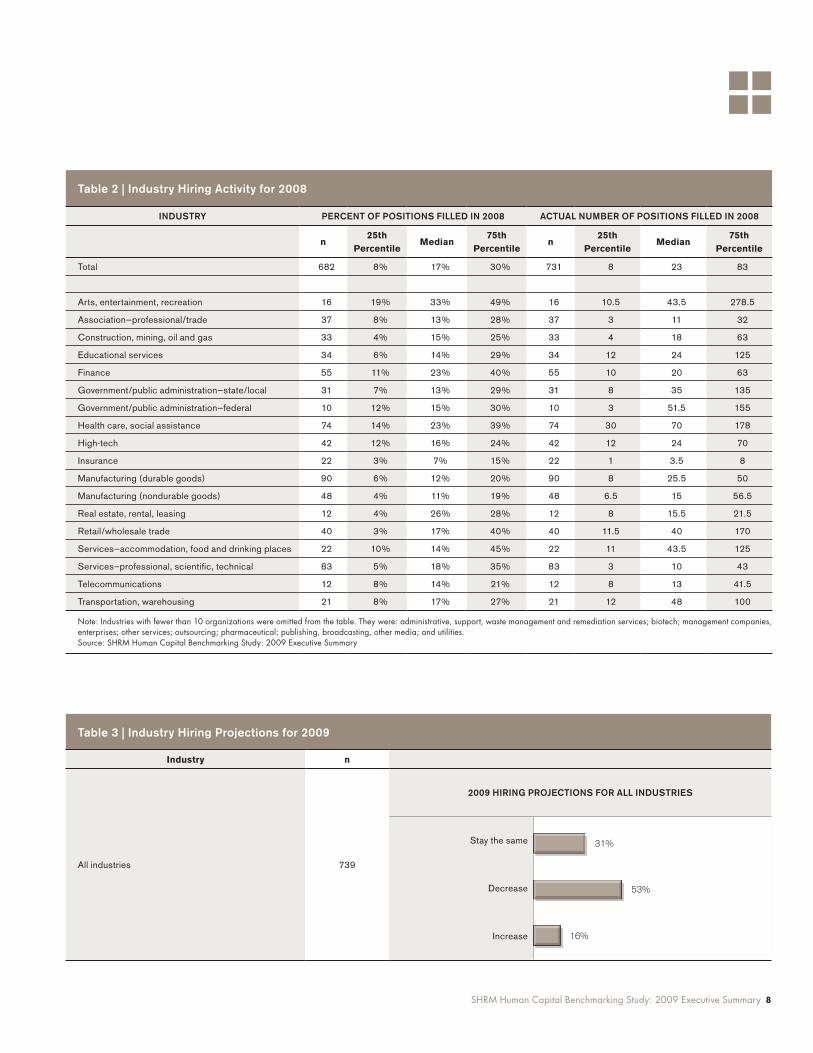
EMPLOYMENTOrganizations filled a median number of 23 positions in 2008 compared with 36�5 positions in 2007� The median decrease of 13�5 filled positions represents a recruiting reduction of 37% from the previous year� These data support the findings of the SHRM Leading Indicators of National Employment (LINE®, www�shrm�org/line), which noted that hiring was at five-year lows in both the manufacturing and service sectors during the latter part of 2008�
Table 2 illustrates the percentage of positions filled as a proportion of total employees and the actual number of employees hired by industry� When used in combination with the actual number of positions filled, these data allow an organization to compare its hiring activity level with others in its industry� Arts, entertainment and recreation; real estate, rental and leasing; finance; and health care and social assistance had the top four highest medians for percentages of positions filled in 2008� Manufacturing (durable goods), services (professional, scientific and technical), and health
care and social assistance were the industries with the highest number of actual hires� Only 16% of organizations expected hiring activity to increase in 2009, reflecting significantly lower hiring expectations than 36% reported the previous year� As indicated in Table 3, government/public administration (federal), insurance and utilities were the top three industries that expected hiring to increase in 2009�
In 2008, the median cost-per-hire and time-to-fill data were $1,125 and 27 days, respectively� Although these figures reflect the median figures for all organizations that responded to the study, the actual averages were higher—$2,646 and 33 days, respectively� The large difference between median and average values indicates that some HR departments reported high cost-per-hire data� In 2008, the median cost-per-hire decreased by more than 38% from the previous year, which had a median of $1,820� This drastic one-year reduction not only means that many organizations went into 2008 not ramping up their recruiting infrastructure costs because they did not expect to onboard large numbers of new hires, but it also suggests that any hiring that did occur had much lower expenses related to sourcing, sign-on bonuses and other costs such as relocation� High unemployment rates of 9�5%5 made talent readily available, and therefore, costs shot downward� Cost-per-hire may also differ even within the same industry, depending on the level of position being hired� For example, organizations that filled many executive-level positions that involved relocation costs would have a significantly greater cost-per-hire that those that did not hire for these positions�
Table 1 | HR-to-Employee Ratios (by Organizational Size)
Organizational Size n 25th Percentile Median 75th Percentile
Total 782 0.88 1.33 2.43
Fewer than 100 267 1.67 3.03 6.67
100 to 249 203 0.91 1.36 1.82
250 to 499 115 0.7 1.01 1.33
500 to 999 78 0.71 0.98 1.31
1,000 to 2,499 57 0.6 0.87 1.11
2,500 to 7,499 43 0.53 0.87 1.14
7,500 or more 19 0.29 0.4 0.61
Source: SHRM Human Capital Benchmarking Study: 2009 Executive Summary
SHRM Human Capital Benchmarking Study: 2009 Executive Summary 8
Table 2 | Industry Hiring Activity for 2008
INDUSTRY PERCENT OF POSITIONS FILLED IN 2008 ACTUAL NUMBER OF POSITIONS FILLED IN 2008
n25th
PercentileMedian
75th Percentile
n25th
PercentileMedian
75th Percentile
Total 682 8% 17% 30% 731 8 23 83
Arts, entertainment, recreation 16 19% 33% 49% 16 10.5 43.5 278.5
Association—professional/trade 37 8% 13% 28% 37 3 11 32
Construction, mining, oil and gas 33 4% 15% 25% 33 4 18 63
Educational services 34 6% 14% 29% 34 12 24 125
Finance 55 11% 23% 40% 55 10 20 63
Government/public administration—state/local 31 7% 13% 29% 31 8 35 135
Government/public administration—federal 10 12% 15% 30% 10 3 51.5 155
Health care, social assistance 74 14% 23% 39% 74 30 70 178
High-tech 42 12% 16% 24% 42 12 24 70
Insurance 22 3% 7% 15% 22 1 3.5 8
Manufacturing (durable goods) 90 6% 12% 20% 90 8 25.5 50
Manufacturing (nondurable goods) 48 4% 11% 19% 48 6.5 15 56.5
Real estate, rental, leasing 12 4% 26% 28% 12 8 15.5 21.5
Retail/wholesale trade 40 3% 17% 40% 40 11.5 40 170
Services—accommodation, food and drinking places 22 10% 14% 45% 22 11 43.5 125
Services–professional, scientific, technical 83 5% 18% 35% 83 3 10 43
Telecommunications 12 8% 14% 21% 12 8 13 41.5
Transportation, warehousing 21 8% 17% 27% 21 12 48 100
Note: Industries with fewer than 10 organizations were omitted from the table. They were: administrative, support, waste management and remediation services; biotech; management companies, enterprises; other services; outsourcing; pharmaceutical; publishing, broadcasting, other media; and utilities. Source: SHRM Human Capital Benchmarking Study: 2009 Executive Summary
Table 3 | Industry Hiring Projections for 2009
Industry n
All industries 739 Insert AllIndust
2009 HIRINg PROjECTIONS FOR ALL INDUSTRIES
Stay the same
Decrease
Increase
31%
53%
16%
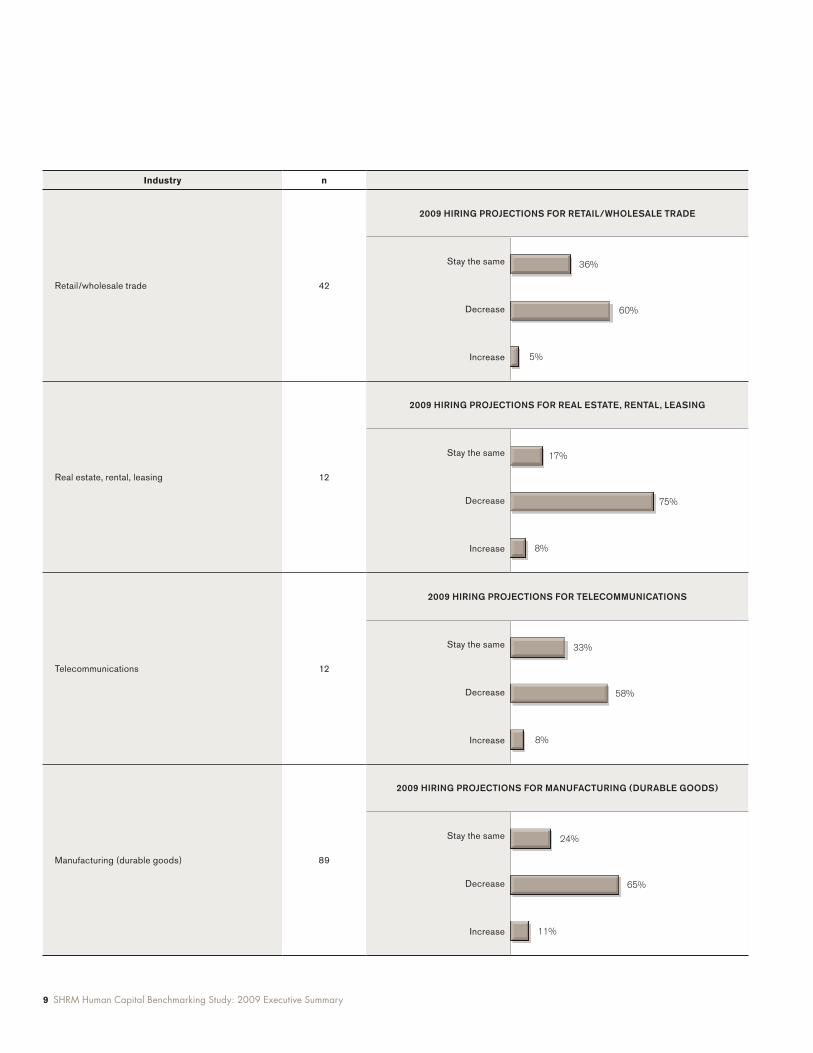
9 SHRM Human Capital Benchmarking Study: 2009 Executive Summary
Industry n
Retail/wholesale trade 42
Real estate, rental, leasing 12
Telecommunications 12
Manufacturing (durable goods) 89
2009 HIRINg PROjECTIONS FOR REAL ESTATE, RENTAL, LEASINg
Stay the same
Decrease
Increase
17%
75%
8%
2009 HIRINg PROjECTIONS FOR TELECOMMUNICATIONS
Stay the same
Decrease
Increase
33%
58%
8%
2009 HIRINg PROjECTIONS FOR MANUFACTURINg (DURABLE gOODS)
Stay the same
Decrease
Increase
24%
65%
11%
2009 HIRINg PROjECTIONS FOR RETAIL/WHOLESALE TRADE
Stay the same
Decrease
Increase
36%
60%
5%
SHRM Human Capital Benchmarking Study: 2009 Executive Summary 10
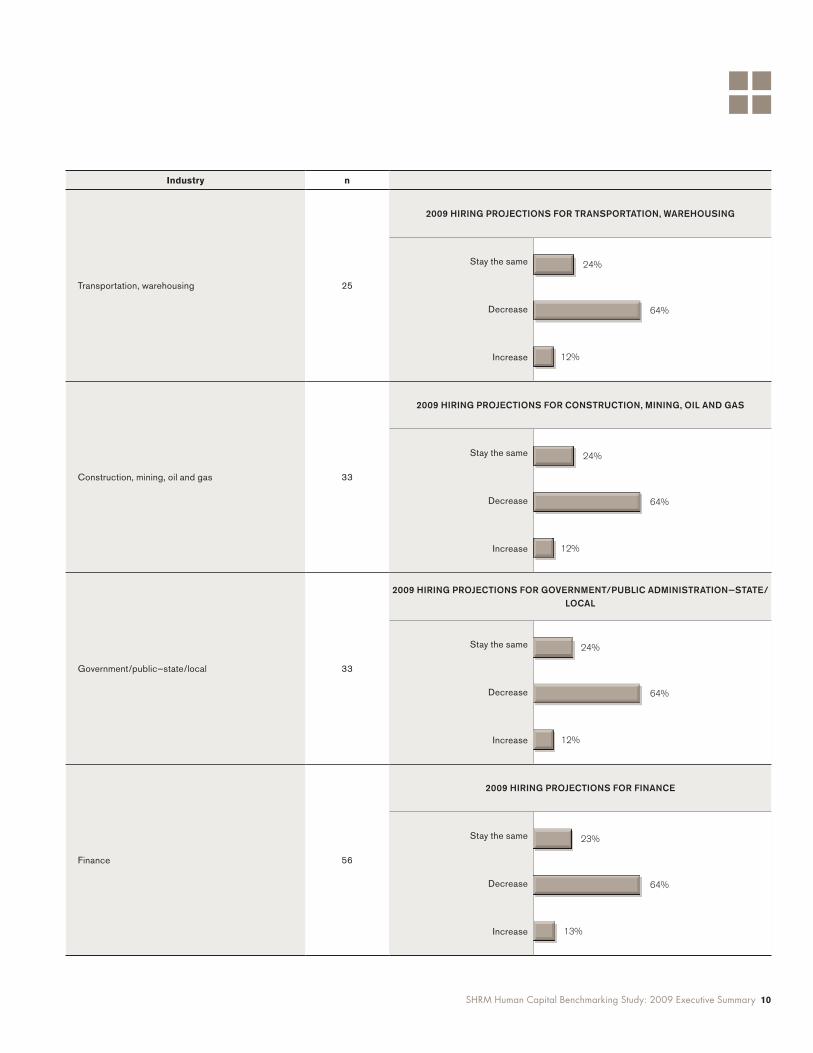
Industry n
Transportation, warehousing 25
Construction, mining, oil and gas 33
Government/public—state/local 33
Finance 56
2009 HIRINg PROjECTIONS FOR TRANSPORTATION, WAREHOUSINg
Stay the same
Decrease
Increase
24%
64%
12%
2009 HIRINg PROjECTIONS FOR CONSTRUCTION, MININg, OIL AND gAS
Stay the same
Decrease
Increase
24%
64%
12%
2009 HIRINg PROjECTIONS FOR gOvERNMENT/PUBLIC ADMINISTRATION—STATE/LOCAL
Stay the same
Decrease
Increase
24%
64%
12%
2009 HIRINg PROjECTIONS FOR FINANCE
Stay the same
Decrease
Increase
23%
64%
13%
11 SHRM Human Capital Benchmarking Study: 2009 Executive Summary
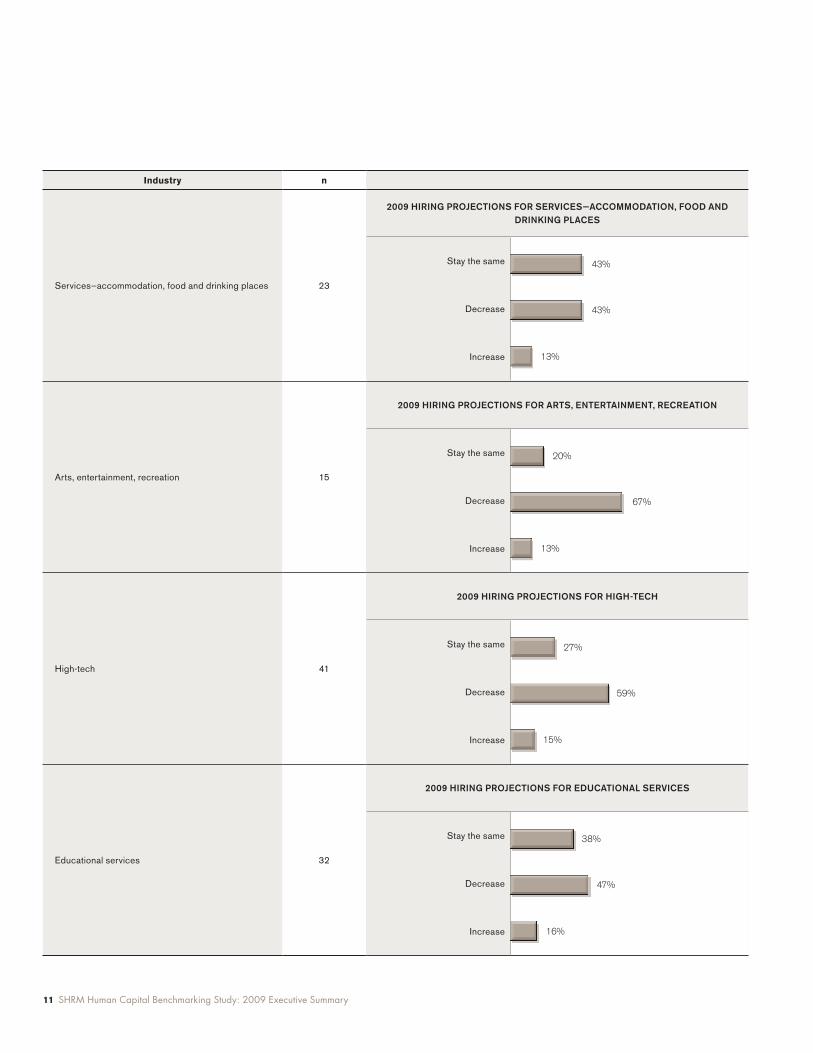
Industry n
Services—accommodation, food and drinking places 23
Arts, entertainment, recreation 15
High-tech 41
Educational services 32
2009 HIRINg PROjECTIONS FOR SERvICES—ACCOMMODATION, FOOD AND DRINKINg PLACES
Stay the same
Decrease
Increase
43%
43%
13%
2009 HIRINg PROjECTIONS FOR HIgH-TECH
Stay the same
Decrease
Increase
27%
59%
15%
2009 HIRINg PROjECTIONS FOR ARTS, ENTERTAINMENT, RECREATION
Stay the same
Decrease
Increase
20%
67%
13%
2009 HIRINg PROjECTIONS FOR EDUCATIONAL SERvICES
Stay the same
Decrease
Increase
38%
47%
16%

SHRM Human Capital Benchmarking Study: 2009 Executive Summary 12
Industry n
Health care, social assistance 75
Association—professional/trade 35
Manufacturing (nondurable goods) 48
Services—professional, scientific, technical 89
2009 HIRINg PROjECTIONS FOR HEALTH CARE, SOCIAL ASSISTANCE
Stay the same
Decrease
Increase
35%
49%
16%
2009 HIRINg PROjECTIONS FOR ASSOCIATION—PROFESSIONAL/TRADE
Stay the same
Decrease
Increase
46%
37%
17%
2009 HIRINg PROjECTIONS FOR MANUFACTURINg (NONDURABLE gOODS)
Stay the same
Decrease
Increase
31%
50%
19%
2009 HIRINg PROjECTIONS FOR SERvICES—PROFESSIONAL, SCIENTIFIC, TECHNICAL
Stay the same
Decrease
Increase
39%
37%
24%
13 SHRM Human Capital Benchmarking Study: 2009 Executive Summary
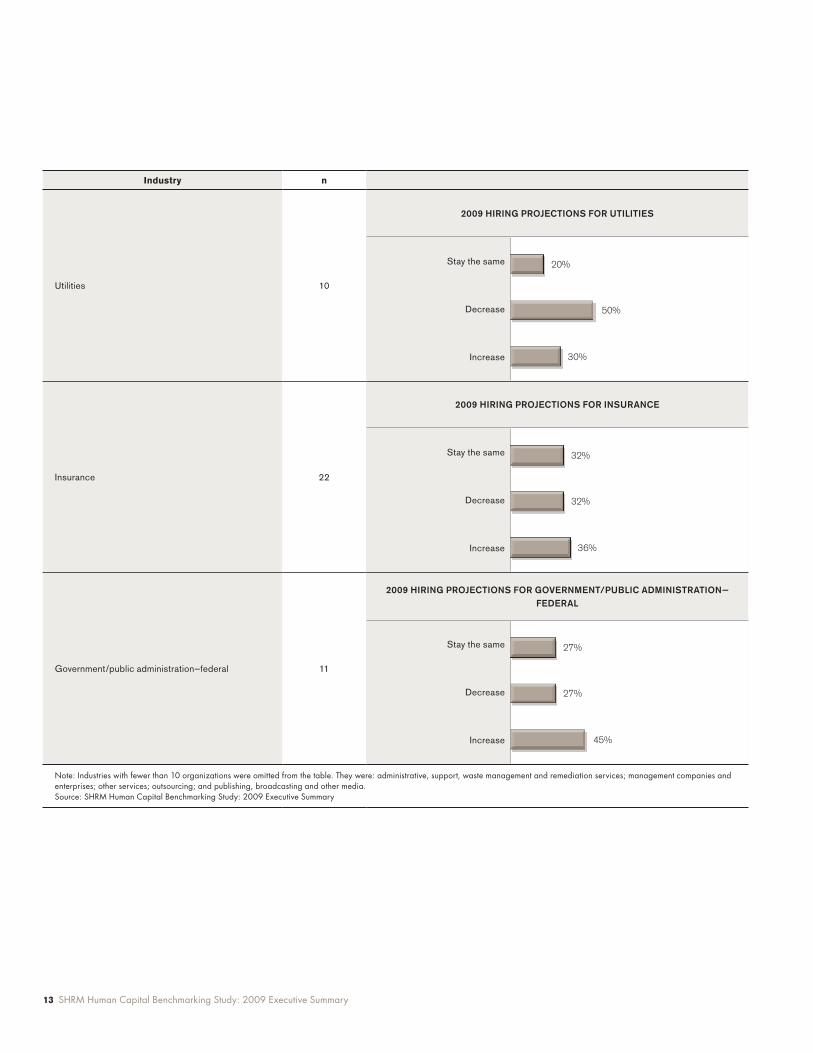
Industry n
Utilities 10
Insurance 22
Government/public administration—federal 11
Note: Industries with fewer than 10 organizations were omitted from the table. They were: administrative, support, waste management and remediation services; management companies and enterprises; other services; outsourcing; and publishing, broadcasting and other media.Source: SHRM Human Capital Benchmarking Study: 2009 Executive Summary
2009 HIRINg PROjECTIONS FOR gOvERNMENT/PUBLIC ADMINISTRATION—FEDERAL
Stay the same
Decrease
Increase
27%
27%
45%
2009 HIRINg PROjECTIONS FOR UTILITIES
Stay the same
Decrease
Increase
20%
50%
30%
2009 HIRINg PROjECTIONS FOR INSURANCE
Stay the same
Decrease
Increase
32%
32%
36%
SHRM Human Capital Benchmarking Study: 2009 Executive Summary 14
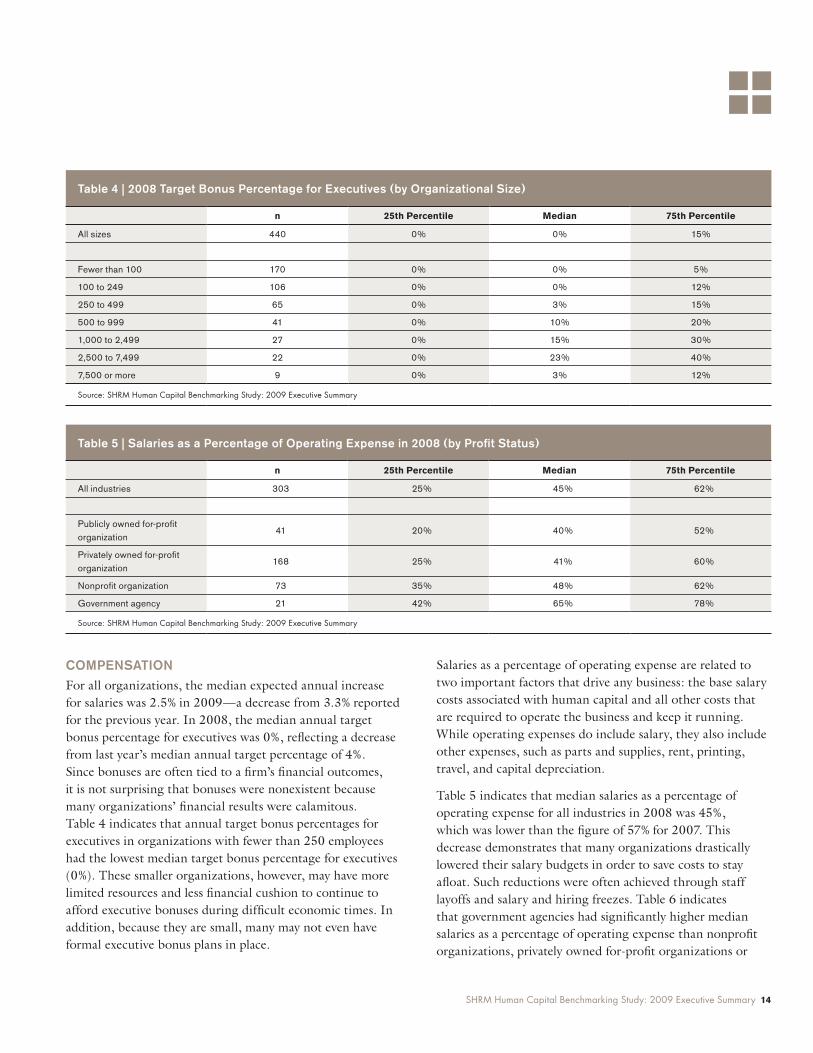
COMPENSATION For all organizations, the median expected annual increase for salaries was 2�5% in 2009—a decrease from 3�3% reported for the previous year� In 2008, the median annual target bonus percentage for executives was 0%, reflecting a decrease from last year’s median annual target percentage of 4%� Since bonuses are often tied to a firm’s financial outcomes, it is not surprising that bonuses were nonexistent because many organizations’ financial results were calamitous� Table 4 indicates that annual target bonus percentages for executives in organizations with fewer than 250 employees had the lowest median target bonus percentage for executives (0%)� These smaller organizations, however, may have more limited resources and less financial cushion to continue to afford executive bonuses during difficult economic times� In addition, because they are small, many may not even have formal executive bonus plans in place�
Salaries as a percentage of operating expense are related to two important factors that drive any business: the base salary costs associated with human capital and all other costs that are required to operate the business and keep it running� While operating expenses do include salary, they also include other expenses, such as parts and supplies, rent, printing, travel, and capital depreciation�
Table 5 indicates that median salaries as a percentage of operating expense for all industries in 2008 was 45%, which was lower than the figure of 57% for 2007� This decrease demonstrates that many organizations drastically lowered their salary budgets in order to save costs to stay afloat� Such reductions were often achieved through staff layoffs and salary and hiring freezes� Table 6 indicates that government agencies had significantly higher median salaries as a percentage of operating expense than nonprofit organizations, privately owned for-profit organizations or
Table 4 | 2008 Target Bonus Percentage for Executives (by Organizational Size)
n 25th Percentile Median 75th Percentile
All sizes 440 0% 0% 15%
Fewer than 100 170 0% 0% 5%
100 to 249 106 0% 0% 12%
250 to 499 65 0% 3% 15%
500 to 999 41 0% 10% 20%
1,000 to 2,499 27 0% 15% 30%
2,500 to 7,499 22 0% 23% 40%
7,500 or more 9 0% 3% 12%
Source: SHRM Human Capital Benchmarking Study: 2009 Executive Summary
Table 5 | Salaries as a Percentage of Operating Expense in 2008 (by Profit Status)
n 25th Percentile Median 75th Percentile
All industries 303 25% 45% 62%
Publicly owned for-profit organization
41 20% 40% 52%
Privately owned for-profit organization
168 25% 41% 60%
Nonprofit organization 73 35% 48% 62%
Government agency 21 42% 65% 78%
Source: SHRM Human Capital Benchmarking Study: 2009 Executive Summary

15 SHRM Human Capital Benchmarking Study: 2009 Executive Summary
publicly owned for-profit organizations� This is likely because government agencies are predominantly service organizations and lack high capital intensive infrastructure costs compared with organizations from other sectors�
ORgANIzATIONAL DATA Total gross revenue and total net income are strategic financial indicators of performance for most organizations� When total revenue is divided by total employees (FTEs), the resulting number is a marker of efficiency�6 This ratio, termed revenue per FTE, conceptually links the time and effort associated with the firm’s human capital to its revenue output� To illustrate, for an organization that has $100 million in revenues and 300 FTEs, the calculation yields a ratio of $333,333 per FTE� If the revenue per FTE ratio increases, it indicates that there is greater efficiency and productivity because more output is being produced per FTE� If the ratio decreases, it indicates less efficiency and productivity�
The ratio of net income per FTE also follows a similar logic� It calculates efficiency by taking net income before taxes, which is the difference between gross revenue and expenses, and divides it by the number of FTEs� Since net income per FTE comprises two factors, it is best looked at over time�7 Both metrics, however, are basic measures that look at productivity in terms of employees and financial performance� Although one is not a better “indicator” than the other per se, revenue per FTE is a more sensitive indicator because it consists of only one factor—revenue� Standing alone, without comparisons within a specific industry or other organizational characteristics, these metrics may not have much value� But used over time, they are a way for HR professionals to track relationships in operational issues and financial performance to employee productivity�
The overall median for revenue per FTE in 2008 was $126,984, which represented an 18% decrease over the previous year� The top three industries with the highest
Table 6 | Revenue per FTE for 2008 (by Industry)
n 25th Percentile Median 75th Percentile
Total 531 $ 60,344 $ 126,984 $ 260,000
Arts, entertainment, recreation 11 $ 85,714 $ 166,667 $ 250,000
Association—professional/trade 28 $ 59,436 $ 106,442 $ 191,405
Construction, mining, oil and gas 22 $ 147,059 $ 290,064 $ 504,471
Educational services 25 $ 68,097 $ 100,000 $ 144,888
Finance 33 $ 76,336 $ 170,424 $ 261,261
Government/public—state/local 26 $ 68,670 $ 110,564 $ 226,996
Health care, social assistance 54 $ 47,477 $ 87,641 $ 140,234
High-tech 38 $ 89,655 $ 146,429 $ 274,603
Insurance 22 $ 91,429 $ 181,187 $ 731,947
Manufacturing (durable goods) 59 $ 60,000 $ 196,000 $ 347,826
Manufacturing (nondurable goods) 27 $ 1,923 $ 130,992 $ 240,000
Retail/wholesale trade 28 $ 370 $ 116,046 $ 266,950
Services—accommodation, food and drinking places
18 $ 60,344 $ 89,079 $ 125,000
Services—professional, scientific, technical 64 $ 72,927 $ 117,778 $ 200,000
Telecommunications 12 $ 121,126 $ 332,026 $ 480,150
Transportation, warehousing 14 $ 27,273 $ 95,988 $ 402,439
Note: Industries with fewer than 10 organizations were omitted from the table. They were: administrative, support, waste management and remediation services; biotech; government/public administration—federal; management companies and enterprises; other services; outsourcing; pharmaceutical; publishing, broadcasting and other media; real estate, rental and leasing; and utilities.Source: SHRM Human Capital Benchmarking Study: 2009 Executive Summary
SHRM Human Capital Benchmarking Study: 2009 Executive Summary 16
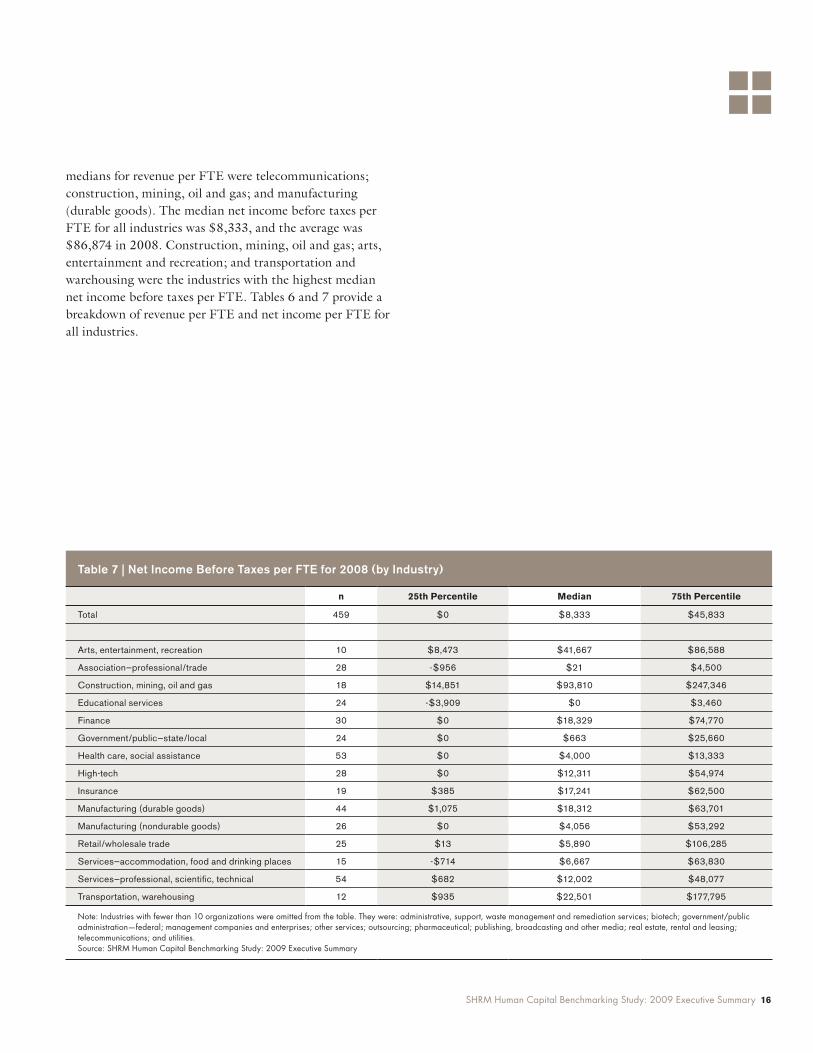
medians for revenue per FTE were telecommunications; construction, mining, oil and gas; and manufacturing (durable goods)� The median net income before taxes per FTE for all industries was $8,333, and the average was $86,874 in 2008� Construction, mining, oil and gas; arts, entertainment and recreation; and transportation and warehousing were the industries with the highest median net income before taxes per FTE� Tables 6 and 7 provide a breakdown of revenue per FTE and net income per FTE for all industries�
Table 7 | Net Income Before Taxes per FTE for 2008 (by Industry)
n 25th Percentile Median 75th Percentile
Total 459 $0 $8,333 $45,833
Arts, entertainment, recreation 10 $8,473 $41,667 $86,588
Association—professional/trade 28 -$956 $21 $4,500
Construction, mining, oil and gas 18 $14,851 $93,810 $247,346
Educational services 24 -$3,909 $0 $3,460
Finance 30 $0 $18,329 $74,770
Government/public—state/local 24 $0 $663 $25,660
Health care, social assistance 53 $0 $4,000 $13,333
High-tech 28 $0 $12,311 $54,974
Insurance 19 $385 $17,241 $62,500
Manufacturing (durable goods) 44 $1,075 $18,312 $63,701
Manufacturing (nondurable goods) 26 $0 $4,056 $53,292
Retail/wholesale trade 25 $13 $5,890 $106,285
Services—accommodation, food and drinking places 15 -$714 $6,667 $63,830
Services—professional, scientific, technical 54 $682 $12,002 $48,077
Transportation, warehousing 12 $935 $22,501 $177,795
Note: Industries with fewer than 10 organizations were omitted from the table. They were: administrative, support, waste management and remediation services; biotech; government/public administration—federal; management companies and enterprises; other services; outsourcing; pharmaceutical; publishing, broadcasting and other media; real estate, rental and leasing; telecommunications; and utilities.Source: SHRM Human Capital Benchmarking Study: 2009 Executive Summary
17 SHRM Human Capital Benchmarking Study: 2009 Executive Summary
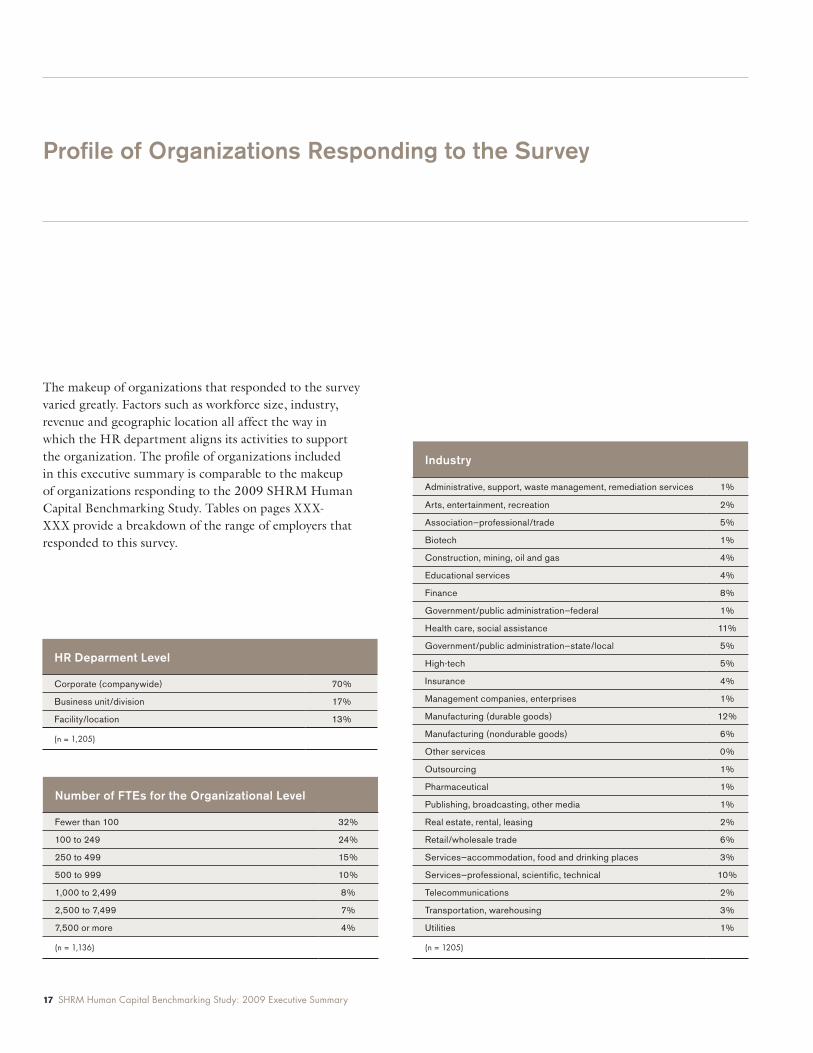
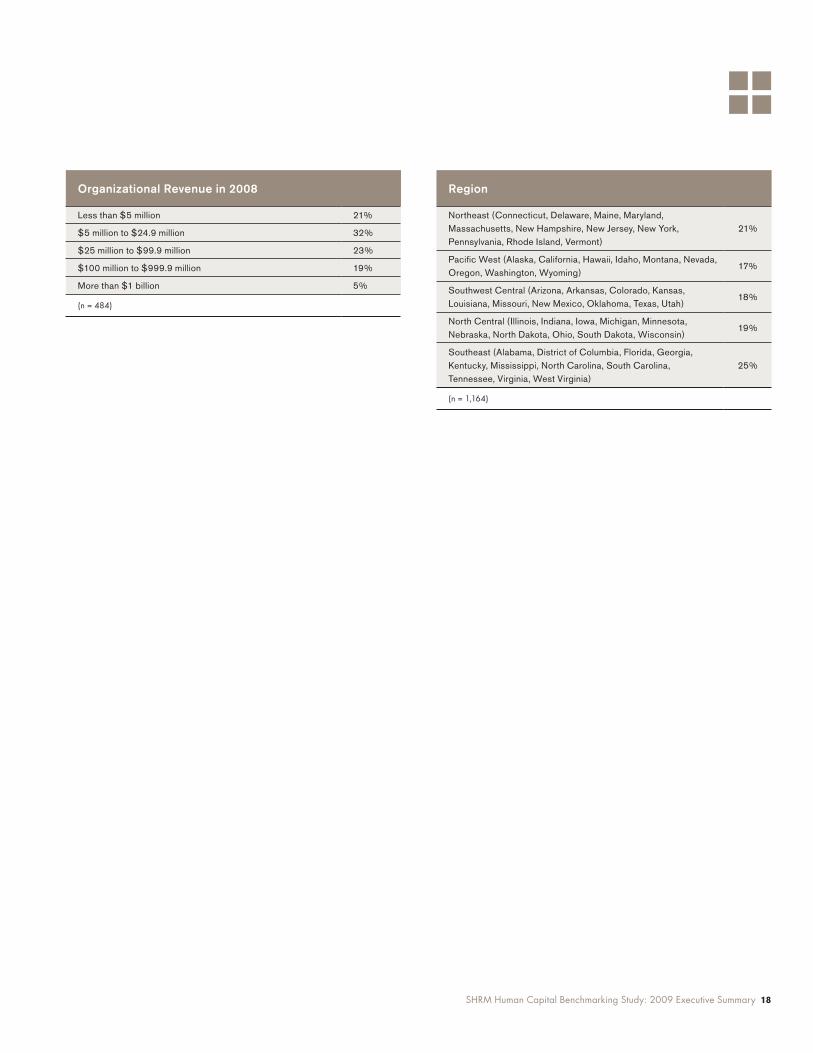
The makeup of organizations that responded to the survey varied greatly� Factors such as workforce size, industry, revenue and geographic location all affect the way in which the HR department aligns its activities to support the organization� The profile of organizations included in this executive summary is comparable to the makeup of organizations responding to the 2009 SHRM Human Capital Benchmarking Study� Tables on pages XXX-XXX provide a breakdown of the range of employers that responded to this survey�
Profile of Organizations Responding to the Survey
HR Deparment Level
Corporate (companywide) 70%
Business unit/division 17%
Facility/location 13%
(n = 1,205)
Industry
Administrative, support, waste management, remediation services 1%
Arts, entertainment, recreation 2%
Association—professional/trade 5%
Biotech 1%
Construction, mining, oil and gas 4%
Educational services 4%
Finance 8%
Government/public administration—federal 1%
Health care, social assistance 11%
Government/public administration—state/local 5%
High-tech 5%
Insurance 4%
Management companies, enterprises 1%
Manufacturing (durable goods) 12%
Manufacturing (nondurable goods) 6%
Other services 0%
Outsourcing 1%
Pharmaceutical 1%
Publishing, broadcasting, other media 1%
Real estate, rental, leasing 2%
Retail/wholesale trade 6%
Services—accommodation, food and drinking places 3%
Services—professional, scientific, technical 10%
Telecommunications 2%
Transportation, warehousing 3%
Utilities 1%
(n = 1205)
Number of FTEs for the Organizational Level
Fewer than 100 32%
100 to 249 24%
250 to 499 15%
500 to 999 10%
1,000 to 2,499 8%
2,500 to 7,499 7%
7,500 or more 4%
(n = 1,136)
SHRM Human Capital Benchmarking Study: 2009 Executive Summary 18
Region
Northeast (Connecticut, Delaware, Maine, Maryland, Massachusetts, New Hampshire, New Jersey, New York, Pennsylvania, Rhode Island, Vermont)
21%
Pacific West (Alaska, California, Hawaii, Idaho, Montana, Nevada, Oregon, Washington, Wyoming)
17%
Southwest Central (Arizona, Arkansas, Colorado, Kansas, Louisiana, Missouri, New Mexico, Oklahoma, Texas, Utah)
18%
North Central (Illinois, Indiana, Iowa, Michigan, Minnesota, Nebraska, North Dakota, Ohio, South Dakota, Wisconsin)
19%
Southeast (Alabama, District of Columbia, Florida, Georgia, Kentucky, Mississippi, North Carolina, South Carolina, Tennessee, Virginia, West Virginia)
25%
(n = 1,164)
Organizational Revenue in 2008
Less than $5 million 21%
$5 million to $24.9 million 32%
$25 million to $99.9 million 23%
$100 million to $999.9 million 19%
More than $1 billion 5%
(n = 484)
19 SHRM Human Capital Benchmarking Study: 2009 Executive Summary
The deep and persistent recession that began in December 20078 caused icons of American business to tumble� General Motors, Freddie Mac, Fannie Mae and AIG all declared bankruptcy, setting off a global financial meltdown unseen since the Great Depression� Hiring decreased steadily over the last three years, while unemployment shot to 9�5%�9 As sales dwindled and cash became tight, HR and finance professionals worked closely to assess the impact of staff salaries against the bottom line� As prospects for new business looked grim, organizations began shedding staff to reduce costs� More than one-third (38%) of organizations either laid off staff in 2008 or expected to conduct layoffs in 2009� Many HR professionals expanded their role to create communication strategies to reduce rumors and anxiety by informing employees about their firms’ financial status and potential cost-cutting strategies�
At the same time, HR professionals had to focus on execution of key HR initiatives, such as performance management and employee problem resolution, while spearheading cost-containment initiatives in benefits and other HR functions� Because health care costs represent the largest benefits costs for most organizations, HR professionals focused on developing strategies that lowered costs to positively affect a firm’s bottom line�
The focus on cost containment issues around human capital and benefits-related areas presents an opportunity for HR professionals in tough economic times to help educate their organizations and provide a context for the role of HR that line managers may not currently have� One way to achieve this is to provide objective benchmarking data that can be used to compare the organization’s human capital measures against similar organizations within the same industry�
These data represent one of the first steps to uncovering the links between human capital management practices and firm performance� When used wisely, benchmarking data can protect programs that are performing well, create support for organizational change and help executives in HR and other disciplines make strategic decisions that affect their organizations� Care must be taken, however, not to use benchmarking data as merely justification for cutting costs� A better way to gain support is to relate how investments in HR help support the business strategy� Otherwise, HR may find itself overly defending its costs instead of demonstrating how it contributes to an organization’s bottom line�
Conclusion
SHRM Human Capital Benchmarking Study: 2009 Executive Summary 20
Facing the day-to-day challenges of running an HR department, while very rewarding, is often time-consuming and intensive as HR professionals respond to changing demands of the businesses and human capital they support� During the last three years, from 2006 through 2008, HR professionals saw the economy drastically shift, from robust growth in 2006 to near collapse in 2008� The great recession not only knocked down major business players, such as GM, Freddie Mac, AIG and Fannie Mae, to name a few, but also had devastating effects on unemployment as organizations laid off staff by the millions� While every HR professional knows his or her specific organization’s financial challenges and has a personal story to describe the problems the company faced and the measures HR took help staff and line managers cope with low morale, salary freezes and staff reductions, reviewing human capital metrics in the context of hundreds of organizations gives additional perspective resulting from three years of devastating economic decline�
Revenue per FTE, often a sign of organizational productivity, declined from $200,000 in 2006 to $126, 984 in 2008, while net income declined by more than half—from $1,648,000 to $800,000—during the same period� With less financial resources for R&D or expansion for new business initiatives, hiring plummeted by 30% from 33 to 23 as a median number of positions filled� Because the recession hit many industries at once and was not sector-specific, employees who wanted new jobs found few available� This resulted in a drop in employee turnover from a high of 15% in 2006 to a low of 8% in 2009� Job security during this difficult time was also listed as the number one component of job satisfaction,10 and this may have caused employees to stay put as they sought familiar surroundings—contributing to even lower turnover�
Though HR professionals’ efforts to recruit and hire new staff diminished, their efforts shifted to cost reduction, salary forecasting, benefits savings and, in many cases, staff layoffs as they worked with executives to align human capital expenses with external economic realities�
More than one-third of organizations (38%) indicated conducting or anticipating staff layoffs in 2008 or 2009� These challenging times provided an opportunity for HR to demonstrate leadership in helping executives best communicate reasons for difficult staffing decisions� Communication strategies that routinely informed employees of organizational financial issues and their ramifications for employees’ jobs helped build trust and commitment�
While the median salary increase dropped from 3�5% in 2006 to 2�5% in 2009, what was significant was that 60% of companies already froze salaries as a way to cope with significant revenue shortfalls�11 Target bonuses for executives also dropped from 20% in 2006 to 0% in 2008� For most professionals, eliminating an across-the-board salary increase and zeroing out executive bonuses would be a compensation event they would witness only once in their entire career� What seemed to help employees accept such a decision, however, was the awareness of previous co-workers, family members and news reports of Americans losing their jobs, with little prospect of employment�
During this time, many HR professionals are mindful of ways to maintain solid employee morale for employees that remain in their organizations� HR strategies that re-engage employees, focus them on achieving company goals and minimize distractions that could contribute to low employee performance are ways HR can demonstrate leadership during tough economic times�
Special Section: The Impact of Human Capital Metrics During a Multi-Year Recession
21 SHRM Human Capital Benchmarking Study: 2009 Executive Summary
StatiStiCal definitionS
“n”Letter “n” in tables and figures indicates the number of respondents to each question� Therefore, when it is noted that n = 25, it indicates that the number of respondents was 25�
PercentileThe percentile is the percentage of responses that have values less than or equal to that particular value� For example, when data are arranged from lowest to highest, the 25th percentile is the point at which 75% of the data are above it and 25% are below it� Conversely, the 75th percentile is the point at which 25% of the data are above it and 75% are below it�
Median (50th percentile)The median is the midpoint of the set of numbers or values arranged in ascending order� It is recommended that the median is used as a basis for all interpretations of the data when the average and median are discrepant�
AverageThe average is the sum of the responses divided by the total number of responses� It is also known as the mean� This measure is affected more than the median by the occurrence of outliers (extreme values)� For this reason, the average reported may be greater than the 75th percentile or less than the 25th percentile�
oRganizational data
FTEFTE is an abbreviation for full-time equivalent� Full-time equivalents represent the total labor hours invested� To convert part-time staff into FTEs, divide the total number of hours worked by part-time employees during the work year by the total number of hours in the work year (e�g�, if the average work week is 37�5 hours, total number of hours in a work year would be 37�5 hours/week x 52 weeks = 1,950)� Converting the number of employees to FTEs provides a more accurate understanding of the level of effort being applied in an organization� For example, if two employees are job-sharing, the FTE number is only one�
RevenueIn business, revenue is the amount of money that a company actually receives from its activities, mostly from sales of products and/or services to customers� To investors, revenue is less important than profit, or income, which is the amount of money the company has earned after deducting all of its expenses�
Revenue per FTERevenue per FTE is the total amount of revenue received during an organization’s fiscal year divided by the number of FTEs� This ratio conceptually links the time and effort associated with the firm’s human capital to its revenue output� If the revenue-per-FTE ratio increases, it indicates that there is greater efficiency and productivity because more output is being produced per FTE� If the ratio decreases, it indicates there is less efficiency and productivity�
Human Capital glossary of Metric Terms, Definitions and Calculations
SHRM Human Capital Benchmarking Study: 2009 Executive Summary 22
Net Income Before TaxesNet income before taxes is the amount of revenue received during the fiscal year minus the operating expenses during the fiscal year�
Net Income Before Taxes per FTENet income before taxes per FTE is the net income before taxes divided by the number of FTEs� It calculates efficiency by taking net income before taxes, which is the difference between gross revenue and expenses, and divides the outcome by the number of FTEs� Unlike revenue per FTE, which has only one factor (revenue), net income per FTE comprises two factors, and it is best looked at over time�
Positions Included Within the Organization’s Succession PlanSuccession planning varies by organization, and for that reason these data indicate which positions organizations typically include when conducting succession planning� For example, some organizations may include only executive-level positions for succession planning, while others may include many executive-, manager- and supervisory-level positions�
HR depaRtMent data
Total HR StaffTotal HR staff is the actual number of employees supporting the HR function for an organizational level�
HR-to-Employee Ratio The HR-to-employee ratio provides a more manageable way to compare HR staffing levels between organizations� It represents the number of HR staff per 100 employees supported by HR in the organization� The number is calculated by dividing the number of HR FTEs by the total number of FTEs in the organization and multiplying the outcome by 100:
HR-to-EmployeeRatio =Total number of HR FTEs
x 100Total number of FTEs
in the organization
Percentage of HR Staff in Supervisory RolesPercentage of HR staff in supervisory roles is calculated by taking the number of HR staff in supervisory positions (FTEs) and dividing it by the total number of HR staff (FTEs)� Because positions in this category supervise others, they often are called supervisor, manager, director or above�
Percentage of HR Staff in Professional/Technical Roles The percentage of HR staff in professional/technical roles is calculated by taking the number of HR staff in professional/technical positions (FTEs) and dividing it by the total number of HR staff (FTEs)� Positions in this category are generally exempt and do not supervise others� They may be called recruiter, benefits administrator, HR generalist, etc�
Percentage of HR Staff in Administrative Support RolesThe percentage of HR staff in administrative support roles is calculated by taking the number of HR staff in administrative support positions (FTEs) and dividing it by the total number of HR staff (FTEs)� Often, but not always, positions in this category are nonexempt� They may be called coordinator, assistant, etc�
Reporting Structure for the Head of HR Reporting structure for the head of HR indicates to what position within the organization the head of HR reports� Occasionally, in very small companies, the head of HR may report to the CFO or head of an operating unit� In larger organizations, the head of HR usually reports to the president or CEO�
Types of HR Positions Organizations Expect to Hire in the Coming Year This metric reflects the expectations for HR hiring, including the types of HR positions that organizations anticipate hiring in 2009�
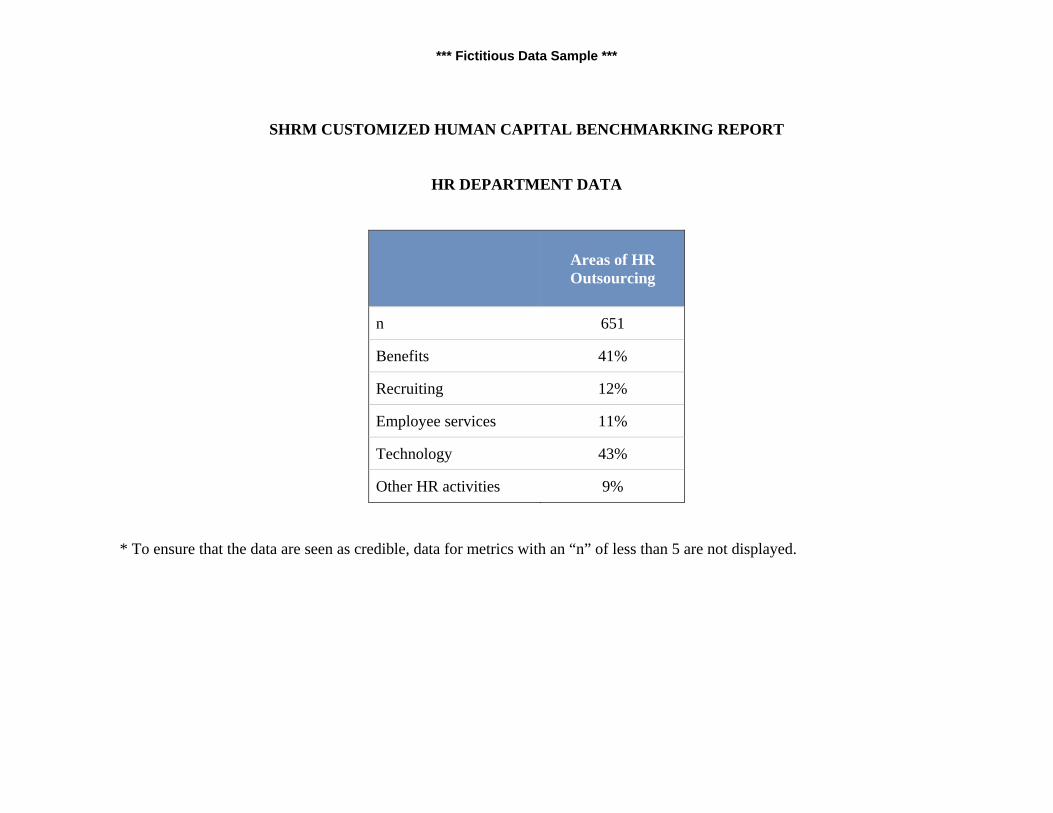
Areas of HR OutsourcingAreas of HR outsourcing indicate what activities or functions within the human resource function are being transferred to an external service provider to perform� HR activities may be partially or completely outsourced and may include areas
23 SHRM Human Capital Benchmarking Study: 2009 Executive Summary
such as benefits administration, reference checking, HR technology, etc�
HR expenSe data
HR ExpensesHuman resource expenses represent HR’s total costs for a given fiscal year�
HR Expense to Operating Expense Ratio HR expense to operating expense ratio is calculated by dividing the organization’s total HR expenses by the operating expenses for a given fiscal year� This ratio depicts the amount of HR expenses as a percentage of total operating expenses, which is an indication of the amount of dollars an organization invests in its HR function�
HR Expense to FTE RatioHR expense to FTE ratio represents the amount of human resource dollars spent per FTE in the organization� It is calculated by taking the HR expenses for a given fiscal year and dividing them by the number of FTEs in the organization�
CoMpenSation data
Annual Salary IncreaseAnnual salary increase is the percentage of increase in salaries that an organization expects to provide to its employees for a given fiscal year�
Salaries as a Percentage of Operating ExpenseThe metric of salaries as a percentage of operating expense is calculated by dividing the total amount of employee salaries by the operating expense for a given fiscal year�
Target Bonus Percentage for Nonexecutives The target bonus for nonexecutives represents the average percentage of base pay that is targeted to be paid out in cash to nonexecutive staff during a given year�
Target Bonus Percentage for Executives The target bonus for executives represents the average percentage of base pay that is targeted to be paid out in cash to executive staff during a given year�
tuition/eduCation data
Maximum Reimbursement Allowed for Tuition/Education Expenses per YearThe maximum reimbursement allowed for tuition/education expenses per year is the average amount in dollars per employee the organization paid for tuition/education� These expenses do not include training expenses for seminars, and the like, that are not part of a college- or university-level undergraduate or graduate course(s)�
Percentage of Employees Participating in Tuition/Education Reimbursement ProgramsTuition reimbursement programs used in this metric do not include reimbursements for seminars, and the like, that are not part of a college- or university-level undergraduate or graduate course(s)�
eMployMent data
Number of Positions FilledNumber of positions filled reflects the number of open positions for which individuals were hired during the fiscal year� Open positions could be filled either by internal or external candidates� “Hired” means the individual accepted the position during the fiscal year, although he or she may not have started until the following year� This would occur mostly with those candidates who accepted positions during the last month of the organization’s fiscal year�
Time-to-FillTime-to-fill represents the number of days from when the job requisition was opened until the offer was accepted by the candidate�12 This number is calculated using calendar days, including weekends and holidays�
Cost-Per-HireCost-per-hire represents the costs involved with a new hire� These costs include the sum of advertising agency
SHRM Human Capital Benchmarking Study: 2009 Executive Summary 24
fees, employee referrals, travel cost of applicants and staff, relocation costs, and recruiter pay and benefits13 divided by the number of hires�
Annual Overall Turnover RateAnnual overall turnover rate is the rate at which employees enter and leave a company in a given fiscal year� Typically, the more loyal employees are to a firm, the lower the turnover rate� A 100% turnover rate from year to year means that as many employees left the company as were hired� To calculate annual turnover, first calculate turnover for each month by dividing the number of separations during the month by the average number of employees during the month and multiplying by 100�14 The annual turnover rate is then calculated by adding the 12 months’ worth of turnover percentages together�
Annual voluntary Turnover RateAnnual voluntary turnover rate is the rate at which employees enter and voluntarily leave a company in a given fiscal year� To calculate annual voluntary turnover, first calculate the voluntary turnover for each month by dividing the number of voluntary separations during the month by the average number of employees during the month and multiplying by 100� The annual voluntary turnover rate is then calculated by adding the 12 months’ worth of voluntary turnover percentages together�
Annual Involuntary Turnover RateAnnual involuntary turnover rate is the rate at which employees enter and involuntarily leave a company in a given fiscal year� An involuntary termination occurs, for example, when the organization asks the employee to leave the company� Such terminations usually occur as a result of poor performance, layoffs or other reasons� To calculate annual involuntary turnover rate, first calculate involuntary turnover for each month by dividing the number of involuntary separations during the month by the average number of employees during the month and multiplying it by 100� The annual involuntary turnover rate is then calculated by adding the 12 months’ worth of turnover percentages together�
expeCtationS foR Revenue and oRganizational HiRing
Percentage of Organizations Expecting Changes in Revenue in the Coming YearThe expectations for revenue change indicate whether HR professionals anticipate their organization’s revenue to increase, decrease or stay the same in the coming year compared with the current year�
Percentage of Organizations Expecting Changes in Hiring in the Coming YearThe expectations for changes in hiring indicate whether HR professionals anticipate their organization’s hiring activity to increase, decrease or stay the same in the coming year compared with the current year�
More Profitable OrganizationsMore profitable organizations were defined as organizations with a net income to revenue ratio at or above the 60th percentile in their industry�
25 SHRM Human Capital Benchmarking Study: 2009 Executive Summary
National Bureau of Economic Research� (2008)� 1
Determination of the December 2007 peak in economic activity. Retrieved from www�nber�org/cycles /dec2008�html�
Ibid�2
Chartered Institute for Personnel and Development� 3
(2004)� Human capital reporting: An internal perspective. London: Author�
Due to the nature of the data in the current study, only 4
data that were three standard deviations above the average were excluded� In other words, this includes data in which 99�5% of the data fall below the given data point� Extreme outliers can skew the results, leading to higher (or lower) averages among the measures�
National Bureau of Economic Research� (2008)� 5
Determination of the December 2007 peak in economic activity. Retreived from www�nber�org/cycles/dec2008�html�
Fitz-enz, J�, & Davison, B� (2002)� 6 How to measure human resources management (3rd edition)� New York: McGraw-Hill�
Ibid�7
National Bureau of Economic Research� (2008)� 8
Determination of the December 2007 peak in economic activity. Retrieved from www�nber�org/cycles /dec2008�html�
U�S� Bureau of Labor Statistics� (2009, June)� 9 Economic situation summary: June 2009 [news release]� Retrieved from www�bls�gov/news�release/empsit�nr0�htm�
Society for Human Resource Management� (2009)� 10 2009 job satisfaction: A survey report by SHRM. Alexandria, VA: Author�
Watson Wyatt� (2009)� 11 Effect of the economic crisis on HR programs. New York: NY: Author�
Kluttz, L� (2003)� 12 SHRM/EMA 2002 staffing metrics survey: Time to fill/time to start. Alexandria, VA: Society for Human Resource Management�
Society for Human Resource Management� 13 HR metrics toolkit. Retrieved from www�shrm�org/metrics/library_published/nonIC/CMS_005910�asp�
Ibid�14
Endnotes
Save time and money with SHRM Benchmarking Reports, which compare your organization to thousands others like it. You’ll get your report—and key business insight—within days of your order.
Order your Customized Benchmarking Report today: www.shrm.org/research/benchmarks(800) 283-7476, ext. 6366
(703) 535-6366 (direct dial)
(703) 548-6999 (TTY/TDD)
Does Your Company Measure Up?
SHRM® Customized Benchmarking Reports
Choose from more
than 140 popular
benchmarks, including:
• Annual turnover
rate
• Number of FTEs
• HR department
expenses
• Health care
• Benefits
• Retirement
• 401(k)
• Organizational
succession
• Time-to-fill
• Cost per hire
…and many more!
Companies that have purchased the SHRM Customized Benchmarking Reports include:
Blue Cross/Blue Shield of North Carolina
Brandes Associates
Federal Reserve Bank
Hallmark
Kaiser Permanente
Kohler Company
Mutual of Omaha
Port Authority of New York & New Jersey
Target, Inc.
The Coca-Cola Company
The Children’s Village
Universal Hospital Services, Inc.
…and more!
Fill the gap between expensive benchmarking services and going it alone. SHRM offers customized benchmarking reports that can help you and your organization:
•Improverecruitingstrategies
•JustifyadditionalHRstaff
•DefendHRbudgets
•Makethecaseforbetter401(k)matching
•Devisecompetitivehealthcareplans
•Createsuccessionplans
•BriefCFOsandboardmembersonreturn on investment
•Conductduediligenceformergers,reorganizations and acquisitions
“SHRM made it very easy to purchase
the research I needed in order to
benchmark my company well. The issues
benchmarked were the issues that the
infrastructure oversight, finance, and
benefits committee were asking me to
look into.”
Betsy Davis, SPHR
Institute of Electrical and Electronics Engineers, Inc.
How to order:Step 1Determinethemetricsyouwouldliketocomparewiththemorethan5,000organizationsinSHRM’s database. For a list of metrics visitwww.shrm.org/research/benchmarks
Step 2Complete your organization’s profile at www.shrm.org/research/benchmarks or call a SHRM Research Expert at (703)535-6366or(800)283-7476,ext.6366.
Step 3Within days of your order, you’ll receive your customized data, along with definitions, metric calculations and guidelines on how to use and understand benchmarking data.
“SHRM has the largest human capital benchmarking database in the world. It’s fast, thorough and easy to use. Whenever I want some hard-to-find data, I go to SHRM first.”
Jac Fitz-enz, Ph.D. CEO, Human Capital Source
08-0693
*** Fictitious Data Sample ***
SHRM® 2009 CUSTOMIZED HUMAN CAPITAL BENCHMARKING REPORT
This report includesCustomized tables based on your criteria 5
A glossary of terms 19
Prepared bySociety for Human Resource Management
SHRM Customized Health Care, and Retirement and Welfare Benchmarking Reports are also available. Please visit our web site at www.shrm.org/research/benchmarks © 2009 Society for Human Resource Management. All rights reserved. This publication may not be reproduced, stored in a retrieval system or transmitted in whole or in part, in any form or by any means, electronic, mechanical, photocopying, recording or otherwise, without the prior written permission of the Society for Human Resource Management, 1800 Duke Street, Alexandria, VA 22314, USA.

*** Fictitious Data Sample ***
Thank you for ordering a
SHRM 2009 Customized Human Capital Benchmarking Report!
Your report is based on the following criteria:
Selection Criteria
Industry Staff Size
High-Tech 250 to 1,000
LICENSE AGREEMENT FOR THE SHRM CUSTOMIZED BENCHMARKING REPORT By opening and using this SHRM Customized Benchmarking Report (the “Report”), you (“User”) hereby agree as follows: (i) That the Society for Human Resource Management is the exclusive copyright owner of the Report. (ii) Provided that the required fee for use of the Report by User has been paid to SHRM, User has the right, by this License, to use the Report solely for the internal purposes of their employer (“Company”) or for the internal purposes of a single client of Company (“Single Client”), and to make or distribute copies of the Report to other employees within the Company or to employees within the Single Client, provided that such other Company employees or Single Client employees may only use the Report for the internal purposes of the Company, or Single Client. Except as allowed above with respect to use by employees of Company for the internal purposes of Company or employees of Single Client for the internal purposes of Single Client, neither User, Company, nor Single Client have any right to print, make, or distribute any copies, in any media, of the Report. (iii) Neither User, Company, nor Single Client has any right to sell, or sublicense, loan, or otherwise convey or distribute the Report or any copies thereof in any media to any third parties outside of the Company or Single Client.
*** Fictitious Data Sample ***
Understanding the Data As you compare your own data against other organizations, keep the following in mind:
1. A deviation between your figure (for any human capital measure) and the comparative figure is not necessarily favorable or unfavorable; it is merely an indication that additional analyses may be needed. Human capital measures that relate more closely to the context of your organization’s industry, revenue size, geographic location and employee size are more descriptive and meaningful than information that is more generic in nature, such as all industries combined. The larger the discrepancy between your figure and those found in this executive summary, the greater the need for additional scrutiny.
2. In cases where you determine that large deviations do exist, it may be helpful to go back and calculate the same human capital measure for your organization over the past several years to identify any trends.
3. The information in this executive summary should be used as a tool for decision-making rather than an absolute standard. Because companies differ in their overall business strategy, location, size and other factors, any two companies can be well managed, yet some of their human capital measures may differ greatly. No decision should be made solely based on the results of any one study.
Working With the Data The information in this executive summary is designed to be a tool to help you evaluate decisions and activities that affect your organization’s human capital. When reviewing these data, it is important to realize that business strategy, organizational culture, leadership behaviors and industry pressures are just a few of the many factors that drive various human capital measures. For example, an industry that generally hires nonskilled labor, such as construction, may have less costly benefits packages than the high-tech industry, which hires specialized knowledge workers. This is because organizations in the high-tech industry may need to have richer, more attractive benefits plans to make them more enticing to “hard-to-find” knowledge workers. Absolute measures are not meaningful in isolation—they should be compared with one or more measures to determine whether a satisfactory level exists. Other measures, for example, might be your organization’s past results in this area or comparatives based on organizational size, industry or geographic location. Each page in the custom tables contains customized benchmarks in aggregated form. There may be discrepancies between your organization’s human capital benchmarks and the average or median numbers for a particular category. It is particularly helpful to communicate to line managers and other executives that just because your organization has benchmarks that are different from the average or median, it does not mean they are favorable or unfavorable. Rather, it may be the result of a
*** Fictitious Data Sample ***
particular total rewards strategy, special circumstances or other business initiatives that cause differences with your organization’s benchmarks. Notes The data in this report were collected in the Spring of 2009 and reflect 2007 and 2009 data. The “n” is comprised of the organizations that responded to the specific benchmark for which it is listed. Therefore, the number of peer organizations may vary from benchmark to benchmark. Some benchmarks are less frequently collected by organizations or may be more difficult to obtain. Therefore, some benchmarks show a smaller “n” than others. Data are not displayed when there are fewer than five organizations for a specific metric. The tables on pages 15 through 18 provide additional benchmarks for more profitable organizations. More profitable organizations were defined as organizations with a net income to revenue ratio at or above the 60th percentile in the industry selected for the sample. This information is provided for the industry selected, regardless of other criteria such as size. Disclaimer This report is published by the Society for Human Resource Management (SHRM). The Society for Human Resource Management cannot accept responsibility for any errors or omissions or any liability resulting from the use or misuse of any such information.
*** Fictitious Data Sample ***
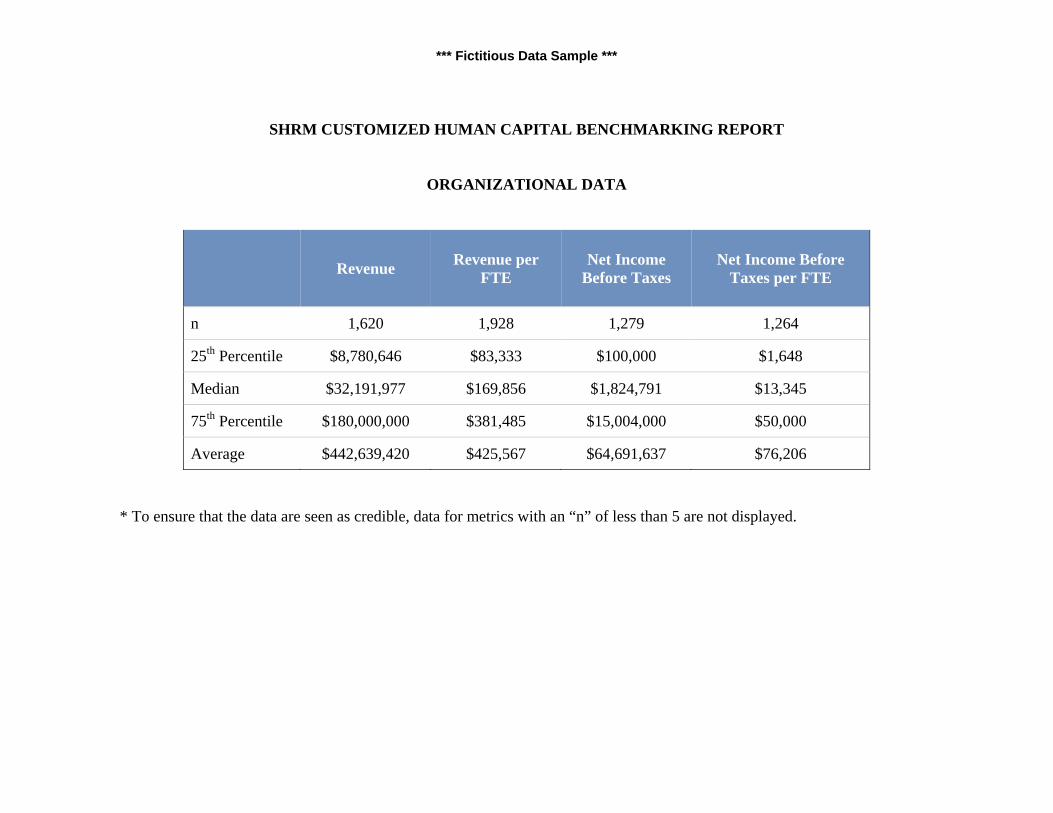
SHRM CUSTOMIZED HUMAN CAPITAL BENCHMARKING REPORT
ORGANIZATIONAL DATA
Revenue Revenue per FTE
Net Income Before Taxes
Net Income Before Taxes per FTE
n 1,620 1,928 1,279 1,264
25th Percentile $8,780,646 $83,333 $100,000 $1,648
Median $32,191,977 $169,856 $1,824,791 $13,345
75th Percentile $180,000,000 $381,485 $15,004,000 $50,000
Average $442,639,420 $425,567 $64,691,637 $76,206
* To ensure that the data are seen as credible, data for metrics with an “n” of less than 5 are not displayed.
*** Fictitious Data Sample ***
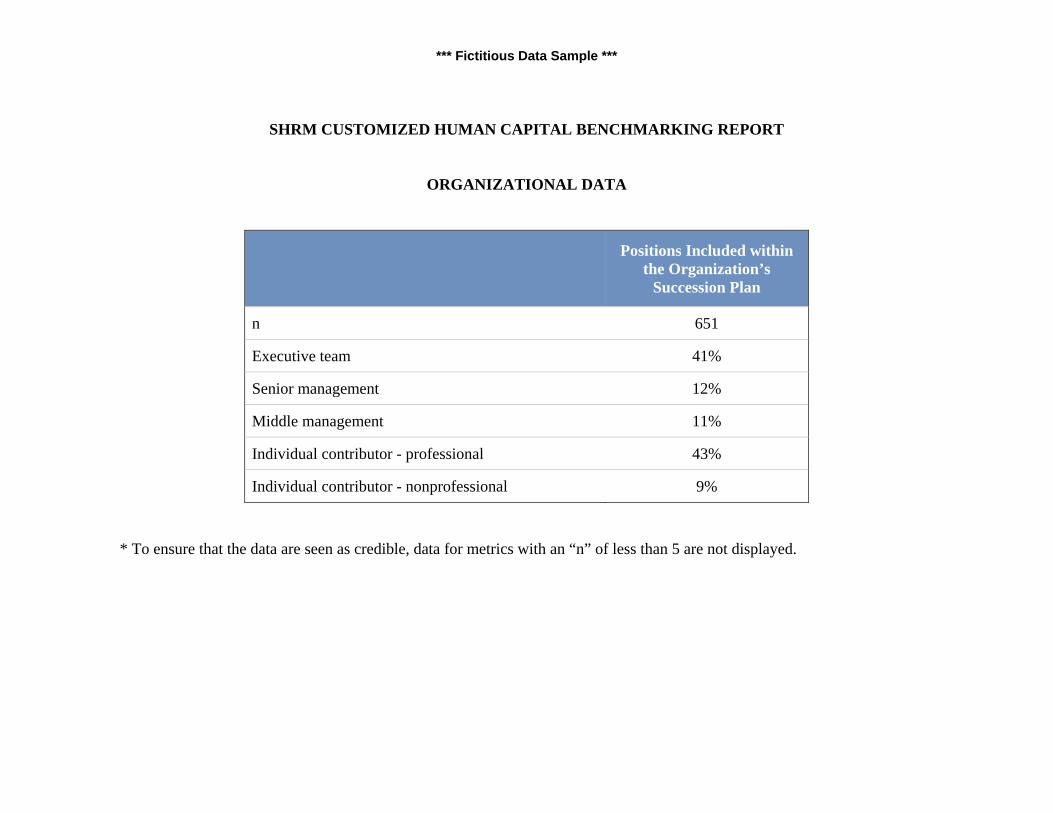
SHRM CUSTOMIZED HUMAN CAPITAL BENCHMARKING REPORT
ORGANIZATIONAL DATA
Positions Included within
the Organization’s Succession Plan
n 651
Executive team 41%
Senior management 12%
Middle management 11%
Individual contributor - professional 43%
Individual contributor - nonprofessional 9% * To ensure that the data are seen as credible, data for metrics with an “n” of less than 5 are not displayed.
*** Fictitious Data Sample ***
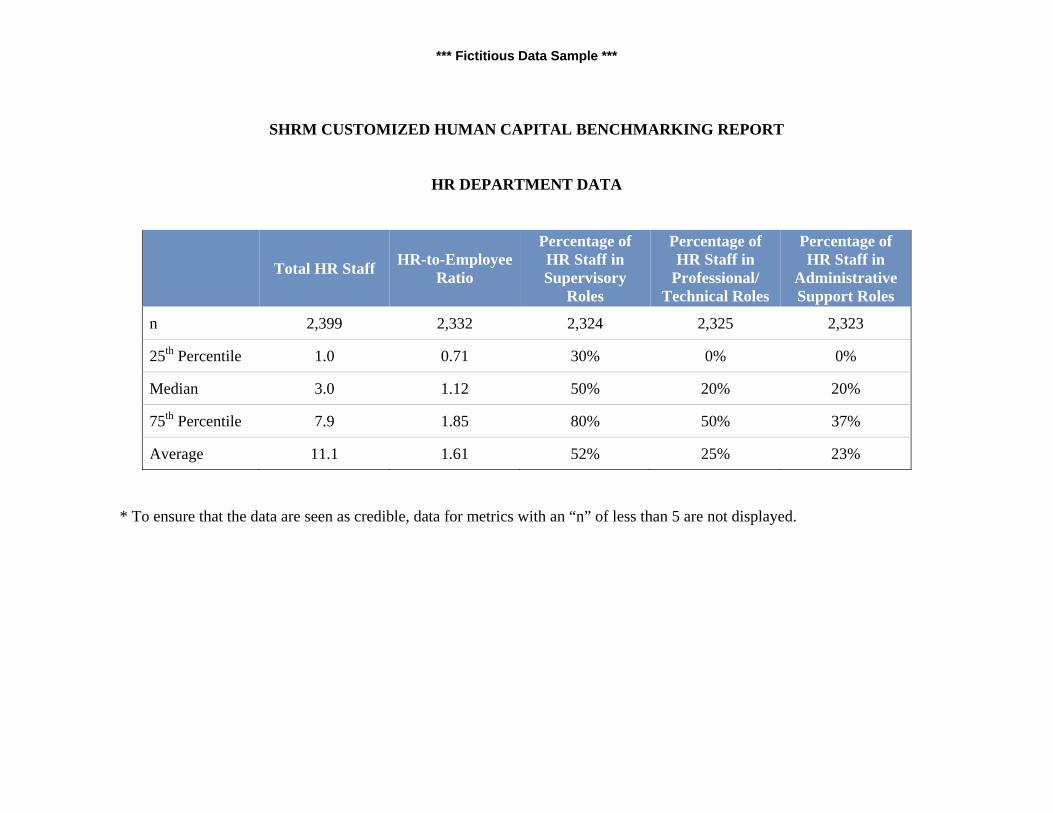
SHRM CUSTOMIZED HUMAN CAPITAL BENCHMARKING REPORT
HR DEPARTMENT DATA
Total HR Staff HR-to-Employee Ratio
Percentage of HR Staff in Supervisory
Roles
Percentage of HR Staff in
Professional/ Technical Roles
Percentage of HR Staff in
Administrative Support Roles
n 2,399 2,332 2,324 2,325 2,323
25th Percentile 1.0 0.71 30% 0% 0%
Median 3.0 1.12 50% 20% 20%
75th Percentile 7.9 1.85 80% 50% 37%
Average 11.1 1.61 52% 25% 23%
* To ensure that the data are seen as credible, data for metrics with an “n” of less than 5 are not displayed.
*** Fictitious Data Sample ***
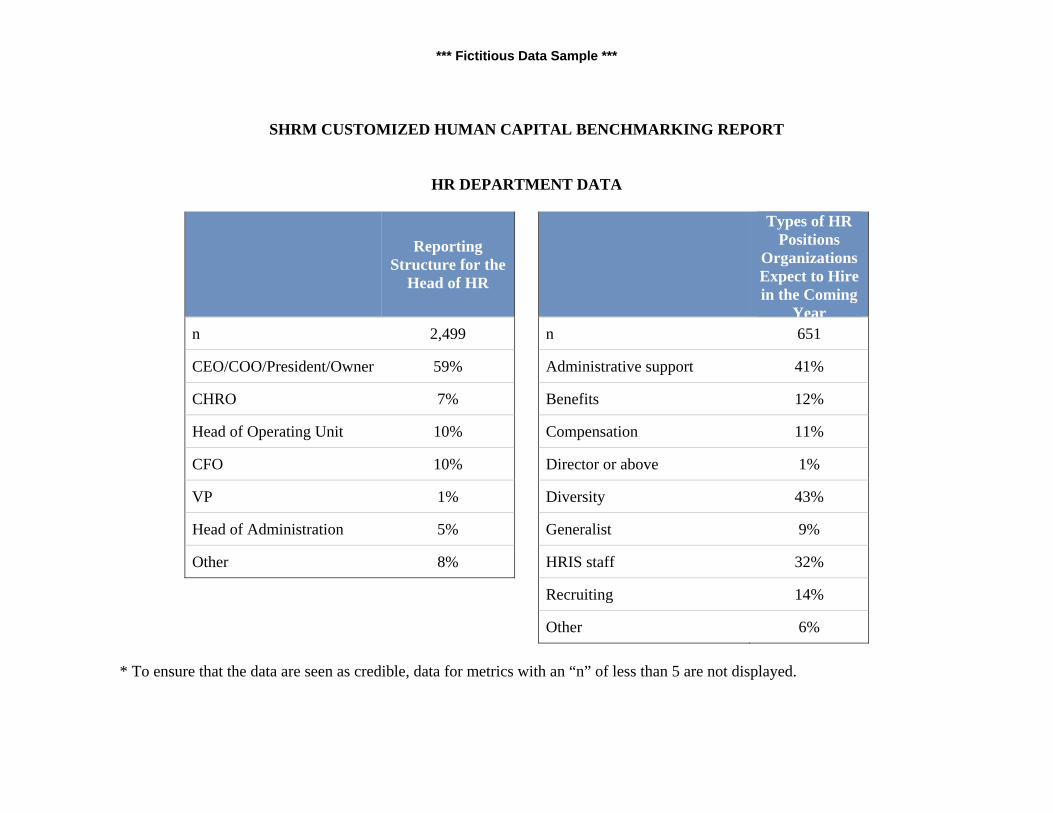
SHRM CUSTOMIZED HUMAN CAPITAL BENCHMARKING REPORT
HR DEPARTMENT DATA
Reporting
Structure for the Head of HR
Types of HR Positions
Organizations Expect to Hire in the Coming
Yearn 2,499 n 651
CEO/COO/President/Owner 59% Administrative support 41%
CHRO 7% Benefits 12%
Head of Operating Unit 10% Compensation 11%
CFO 10% Director or above 1%
VP 1% Diversity 43%
Head of Administration 5% Generalist 9%
Other 8% HRIS staff 32%
Recruiting 14%
Other 6% * To ensure that the data are seen as credible, data for metrics with an “n” of less than 5 are not displayed.
*** Fictitious Data Sample ***
SHRM CUSTOMIZED HUMAN CAPITAL BENCHMARKING REPORT
HR DEPARTMENT DATA
Areas of HR Outsourcing
n 651
Benefits 41%
Recruiting 12%
Employee services 11%
Technology 43%
Other HR activities 9% * To ensure that the data are seen as credible, data for metrics with an “n” of less than 5 are not displayed.

*** Fictitious Data Sample ***
SHRM CUSTOMIZED HUMAN CAPITAL BENCHMARKING REPORT
HR EXPENSE DATA
HR Expenses HR Expense to
Operating Expense Ratio
HR Expense to FTE Ratio
n 670 531 641
25th Percentile $100,000 0.5% $681
Median $256,604 1.2% $1,225
75th Percentile $800,000 2.7% $2,532
Average $1,381,756 7.7% $4,796
* To ensure that the data are seen as credible, data for metrics with an “n” of less than 5 are not displayed.
*** Fictitious Data Sample ***
SHRM CUSTOMIZED HUMAN CAPITAL BENCHMARKING REPORT
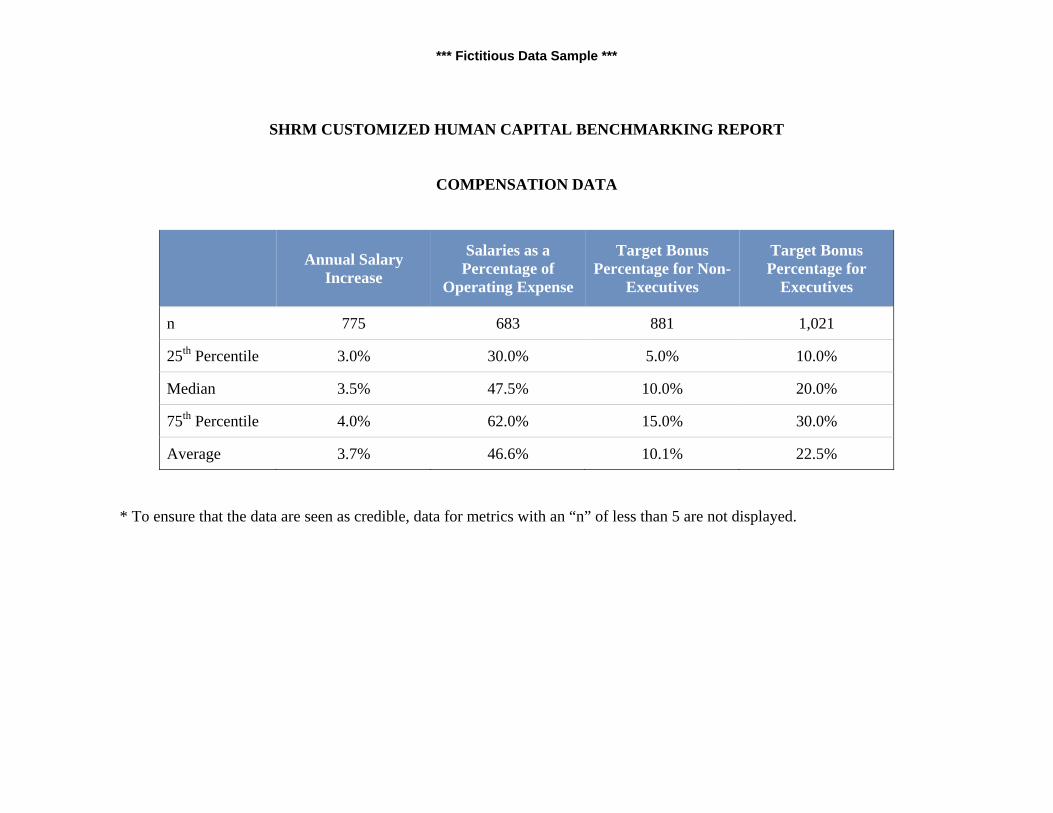
COMPENSATION DATA
Annual Salary Increase
Salaries as a Percentage of
Operating Expense
Target Bonus Percentage for Non-
Executives
Target Bonus Percentage for
Executives
n 775 683 881 1,021
25th Percentile 3.0% 30.0% 5.0% 10.0%
Median 3.5% 47.5% 10.0% 20.0%
75th Percentile 4.0% 62.0% 15.0% 30.0%
Average 3.7% 46.6% 10.1% 22.5% * To ensure that the data are seen as credible, data for metrics with an “n” of less than 5 are not displayed.

*** Fictitious Data Sample ***
SHRM CUSTOMIZED HUMAN CAPITAL BENCHMARKING REPORT
TUITION/EDUCATION DATA
Maximum Reimbursement
Allowed for Tuition/Education Expenses per Year
Percentage of Employees Participating in
Tuition/Education Reimbursement Programs
n 1,450 1,715
25th Percentile $1,500 0.0%
Median $3,000 2.0%
75th Percentile $5,200 5.5%
Average $4,620 5.8%
* To ensure that the data are seen as credible, data for metrics with an “n” of less than 5 are not displayed.
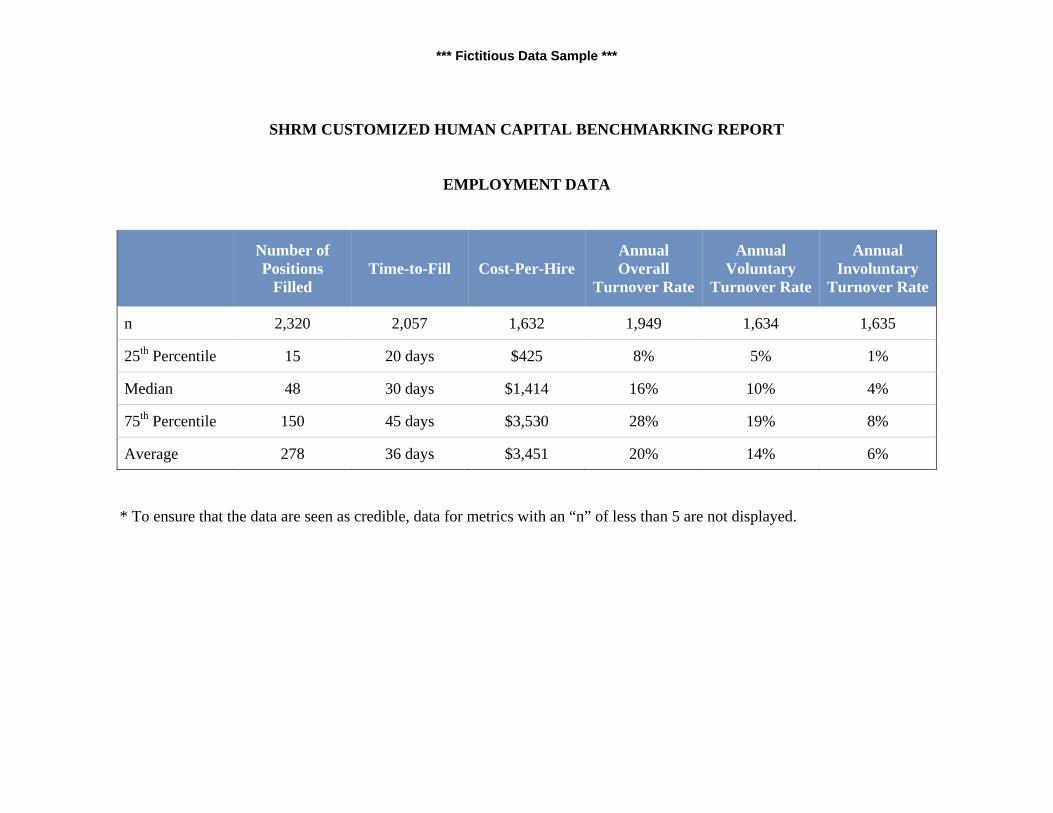
*** Fictitious Data Sample ***
SHRM CUSTOMIZED HUMAN CAPITAL BENCHMARKING REPORT
EMPLOYMENT DATA
Number of Positions
Filled Time-to-Fill Cost-Per-Hire
Annual Overall
Turnover Rate
Annual Voluntary
Turnover Rate
Annual Involuntary
Turnover Rate
n 2,320 2,057 1,632 1,949 1,634 1,635
25th Percentile 15 20 days $425 8% 5% 1%
Median 48 30 days $1,414 16% 10% 4%
75th Percentile 150 45 days $3,530 28% 19% 8%
Average 278 36 days $3,451 20% 14% 6% * To ensure that the data are seen as credible, data for metrics with an “n” of less than 5 are not displayed.
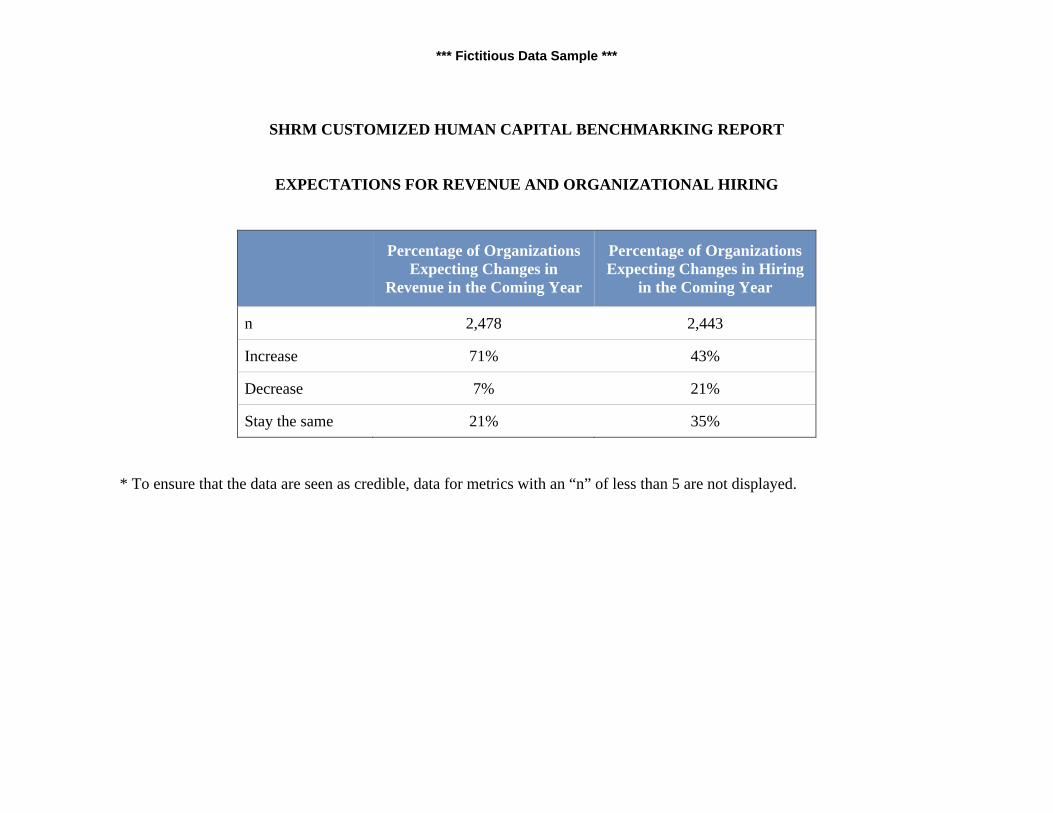
*** Fictitious Data Sample ***
SHRM CUSTOMIZED HUMAN CAPITAL BENCHMARKING REPORT
EXPECTATIONS FOR REVENUE AND ORGANIZATIONAL HIRING
Percentage of Organizations Expecting Changes in
Revenue in the Coming Year
Percentage of Organizations Expecting Changes in Hiring
in the Coming Year
n 2,478 2,443
Increase 71% 43%
Decrease 7% 21%
Stay the same 21% 35%
* To ensure that the data are seen as credible, data for metrics with an “n” of less than 5 are not displayed.
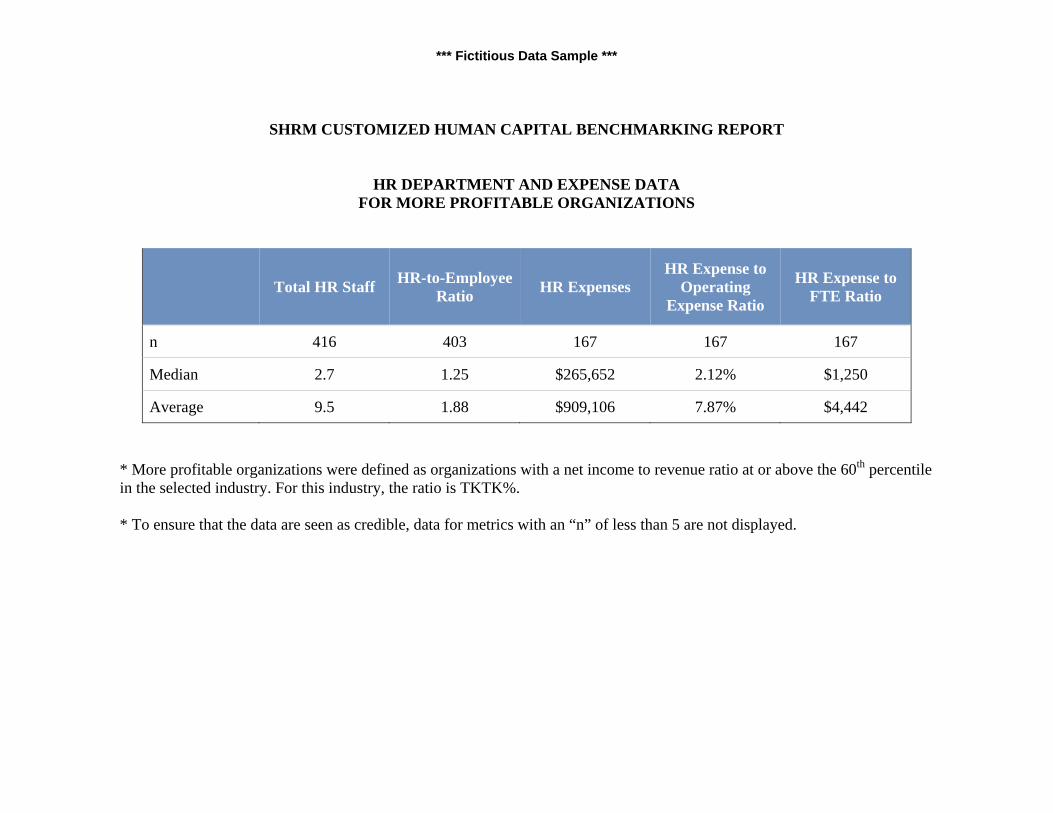
*** Fictitious Data Sample ***
SHRM CUSTOMIZED HUMAN CAPITAL BENCHMARKING REPORT
HR DEPARTMENT AND EXPENSE DATA FOR MORE PROFITABLE ORGANIZATIONS
Total HR Staff HR-to-Employee Ratio HR Expenses
HR Expense to Operating
Expense Ratio
HR Expense to FTE Ratio
n 416 403 167 167 167
Median 2.7 1.25 $265,652 2.12% $1,250
Average 9.5 1.88 $909,106 7.87% $4,442 * More profitable organizations were defined as organizations with a net income to revenue ratio at or above the 60th percentile in the selected industry. For this industry, the ratio is TKTK%. * To ensure that the data are seen as credible, data for metrics with an “n” of less than 5 are not displayed.
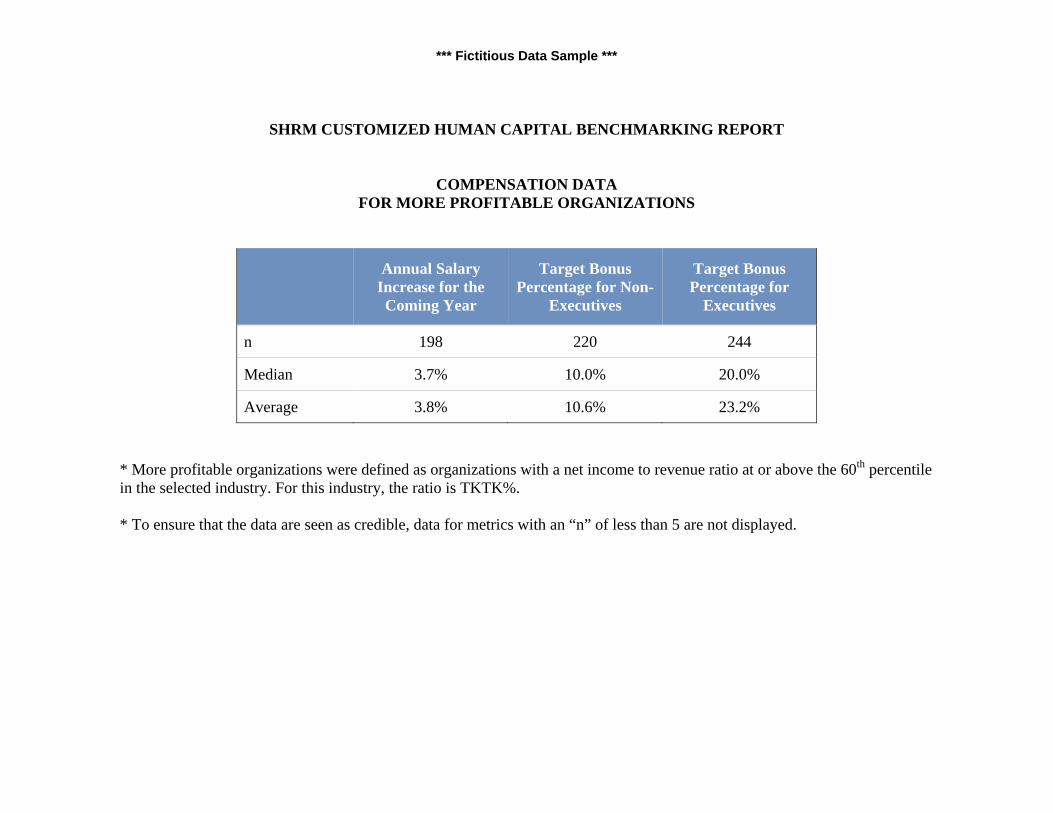
*** Fictitious Data Sample ***
SHRM CUSTOMIZED HUMAN CAPITAL BENCHMARKING REPORT
COMPENSATION DATA FOR MORE PROFITABLE ORGANIZATIONS
Annual Salary
Increase for the Coming Year
Target Bonus Percentage for Non-
Executives
Target Bonus Percentage for
Executives
n 198 220 244
Median 3.7% 10.0% 20.0%
Average 3.8% 10.6% 23.2% * More profitable organizations were defined as organizations with a net income to revenue ratio at or above the 60th percentile in the selected industry. For this industry, the ratio is TKTK%. * To ensure that the data are seen as credible, data for metrics with an “n” of less than 5 are not displayed.

*** Fictitious Data Sample ***
SHRM CUSTOMIZED HUMAN CAPITAL BENCHMARKING REPORT
TUITION/EDUCATION DATA FOR MORE PROFITABLE ORGANIZATIONS
Maximum Reimbursement Allowed for
Tuition/Education Expenses per Year
Percentage of Employees Participating in
Tuition/Education Reimbursement
n 283 356
Median $3,750 2.0%
Average $4,268 6.3% * More profitable organizations were defined as organizations with a net income to revenue ratio at or above the 60th percentile in the selected industry. For this industry, the ratio is TKTK%. * To ensure that the data are seen as credible, data for metrics with an “n” of less than 5 are not displayed.
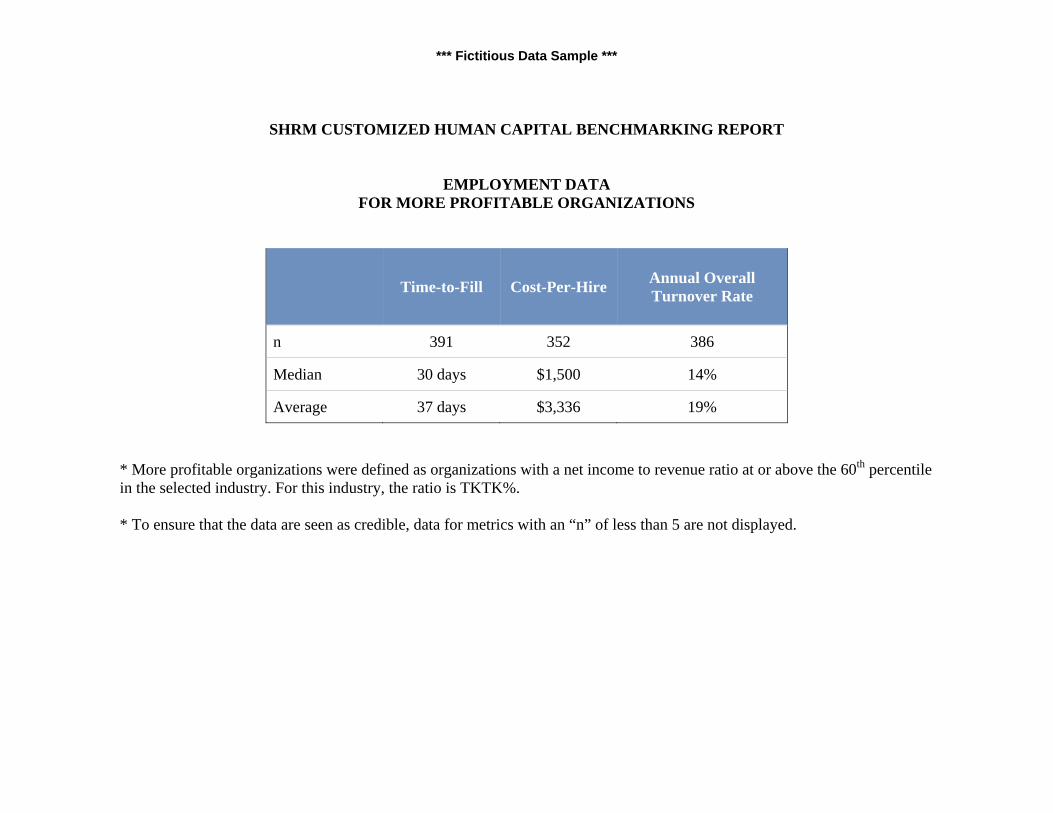
*** Fictitious Data Sample ***
SHRM CUSTOMIZED HUMAN CAPITAL BENCHMARKING REPORT
EMPLOYMENT DATA FOR MORE PROFITABLE ORGANIZATIONS
Time-to-Fill Cost-Per-Hire Annual Overall Turnover Rate
n 391 352 386
Median 30 days $1,500 14%
Average 37 days $3,336 19% * More profitable organizations were defined as organizations with a net income to revenue ratio at or above the 60th percentile in the selected industry. For this industry, the ratio is TKTK%. * To ensure that the data are seen as credible, data for metrics with an “n” of less than 5 are not displayed.
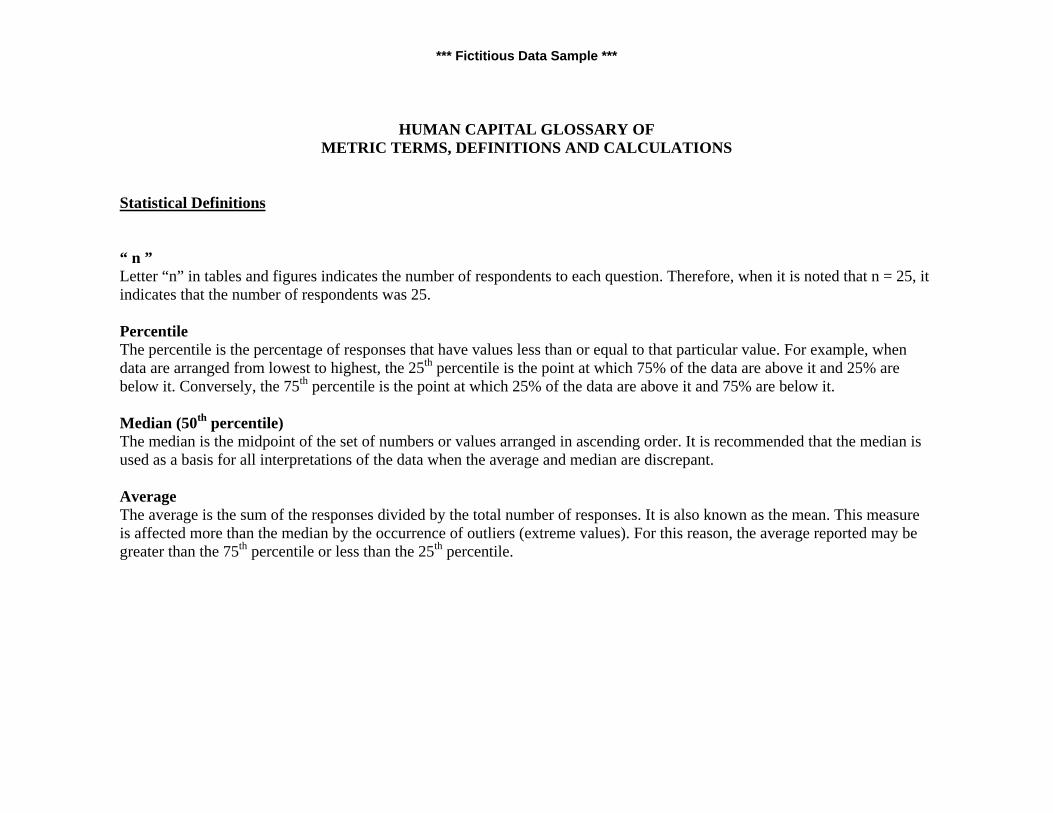
*** Fictitious Data Sample ***
HUMAN CAPITAL GLOSSARY OF METRIC TERMS, DEFINITIONS AND CALCULATIONS
Statistical Definitions “ n ” Letter “n” in tables and figures indicates the number of respondents to each question. Therefore, when it is noted that n = 25, it indicates that the number of respondents was 25. Percentile The percentile is the percentage of responses that have values less than or equal to that particular value. For example, when data are arranged from lowest to highest, the 25th percentile is the point at which 75% of the data are above it and 25% are below it. Conversely, the 75th percentile is the point at which 25% of the data are above it and 75% are below it. Median (50th percentile) The median is the midpoint of the set of numbers or values arranged in ascending order. It is recommended that the median is used as a basis for all interpretations of the data when the average and median are discrepant. Average The average is the sum of the responses divided by the total number of responses. It is also known as the mean. This measure is affected more than the median by the occurrence of outliers (extreme values). For this reason, the average reported may be greater than the 75th percentile or less than the 25th percentile.
*** Fictitious Data Sample ***
Organizational Data FTE FTE is an abbreviation for full-time equivalent. Full-time equivalents represent the total labor hours invested. To convert part-time staff into FTEs, divide the total number of hours worked by part-time employees during the work year by the total number of hours in the work year (e.g., if the average work week is 37.5 hours, total number of hours in a work year would be 37.5 hours/week x 52 weeks = 1,950). Converting the number of employees to FTEs provides a more accurate understanding of the level of effort being applied in an organization. For example, if two employees are job-sharing, the FTE number is only one. Revenue In business, revenue is the amount of money that a company actually receives from its activities, mostly from sales of products and/or services to customers. To investors, revenue is less important than profit, or income, which is the amount of money the company has earned after deducting all of its expenses.
Revenue per FTE Revenue per FTE is the total amount of revenue received during an organization’s fiscal year divided by the number of FTEs. This ratio conceptually links the time and effort associated with the firm’s human capital to its revenue output. If the revenue-per-FTE ratio increases, it indicates that there is greater efficiency and productivity because more output is being produced per FTE. If the ratio decreases, it indicates there is less efficiency and productivity. Net Income before Taxes Net income before taxes is the amount of revenue received during the fiscal year minus the operating expenses during the fiscal year. Net Income before Taxes per FTE Net income before taxes per FTE is the net income before taxes divided by the number of FTEs. It calculates efficiency by taking net income before taxes, which is the difference between gross revenue and expenses, and divides the outcome by the number of FTEs. Unlike revenue per FTE, which has only one factor--revenue, net income per FTE comprises two factors, and it is best looked at over time.
*** Fictitious Data Sample ***
Positions Included within the Organization’s Succession Plan Succession planning varies by organization, and for that reason these data indicate which positions organizations typically include when conducting succession planning. For example, some organizations may include only executive level positions for succession planning while others may include many executive, manager, and supervisory level positions. HR Department Data Total HR Staff Total HR staff is the actual number of employees supporting the HR function for an organizational level. HR-to-Employee Ratio The HR-to-employee ratio provides a more manageable way to compare HR staffing levels between organizations. It represents the number of HR staff per 100 employees supported by HR in the organization. The number is calculated by dividing the number of HR FTEs by the total number of FTEs in the organization and multiplying the outcome by 100:
HR-to-Employee Ratio = Total number of HR FTEs x 100 Total number of employee FTEs in the organization Percentage of HR Staff in Supervisory Roles Percentage of HR staff in supervisory roles is calculated by taking the number of HR staff in supervisory positions (FTEs) and dividing it by the total number of HR staff (FTEs). Because positions in this category supervise others, they often are called supervisor, manager, director or above. Percentage of HR Staff in Professional/Technical Roles
*** Fictitious Data Sample ***
The percentage of HR staff in professional/technical roles is calculated by taking the number of HR staff in professional/technical positions (FTEs) and dividing it by the total number of HR staff (FTEs). Positions in this category are generally exempt and do not supervise others. They may be called recruiter, benefits administrator, HR generalist, etc. Percentage of HR Staff in Administrative Support Roles The percentage of HR staff in administrative support roles is calculated by taking the number of HR staff in administrative support positions (FTEs) and dividing it by the total number of HR staff (FTEs). Often, but not always, positions in this category are non-exempt. They may be called coordinator, assistant, etc. Reporting Structure for the Head of HR Reporting structure for the head of HR indicates to what position within the organization the head of HR reports. Occasionally in very small companies the head of HR may report to the CFO or head of an operating unit. In larger organizations the head of HR usually reports to the president of CEO. Types of HR Positions Organizations Expect to Hire in the Coming Year This metric reflects the expectations for HR hiring, including the types of HR positions that organizations anticipate hiring in 2009. Areas of HR Outsourcing Areas of HR outsourcing indicates what activities or functions within the human resource function are being transferred to an external service provider to perform. HR activities may be partially or completely outsourced and may include areas such as benefits administration, reference checking, HR technology, etc. HR Expense Data HR Expenses Human resource expenses represent HR’s total costs for a given fiscal year.
HR Expense to Operating Expense Ratio
*** Fictitious Data Sample ***
HR expense to operating expense ratio is calculated by dividing the organization’s total HR expenses by the operating expenses for a given fiscal year. This ratio depicts the amount of HR expenses as a percentage of total operating expenses, which is an indication of the amount of dollars an organization invests in its HR function. HR Expense to FTE Ratio HR expense by FTE ratio represents the amount of human resource dollars spent per FTE in the organization. It is calculated by taking the HR expenses for a given fiscal year and dividing them by the number of FTEs in the organization. Compensation Data Annual Salary Increase Annual salary increase is the percentage of increase in salaries that an organization expects to provide to its employees for a given fiscal year. Salaries as a Percentage of Operating Expense Salaries as a percentage of operating expense is calculated by taking the total amount of employee salaries divided by the operating expense for a given fiscal year. Target Bonus Percentage for Non-Executives The target bonus for non-executives represents the average percentage of base pay that is targeted to be paid out in cash to non-executive staff during a given year. Target Bonus Percentage for Executives The target bonus for executives represents the average percentage of base pay that is targeted to be paid out in cash to executive staff during a given year. Tuition/Education Data
*** Fictitious Data Sample ***
Maximum Reimbursement Allowed for Tuition/Education Expenses per Year The maximum reimbursement allowed for tuition/education expenses per year is the average amount in dollars per employee the organization paid per employee for tuition/education. These expenses do not include training expenses for seminars, etc, that are not part of a college- or university-level undergraduate or graduate course(s). Percentage of Employees Participating in Tuition/Education Reimbursement Programs The percentage of employees participating in tuition or education reimbursement programs is the percentage of employees that participated in tuition reimbursement programs. These do not include reimbursements for seminars, etc. that are not part of a college or university level undergraduate or graduate course(s). Employment Data Number of Positions Filled Number of positions filled reflects the number of open positions for which individuals were hired during the fiscal year. Open positions could be filled either by internal or external candidates. “Hired” means the individual accepted the position during the fiscal year, but may not have started until the following year. This would occur mostly with those candidates who accepted positions during the last month of the organization’s fiscal year. Time-to-Fill Time-to-fill represents the number of days from when the job requisition was opened until the offer was accepted by the candidate.1 This number is calculated using calendar days, including weekends and holidays. Cost-Per-Hire Cost-per-hire represents the costs involved with a new hire. These costs include the sum of advertising, agency fees, employee referrals, travel cost of applicants and staff, relocation costs, and recruiter pay and benefits2 divided by the number of hires. Annual Overall Turnover Rate Annual overall turnover rate is the rate at which employees enter and leave a company in a given fiscal year. Typically, the more loyal employees are to a firm, the lower the turnover rate. A 100% turnover rate from year to year means that as many
*** Fictitious Data Sample ***
employees left the company as were hired. To calculate annual turnover, first calculate turnover for each month by dividing the number of separations during the month by the average number of employees during the month and multiplying by 100: # of separations during month ÷ average # of employees during the month x 100.3 The annual turnover rate is then calculated by adding the 12 months worth of turnover percentages together. Annual Voluntary Turnover Rate Annual voluntary turnover rate is the rate at which employees enter and voluntarily leave a company in a given fiscal year. To calculate annual voluntary turnover, first calculate the voluntary turnover for each month by dividing the number of voluntary separations during the month by the average number of employees during the month and multiplying by 100: # of voluntary separations during month ÷ average # of employees during the month x 100. The annual voluntary turnover rate is then calculated by adding the 12 months worth of voluntary turnover percentages together. Annual Involuntary Turnover Rate Annual involuntary turnover rate is the rate at which employees enter and involuntarily leave a company in a given fiscal year. Involuntary terminations, for example, occur when the organization asks the employee to leave the company. They usually occur as a result of poor performance, layoffs or other reasons. To calculate annual involuntary turnover rate, first calculate involuntary turnover for each month by dividing the number of involuntary separations during the month by the average number of employees during the month and multiplying by 100: # of involuntary separations during month ÷ average # of employees during the month x 100. The annual involuntary turnover rate is then calculated by adding the 12 months worth of turnover percentages together. Expectations for Revenue and Organizational Hiring Percentage of Organizations Expecting Changes in Revenue in the Coming Year The expectations for revenue change indicate whether HR professionals anticipate their organization’s revenue to increase, decrease or stay the same in 2009 as compared to 2007. Percentage of Organizations Expecting Changes in Hiring in the Coming Year
*** Fictitious Data Sample ***
The expectations for changes in hiring indicate whether HR professionals anticipate their organization’s hiring activity to increase, decrease or stay the same in 2009 as compared to 2007. More Profitable Organizations More profitable organizations were defined as organizations with a net income to revenue ratio at or above the 60th percentile in their industry.
1 Kluttz, L. (2003). SHRM/EMA 2002 staffing metrics survey: Time to fill/time to start. Alexandria, VA: Society for Human Resource Management. 2 Society for Human Resource Management. HR metrics toolkit. Retrieved from www.shrm.org/metrics/library_published/nonIC/CMS_005910.asp. 3 Society for Human Resource Management. HR metrics toolkit. Retrieved from www.shrm.org/metrics/library_published/nonIC/CMS_005910.asp.
Project TeamProject leader: John Dooney, manager, Strategic Research
Project contributors: Olivia Blackmon, strategic research specialist Steve Williams, Ph�D�, SPHR, director, SHRM Research
External reviewers: SHRM Human Capital Measurement/HR Metrics Special Expertise Panel: Ron Adler, Jane Aggarwal, SPHR, Crist Berry, SPHR, Joanne Bintliff-Ritchie, SPHR, Barbara Casper, Ed�D�, William Greenhaigh, Steven Hunt, Ph�D�, SPHR, Catherine Johnson-Komins, PHR, Jane Lewis, SPHR, Donald P� Rogers, Ph�D�, SPHR, Uma Sivasubramani, MBA, SPHR, Raelyn Trende, MBA, SPHR, Jeffrey Weaver, Ph�D�
Editing: Katya Scanlan, copy editor
Design: Terry Biddle, graphic designer
This report published by the Society for Human Resource Management (SHRM)� All content is for informational purposes only and is not to be construed as a guaranteed outcome� The Society for Human Resource Management cannot accept responsibility for any errors or omissions or any liability resulting from the use or misuse of any such information�
© 2009 Society for Human Resource Management� All rights reserved�
This publication may not be reproduced, stored in a retrieval system or transmitted in whole or in part, in any form or by any means, electronic, mechanical, photocopying, recording or otherwise, without the prior written permission of the Society for Human Resource Management, 1800 Duke Street, Alexandria, VA 22314, USA�
For more information, please contact:
SHRM Research Department 1800 Duke Street, Alexandria, VA 22314, USA Phone: (703) 548-3440 Fax: (703) 535-6432 Web: www�shrm�org/research
09-0620

1800 Duke StreetAlexandria, VA 22314-3499