siebel & portal performance testing and tuning - … & portal performance testing and tuning...
TRANSCRIPT

Copyright © 2012 Tata Consultancy Services Limited
By Zubair Syed ([email protected])
April 2014
Siebel & Portal Performance Testing and Tuning
GCP - IT Performance Practice

GCP-IT Performance Practice
TCS Confidential
Overview
• A large insurance company
• Recorded High growth recently
• Has potential to capture larger market
Business Challenges
• Changing business needs
• Dynamics in the market and offerings
• Existing systems and their limitations due to legacy technology
• Time constraints to launch offers to the market
Solution
Embarked on TEBT (Technology Enabled Business Transformation) program
- 1 -

GCP-IT Performance Practice
TCS Confidential
Challenges – Performance Engineering
• Capacity of performance environment < 25% of production
• Incomplete performance NFRs
• Tool not identified, hence to be purchased for performance testing
• Initial go-live release, no history of application usage. Hence – Requiring rigorous performance testing
– Identifying and fixing performance bottlenecks
• Time constraints for test prep and execution phases
- 2 -

GCP-IT Performance Practice
TCS Confidential
Architecture
Lead Management System
Creation of Leads
Update Leads
Search Lead
Reports
Bulk Upload
Oracle HTTP Server 1
Oracle HTTP Server 1
Siebel App 1
Siebel App 2
Siebel Database
Ph
ys
ica
l L
oad
Bala
nce
r
JVM App 1
IBM HTTP Server 1
JVM App 2
Oracle DB Siebel CRM
Portal
Call Center
Reps
External
Partners
SOA
Services
Siebel CRM is used by client’s call center reps
Client offices located across the geography
Located within their high bandwidth network
Portal is the channel for client’s partners who also generate leads for them
Located outside client’s premises
Connected to client’s network over an extended pipe (1 gig, NDSL etc.)
IBM HTTP Server 2
- 3 -

GCP-IT Performance Practice
TCS Confidential
Test Approach
Performance Testing Tool
IBM Rational Performance Tester (Siebel-web
protocol for Siebel, HTTP for Portal)
Scenarios
Peak Load Test – Peak day of the month
scenario
Endurance Test – Average load for 6 hours
business day
Switch over Test – Active Passive node switch
over
Workload
OLTP + Reports + Bulk uploads
Monitoring
NMON, AWR, Application Logs
Profiling
Splunk, PMAT
- 4 -

GCP-IT Performance Practice
TCS Confidential
Results and SLAs
SLAs 4 seconds for search operations
4 seconds for create/insert
Reports generation in 30 seconds
Results
High response time (Portal)
Resource utilization healthy
No deadlocks in DB
Cause Analysis Siebel EAI connection pooling
Portal web pages
Queries
2.4
1.2
2.1 1.7
0
1
2
3
4
5
Txn 1 Txn 2 Txn 3 Txn 4
Response T
ime in S
ec
Siebel Transactions
Response Time (Sec) SLA (Sec)
10.3 8.9
12.4 11.8
0
2
4
6
8
10
12
14
Txn 4 Txn 5 Txn 6 Txn 6Response T
ime in S
ec
Portal Transactions
Response Time (Sec) SLA (Sec)
- 5 -

GCP-IT Performance Practice
TCS Confidential
Finding # 1
Both have same End-user
functionality
Common Load Balancer
Oracle HTTP Server 1
Siebel App 1
Siebel App 2
Siebel Database
Ph
ys
ica
l L
oad
Bala
nce
r
IBM HTTP Server 2 JVM App 2
Oracle
DB Siebel CRM
Portal
Call Center
Reps
External
Partners
SOA
Services
EAI OM
AOM
Connection pool In Siebel EAI
Where is the issue, where Portal differs from Siebel?
Common Siebel App tier & DB for both
UIs
Testing from within the LAN
Solution and Best Practice:
Configure connection pools EAI objects manager
Oracle HTTP Server 1
IBM HTTP Server 1 JVM App 1
- 6 -
GCP-IT Performance Practice
TCS Confidential
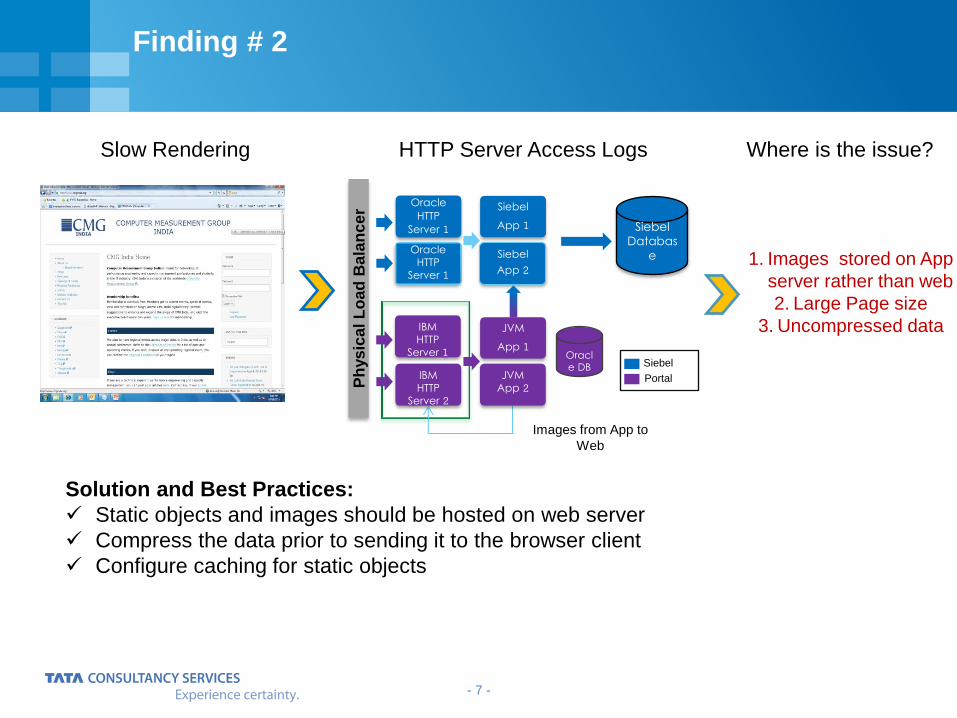
Finding # 2
HTTP Server Access Logs
1. Images stored on App
server rather than web
2. Large Page size
3. Uncompressed data
Solution and Best Practices:
Static objects and images should be hosted on web server
Compress the data prior to sending it to the browser client
Configure caching for static objects
Where is the issue? Slow Rendering
Images from App to
Web
Oracle HTTP
Server 1
Oracle HTTP
Server 1
Siebel App 1
Siebel App 2
Siebel Databas
e
Ph
ys
ica
l L
oad
Bala
nce
r IBM HTTP
Server 2
JVM App 1
JVM App 2
Oracle DB Siebel
Portal
IBM HTTP
Server 1
- 7 -

GCP-IT Performance Practice
TCS Confidential
Extrapolation
Extrapolation Techniques
Analytical models works for specific hardware configuration
Linear extrapolation works until any performance bottleneck is reached
PERF Capacity (%) vs. PROD
CPU RAM
IBM Web Tier 33.33% 50.00%
IBM App 66.67% 100.00%
CRM Web Tier 33.33% 16.67%
CRM App Tier 22.22% 22.22%
Gateway Tier 100.00% 66.67%
DB Tier 66.67% 16.67%
Disparate capacity between PERF and
PROD
No uniformity across the servers (approx.
25% of PROD)
Limitation in terms of tool license (250
users)
Challenges
Testing to be done on lower capacity
Build the confidence for PROD roll-out
PERF results should prove that PROD
capacity is scalable
- 8 -

GCP-IT Performance Practice
TCS Confidential
Continued…
What model?
One CPU unit:
1. Setup servers with one CPU
units on each tier
2. Execute tests on single CPU
units and validate against
SLAs
3. Find the breakpoint where
TPS starts degrading
4. Repeat same exercise on 2
CPU units and validate if
principle works
Note: One CPU unit does not necessarily
mean 1 CPU on each server, if the database
server needs at least 2 CPU cores to run
then that is 1 CPU unit for DB.
Response
Time CPU Utilization
4 sec for search
5 sec for insert <= 75 Warning
<= 90 Threshold
Breakpoint criteria
0
10
20
30
40
50
60
70
80
90
100
0
5
10
15
20
25
30
35
40
45
50
25 50 75 100 125 150 175 200 225 250
Tra
nsacti
on
s P
er
Min
ute
Concurrent Users TPS
Resource
Reso
urc
e
- 9 -

GCP-IT Performance Practice
TCS Confidential
Continued…
Oracle HTTP Server 1
Oracle HTTP Server 1
Siebel App 1
Siebel App 2
Siebel Database
Ph
ys
ica
l L
oad
Bala
nce
r
IBM HTTP Server 1
IBM HTTP Server 2
JVM App 1
JVM App 2
Oracle
DB Siebel CRM
Portal
Call Center
Reps
External
Partners
SOA
Services
Down
Transactions Per Minute
Target Actual Breakpoint
1 Unit 17.50 17.50 48
2 Units 35 35 98
PROD 140 NA NA
Targeted to prove the hardware scalability with this model
Assumed that application will scale linearly (Siebel CRM being a proven architecture)
Breakpoint on the PERF setup is close to 70% of PROD TPS, minimized linear
scalability risk
Best Practices
Application is optimized prior to extrapolation exercise
TCS research lab says; Mixed (Linear + Statistical) model predicts real-time
scalability
(PerfExt is a TCS tool that works on this principle, time limitations did not permit to explore this option)
One CPU unit (1 path)
- 10 -

GCP-IT Performance Practice
TCS Confidential
Open floor Q&A
- 11 -

GCP-IT Performance Practice
TCS Confidential
Thank You
12