signal detection theory pain measures: empirical ... rollman sdt and adaptation level...signal...
TRANSCRIPT
pain, 6 (1979) 9-21 © Elsevier/North-Holland Biomedical Press
SIGNAL DETECTION THEORY PAIN MEASURES: EMPIRICAL VALIDATION STUDIES AND ADAPTATION-LEVEL EFFECT~
GARY B. ROLLMAN
Department of Psychology, The University of Western Ontario, London, Ont. N6A 5C2 (Canada)
(Accepted September 19th, 1978)
SUMMARY
Proponents of the use of signal detection theory (SDT) in the assessment of pain modulation have generally looked for changes in d' to indicate a reduction of sensory function, and a change in criterion to indicate a modifi- cation of the subject's response bias or attitudinal predisposition. In the first experiment, both assumptions failed to receive empirical verification. Dis- crimination d' was equivalent before and after two strong levels of electrical current were reduced. The criterion parameter appeared to shift in a more conservative direction after the stimulus diminution. These results are used to question the validity of both detection and discrimination indices in the measurement of pain. An alternative means for describing the experimental results revealed a striking adaptation-level effect with implications for the assessment of both experimentally induced and endogenous pain. The out- come of a second experiment reinforced the adaptation-level theory inter- pretation of the results and provided additional evidence concerning the dif- ficulties in evaluating SDT parameters in studies of potential analgesics.
INTRODUCTION
Some fundamental disagreements about the validity of signal detection theory (SDT) methods for the assessment of experimentally induced pain have surfaced in recent years. Rollman [ 33,34] and McBumey [27,28] have indicated that SDT is not suitable for the unequivocal separation of sensory and judgmental factors influenced by putative pain modulation procedures. The techniques utilized to obtain the SDT parameters (d' and criterion) mea- sure the discrimination of stimulus pairs (or, in a special case, the discrimina- tion of a stimulus~ and a blank). They d o n o t measure pain. Consequently, one cannot be c e ~ in the interpretation of experimental results. A reduc- tion i n d ' ~ need no t indicate a~reduction in experienced pain; a reduction in

10
experienced pain need not yield a reduction in d'. Chapman [8] has acknowledged some of these difficulties while asserting
that "discrimination and detection are the only windows presently available to the psychophysicist seeking to apply quantitative methods o f inquiry to the mystery of pain." If that model fails to prove valid, it is not a cause for dispair. Other investigators have demonstrated the promise of alternative rigorous approaches in the scaling of human discomfo3~, based upon a variety of both direct and indirect psychophysical procedures [e.g., 21--23, 25,30,36].
The present study undertook an examination of some of the basic tenets of the SDT approach to pain assessment. To do so, it measured the discrimi- nation of adjacent levels of electrically induced pain before and after an experimental manipulation selected to clearly reduce the sensory input of the stimuli. In this way, it provided a conceptual model of the techniques utilized previously to measure the effect of potential analgesics such as acupuncture [9,11,13,15,16,26], transcutaneous stimulation [6,13,15,29], nitrous oxide [11,12], diazepam [10], and cognitive manipulations [18,19]. Most proponeats of the SDT approach to pain expect a reduction in d' if the sensory function is diminished by the modulation procedure [7,13,14] and an alteration in the criterion if the effect is to bias the verbal descriptions offered as a pain response [16]. Only one group of investigators [6,29] have concluded that such analyses are inadequate.
In this study, d' for a pair o f stimuli was determined before and after a significant attenuation of the electrical current levels. The decline in sensory activity yielded no change in d' and a misleading shift in the response bias measure. Under one condition, the pain ratings failed to reflect the ordering of stimulus intensities. The resulting function demonstrated the existence of adaptation-level effects in the rating of experimental pain which have poten- tial implications for assessing pain of internal origin.
METHODS
Experimen t I Three university students received trains of electrical pulses delivered
through a pair of cream-filled silver electrodes attached to the volar surface of the left forearm. The electrodes were connected to the output of a constant-current stimulation system, programmed to provide 60 1-msec monophasic square wave pulses, with a frequency of 100 Hz. The onset of each train was signaled by a w~ning light presented 500 msec prior to the shock.
After several 1-h practice sessions, the subjects participated in 5 experi- mental sessions. At the start of each, an ascending method of limits was used to obtain ,estimates of the thresholds for pain and tolerance. Two "high" intensity (near the tolerance level) and two "low" intensity (closer to the pain threshold level) current values were selected. For ease of exposition, these intensities will be labeled It, I2, I3, and I4. The latter two constitute the

II
high current pair. I4 was determined by selecting the current level which was three~luarters of the way between pain threshold and tolerance threshold (0.75 (Tolerance-Pain Threshold)+ Pain Threshold), I3 was set at 0.94 14. Current levels 11 and 12 were determined by reducing 13 and 14, respectively, by 8%.
In each session, observers received 252 trials, blocked into two halves. One half consisted of 63 I~ and 63 I2 trials, the other half contained 63 presenta- tions each of I3 and 14. During each half,~, the order of stimulus levels was random. As well, the selection of which of the two pairs, the low or the high, occurred in the first half of each session was randomly determined.
Subjects were instructed in the use of an 8-point rating scale to describe the experience resulting on each trial. A chart placed in front of them listed each category and the corresponding numeral: Nothing (1), Tactile Sensa- tion (2), Very Faint Pain (3), Faint Pain (4), Mild Pain (5), Moderate Pain (6), Strong Pain (7), and Very Strong Pain (8). After each subjective rating was given, there was a 2-sec pause before the next presentation.
Experiment H This experiment was similar to the first, with one important modification.
In the previous experiment, I1 and I2 were presented randomly in one half of the session, and Is and h were presented randomly in the other half. Experiment IIA constituted a replication of that study with 4 new observers. In experiment IIB, however, these same subjects received all 4 intensities in a random order throughout entire sessions of 252 trials. Five sessions per sub- ject were run in both conditions A and B. Current values were selected by utilizing the rules for the first experiment. Subjects employed the same rating scale, but were permitted to add + a n d - responses if the sensation seemed to fall between the suggested categories.
RESULTS
Experiment I The data were treated for individual subjects and sessions, utilizing the
normal SDT approach [14]. For each stimulus, the proportion of ratings at each category was calculated. Cumulative proportions were then obtained, treating the highest rating category as one subjective criterion, the second highest as the next criterion, etc. In this way it was possible to determine how often the subject described each stimulus as a very strong pain, as a strong pain or very strong pain, as a moderate pain, strong pcin, or very strong pain, etc. The probability of saying "very strong pain" given the more intense stimulus .of a pair (the signal, s) is one determinst~on it. the SDT analysis. It can be labeled P(8is). The next value of interest is P(7 or 8Is) or P(>~TIs). Such summations occur until one obtains P(>~21s). P(~>lls) is not utilized, since it must equal 1.0. Thus, the 8-point scale can give rise to 7 cumulative proportions. A similar analysis is performed for the weaker stimulus in the pair (sometimes called the noise, n). Corresponding cumula-
12
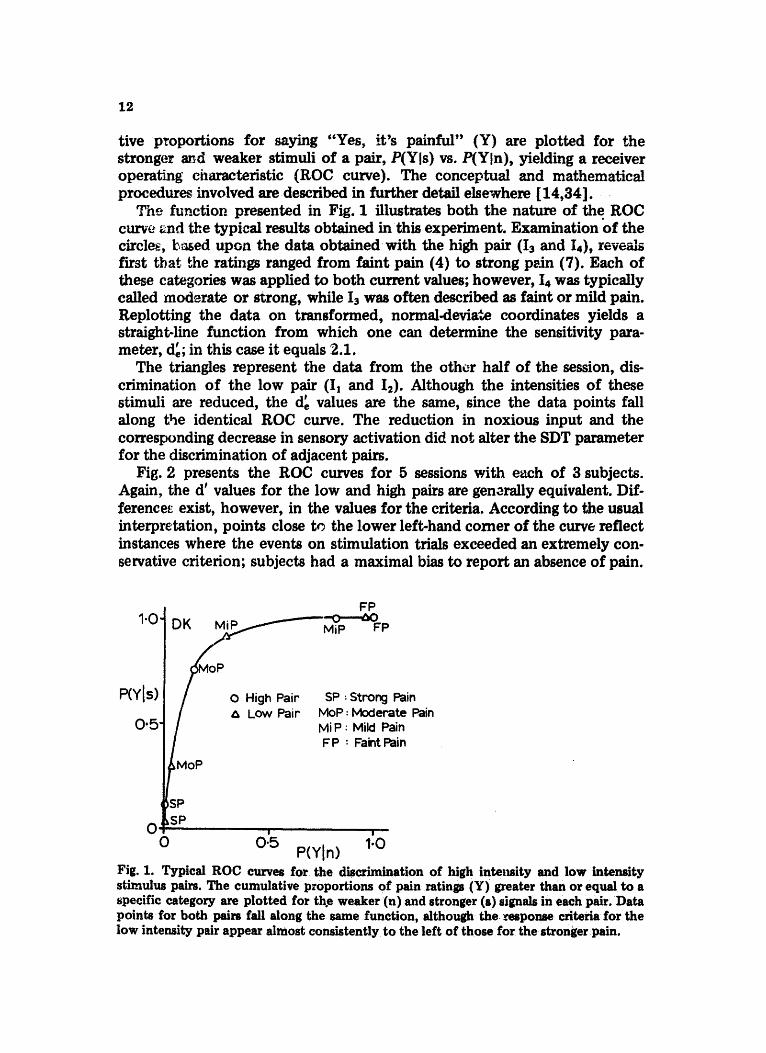
tive proportions for saying "Yes, it's painful" (Y) are plotted for the stronger and weaker stimuli of a pair, P(YIs) vs. P(YIn), yielding a receiver operating characteristic (ROC curve). The conceptual and mathematical procedures involved are described in further detail elsewhere [14,34]. •
The function presented in Fig. 1 illustrates both the nature of the ROC curve and the typical results obtained inthis experiment. Examination of the circles, b~ed upon the data obtainedwith the high pair (I3 and I4), reveal~ first that the ratings ranged from faint pain (4) to strong pvJn (7). Each of these categories was applied to both current values; however, I4 was typically called moderate or strong, while I3 was often described as faint or mild pain. Replotting the data on transformed, normal<leviate coordinates yields a straight, line function from which one can determine the sensitivity para- meter, d~; in this case it equals 2.1.
The triangles represent the data from the other half of the session, dis- crimination of the low pair (Is and I2). Although the intensities of these stimuli are reduced, the d~ values are the same, since the data points fall along the identical ROC curve. The reduction in noxious input and the corresponding decrease in sensory activation did not alter the SDT parameter for the discrimination of adjacent pairs.
Fig. 2 presents the ROC curves for 5 sessions with each of 3 subjects. Again, the d' values for the low and high pairs are generally equivalent. Dif- ference~ exist, however, in the values for the criteria. According to the usual interpretation, points close to the lower left, hand comer of the curve reflect instances where the events on stimulation trials exceeded an extremely con- servative criterion; subjects had a maximal bias to report an absence of pain.
1.0-
P(YIs) 0.5"
FP DK ~ M ~ ~ ~ p ~::~p
~ o P 0 High Pair _ SP : Strong Pain [ ~ LOw Pair Iv~P: Moderate Pain / Mi P : Mild Pain I F P : Faint Pain
MoP
;P SP
' " I
o 1.o P(YIn) Fig. 1. Typical ROC curves for the discrimination of high intensity and low intensity stimulus pairs. The cumulative proportions of pain ratings (Y) greater than or equal to a specific category are plotted for the weaker (n) and stronger (s)signals in each pair, Data points for both pairs fall along the same function, although the ~esponse criteria for the low intensity pair appear almost consistently to the left of those for the stronger :pain.

SESSION 1 SESSION 2 SESSION 3 SESSION 4
4 3
SESSK)N 5
P(YIs)
4
o:ll, o~---- ,----- 0 (>5 1.0 0 05 1.0 0 0-5 1.0 0 (>5
P(YIn) 7- Strong Pain 5 - ~411d Pain
6 o~ 1.b
co- Modera te Pa~n 4 - I:a~nt Pa,n
Fig. 2. ROC curves for each of 5 sessions for 3 subjects in experiment I.
13
Points closer to the upper right-hand comer represent the consequences of increasingly lower, more liberal criteria; the subjects had a maximal bias to report the presence of pain.
A variety of statistical conventions have been adopted by pain investiga- tom to report the location of the criteria. The procedures are described else- where [e.g.. 9~14]. Although the values for the criterion parameter differ, depending t~p~n the method emp|oyed, the conclu~io~m drawn from a com- ~ n of resultm within a ~tudy are usually the same. For example, the mild pain criterion (a rating of 5) for the first ROC curve in Fig. 2 (Subject Ji'V, session 1) yields the foll,:~wing results fQr :he 1o~ p~ir (triangle) and high pair (c~cle.), respectively; criterion, measure: L~. |14]: 1.10 and 0.66, Cx [14]: 0.71 and 0.39; pvr cent bias [9]: 12.5 and --43.2. By each of the 3 mea- sure, the criterion is "higher" in the fn~t instance.
Thk ordering of criterion values is highly consistent. In nearly all compari- sons, the trimlgles corresponding to a specified rating category are closer to the lower left corner than are the circles. The general interpretation offered by the SDT investigators is that the criteria for the low intensity pair are higher than the criteria for the high intensity pair and because of these response biases, the subjects are less inclined to report the low intensity stimuli as painful.
Fig. 3 presents an alternative means for describing the data obtained in experiment L For each session, it gives the proportion of trials at each inten- sity which the subject described as moderate pain or stronger (~>6), mild pain

14
SESSION 1 SESSION 2 SESSION 3 SESSION 4
°'°;~t°'75]"5 1, f *6 *6 -'4
0 / ~ , , # , ~ ,
sEsSION 5
~ 0"5 t ~ 0 . 2 5
e - O " , • • o ~ 2 3 ~ ,~ ~)~ ~ 0
°'L" J f I fJ i t o751. 5 .~ ,5
0"51 0'25
! j ~ B ~ ~ B ~ '~
,f 4 ,~ B
CURRENT (rna/0.75) 6-Moderate pain 5-Mild pan 4 - Faint. pain
Fig. 3. The proportion of trials rated as painful (generally mild pain or greater (~>5) or moderate pain or greater (~ 6)) for each of 4 stimulus levels in experiment I. The lower pair (triangles) were presented during one-half of each session; the higher intensity pair (circles) were presented during the other half.
or stronger (I>5), and, in one instance, faint pain or stronger (>t4). The cate- gory used to partition the results varied slightly between observers because of individual differences in how often subjects utilized the highest ratings. The functions represent an index of, painfulness associated with each of the stimuli. The first two points, triangles, represent the responses given to I1 and I2; the latter two points, circles, represent the proportion of higher pain responses given to Is and I4. Instead of the expected monotonically increas- ing psychometric functions, the points produced .'[unctions which show a marked "zig-zag" effect. Although Is was more intense than I2, the propor- tion of pain ratings it obtained, under these experimental conditions, was
Ex,~eriment II The ~ig-zag effect demonstrated in experiment I seemed to arise from the
pairing conditions of that study. I3 was consistently rated less painful than I2. However, I3 was always paired with the stronge,,~t intensity, I4. Likewise, I2 was always paired with therweakest level, Ii , A re!plicati0nofexperiment I was under t~en , with one critical addition: t h e 4 levels : of Shock were pre- sented in a random order throughout each of 5 sessions (conditi0nB). In :the

15
SESSION 1 SESSION 2 SESSION 3 SESSION 4 SESSION 5
,.o,., I, 1 I/ 0.75~-6 ~'6 *6 ~6 ,~5 Condi~on A
"~ 0-25
8 ~ --5 : .5 : Condition B ~ 0.51 , /
CURRENT (ma/0 -75 )
Condition A : High pair for half of session ~ low parr for halt of sess=on Condition E~ " High pair and low pair presented randomly throughout session
/
6- Moderate pain 5- Mild loam 4 - Faint pain
Fig. 4. T h e propor t ion of trials ra ted as painful for each o f 4 s t imulus levels in experi- m e n t II. In c o n d i t i o n A, s t imul i f r o m each of the two pairs were repeated dur ing ha l f o f the session. In cond i t i on B, the 4 intensities were presented repeatedly in r a n d o m sequence throughout the entire session.
other 5 sessions, the low pair occurred in one half and the high pair in the other (condition A). Fig. 4 illustrates the dramatic difference produced by this manipulation. The functions at the top were obtained under the pairing conditions of experiment I. Four of the 5 functions present the zig-zag
-o-High par --~--Low par
Condit ion A
P(Y Is )
~ i t i o n B
SESSION 1 SESSION 2 . c ESSION 3 SESSION 4 SESSION 5
° - . .
0 • • ~5" 0 0-5 10 0 0"5 1'.0 0 0"5 1.C 0 0-5 1-0 0 0.5 1.0
P(YIn;
7 - Sfjong pain • 5 - M i l d pain
Fig. 5. R O C curves obtained in exper iment H.
6 - Moderate pain 4 - Faint pare
Condition A • High pair for half of se~;ion ~ low p(~ir for half of session
-Condition B " High pair cmd low pair ~cesented randomly throughout session

16
TABLE I .. !
MEAN de VALUES OBTAINED IN EXPERIMENT H FOR CONDITION A (low inten- sity and high intensity pairs presented in different halves of session) AND CONDITION B (~U 4 intensities pre~nted randomly)
t P Comparison Mean de for Mean de for t (dr)
first variable second variable
Condition A, low pair ~s. high pair 1.45 Condition B, low pair vs. high pair 1.20 Conditior. A vs. condition B 1.57
1.70 --0.972 (19) 1.09 0.924 (19) 1.14 2.453 (78) a
a p < 0.01.
effect. The functit~ns at the bottom (condition B) were obtained during sessions of rand.oraly mixed trials. All five functions are monotonically increasing; none show the zig-zag effect. The same held for the other 3 observers.
The nature of the pairing conditions strongly affected the functions relating pain reports to stimulus intensity, but they did not affect the general form of the ROC curves. Fig. 5 displays a set of typical curves obtained under each of the presentation formats. A~ in experiment I~ the d' param- eters were not significantly different when ROC curves were constructed for the discrimination of I1 vs. I2 and I3 vs. I4. Under both conditions A and B, the criterion parameters for the low intensity pair were higher ("a greater bias against calling them painful").
Although the d' values for the low intensity pair and high intensity pair did not differ in either condition, the results of the d' analysis presented in Table I reveal a critical effect. The mean d'e in condition A (1.57), when subjects were rating only two stimuli within a block, was sign!ificantly higher than the d~ in condition B (1.14), when 4 stimuli were presented in random order (t(78) = 2.453, P < 0.01).
DISCUSSION
This paper has described two experimental effects with ramifications for the measurement of pain: the consequences of intensity changes on SDT parameters and the zig-zag effect. Each will be discussed in tm~.
The utility o f SDT methods in pain research Experiment I addressed itself to the following question: when the sensory
component of noxious inputs is reduced by an experimental manipulation, need the alterations in parameters follow the expectations advanced by those who champion the SDT approach? Rollman [33,34] argued, on theoretical and logical grounds, that those expectations are in error.
Pain researchers took the signal detection model, which d~alt with detec- tion~liscrimination in the basic senses, and extended it to the domain of pain

17
[34]. Chapman and Clark, among others, repeatedly used SDT parameters to assess the outcome of pain modulation studies. They assumed first that an analgesic which decreases the sensory component of pain would yield a reduction in d' (e.g., "a decrease in d' following the administration of an analgesic suggests that the drug has actually attenuated neural activity in the sensory system(s)" [ 14]; "it is evident (from the attenuated d') that sensory function was significantly r e d u c e d . . . " [ 7]; and "it is assumed that decreases in d' for a subject perceiving normally painful stimulation in a properly structured experiment are indicative of a loss of pain sensibility, and hence they reflect analgesia" [ 13]. They further assumed that changes in criterion are associated w~th modifications in the subject's "response bias" or "atti- tudinal predisposition" [13] (e.g., "(the criterion) reflects the perceiver's attitude, expectancy, or strategy"[13]; "increased bias against reporting a stimulus as painful is generally interpreted as a motivational-attitudinal change on the part of the experimental subject" [ 13 ]; and "it is evident that acupuncture 's apparent analgesic effects (i.e., decreases in pain ratings) at higher levels of stimulation are due principally to response bias (i.e., crite- rion), whereas at the lowest level of stimulation, the effects were primarily sensory (i.e., d ' )" [13]).
Pain investigators, therefore, have typically associated a d' reduction with sensory modulation and a criterion reduction with change in attitude or response bias. The outcome of both of the present experiments failed to provide empirical support for these assumptions. The sensitivity measure, d', was determined for the discrimination of two intense signals before the sen- sory input was reduced by attenuating the noxious pulse trains. Afterwards, d' was again determined and was found to remain constant. The other para- meter, the criterion, seemed to mistakenly suggest that the reduction in intensity resulted in a shift in response bias, since the criterion values moved to higher, more conservative levels.
Both findings are in accord with expectations advanced by Rollman [ 34 ]. He emphasized that an analgesic could modulate the sensory activity of experimental stimuli, reducing their neural impact. Although the pain they produce could be greatly diminished, the d' value, which measures only dis- criminative ability and not pain, would remain constant. Likewise, the crite- rion shift would be illusory. The criterion for reporting pain could re~nain unaffected with regard to some internal standard, yet the statistical measures used to describe criterion (Lx, Cx, or pc ~ cent bias) would move in a more conservative direction because of the shift in the underlying distributions.
Likewise, in experiment II, the change in intensities did not affect the d' values. The subjects, not surprisingly, reported the low pair to be less painful than the high pair. This arose because the stimuli were weaker and thus less painful, not because of an increased criterion. The usual interpretation of the SDT parameter~ would have yielded two erroneous conclusions: that the "modulation" h a d no effect on the physiological variables and that it increased t h e bias against calling the stimuli painful. In fact, the procedure reduced the physiological input and did not alter response bias through sug-

18 ° . ~
gestion or revised expectation. Since nearly all SDT studies of pain examined the discriminability of adjacent stimulus levels in order to evaluate the effects of modulation procedures [3~i, the validity of their interpretations remains questionable.
Chapman [8] suggested that studies of "detection" provide a means around this dilemma. Detection is a special case of discrimination; it examines the observer's ability to distinguish a very weak stimulus from a blank (internal noise). Rollman [34] reviewed (pp. 201--202)numerous methodological and theoretical shortcomings of this appr,'~ach.
The d' for detection can be utilized in two ways. First, one can determine whether the discriminability of a weak stimulus and a blank is affected by a putative analgesic [e.g., 9]. However, it is not clear that such a demonstra- tion is of any clinical importance, since an intervention which does success- fully disrupt the detection of minute signals may be entirely without value in the attenuation of painful ones. Moreover, it is possible that the noise level itself can be attenuated by a modulation procedure, rendering the detection d' unsuitable. Despite Chapman's [8] contention that the SDT model "has no particular physiological reality" and that the modulation of noise has "not received the attention of SDT theorists or researchers", there is both a firm physiological basis [2,3,17,20,31,32] and a sizeable body of literature which proposes changes in spontaneous activity during processes such as dark adaptation [ 1,4,5,32,35].
Second, the d' value for the discrimination of a weak signal and a blank might form the basis for measuring the detectability of stronger values through an additivity procedure. Chapman [8] has suggested that this method provides a solution to some methodological difficulties, although it has not been used in experimental studies. A demonstration of additivity speaks for the internal consistency or reliability of the SDT ratings in one experiment, not the validity. The assumption that shifts in the underlying distributions will occur together is one possibility. It is also plausible that a modulation technique could interfere with only the weakest stimuli. Under some conditions, an additive procedure would suggest that d' for higher intensities had also been reduced.
Adaptation-level effects in the measurement of pain The zig-zag effect was found in experiment I and was abolished by the
procedures used in experiment II. In the first experiment, as noted previ- ously, I2 was paired with the weakest stimulus while I3 was paired with the strongest. Although I3 was more intense than I2, the proportion of higher pain responses it elicited was lower. This phenomenon strongly resembles the adapta~tion-level effect reported by Helson [24]. In a wide variety of situa- tions, particularly including psychophysical ratings, Helson discovered that judgments are not based upon the physical characteristics of one stimulus alone. Rather, they depend upon the actual stimulus, other stimuli in temporal or spatial continguity to it, and a host of experiential factors. He developed a theory which emphasized that rath~gs are generally made relative to a changeable frame of reference.

19
The zig-zag effect can be understood within such a theoretical framework. The ratings of I2 in experiment I (and condition A of experiment II) are higher than they are in experiment IIB because, in the former case, I2 is being judged with comparison to either I1 alone or a weighted average of I1 and I2. In the latter case, I~ is being judged with comparison to a weighted average of I~, I2, I3, and I4. Adaptation-level theory predicts that the contrast of I2 with a low anchor enhances subjective ratings. Likewise, I3 is comi:ared to a weighted average of I3 and I4 (or to I4 alone) in experiment I, leading to lower ratings (a "negative enhancement") in comparison to experiment IIB. There, the weighted average used to establish the anchor would have been lower.
This phenomenon raises several implications for the measurement of pain. The first is its potential utility for assessing the magnitude of endogenous non-experimental pain. A patient with severe acute or chronic pain can be expected to have a different adaptation-level than a normal subject, since the internal discomfort itself serves as an anchor. Pain patients might not yield the zigzag effect produced in experiment I, if both the low and the high intensity pairs are judged with reference to a strong internal compari- son. Absence of the zig-zag effect might reflect the level of pain experienced by the patient; its restoration might serve as an index of the success of the treatment.
The second implication of the phenomenon is the additional warning it provides about the difficulties involved in SDT measures of pain. The ratings are not simple reflections of the peripheral activity induced by a stimulus or its consequent central effect. Ratings are affected by motivational factors. They are also influenced by the number and spacing of the stimuli chosen to obtain the measurements. In the SDT and pain literature, it is rare to have only two intensity levels within a session [ 34]; frequently as many as 6--10 have been employed. Rollman [ 34] cautioned, on the basis of psychoacous- tic experiments, that performance may show a decrement as the size of the stimulus set is increased. The significant difference in d' values between con- ditions A and B of experiment II illustrates that this problem extends to the area of pain. It is necessary to appreciate, particularly when making compar- isons across studies, that d' values are biased by contextual factors intro- duced in the research design and by violations of the assumption that experimental trials have independent effects.
ACKNOWLEDGEMENTS
This research was supported by Grant AO-392 Research Council of Canada.
I am grateful to Marianne Sanders for her assistance.
from the National
REFERENCES
I Barlow, H.B., Dark adaptation: a new hypothesis, Vision Res., 4 (1964~:) 47--58. 2 Barlow, H.B. and Levick, W.R., Three factors limiting ~he reliable detection of light
20
by retinal ganglion cells of the cat, J. Physiol. (Lond.), 200 (1969)1--24. 3 Barlow, H.B., Levick, W.R. and Yoon, M., Responses to single quanta of light in
retinal ganglion cells of the cat. In: T. Shipley and J.E. Dowling (Eds.), International Symposium on Visual Processes in Vertebrates, Vision Res., 11 (Suppl. 3) (1971) 87--101.
4 Barlow, H,B' and Sparrock,-J.M.B., The role of afterimages' in dark adaptation, Science, 144 (1964) 1309--1314:
5 Baumgardt, E., Threshold quantal problems. In: D. Jameson and L.M. Hurvich (Eds.), Handbook of Sensory Physiology, Vol. VH/4, Visual Psychophysics, Springer, Berlin, 1972, pp. 29--55.
6 Bloedel, J.R., McCreery, D.B. and Erickson, D.L., Analysis of the action of implanted stimulating devices using signal detection theory. In: J.J. Bonica and D. Albe-F ~__-d (Eds.), Ad~!ances in Pain Research and Therapy, Vol. 1, R~ven Press, New York, 1976, pp. 433--437.
7 Chapman, C.R., An alternative to threshold assessment in the study of human pain. In: J.J. Bonica (Ed.), Advances in Neurology, Vol. 4, International Symposium on Pain, Raven Press, New York, 1974, pp. 115--121.
8 Chapman, C.R., Sensory decision theory methods in pain research: a reply to Roilman, Pain, 3 (1977) 295--305.
9 Chapman, C.R., Chen, A.C. and Bonica, J.J., Effects of intrasegmentai electrical acupuncture on dental pain: evaluation by threshold estimation and sensory decision theory, Pain, 3 (1977) 213--227.
10 Chapman, C.R. and Feather, B.W., Effects of diazepam on human pain tolerance and sensitivity, Psychosom. Med., 35 (1973) 330--340.
11 Chapman, C.R., Geh~ig, J.D. and Wilson, M.E., Acupuncture compared with 33 percent nitrous oxide for dental analgesia: a sensory decision theory evaluation, Anesthesiology, 42 (1975) 532--537.
12 Chapman, C.R., Murphy, J.M. and Butler, S.H., Analgesic strength of 33 percent nitrous oxide: a signal detection theory evaluation, Science, 179 (1973) 1246--1248.
13 Chapman, C.R., Wilson, M.E. and Gehrig, J.D., Comparative effects of acupuncture and transcutaneous stimulation on the perception of painful dental stimuli, Pain, 2 (1976) 265--283.
14 Clark, W.C., Pain sensitivity and the report of pain: ~m introduction to sensory decision theory, Anesthesiology, 40 (1974) 272--287.
15 Clark, W.C., Hall, W. and Yang, S., Changes in thermal discriminability and pain report criterion after acupunctural or transcutaneous electrical stimulation. In: J.J. Bonica and D. Albe-Fessard (Eds.), Advances in Pain Research and Therapy, Vol. 1, Raven Press, New York, 1976, pp. 769--773.
16 Clark, W.C. and Yang, J.C., Acupunctural analgesia? Evaluation by signal detection theory, Science, 184 (1974) 1096--1098.
17 Cohn, T.E., Theory of Signal Detectability: Application to the Analysis of the Recorded Activity of Single Cells of the Frog Visual System, Doctoral dissertation, University of Michigan, Ann Arbor, Mich., 1969.
18 Craig, K.D. and Coren, S., Signal detection analyses of social modelling influences on pain expressions, J. psychosom. Res., 19 (1975) 105--112.
19 Craig, K.D. and Ward, L.M., Social modelling influences on the discriminability of painful stimuli: a sign'~l detection analysis, Unpublished manuscript, 1975.
20 FitzHugh, R., The statistical detection of threshold signals in the retina, J. gen. Physiol., 40 (1957) 925--948.
21 Goldberger, S.M. and Tursky, B., Modulation of shock-elicited pain by acupuncture and suggestion, Pain, 2 (1976) 417--429.
22 Gracely, R.H., McGrath, P. and Dubner, R., Ratio scales of sensory and affective verbal pain descriptors, Pain, 5 (1978) 5--18.
23 Gracely, R,H., McGrath, P. and Dubner, R,, Validity and sensitivity of ratio scales of

21
sensory and affective verbal pain descriptors: manipulation of affect by diazepam, Pain, 5 (1978) 19--29.
24 Helson, H., Adaptation-level Theory, Harper and Row, New York, 1964. 25 Hilgard, E.R., Ruch, J.C., Lange, A.F., Lenox, J.R., Morgan, A.H. and Sachs, L.B.,
The psychophysics of cold preuor pain and its modification through hypnotic sugges- tion, Amer. J. Psychol., 87 (1974) 17--31.
26 Lloyd, M.A. and Wagner, M.K., Acupuncture analgesia and radiant-heat pain: a signal detection analysis, Anesthesiology, 44 (1976) 147--150.
27 McBumey, D.H., Acupuncture, pain and signal detection theory, Science, 189 (1975) 66.
28 McBurney, D.H., Signal detection theory and pain, Anesthesiology, 44 (1976) 356-- 358.
29 McCreery, D.B. and Bloedel, J.R., A critical examination of the use of s~gnal detec- tion theory in evaluating a putative analgesic -- transcutaneous electrical nerve stimu- lation, Sensory Processes, 2 (1978) 38--57.
30 Melzack, R., The McGill Pain Questionnaire: major properties and scoring methods, Pain, 1 (1975) 277--299.
31 Nachmias, J., Signal detection theory and its application to problems in vision. In: D. Jameson and L.M. Hurvich (Eds.), Handbook of Sensory Physiology, Vol. VII/4, Visual Psychophysics, Springer, Berlin, 1972, pp. 56--77.
32 Rodieck, R.W., Maintained activity of cat retinal ganglion cells, J. Neurophysiol., 30 (1967) 1043--1071.
33 Rollman, G.B., Signal detection theory a~essment of pain modulation: a critique. In: J.J. Bonica and D. Albe-Fessard (Eds.), Advances in Pain Research and Therapy, Vol. 1, Raven Press, New York, 1976, pp. 355--362.
34 RolIman, G.B., Signal detection theory measurement of pain: a review and critique, Pain, 3 (1977) 187--211.
35 Rushton, W.A.H., Bleached rhodopsin and visual adaption, J. Physiol. (Lond.), 181 (1965) 645--655.
36 Sternbach, R.A., Murphy, R.W., Timmermam, G., Greenhoot, J.H. and Akeson, W.H., Measuring the severity of clinical pain. In: J.J. ~onica (Ed.), Advances in Neurology, Vol. 4, International Symposium on Pain, Raven Press, New York, 1974, pp. 281-- 288.