signet jewelers limited - …d18rn0p25nwr6d.cloudfront.net/cik-0000832988/db61f048-6efd-4776... ·...
TRANSCRIPT

Table of Contents
UNITED STATESSECURITIES AND EXCHANGE COMMISSION
Washington, D.C. 20549
FORM 10-K
x
Annual report pursuant to Section 13 or 15(d) of the Securities Exchange Act of 1934
For the fiscal year ended January 28, 2017
Commission file number 1-32349
SIGNET JEWELERS LIMITED(Exact name of Registrant as specified in its charter)
Bermuda Not Applicable(State or other jurisdiction of incorporation) (I.R.S. Employer Identification No.)
Clarendon House2 Church StreetHamilton HM11
Bermuda(441) 296 5872
(Address and telephone number including area code of principal executive offices)
Securities registered pursuant to Section 12(b) of the Act:
Title of Each Class Name of Each Exchange on which Registered
Common Shares of $0.18 each The New York Stock Exchange
Securities registered pursuant to Section 12(g) of the Act: None
Indicate by check mark if the registrant is a well-known seasoned issuer, as defined in Rule 405 of the Securities Act. Yes x No ¨Indicate by check mark if the registrant is not required to file reports pursuant to Section 13 or 15(d) of the Securities Exchange Act of 1934. Yes ¨
No xIndicate by check mark whether the Registrant (1) has filed all reports required to be filed by Section 13 or 15(d) of the Securities Exchange Act of 1934
during the preceding 12 months (or for such shorter period that the registrant was required to file such reports), and (2) has been subject to such filing requirementsfor the past 90 days. Yes x No ¨
Indicate by check mark whether the Registrant has submitted electronically and posted on its corporate web site, if any, every interactive data file required tobe submitted and posted pursuant to Rule 405 of Regulation S-T during the preceding 12 months (or for shorter period that the registrant was required to submitand post such files). Yes x No ¨
Indicate by check mark if disclosure of delinquent filers pursuant to Item 405 of regulation S-K is not contained herein, and will not be contained to the bestof Registrant’s knowledge in definitive proxy or information statements incorporated by reference in Part III of this Form 10-K or any amendment to this Form 10-K. x
Indicate by check mark whether the Registrant is a large accelerated filer, an accelerated filer, a non-accelerated filer or a smaller reporting company.Large accelerated filer x Accelerated filer ¨ Non-accelerated filer ¨ Smaller reporting company ¨
Indicate by check mark whether the Registrant is a shell company (as defined in Rule 12b-2 of the Act). Yes ¨ No xThe aggregate market value of voting common shares held by non-affiliates of the Registrant (based upon the closing sales price quoted on the New York
Stock Exchange) as of July 29, 2016 was $6,638,040,057 .Number of common shares outstanding on March 10, 2017 : 68,300,375
DOCUMENTS INCORPORATED BY REFERENCE

The Registrant will incorporate by reference information required in response to Part III, Items 10-14, from its definitive proxy statement for its annualmeeting of shareholders, to be held on June 28, 2017 .
1

Table of Contents
SIGNET JEWELERS LIMITEDFISCAL 2017 ANNUAL REPORT ON FORM 10-K
TABLE OF CONTENTS
PAGE FORWARD-LOOKING STATEMENTS 3
PART I
ITEM 1. BUSINESS 4 ITEM 1A. RISK FACTORS 24 ITEM 1B. UNRESOLVED STAFF COMMENTS 32 ITEM 2. PROPERTIES 32 ITEM 3. LEGAL PROCEEDINGS 35 ITEM 4. MINE SAFETY DISCLOSURE 35
PART II
ITEM 5.
MARKET FOR REGISTRANT’S COMMON EQUITY, RELATED STOCKHOLDER MATTERS ANDISSUER PURCHASES OF EQUITY SECURITIES 36
ITEM 6. SELECTED CONSOLIDATED FINANCIAL DATA 38 ITEM 7.
MANAGEMENT’S DISCUSSION AND ANALYSIS OF FINANCIAL CONDITION AND RESULTS OF
OPERATIONS 48 ITEM 7A. QUANTITATIVE AND QUALITATIVE DISCLOSURES ABOUT MARKET RISK 77 ITEM 8. FINANCIAL STATEMENTS AND SUPPLEMENTARY DATA 79 ITEM 9.
CHANGES IN AND DISAGREEMENTS WITH ACCOUNTANTS ON ACCOUNTING AND
FINANCIAL DISCLOSURE 136 ITEM 9A. CONTROLS AND PROCEDURES 136 ITEM 9B. OTHER INFORMATION 136
PART III
ITEM 10. DIRECTORS, EXECUTIVE OFFICERS AND CORPORATE GOVERNANCE 137 ITEM 11. EXECUTIVE COMPENSATION 137 ITEM 12.
SECURITY OWNERSHIP OF CERTAIN BENEFICIAL OWNERS AND MANAGEMENT AND
RELATED STOCKHOLDER MATTERS 137 ITEM 13. CERTAIN RELATIONSHIPS AND RELATED TRANSACTIONS, AND DIRECTOR INDEPENDENCE 137 ITEM 14. PRINCIPAL ACCOUNTING FEES AND SERVICES 137
PART IV
ITEM 15. EXHIBITS, FINANCIAL STATEMENT SCHEDULES 138 ITEM 16. FORM 10-K SUMMARY 142
2

Table of Contents
REFERENCES
Unless the context otherwise requires, references to “Signet” or the “Company,” refer to Signet Jewelers Limited (and before September 11, 2008 to Signet Groupplc) and its consolidated subsidiaries. References to the “Parent Company” are to Signet Jewelers Limited.
PRESENTATION OF FINANCIAL INFORMATION
All references to “dollars,” “US dollars,” “$,” “cents” and “c” are to the lawful currency of the United States of America. Signet prepares its financial statements inUS dollars. All references to “British pound,” “pounds,” “British pounds,” “£,” “pence” and “p” are to the lawful currency of the United Kingdom. All referencesto “Canadian dollar” or “C$” are to the lawful currency of Canada.
Percentages in tables have been rounded and accordingly may not add up to 100%. Certain financial data may have been rounded. As a result of such rounding, thetotals of data presented in this document may vary slightly from the actual arithmetical totals of such data.
Throughout this Annual Report on Form 10-K, financial data has been prepared in accordance with accounting principles generally accepted in the United States(“GAAP”). However, Signet gives certain additional non-GAAP measures in order to provide increased insight into the underlying or relative performance of thebusiness. An explanation of each non-GAAP measure used can be found in Item 6.
Fiscal year and fourth quarter
Signet’s fiscal year ends on the Saturday nearest to January 31. As used herein, “Fiscal 2018,” “Fiscal 2017,” “Fiscal 2016,” “Fiscal 2015,” “Fiscal 2014,” and“Fiscal 2013” refer to the 53 week period ending February 3, 2018, the 52 week periods ending January 28, 2017, January 30, 2016, January 31, 2015, February 1,2014, and the 53 week period ending February 2, 2013, respectively. Fourth quarter references the 13 weeks ended January 28, 2017 (“fourth quarter”) and the 13weeks ended January 30, 2016 (“prior year fourth quarter”).
FORWARD-LOOKING STATEMENTS
This Annual Report on Form 10-K contains statements which are forward-looking statements within the meaning of the Private Securities Litigation Reform Act of1995. These statements, based upon management’s beliefs and expectations as well as on assumptions made by and data currently available to management, appearin a number of places throughout this Annual Report on Form 10-K and include statements regarding, among other things, Signet’s results of operation, financialcondition, liquidity, prospects, growth, strategies and the industry in which Signet operates. The use of the words “expects,” “intends,” “anticipates,” “estimates,”“predicts,” “believes,” “should,” “potential,” “may,” “forecast,” “objective,” “plan,” or “target,” and other similar expressions are intended to identify forward-looking statements. These forward-looking statements are not guarantees of future performance and are subject to a number of risks and uncertainties, includingbut not limited to general economic conditions, regulatory changes following the United Kingdom’s announcement to exit from the European Union, a decline inconsumer spending, the merchandising, pricing and inventory policies followed by Signet, the reputation of Signet and its brands, the level of competition in thejewelry sector, the cost and availability of diamonds, gold and other precious metals, regulations relating to customer credit, seasonality of Signet’s business,financial market risks, deterioration in customers’ financial condition, exchange rate fluctuations, changes in Signet’s credit rating, changes in consumer attitudesregarding jewelry, management of social, ethical and environmental risks, the development and maintenance of Signet’s omni-channel retailing, security breachesand other disruptions to Signet’s information technology infrastructure and databases, inadequacy in and disruptions to internal controls and systems, changes inassumptions used in making accounting estimates relating to items such as extended service plans and pensions, risks relating to Signet being a Bermudacorporation, the impact of the acquisition of Zale Corporation on relationships, including with employees, suppliers, customers and competitors, an adversedecision in legal proceedings, and our ability to successfully integrate Zale Corporation’s operations and to realize synergies from the transaction.
For a discussion of these risks and other risks and uncertainties which could cause actual results to differ materially from those expressed in any forward lookingstatement, see Item 1A and elsewhere in this Annual Report on Form 10-K. Signet undertakes no obligation to update or revise any forward-looking statements toreflect subsequent events or circumstances, except as required by law.
3

Table of Contents
PART I
ITEM 1. BUSINESS
OVERVIEW
Signet Jewelers Limited (“Signet” or the “Company”) is the world’s largest retailer of diamond jewelry. Signet is incorporated in Bermuda and its address andtelephone number are shown on the cover of this document. The Company, with 3,682 stores and kiosks at January 28, 2017, manages its business by store brandgrouping, a description of which follows:
• The Sterling Jewelers division is one reportable segment. It operated 1,588 stores in all 50 US states at January 28, 2017. Its stores operate nationally inmalls and off-mall locations principally as Kay Jewelers (“Kay”), Kay Jewelers Outlet, Jared The Galleria Of Jewelry (“Jared”) and Jared Vault. Thedivision also operates a variety of mall-based regional brands.
• The Zale division, which was acquired in May 2014 (see Note 3 of Item 8 for additional information), consists of two reportable segments:
◦ Zale Jewelry, which operated 970 jewelry stores at January 28, 2017, is located primarily in shopping malls in North America. Zale Jewelryincludes the US store brand Zales (Zales Jewelers and Zales Outlet), which operates in all 50 US states, and the Canada store brand PeoplesJewellers, which operates in nine provinces. The division also operates the Gordon’s Jewelers and Mappins Jewellers regional brands.
◦ Piercing Pagoda, which operated 616 mall-based kiosks at January 28, 2017, is located in shopping malls in the US and Puerto Rico.
• The UK Jewelry division is one reportable segment. It operated 508 stores at January 28, 2017. Its stores operate in shopping malls and off-mall locations(i.e. high street) principally as H.Samuel and Ernest Jones.
Certain company activities (e.g. diamond sourcing) are managed as a separate operating segment and are aggregated with unallocated corporate administrativefunctions in the segment “Other” for financial reporting purposes. Signet’s diamond sourcing function includes our diamond polishing factory in Botswana. SeeNote 4 of Item 8 for additional information regarding the Company’s reportable segments.
MISSION & STRATEGY
Signet’s mission is to help guests “Celebrate Life and Express Love.” Our Vision 2020 and beyond strategy is to be the world’s premier jeweler by relentlesslyconnecting with customers, earning their trust with every interaction everywhere. Our five strategic pillars all center on a customer first omni-channel experience.These pillars included below define our key priorities and growth focus areas.
• Grow in the mid-market
• Best in bridal
• Win in fashion and gifting
• Digital first and data driven
• People, purpose and passion
Growing in the mid-market drives our competitive strengths focused on merchandising, marketing, omni-channel and productivity initiatives. We define the mid-market jewelry sector based on the value of products that consumers purchase. We consider this market to be defined by jewelry purchases with price pointsranging from $50 to $10,000, which essentially excludes costume and luxury jewelry categories. The vast majority of Signet’s sales (over 95%) are in this range ofprice points. This subset of the total US jewelry market is approximately $41 billion or about half the total US market. In pursuit of this strategic pillar, wecontinuously review our US national store brands performance and have concluded that our customer population has several distinct shopping and purchasingcharacteristics or customer identities. Consequently, we attempt to grow our share of the mid-market by differentiating customers based on attitudes and behaviors,versus demographic information. This approach to customer segmentation results in distinct customer identities:
• The “Sentimentalist” - a seeker of high-quality, timeless jewelry which invokes sentimental value.
• The “Gifter” - a customer that is not highly knowledgeable of jewelry but purchases for others.
• The “Influencer” - a customer that uses jewelry to show status and is knowledgeable of brands. The Influencer is a customer focused on both self-purchase and gifting.
• The “Stylish Shopper” - a customer that wears jewelry often and considers it an essential aspect of fashion.
• The “Practical Shopper” - a customer that focuses on inexpensive, everyday jewelry.
4

Table of Contents
Although each of our US national store brand customers share many of these five customer traits, each store brand attracts a heavier weighting of certain types ofcustomers. This customer segmentation approach empowers Signet to define our highest-priority growth opportunities within the mid-market (i.e., where Signetwill play), to differentiate and optimize our store brands, including guest experience, merchandise brands and marketing. Our brand discussion included withinItem 1 includes alignment of these customer identities with our US national store brands.
Being the best in bridal is an ongoing journey, not a destination. In jewelry, bridal represents the closest thing to a necessity for our customers. We continuouslylook to develop differentiated bridal jewelry products, increasing targeted marketing programs, delivering the best guest experience by our sales associates,advancing vertical integration in our supply chain and offering credit financing. Additionally, we continue to evolve our best in bridal strategy to target millennials.With this target demographic shifting its marriage pattern to later in life, our focus on gaining market share during these peak spending years to come is key to ourbest in bridal strategy.
As fashion and behavioral trends evolve, we continue to adapt to ensure our strategies encompass all opportunities to drive profitable growth. Excellence in bridalcategories is a mainstay in our success, however we have sharpened focus on fashion jewelry and gift merchandise to capture growing opportunities withindemographic groups such as millennials. We believe executing against this strategic pillar will effectively compliment our other strategic pillars, as well asenhance traffic through all channels.
Operating in an evolving retail landscape requires a strategic focus on digital channels and interaction with our guests through a number of media to support ourstrategic pillar of “Digital First and Data Driven.” Our omni-channel approach to educating, selling and serving of customers is uniquely important in jewelry retailbecause the purchase of jewelry is personal, intimate and typically viewed as an important experience. The Internet often represents the first interaction a customeror prospective guest will have with us when a jewelry-buying occasion arises. As trust is the most important factor in why people buy jewelry where they do,customers overwhelmingly complete their purchases in our stores with our trusted knowledgeable sales associates. We continue to place increasing emphasis ondata analytics to support our interactions with customers, enable our sales associates and optimize all aspects of our business. Being best in digital and data drivenis a crucial step of our omni-channel approach.
In order to truly accomplish our core mission of helping our guests “Celebrate Life and Express Love,” we must have people with high capability and passion. Wewill continue our efforts to attract, develop and retain the best and the brightest individuals in the jewelry and watch industry. The expression of romance andappreciation through bridal jewelry and gift giving are very important to our guests, as is self-reward. Guests associate Signet’s brands with high quality jewelryand an outstanding guest experience. As a result, the training of sales associates to understand the guests’ requirements, communicate the value of the merchandiseselected and ensure guest needs are met remains a high priority.
Competition and Signet Competitive Strengths
Jewelry retailing is highly fragmented and competitive. We compete against other specialty jewelers, as well as other retailers that sell jewelry, includingdepartment stores, mass merchandisers, discount stores, apparel and accessory fashion stores, brand retailers, online retail and auction sites, shopping clubs, homeshopping television channels and direct home sellers. The jewelry category competes for customers’ share-of-wallet with other consumer sectors such aselectronics, clothing and furniture, as well as travel and restaurants. This competition for consumers’ discretionary spending is particularly relevant to gift giving.
Signet’s competitive strengths include: strong store brands, outstanding guest experience, branded differentiated and exclusive merchandise, sector-leadingadvertising, diversified real estate portfolio, supply chain leadership, customer finance programs, and financial strength and flexibility. Signet increases theattraction of its store brands to guests through the use of branded differentiated and exclusive merchandise, while offering a compelling value proposition in morebasic ranges. Signet accomplishes this by utilizing its supply chain and merchandising expertise, scale and balance sheet strength. The Company intends to furtherdevelop and refine its national television advertising, digital media and customer relationship marketing, which it believes are the most effective and cost efficientforms of marketing available to grow its market share. Management follows the operating principles of excellence in execution, testing before investing,continuous improvement and disciplined investment in all aspects of the business.
Operational Strategy
In setting financial objectives for Fiscal 2018, consideration was given to several factors including the continued integration of Zale, Signet’s Vision 2020 strategyand the economic and retail environments in which the Company does business. Signet will execute on its strategic priorities and continue to make strategicinvestments for the future. Our focus in Fiscal 2018 will be on the following:
• Omni-Channel capabilities and repositioning of investments and resources to drive customer experience both in-store and on-line.
• Continued product innovation in both bridal and fashion.
• Further development and investments in IT infrastructure to enable future growth.
• Driving efficiencies across the organization in both processes and costs and maximizing return on investments.
5

Table of Contents
Financial objectives for the business in Fiscal 2018 are to position the Company for long-term growth by:
• Expanding our gross margin rate through merchandise initiatives, operating efficiencies and cost control. Signet anticipates the cost of diamonds, ourmost significant input cost, to increase at low-to-mid single digit rates.
• Investing to strengthen our customer service proposition and our infrastructure for the long-term. This is expected to result in de-leverage of selling,general and administrative expenses.
• Gaining profitable market share through brand differentiation and market segmentation, product cost control and asset management.
• Diversification of store portfolio weighted toward off-mall locations. This includes closure of 165-170 stores, primarily focused on mall-based regionalbrands and opening of 90-115 new stores, primarily Kay off-mall.
• Investing $260 to $275 million of capital in new stores, store remodels, information technology infrastructure and distribution facilities to drive futuregrowth.
• Completion of Signet’s strategic credit review previously announced in May 2016.
Capital Strategy
The Company expects to maintain a strong balance sheet that provides the flexibility to execute its strategic priorities, invest in its business, and then return excesscash to shareholders while ensuring adequate liquidity. Signet is committed to maintaining its investment grade rating because long-term, it intends to pursuevalue-enhancing strategic growth initiatives. Among the key tenets of Signet’s capital strategy:
• Achieve adjusted debt (1) / adjusted EBITDAR (1) (“adjusted leverage ratio”) of 3.5x or below. This would allow the Company to utilize available sourcesof debt in Fiscal 2018 and beyond.
• Distribute 70% to 80% of annual free cash flow (1) in the form of stock repurchases or dividends assuming no other strategic uses of capital.
• Consistently increase the dividend annually assuming no other strategic uses of capital.
The Company has a remaining share repurchase authorization as of the end of Fiscal 2017 of $510.6 million .
(1) Adjusted debt, Adjusted EBITDAR, and free cash flow are non-GAAP measures. Signet believes they are useful measures to provide insight into how the Company intends to use capital.See Item 6 for reconciliation.
BACKGROUND
Operating segments
The business is managed as five reportable segments: the Sterling Jewelers division ( 61.3% of sales and 93.8% of operating income), the Zale division, which iscomprised of the Zale Jewelry segment ( 24.2% of sales and 8.1% of operating income) and the Piercing Pagoda segment ( 4.1% of sales and 1.5% of operatingincome) and the UK Jewelry division ( 10.1% of sales and 6.0% of operating income). All divisions are managed by an executive committee, which is chaired bySignet’s Chief Executive Officer, who reports to the Board of Directors of Signet (the “Board”). The executive committee is responsible for operating decisionswithin parameters established by the Board. Additionally, as a result of the acquisition of a diamond polishing factory in Gaborone, Botswana in Fiscal 2014,management established a separate reportable segment (“Other”). Other consists of all non-reportable segments, including subsidiaries involved in the purchasingand conversion of rough diamonds to polished stones and unallocated corporate administrative functions. See Note 4 of Item 8 for additional information regardingthe Company’s segments.
Trademarks and trade names
Signet is not dependent on any material patents or licenses in any of its divisions. Signet has several well-established trademarks and trade names which aresignificant in maintaining its reputation and competitive position in the jewelry retailing industry. Some of these registered trademarks and trade names include thefollowing:
• Kay Jewelers ® ; Kay Jewelers Outlet ® ; Jared The Galleria Of Jewelry ® ; Jared Vault ® ; Jared Jewelry Boutique ® ; JB Robinson ® Jewelers; Marks &Morgan Jewelers ® ; Every kiss begins with Kay ® ; He went to Jared ® ; Celebrate Life. Express Love. ® ; the Leo ® Diamond; Hearts Desire ® ; ArtistryDiamonds ® ; Charmed Memories ® ; Diamonds in Rhythm ® ; Fourone TM ; Open Hearts by Jane Seymour ® ; Radiant Reflections ® ; Colors in Rhythm ®; Chosen by Jared TM ; Now and Forever ® ; and Ever Us TM .
• Zales ® ; Zales Jewelers TM ; Zales the Diamond Store ® ; Zales Outlet ® ; Gordon’s Jewelers ® ; Peoples Jewellers ® ; Peoples the Diamond Store ® ;Peoples Outlet the Diamond Store ® ; Mappins ® ; Piercing Pagoda ® ; Arctic Brilliance Canadian Diamonds ® ; Brilliant Buy ® ; Brilliant Value ® ;Celebration Diamond ® ; Expressionist TM ; From This Moment ® ; Let Love Shine ® ; The Celebration Diamond Collection ® ; Unstoppable Love ® ; andEndless Brilliance ® .
• H.Samuel ® ; Ernest Jones ® ; Ernest Jones Outlet Collection TM ; Leslie Davis ® ; Commitment ® ; Forever Diamonds ® ; Kiss Collection ® ; PrincessaCollection ® ; Radiance ® ; Secrets of the Sea ® ; Shades of Gold ® ; and Viva Colour ® .
6

Table of Contents
Store locations
Signet operates retail jewelry stores in a variety of real estate formats including mall-based, free-standing, strip center and outlet store locations. As of January 28,2017 , Signet operated 3,066 stores and 616 kiosks across 5.1 million square feet of retail space in the US, UK, Canada and Puerto Rico. This represented anincrease of 1.6% and 2.6% in locations and retail space, respectively, from Fiscal 2016 due to new store growth as Signet opened 162 stores and closed 105 storesduring Fiscal 2017 . Store locations by country and territory as of January 28, 2017 are disclosed in Item 2.
Guest experience
The guest experience is an essential element in the success of our business and Signet strives to continually improve the quality of the guest experience. Thereforethe ability to recruit, develop and retain qualified jewelry consultants is an important element in enhancing guest satisfaction. We have comprehensive recruitment,training and incentive programs in place, including an annual flagship training conference in advance of the holiday season.
Signet continues to invest in technology to enhance the guest experience, such as a clienteling system that we have initially implemented in our Sterling Jewelersdivision. This technology provides a single view of the guest with the capability to holistically capture guest information for the purpose of driving incrementalsales to our guests. This allows jewelry consultants to improve and personalize their interactions with guests before, during and after store visits, to inform them ofthe latest merchandise offerings and fashion trends. Additionally, in Fiscal 2018, Signet will complete the roll out of digital gemscopes to every store location inNorth America. These gemscopes leverage proprietary software to provide an enhanced digital view of gem stones and include the ability to email the image to theguest and the Jared Design & Service Center when sent for repair.
We use employee and guest satisfaction metrics to monitor and improve performance.
Omni-Channel
As a specialty jeweler, Signet’s business differs from many other retailers such that a purchase of merchandise from any of Signet’s stores is personal, intimate andtypically viewed as an important experience. Due to this dynamic, guests often invest time on Signet websites and social media to experience the merchandiseassortments prior to visiting brick-and-mortar stores to execute a purchase transaction. Particularly related to high value transactions, guests will supplement theironline experience with an in-store visit prior to finalizing a purchase.
Through Signet’s websites, we educate guests and provide them with a source of information on products and brands, available merchandise, as well as the abilityto buy online. Our websites are integrated with each division’s stores, so that merchandise ordered online may be picked up at a store or delivered to the guest.Brand websites continue to make an important and growing contribution to the guest experience, as well as to each division’s marketing programs. For Fiscal 2018,the Company is focused on:
• Investments in technology, including eCommerce platforms, focused on improving the online journey. Customer journey enhancements include usergenerated content, enhanced personalization / behavioral targeting, creative execution and brand differentiation. In addition, we are focused on omni-channel wishlist, online merchandising, in-store appointment booking, bridal configuration and much more.
• Optimization of marketing through prioritizing dollars to digital spend and targeted marketing through traditional media.
• Increased use of data analytics, clienteling and other key touch points to achieve a more comprehensive view of the customer and allow us to anticipatetheir needs.
Signet’s supplier relationships allow it to display suppliers’ inventories on the brand websites for sale to guests without holding the items in its inventory until theproducts are ordered by guests, which are referred to as “virtual inventory.” Virtual inventory expands the choice of merchandise available to guests both onlineand in-store.
Raw materials
The jewelry industry generally is affected by fluctuations in the price and supply of diamonds, gold and, to a much lesser extent, other precious and semi-preciousmetals and stones. Diamonds account for about 45% , and gold about 14% , of Signet’s cost of merchandise sold, respectively.
Signet undertakes hedging for a portion of its requirement for gold through the use of net zero-cost collar arrangements, forward contracts and commoditypurchasing. It is not possible to hedge against fluctuations in the cost of diamonds. The cost of raw materials is only part of the costs involved in determining theretail selling price of jewelry, with labor costs also being a significant factor.
Diamond sourcing
Signet procures its diamonds mostly as finished jewelry and, to a smaller extent, as loose polished diamonds and rough diamonds which are in turn polished inSignet’s Botswana factory.
7

Table of Contents
Finished jewelry
Signet purchases finished product where management has identified compelling value based on product design, cost and availability, among other factors. Undercertain types of arrangements, this method of purchasing also provides the Company with the opportunity to reserve inventory held by vendors and to make returnsor exchanges with suppliers, which reduces the risk of over- or under-purchasing. Signet’s scale, strong balance sheet and robust procurement systems enable it topurchase merchandise at advantageous prices and on favorable terms.
Loose diamonds
Signet purchases loose polished diamonds in global markets (e.g. India, Israel) from a variety of sources (e.g. polishers, traders). Signet mounts stones in settingspurchased from manufacturers using third parties and in-house resources. By using these approaches, the cost of merchandise is reduced and the consistency ofquality is maintained enabling Signet to provide better value to guests. Buying loose diamonds helps allow Signet’s buyers to gain a detailed understanding of themanufacturing cost structures and, in turn, leverage that knowledge with regard to negotiating better prices for the supply of finished products.
Rough diamonds
Signet continues to take steps to advance its vertical integration, which includes rough diamond sourcing and processing. Signet’s objective with this initiative is tosecure additional, reliable and consistent supplies of diamonds for guests worldwide while achieving further efficiencies in the supply chain. In Fiscal 2014, Signetacquired a diamond polishing factory in Gaborone, Botswana. The Company is a DeBeers sightholder, and receives contracted allocations of rough diamonds fromRio Tinto, DeBeers and Alrosa. Signet has also established a diamond liaison office in India and a diamond trading office in New York to further support itssourcing initiative.
Rough diamonds are purchased directly from the miners and then have the stones marked, cut and polished in Signet’s own polishing facility. Any stones deemedunsuitable for Signet’s needs are sold to third parties with the objective of recovering the original cost of the stones.
Merchandising and purchasing
Management believes that a competitive strength is our industry-leading merchandising. Merchandise selection, innovation, availability and value are all criticalsuccess factors. The range of merchandise offered and the high level of inventory availability are supported centrally by extensive and continuous research andtesting. Signet’s jewelry design center in New York evaluates global design trends, innovates, and helps our merchant teams develop new jewelry collections thatresonate with guests.
Best-selling products are identified and replenished rapidly through analysis of sales by stock keeping unit. This approach enables Signet to deliver a focusedassortment of merchandise to maximize sales and inventory turn, and minimize the need for discounting. Signet believes it is able to offer greater value andconsistency of merchandise than its competitors due to its supply chain strengths. The scale and information systems available to us and the evolution of jewelryfashion trends allow for the careful testing of new merchandise in a range of representative stores. This enables us to make informed decisions about whichmerchandise to select, thereby increasing our ability to satisfy guests’ requirements while reducing the likelihood of having to discount merchandise.
Merchandise mix
Details of merchandise mix (excluding repairs, warranty and other miscellaneous sales) are shown below:
8

Table of Contents
Sterling Jewelers
division Zale division UK Jewelry division TotalSignet
Fiscal 2017 Diamonds and diamond jewelry 77% 60% 35% 68%Gold and silver jewelry, including charm bracelets 9% 28% 17% 15%Other jewelry, including gift category 8% 9% 16% 9%Watches 6% 3% 32% 8%
100% 100% 100% 100%Fiscal 2016
Diamonds and diamond jewelry 77% 61% 34% 65%Gold and silver jewelry, including charm bracelets 9% 27% 16% 17%Other jewelry, including gift category 8% 9% 18% 9%Watches 6% 3% 32% 9%
100% 100% 100% 100%Fiscal 2015
Diamonds and diamond jewelry 76% 61% 31% 63%Gold and silver jewelry, including charm bracelets 10% 26% 19% 14%Other jewelry, including gift category 8% 9% 17% 11%Watches 6% 4% 33% 12%
100% 100% 100% 100%
The bridal category, which includes engagement, wedding and anniversary purchases, is predominantly diamond jewelry. Like fashion jewelry and watches, bridalis to an extent dependent on the economic environment as guests can trade up or down price points depending on their available budget. In Fiscal 2017 , bridalsales declined in-line with merchandise sales overall. Declines in the Sterling and Zale divisions were partially offset by growth in the UK. An important elementin enabling Signet’s bridal business is customer financing. Bridal represented approximately 50% of Signet’s total merchandise sales. The performance differencebetween branded and non-branded bridal was immaterial.
Gift giving is particularly important during the Holiday Season, Valentine’s Day and Mother’s Day. In Fiscal 2017 , Signet had several successful fashion jewelrycollections including Ever Us TM and Vera Wang ® (not all collections are sold in every store brand).
Merchandise is categorized as non-branded, third party branded, and branded differentiated and exclusive. Non-branded merchandise includes items and stylessuch as bracelets, gold necklaces, solitaire diamond rings, and diamond stud earrings. Third party branded merchandise includes mostly watches, but also includesranges of charm bracelets. Branded differentiated and exclusive merchandise are items that are branded and exclusive to Signet within its marketplaces, or that arenot widely available in other jewelry retailers (e.g Ever Us, Vera Wang Love, Neil Lane).
Branded differentiated and exclusive ranges
Management believes that the development of branded differentiated and exclusive merchandise raises the profile of Signet’s brands, helps to drive sales andprovides its well-trained sales associates with a powerful selling proposition. National television advertisements include elements that drive brand awareness andpurchase intent of these ranges. Signet’s scale and proven record of success in developing branded differentiated and exclusive merchandise attracts offers of suchprograms from jewelry manufacturers, designers and others ahead of competing retailers, and enables it to leverage its supply chain strengths.
Merchandise held on consignment
Merchandise held on consignment is used to enhance product selection and test new designs. This minimizes exposure to changes in fashion trends andobsolescence, and provides the flexibility to return non-performing merchandise. Virtually all of Signet’s consignment inventory is held in the US.
Suppliers
In Fiscal 2017 , the five largest suppliers collectively accounted for 20.4% of total purchases, with the largest supplier comprising 5.5% . Signet transacts businesswith suppliers on a worldwide basis at various stages of the supply chain with third party diamond cutting and jewelry manufacturing being predominantly carriedout in Asia.
Marketing and advertising
Customers’ confidence in our retail brands, store brand name recognition and advertising of branded differentiated and exclusive ranges are important factors indetermining buying decisions in the jewelry industry where the majority of merchandise is unbranded. Therefore, Signet continues to strengthen and promote itsstore brands and merchandise brands by delivering superior customer service and building brand name
9

Table of Contents
recognition. The Company’s omni-channel approach leverages marketing investments in television, digital media (desktop, mobile and social), radio, print,catalog, direct mail, point of sale signage and in-store displays, as well as coupon books and outdoor signage for the Outlet channels.
While marketing activities are undertaken throughout the year, the level of activity is concentrated at periods when guests are expected to be most receptive tomarketing messages, which is ahead of Christmas Day, Valentine’s Day and Mother’s Day. A majority of the expenditure is spent on national televisionadvertising, which is used to promote the store brands. Within such advertisements, Signet also promotes certain merchandise ranges, in particular its brandeddifferentiated and exclusive merchandise and other branded products. Statistical and technology-based systems are employed to support customer relationshipmarketing programs that use a proprietary database to build guest loyalty and strengthen the relationship with guests through mail, email, social media andtelephone communications. The programs target current guests with special savings and merchandise offers during key sales periods. Our targeted marketingefforts are aligned with our customer segmentation approach which, as discussed previously, differentiates our brands by focusing on customer attitudes andbehaviors, rather than demographic information. In addition, invitations to special in-store promotional events are extended throughout the year.
Details of gross advertising, advertising before vendor contributions, by division is shown below:
Fiscal 2017 Fiscal 2016 Fiscal 2015
Gross advertising
spendingas a % of divisional
sales Gross advertising
spendingas a % of divisional
sales Gross advertising
spendingas a % of divisional
sales
(in millions) (in millions) (in millions) Sterling Jewelers division $ 258.6 6.6% $ 261.2 6.5% $ 246.6 6.6%Zale division 100.2 5.5% 98.7 5.4% 64.6 5.3%UK Jewelry division 21.8 3.4% 24.3 3.3% 21.8 2.9%Signet $ 380.6 5.9% $ 384.2 5.9% $ 333.0 5.8%
Customer finance
In our North American markets, Signet sells products for cash and for payment through major credit cards and third-party financing like PayPal. In addition,customer financing is offered through proprietary credit programs that are provided either in-house or through outsourced relationships with select major lenders.
Consumer credit programs are an integral part of our business and enable incremental retail sales as well as building customer loyalty. Our in-house creditprograms also generate revenues from finance charges and other fees on these credit programs, while saving on interchange fees that Signet would incur if ourcustomers used major credit cards only.
Real estate
Management has specific operating and financial criteria that have to be satisfied before investing in new stores or renewing leases on existing stores. Substantiallyall the stores operated by Signet are leased. In Fiscal 2017 , global net store space increased 2.6% as a result of new store growth focused on off-mall locations.The greatest opportunity for new stores is in locations outside traditional covered malls which further diversifies Signet’s real estate portfolio.
Recent investment in the store portfolio is set out below:
10

Table of Contents
(in millions)Sterling Jewelers
division Zale division UK Jewelry division TotalSignet
Fiscal 2017 New store capital investment $ 42.9 $ 22.2 $ 2.5 $ 67.6 Remodels and other store capital investment 47.9 35.1 15.3 98.3 Total store capital investment $ 90.8 $ 57.3 $ 17.8 $ 165.9
Fiscal 2016 New store capital investment $ 48.3 $ 12.1 $ 3.3 $ 63.7 Remodels and other store capital investment 50.6 25.0 16.3 91.9 Total store capital investment $ 98.9 $ 37.1 $ 19.6 $ 155.6
Fiscal 2015 New store capital investment $ 52.6 $ 4.4 $ 2.4 $ 59.4 Remodels and other store capital investment 52.6 15.1 11.3 $ 79.0 Total store capital investment $ 105.2 $ 19.5 $ 13.7 $ 138.4
Seasonality
Signet’s sales are seasonal, with the first quarter slightly exceeding 20% of annual sales, the second and third quarters each approximating 20% and the fourthquarter accounting for almost 40% of annual sales, with December being by far the most important month of the year. The “Holiday Season” consists of results forthe months of November and December. As a result, approximately 45% to 55% of Signet’s annual operating income normally occurs in the fourth quarter,comprised of nearly all of the UK Jewelry and Zale divisions’ annual operating income and about 40% to 45% of the Sterling Jewelers division’s annual operatingincome.
Employees
In Fiscal 2017 , the average number of full-time equivalent persons employed was 29,566 . In addition, Signet usually employs a limited number of temporaryemployees during its fourth quarter. None of Signet’s employees in the UK and less than 1% of Signet’s employees in the US and Canada are covered by collectivebargaining agreements. Signet considers its relationship with its employees to be excellent.
Fiscal 2017 Fiscal 2016 Fiscal 2015
Average number of employees: (1) Sterling Jewelers 16,342 16,140 16,147Zale (2) 9,602 9,309 9,241UK Jewelry 3,398 3,370 3,292Other (3) 224 238 269Total 29,566 29,057 28,949(1) Full-time equivalents (“FTEs”).(2) Includes 1,051 FTEs, 1,201 FTEs and 1,217 FTEs employed in Canada in Fiscal 2017 , Fiscal 2016 and Fiscal 2015 , respectively.(3) Includes corporate employees and employees employed at the diamond polishing plant located in Botswana.
Regulation
Signet is required to comply with numerous laws and regulations covering areas such as consumer protection, consumer privacy, data protection, consumer credit,consumer credit insurance, health and safety, waste disposal, supply chain integrity, truth in advertising and employment. Management monitors changes in theselaws to endeavor to comply with applicable requirements.
Markets
Signet operates in the US, Canada and UK markets.
US
According to the US Bureau of Economic Analysis and Census Bureau, the total jewelry and watch market was approximately $80 billion at the end of 2016, upnearly 5% from the prior year. This implies a Signet jewelry market share of approximately 7%. Since 2000, the industry average annual growth rate is 3.2%.Nearly 90% of the market is represented by jewelry, with the balance being attributable to watches. According to the latest data from the US Labor Department,there were nearly 21,000 jewelry stores in the country, down approximately 1.6% from the prior year.
11

Table of Contents
Canada
The jewelry market in Canada, according to Euromonitor, has grown steadily over the past five years, rising to an estimated C$7.2 billion in 2014, the latest dataavailable to Signet. This represents a compound annual growth rate of 4.6%. Euromonitor estimates that 2014 was up 3% in dollars and 2% in units.
UK
In the UK, the jewelry and watch market stands at about £4.1 billion, according to Mintel. That market saw a recovery in 2015 with growth of 1.2%. Self-purchasing among young women and gifting among men represent the largest parts of the precious jewelry market. The growth represents a slight slowdown fromthat achieved in 2014 due to a shift towards lighter-weight pieces and a decrease in average selling prices.
STERLING JEWELERS DIVISION
The Sterling Jewelers division operates jewelry stores in malls and off-mall locations in all 50 US states under national brands including Kay, Kay Jewelers Outlet,Jared and Jared Vault, as well as a variety of mall-based regional brands.
Sterling Jewelers store brand reviews
Store activity by brand
Fiscal 2017 Fiscal 2016 Fiscal 2015 Kay 68 42 58 Jared 8 18 17 Regional brands — — —
Total stores opened or acquired during the year 76 60 75
Kay (5) (7) (20) Jared (3) (1) — Regional brands (20) (16) (22)
Total stores closed during the year (28) (24) (42)
Kay 1,192 1,129 1,094 Jared 275 270 253 Regional brands 121 141 157
Total stores open at the end of the year 1,588 1,540 1,504
Kay $ 2.124 $ 2.178 $ 2.112 Jared (1) $ 4.379 $ 4.650 $ 4.794 Regional brands $ 1.242 $ 1.333 $ 1.318
Average sales per store (millions) (2) $ 2.449 $ 2.518 $ 2.467
Kay 1,826 1,697 1,597 Jared 1,177 1,153 1,089 Regional brands 151 175 196
Total net selling square feet (thousands) 3,154 3,025 2,882
Increase in net store selling space 4.3% 5.0% 4.9% (1) Includes sales from all Jared store formats, including the smaller square footage and lower average sales per store concepts of Jared 4.0, Jared Jewelry Boutique and Jared Vault.(2) Based only upon stores operated for the full fiscal year and calculated on a 52-week basis.
12

Table of Contents
Sales data by brand
Change fromprevious year
Fiscal 2017Sales
(millions) Same store
sales Total sales
Kay $ 2,539.7 (1.4)% 0.4 %Jared 1,227.5 (4.1)% (2.0)%Regional brands 163.2 (9.6)% (20.6)%Sterling Jewelers $ 3,930.4 (2.6)% (1.5)%
Kay Jewelers
Kay accounted for 40% of Signet’s sales in Fiscal 2017 ( Fiscal 2016 : 39%) and operated 1,192 stores in 50 states as of January 28, 2017 ( January 30, 2016 :1,129 stores). Since 2004, Kay has been the largest specialty retail jewelry store brand in the US based on sales, and has subsequently increased its leadershipposition. Like the rest of our store banners, Kay targets a mid-market jewelry customer. But where Kay differs is that it particularly targets a customer, we identifyas a “gifter,” who knows they need to buy jewelry but does not enjoy shopping and needs help to get it done right.
Details of Kay’s performance over the last three years is shown below:
Fiscal 2017 Fiscal 2016 Fiscal 2015
Sales (millions) $ 2,539.7 $ 2,530.3 $ 2,346.2Average sales per store (millions) $ 2.124 $ 2.178 $ 2.112Stores at year end 1,192 1,129 1,094Total net selling square feet (thousands) 1,826 1,697 1,597
Kay mall stores typically occupy about 1,600 square feet and have approximately 1,300 square feet of selling space, whereas Kay off-mall stores typically occupyabout 2,200 square feet and have approximately 1,800 square feet of selling space. Kay operates in malls and off-mall stores. Off-mall stores primarily are locatedin outlet malls and power centers. The Sterling Jewelers store footprint will continue to diversify in Fiscal 2018 as new stores will be principally Kay stores in off-mall locations.
The following table summarizes the current composition of stores as of January 28, 2017 and net openings (closures) in the past three years:
Stores at Net openings (closures)
January 28, 2017 Fiscal 2017 Fiscal 2016 Fiscal 2015
Mall 751 (4) 6 2Off-mall and outlet 441 67 29 37Total 1,192 63 35 39
Jared The Galleria Of Jewelry
With 275 stores in 40 states as of January 28, 2017 ( January 30, 2016 : 270 stores), Jared is a leading off-mall destination specialty retail jewelry store chain,based on sales. Jared accounted for 19% of Signet’s sales in Fiscal 2017 ( Fiscal 2016 : 19%). Jared is the fourth largest US specialty retail jewelry brand by sales.Like the rest of our store banners, Jared targets a mid-market jewelry customer. But where Jared differs is that it particularly targets a customer, we identify as a“sentimentalist,” who enjoys shopping for jewelry and cares very much about the details of the product and shopping process.
Details of Jared’s performance over the last three years is shown below:
Fiscal 2017 Fiscal 2016 Fiscal 2015
Sales (millions) $ 1,227.5 $ 1,252.9 $ 1,188.8Average sales per store (millions) (1) $ 4.379 $ 4.650 $ 4.794Stores at year end 275 270 253Total net selling square feet (thousands) 1,177 1,153 1,089(1) Includes sales from all Jared store formats, including the smaller square footage and lower average sales per store concepts of Jared 4.0, Jared Jewelry Boutique and Jared Vault.
13

Table of Contents
Jared offers superior guest service and enhanced selection of merchandise. Every Jared store has an on-site design and service center where most repairs arecompleted within the same day. Each store also has at least one diamond salon, a children’s play area, and complimentary refreshments.
The typical Jared store has about 4,800 square feet of selling space and approximately 6,000 square feet of total space. Jared locations are normally free-standingsites with high visibility and traffic flow, positioned close to major roads within shopping developments. Jared stores usually operate in retail centers that containstrong retail co-tenants, including big box, destination stores and some smaller specialty units.
Jared also operates Jared Jewelry Boutiques within malls. These mall stores have a smaller footprint than standard Jared locations and generally less than 2,000square feet of selling space. A similar off-mall concept known as Jared 4.0, which utilizes approximately 3,600 square feet of selling space, allows for storeopenings in smaller markets, expands the Jared brand and increases the return on Jared advertising investment. Finally, Jared operates an outlet-mall conceptknown as Jared Vault which utilizes approximately 1,600 square feet of selling space. These stores are smaller than off-mall Jareds and offer a mix of identicalproducts as Jared, as well as different, outlet-specific products at lower prices.
The following table summarizes the current composition of stores as of January 28, 2017 and net openings (closures) in the past three years:
Stores at Net openings (closures)
January 28, 2017 Fiscal 2017 Fiscal 2016 Fiscal 2015
Mall 10 (1) 3 8Off-mall and outlet 265 6 14 42Total 275 5 17 50
Sterling Jewelers regional brands
The Sterling Jewelers division also operates mall stores under a variety of established regional nameplates. Regional brands in the Sterling Jewelers divisionaccounted for 3% of Signet’s sales in Fiscal 2017 ( Fiscal 2016 : 3%) and as of January 28, 2017 , include 121 regional brand stores in 29 states ( January 30, 2016: 141 stores in 31 states). The leading brands include JB Robinson Jewelers, Marks & Morgan Jewelers and Belden Jewelers. Also included in the regionalnameplates are Goodman Jewelers, LeRoy’s Jewelers, Osterman Jewelers, Rogers Jewelers, Shaw’s Jewelers and Weisfield Jewelers. The Company’s strategy is toreduce regional brand locations through conversion to national store brands or through closure upon lease expiration.
Details of the regional brands’ performance over the last three years is shown below:
Fiscal 2017 Fiscal 2016 Fiscal 2015
Sales (millions) $ 163.2 $ 205.5 $ 230.0Average sales per store (millions) $ 1.242 $ 1.333 $ 1.318Stores at year end 121 141 157Total net selling square feet (thousands) 151 175 196
Sterling Jewelers operating review
Other sales
Custom design services represent less than 5% of sales but provide higher than average profitability. Our custom jewelry initiative has a proprietary computerselling system and in-store design capabilities. Design & Service Centers, located in Jared stores, are staffed with skilled artisans who support the custom businessgenerated by other Sterling Jewelers division stores, as well as the Jared stores in which they are located. The custom design and repair function has its own fieldmanagement and training structure.
Repair services represent less than 5% of sales, approximately 30% of transactions and are an important opportunity to build customer loyalty. The Jared Design &Service Centers, open the same hours as the store, also support other Sterling Jewelers and Zale division stores’ repair business.
The Sterling Jewelers division sells extended service plans covering lifetime repair service for jewelry and jewelry replacement plans. The lifetime repair serviceplans cover services such as ring sizing, refinishing and polishing, rhodium plating of white gold, earring repair, chain soldering and the resetting of diamonds andgemstones that arise due to the normal usage of the merchandise. Jewelry replacement plans require the issuance of new replacement merchandise if the originalmerchandise is determined to be defective or damaged within a defined period in accordance with the plan agreement. Any repair work is performed in-house.
14

Table of Contents
Customer finance
General
Our in-house consumer financing program provides Signet with a competitive advantage through the enabling of incremental profitable sales that would not occurwithout a consumer financing program. Several factors inherent in the US jewelry business support the circumstances through which Signet is uniquely positionedto generate profitable incremental business through its consumer financing program. These factors include a high average transaction value; a significantpopulation of customers seeking to finance merchandise primarily in the bridal category; and the minimum scale necessary to administer credit programsefficiently. In addition, our credit program provides other benefits to our business overall, including:
• complementing our “Best in Bridal” strategy in that 50% of merchandise sales are bridal and 75% of Sterling Jewelers division bridal sales utilize ourcredit as form of tender.
• providing a database of regular guests and spending habits.
• establishing collection policies designed to minimize risk and maximize future sales as opposed to a focus on maximizing earnings from outstandingbalances.
For our in-house credit program, as of January 28, 2017 and January 30, 2016 , 55% and 53%, respectively, of balances due were from customers who wereacquired as users of our credit program more than 12 months prior to their most recent purchase.
Our in-house consumer financing program has been centralized since 1990 and is fully integrated into the management of the Sterling Jewelers division. It is not aseparate operating division nor does it report separate results. All assets and liabilities relating to consumer financing are shown on the balance sheet and there areno associated off-balance sheet arrangements. In addition to interest-bearing transactions that involve the use of in-house customer finance, a portion of credit salesare made using interest-free financing for one year and at a reduced rate for up to 36 months in select offers, subject to certain conditions. In most US states, guestsalso are offered optional third-party credit insurance.
As part of our operational strategy discussed previously, management continues to review strategic options related to its in-house consumer financing programs,which include optimizing our current in-house program or utilizing a full-outsourced model.
Underwriting
The majority of credit applications originate in one of our retail locations and are approved or denied automatically based on proprietary origination models.Origination and purchase authorization strategies are designed by a dedicated Risk Management team, which is separate and distinct from our retail salesorganization ensuring that financing decisions are not influenced by sales driven objectives. Our underwriting process considers one or more of the followingelements: credit bureau information; income and address verification; current income and debt levels. We have developed and refined proprietary statistical modelsthat provide standardized credit decisions, and drive the optimization of credit limit assignment, down payment requirements and more significant debt servicerequirements as compared to general consumer lending standards. For certain credit applicants that may have past credit problems or lack credit history, we usestricter underwriting criteria. These additional requirements may include items such as verification of employment and minimum down payment levels. Part of ourability to control delinquency and net charge-offs is based on the level of required down payments, tailored credit limits and more significant debt servicerequirements as mentioned above. Underwriting risk tolerance has not been altered in the past 10 years. Several factors can influence portfolio risk outside of theinitial origination and subsequent authorization decisions including macro-economic conditions, regulatory environment, operational system stability and strategyexecution, store execution, and the ability of marketing and prospecting activities to attract a consistent risk weighted mix of new applicants to the receivable.
The scores of Fair Isaac Corporation (“FICO”), a widely-used financial metric for assessing a person’s credit rating are used to benchmark portfolio and originationrisk over time. Ten to twenty point ranges tend to be grouped together to form tiers of risk and scores can range from a low of 0 to over 800. The followingaggregate FICO metrics for the portfolio demonstrate the overall consistency of our financing strategy approach:
Fiscal 2017 Fiscal 2016 Fiscal 2015
Balance weighted FICO score - New Additions 684 684 685Balance weighted FICO score - Portfolio 661 662 663
Credit monitoring and collections
Our objective is to facilitate the sale of jewelry and to collect the outstanding credit balance as quickly as possible, minimizing risk and enabling the customer tomake additional jewelry purchases using their credit facility. On average, our receivable portfolio turns every 9-10 months. We closely monitor the credit portfolioto identify delinquent accounts early, and dedicate resources to contacting customers concerning past due accounts when they are as few as 5 days in arrears.Collectors are focused on a quality customer experience using risk-based calling and strategic account segmentation.
15

Table of Contents
The quality of our credit loan portfolio at any time reflects, among other factors: 1) the creditworthiness of our customers, 2) general economic conditions, 3) thesuccess of our account management and collection activities, and 4) a variety of variables that change over time such as the proportion of new versus seasonedaccounts or changes in the relative growth rate in sales between our various retail brands or formats. Cash flows associated with the granting of credit to guests ofthe individual store are included in the projections used when considering store investment proposals.
Portfolio aging
Since inception of its in-house financing, Signet measures delinquency and establishes loss allowances using a form of the recency method. This form of therecency method relies upon qualifying payments determined by management to measure delinquency. In general, an account will not remain current unless aqualifying payment is received. A customer is aged to the next delinquency level if they fail to make a qualifying payment by their monthly aging. A customer’saccount ages each month five days after their due date listed on their statement, allowing for a grace period before collection efforts begin. A qualifying paymentcan be no less than 75% of the scheduled payment, increasing with the delinquency level. If an account holder is two payments behind, then they must make a fullminimum payment to return to current status. If an account holder is three payments behind, then they must make three full payments before returning to a currentstatus. If an account holder is more than three payments behind, then the entire past due amount is required to return to a current status. Establishing qualifyingpayment methods in accounting for delinquencies is appropriate considering the high minimum payments that are required of customers. The weighted averageminimum payment required as a percentage of the outstanding balance was 8% at year end Fiscal 2017 . The minimum payment does not decline as the balancedeclines. These two facts combined (higher scheduled payment requirement and no decline in payment requirement as balance decreases) allow Signet to collecton the receivable significantly faster than other retail/bank card accounts, which require a 5% or less minimum payment, reducing risk and more quickly freeing upcustomer open to buy for additional purchases. Of all payments received in Fiscal 2017 , 97% were equal to or greater than the scheduled monthly payment, whichis in line with experience during Fiscal 2016 .
See Note 1 of Item 8 for additional information regarding qualifying payments.
Allowances for uncollectible amounts are recorded as a charge to cost of goods sold in the income statement. The allowance is calculated using a model thatanalyzes factors such as delinquency rates and recovery rates. An allowance for amounts 90 days aged and under on a recency basis is established based onhistorical loss experience and payment performance information. A 100% allowance is made for any amount aged more than 90 days on a recency basis and anyamount associated with an account the owner of which has filed for bankruptcy. An account is 90 days aged on a recency basis when there has not been aqualifying payment made within 90 days of the billing date. The net bad debt expensed on the income statement is equal to the sum of the total change in theallowance for uncollectible accounts and the total amount of charged off balances less any recoveries for accounts previously charged off. The allowancecalculation is reviewed by management to assess whether, based on economic events, additional analysis is required to appropriately estimate losses inherent in theportfolio.
We deem accounts to be uncollectible and charge off when the account is both more than 120 days aged on a recency basis and 240 days aged on a contractualbasis at the end of a month. Over the last 12 months, we have recovered 16% of charged-off amounts through our collection activities and the sale of previouslycharged off accounts. We track our charge-offs both gross, before recoveries, and net, after recoveries.
16

Table of Contents
Customer financing statistics (1)
Fiscal 2017 Fiscal 2016 Fiscal 2015
Total sales (millions) $ 3,930.4 $ 3,988.7 $ 3,765.0Credit sales (millions) $ 2,438.3 $ 2,451.2 $ 2,277.1Credit sales as % of total Sterling Jewelers sales (2) 62.0% 61.5% 60.5%Net bad debt expense (millions) (3) $ 212.1 $ 190.5 $ 160.0Opening receivables (millions) $ 1,855.9 $ 1,666.0 $ 1,453.8Closing receivables (millions) $ 1,952.0 $ 1,855.9 $ 1,666.0Number of active credit accounts at year end (4)(7) 1,401,456 1,423,619 1,352,298Average outstanding account balance at year end (7) $ 1,405 $ 1,319 $ 1,245Average monthly collection rate 11.0% 11.5% 11.9%Ending bad debt allowance as a % of ending accounts receivable (1) 7.1% 7.0% 6.8%Net charge-offs as a % of average gross accounts receivable (1)(5)(7) 10.7% 9.9% 9.3%Non performing receivables as a % of ending accounts receivable (1) 4.1% 4.0% 3.8%
Credit portfolio impact: Net bad debt expense (millions) (3) $ (212.1) $ (190.5) $ (160.0)Late charge income (millions) $ 36.0 $ 33.9 $ 31.3Interest income from in-house customer finance programs (millions) (6) $ 277.6 $ 252.5 $ 217.9 $ 101.5 $ 95.9 $ 89.2
(1) See Note 11 of Item 8 for additional information.(2) Including any deposits taken at the time of sale.(3) Net bad expense is defined as the charge for the provision for bad debt less recoveries.(4) The number of active accounts is based on credit cycle end date closest to the fiscal year end date.(5) Net charge-offs calculated as gross charge-offs less recoveries. See Note 11 of Item 8 for additional information.(6) See Note 10 of Item 8. Primary component of other operating income, net, on the consolidated income statement.(7) See the liquidity and capital resources section of Item 7 for additional discussion regarding this metric.
ZALE DIVISION
The Zale division consists of two reportable segments: Zale Jewelry and Piercing Pagoda. Zale Jewelry operates jewelry stores located primarily in shopping mallsthroughout the US, Canada and Puerto Rico. Piercing Pagoda operates through mall-based kiosks throughout the US and Puerto Rico. In Fiscal 2017 ,approximately 14% of goods purchased in the Zale division were denominated in Canadian dollars ( Fiscal 2016 : 9% ).
On May 29, 2014, Signet acquired 100% of the outstanding shares of Zale Corporation and Zale Corporation became a wholly-owned consolidated subsidiary ofSignet (the “Acquisition”, see Note 3 in Item 8 for additional information related to the Acquisition). As such, Fiscal 2016 reflects the first full year of results asFiscal 2015 reflects only the results since the acquisition date.
17

Table of Contents
Zale store brand reviews
Store activity by brand
Fiscal 2017 Fiscal 2016 Fiscal 2015 Zales 40 24 731 Peoples 2 2 146 Regional brands — — 139
Total Zale Jewelry 42 26 1,016 Piercing Pagoda 35 12 615
Total stores opened or acquired during the year 77 38 1,631
Zales (19) (10) (15) Peoples (4) (1) (2) Regional brands (26) (10) (27)
Total Zale Jewelry (49) (21) (44) Piercing Pagoda (24) (12) (10)
Total stores closed during the year (73) (33) (54)
Zales 751 730 716 Peoples 143 145 144 Regional brands 76 102 112
Total Zale Jewelry 970 977 972 Piercing Pagoda 616 605 605
Total stores open at the end of the year 1,586 1,582 1,577
Zales $ 1.327 $ 1.467 $ 0.942(3)
Peoples $ 1.267 $ 1.353 $ 1.096(3)
Regional brands $ 0.982 $ 0.942 $ 0.682(3)
Total Zale Jewelry $ 1.290 $ 1.394 $ 0.934(3)
Piercing Pagoda $ 0.506 $ 0.376 $ 0.228(3)
Average sales per store (millions) (1) $ 0.988 $ 1.003 $ 0.662(3)
Zales 1,039 1,010 990 Peoples 190 193 192 Regional brands 82 112 125
Total Zale Jewelry (2) 1,311 1,315 1,307 Piercing Pagoda 115 114 115
Total net selling square feet (thousands) (2) 1,426 1,429 1,422 Decrease (increase) in net store selling space (0.2)% 0.5% n/a (1) Based only upon stores operated for the full fiscal year and calculated on a 52-week basis.(2) Includes 227 thousand, 240 thousand and 240 thousand square feet of net selling space in Canada in Fiscal 2017 , Fiscal 2016 and Fiscal 2015 , respectively.(3) Fiscal 2015 average sales per store calculated based on sales since date of Acquisition.n/a Not applicable as Zale division was acquired in Fiscal 2015.
18

Table of Contents
Sales data by brand
Change fromprevious year
Fiscal 2017Sales
(millions) Same store sales Totalsales
Zales $ 1,257.4 (1.4)% 1.3 %Peoples 204.9 (4.6)% (4.6)%Regional brands 87.4 (9.6)% (22.2)%
Total Zale Jewelry $ 1,549.7 (2.4)% (1.2)%Piercing Pagoda 263.1 6.6 % 8.2 %
Zale division (1) $ 1,812.8 (1.2)% 0.1 %(1) The Zale division same store sales includes merchandise and repair sales and excludes warranty and insurance revenues.
Zale Jewelry
Zale Jewelry is comprised of three core national brands, Zales Jewelers, Zales Outlet and Peoples Jewellers and two regional brands, Gordon’s Jewelers andMappins Jewellers. Each brand specializes in jewelry and watches, with merchandise and marketing emphasis focused on diamond products.
Zales Jewelers, including Zales Outlet
Zales Jewelers operates primarily in shopping malls and offers a broad range of bridal, diamond solitaire and fashion jewelry. Zales Outlet operates in outlet mallsand neighborhood power centers and capitalizes on Zales Jewelers’ national marketing and brand recognition. Like the rest of our store banners, Zales targets amid-market jewelry customer. But where Zales differs is that it particularly targets a customer, we identify as a “stylish shopper,” for whom trend and leadingstyles are very important. Zales Jewelers and Zales Outlet are collectively referred to as “Zales.”
Zales accounted for 20% of Signet’s sales in Fiscal 2017 ( Fiscal 2016 : 19%) and operated a total of 751 stores, including 744 stores in the United States and 7stores in Puerto Rico as of January 28, 2017 ( January 30, 2016 : 730 total stores). Zales is positioned as “The Diamond Store” given its emphasis on diamondjewelry, especially in bridal and fashion.
Details of Zales’ performance since the Acquisition in Fiscal 2015 is shown below:
Fiscal 2017 Fiscal 2016 Fiscal 2015 Sales (millions) $ 1,257.4 $ 1,241.0 $ 800.9
Average sales per store (millions) $ 1.327 $ 1.467 $ 0.942(1 )
Stores at year end 751 730 716 Total net selling square feet (thousands) 1,039 1,010 990 (1) Fiscal 2015 average sales per store calculated based on sales since date of the Acquisition.
Zales mall stores typically occupy about 1,700 square feet and have approximately 1,300 square feet of selling space, whereas Zales off-mall stores typicallyoccupy about 2,400 square feet and have approximately 1,700 square feet of selling space.
The following table summarizes the current composition of stores as of January 28, 2017 and net openings (closures) since the Acquisition:
Stores at Net openings (closures)
January 28, 2017 Fiscal 2017 Fiscal 2016 Fiscal 2015
Mall 588 12 9 (6)Off-mall and outlet 163 9 5 —Total 751 21 14 (6)
Peoples Jewellers
Peoples Jewellers (“Peoples”) is Canada’s largest jewelry retailer, offering jewelry at affordable prices. Peoples accounted for 3% of Signet’s sales in Fiscal 2017 (Fiscal 2016 : 3%) and operated 143 stores in Canada as of January 28, 2017 ( January 30, 2016 : 145 stores). Peoples is positioned as “Canada’s #1 DiamondStore” emphasizing its diamond business while also offering a wide selection of gold jewelry, gemstone jewelry and watches.
19

Table of Contents
Details of Peoples’ performance since the Acquisition in Fiscal 2015 is shown below:
Fiscal 2017 Fiscal 2016 Fiscal 2015 Sales (millions) $ 204.9 $ 214.8 $ 174.5 Average sales per store (millions) (1) $ 1.267 $ 1.353 $ 1.096 (1)
Stores at year end 143 145 144 Total net selling square feet (thousands) 190 193 192 (1) Fiscal 2015 average sales per store calculated based on sales since date of the Acquisition.
Peoples stores typically occupy about 1,600 square feet and have approximately 1,300 square feet of selling space.
Zale Jewelry regional brands
The Zale division also operates the regional store brands Gordon’s Jewelers (“Gordon’s”), in the US, and Mappins Jewellers (“Mappins”), in Canada. Regionalbrands in the Zale Jewelry segment accounted for 1% of Signet’s sales in Fiscal 2017 ( Fiscal 2016 : 2%) and operated a total of 76 stores, including 42 stores inthe US and 34 stores in Canada as of January 28, 2017 ( January 30, 2016 : 102 total stores). The Company expects the number of regional brands locations tocontinue to decline through conversion to national store brands or through closure upon lease expiration.
Details of the regional brands’ performance since the Acquisition is shown below:
Fiscal 2017 Fiscal 2016 Fiscal 2015 Sales (millions) $ 87.4 $ 112.4 $ 93.3 Average sales per store (millions) (1) $ 0.982 $ 0.942 $ 0.682 (1) Stores at year end 76 102 112 Total net selling square feet (thousands) 82 112 125
(1) Fiscal 2015 average sales per store calculated based on sales since date of the Acquisition.
Piercing Pagoda
Piercing Pagoda operates through mall-based kiosks in the US and Puerto Rico. Piercing Pagoda accounted for 4% of Signet’s sales in Fiscal 2017 ( Fiscal 2016 :4%) and operated a total of 616 stores, including 609 stores in the United States and 7 stores in Puerto Rico as of January 28, 2017 ( January 30, 2016 : 605 totalstores). Details of Piercing Pagoda’s performance since the Acquisition in Fiscal 2015 is shown below:
Fiscal 2017 Fiscal 2016 Fiscal 2015 Sales (millions) $ 263.1 $ 243.2 $ 146.9
Average sales per store (millions) (1) $ 0.506 $ 0.376 $ 0.228(1 )
Stores at year end 616 605 605 Total net selling square feet (thousands) 115 114 115 (1) Fiscal 2015 average sales per store calculated based on sales since date of the Acquisition.
Piercing Pagodas are generally located in high traffic areas that are easily accessible and visible within regional shopping malls. The typical customer is the femaleself-purchaser. Piercing Pagoda offers a selection of gold, silver and diamond jewelry in basic styles at moderate prices.
Zale operating review
Other sales
Repair services represent approximately 2% of sales and 4% of transactions and are an important opportunity to build customer loyalty. During Fiscal 2017 , Zaleutilized the Jared Design & Service Centers to support its repair business for all US locations, which was an increase from approximately 200 stores in Fiscal 2016.
The Zale division sells extended service plans on certain products covering lifetime repair service and jewelry replacement. The lifetime extended service planscover services such as ring sizing, refinishing and polishing, rhodium plating of white gold, earring repair, chain soldering and the resetting of diamonds andgemstones that arise due to the normal usage of the merchandise or a replacement option if the merchandise cannot be repaired. Zale Jewelry also offers guests atwo year fine watch warranty. Additionally, Zale Jewelry and Piercing Pagoda offer a one year jewelry replacement program, which requires the issuance of newreplacement merchandise if the original merchandise is determined to be defective or damaged in accordance with the plan agreement.
20

Table of Contents
Customer finance
Our consumer credit program is an integral part of our business and is a major driver of customer loyalty. Guests are offered revolving and interest free credit plansunder our private label credit card programs offered in conjunction with Comenity Bank and TD Bank Services in Canada, in conjunction with other alternativefinance vehicles, including Signet’s in-house consumer credit program beginning in late Fiscal 2016. These provide guests of the Zale division with a wide varietyof financing options. Participation of the Zale division in Signet’s in-house consumer credit program was immaterial in Fiscal 2017. Nearly 47% of Zale sales inthe US were financed by private label customer credit in Fiscal 2017 ( Fiscal 2016 : 42% ). Canadian private label credit card sales represented 32% of Canadiansales in Fiscal 2017 ( Fiscal 2016 : 29% ).
UK JEWELRY DIVISION
The UK Jewelry division transacts mainly in British pounds, as sales and the majority of operating expenses are incurred in that currency and its results are thentranslated into US dollars for external reporting purposes. In Fiscal 2017 , approximately 25% of goods purchased were made in US dollars ( Fiscal 2016 : 25%).The following information for the UK Jewelry division is given in British pounds as management believes that this presentation assists in understanding theperformance of the UK Jewelry division. Movements in the US dollar to British pound exchange rate therefore may have an impact on the results of Signet,particularly in periods of exchange rate volatility. See Item 6 for analysis of results at constant exchange rates; non-GAAP measures.
UK market
Ernest Jones and H.Samuel compete with a large number of independent jewelry retailers, as well as discount jewelry retailers, online retail and auction sites,apparel and accessory fashion stores, catalog showroom operators and supermarkets.
UK Jewelry store brand reviews
Store activity by brand
Fiscal 2017 Fiscal 2016 Fiscal 2015
H.Samuel 6 2 —Ernest Jones 3 8 8
Total stores opened or acquired during the year 9 10 8
H.Samuel (3) (3) (2)Ernest Jones (1) (2) (1)
Total stores closed during the year (4) (5) (3)
H.Samuel 304 301 302Ernest Jones 204 202 196
Total stores open at the end of the year 508 503 498
H.Samuel £ 0.748 £ 0.763 £ 0.760Ernest Jones £ 1.114 £ 1.142 £ 1.092
Average sales per store (millions) (1) £ 0.894 £ 0.910 £ 0.887
H.Samuel 329 326 327Ernest Jones 197 194 185
Total net selling square feet (thousands) 526 520 512
Increase in net store selling space 1.0% 1.5% 1.8%(1) Based only upon stores operated for the full fiscal year and calculated on a 52-week basis.
21

Table of Contents
Sales data by brand
Change from previous year
Fiscal 2017Sales
(millions) Same store sales
Total sales at constant exchange rates (1)
Total sales
H.Samuel £ 245.0 (1.3)% (0.9)% (13.9)%Ernest Jones 244.4 1.6 % 2.8 % (10.6)%UK Jewelry £ 489.4 0.1 % 0.9 % (12.3)%(1) Non-GAAP measure, see Item 6.
H.Samuel
H.Samuel accounted for 5% of Signet’s sales in Fiscal 2017 ( Fiscal 2016 : 6%), and is the largest specialty retail jewelry store brand in the UK by number ofstores. H.Samuel has 150 years of jewelry heritage, with a target customer focused on inexpensive fashion-trend oriented, everyday jewelry. The typical storeselling space is 1,100 square feet.
H.Samuel continues to focus on larger store formats in regional shopping centers. Details of H.Samuel’s performance over the last three years is shown below:
Fiscal 2017 Fiscal 2016 Fiscal 2015
Sales (millions) £ 245.0 £ 247.4 £ 240.3Average sales per store (millions) £ 0.748 £ 0.763 £ 0.760Stores at year end 304 301 302Total net selling square feet (thousands) 329 326 327
Ernest Jones
Ernest Jones (including stores selling under the Leslie Davis nameplate) accounted for 5% of Signet’s sales in Fiscal 2017 ( Fiscal 2016 : 6%), and is the secondlargest specialty retail jewelry store brand in the UK by number of stores. It serves the upper middle market, with a target customer focused on high-quality,timeless jewelry. The typical store selling space is 900 square feet. Details of Ernest Jones’ performance over the last three years is shown below:
Fiscal 2017 Fiscal 2016 Fiscal 2015
Sales (millions) £ 244.4 £ 237.9 £ 217.8Average sales per store (millions) £ 1.114 £ 1.142 £ 1.092Stores at year end 204 202 196Total net selling square feet (thousands) 197 194 185
UK Jewelry operating review
Customer finance
In Fiscal 2017 , approximately 8% of the division’s sales were made through a customer finance program provided through a third party ( Fiscal 2016 : 7% ).Signet does not provide this service itself in the UK due to low demand for customer finance.
OTHER
Other consists of all non-reportable operating segments, including activities related to the direct sourcing of rough diamonds, and is aggregated with unallocatedcorporate administrative functions.
22

Table of Contents
IMPACT OF CLIMATE CHANGE
Signet recognizes that climate change is a major risk to society and therefore continues to take steps to reduce Signet’s climatic impact. Management believes thatclimate change has a largely indirect influence on Signet’s performance and that it is of limited significance to the business.
AVAILABLE INFORMATION
Signet files annual reports on Form 10-K, quarterly reports on Form 10-Q, current reports on Form 8-K, proxy statements and other information with the USSecurities and Exchange Commission (“SEC”). Prior to February 1, 2010, Signet filed annual reports on Form 20-F and furnished other reports on Form 6-K withthe SEC. Such information, and amendments to reports previously filed or furnished, is available free of charge from our corporate website,www.signetjewelers.com, as soon as reasonably practicable after such materials are filed with or furnished to the SEC. The public also may read and copy any ofthese filings at the SEC’s Public Reference Room, 100 F Street, NE, Washington, D.C. 20549. Information on the operation of the Public Reference Room may beobtained by calling the SEC at 1-800-732-0330. The SEC also maintains a website at www.sec.gov that contains the Company’s filings.
23

Table of Contents
ITEM 1A. RISK FACTORS
A decline in consumer spending may unfavorably impact Signet’s future sales and earnings.
Jewelry purchases are discretionary and are dependent on consumers’ perceptions of general economic conditions, particularly as jewelry is often perceived to be aluxury purchase. Adverse changes in the economy and periods when discretionary spending by consumers may be under pressure could unfavorably impact salesand earnings. We may respond by increasing discounts or initiating marketing promotions to reduce excess inventory, which could have a material adverse effecton our margins and operating results.
The success of Signet’s operations depends to a significant extent upon a number of factors relating to discretionary consumer spending. These include economicconditions, and perceptions of such conditions by consumers, consumer confidence, level of customer traffic in shopping malls and other retail centers,employment, the level of consumers’ disposable income, business conditions, interest rates, consumer debt and asset values, availability of credit and levels oftaxation for the economy as a whole and in regional and local markets where we operate.
As 10% of Signet’s sales are accounted for by its UK Jewelry division, economic conditions in the eurozone have a significant impact on the UK economy eventhough the UK is not a member of the eurozone. Therefore, developments in the eurozone could adversely impact trading in the UK Jewelry division, as well asadversely impact the US economy.
Global economic conditions and regulatory changes following the United Kingdom’s announced intention to exit from the European Union could adverselyimpact Signet’s business and results of operations located in, or closely associated with, the United Kingdom.
In June 2016, a majority of voters in the United Kingdom elected to withdraw from the European Union (often referred to as Brexit) in a national referendum. Thereferendum was advisory, and the terms of any withdrawal are subject to a negotiation period that could last at least two years after the government of the UnitedKingdom formally initiates a withdrawal process. This will be either accompanied or followed by negotiations between the European Union and the UnitedKingdom concerning the future relations between the parties. Nevertheless, the referendum has created significant uncertainty about the future relationshipbetween the United Kingdom and the European Union. This includes uncertainty with respect to the laws and regulations, including regulations applicable toSignet’s business that will apply in the United Kingdom in the event of a withdrawal. The referendum has also given rise to calls for the governments of otherEuropean Union member states to consider a referendum on withdrawal from the European Union for their territory. These developments, or the perception thatany of them could occur, could adversely impact global economic conditions and the stability of global financial markets, and may significantly reduce globalmarket liquidity and restrict the ability of key market participants to operate in certain financial markets. Any of these factors could depress economic activity,which could adversely impact our business, financial condition and results of operations especially those located in, or closely associated with, the UnitedKingdom. Brexit could lead to long-term volatility in the currency markets and there could be long-term detrimental effects on the value of the British Pound.Brexit could also impact other currencies. Signet uses foreign currency derivative instruments to hedge certain exposures to currency exchange rate risks. Theresults of the Brexit referendum could increase Signet’s exposure to foreign currency rate exchange risks and reduce its ability to effectively use certain derivativeinstruments as a way to hedge risks.
Any deterioration in consumers’ financial position or changes to the regulatory requirements regarding the granting of credit to customers could adverselyimpact the Company’s sales, earnings and the collectability of accounts receivable.
More than half of Signet’s sales in the US and Canada utilize its in-house or third-party customer financing programs and an additional 35% of purchases are madeusing third party bank cards. Any significant deterioration in general economic conditions or increase in consumer debt levels may inhibit consumers’ use of creditand decrease consumers’ ability to satisfy Signet’s requirement for access to customer finance and could in turn have an adverse effect on the Company’s sales.Furthermore, any downturn in general or local economic conditions, in particular an increase in unemployment in the markets in which the Signet operates, mayadversely affect its collection of outstanding accounts receivable, its net bad debt charge and hence earnings.
Additionally, Signet’s ability to extend credit to customers and the terms on which it is achieved depends on many factors, including compliance with applicablelaws and regulations in the US and Canada, any of which may change from time to time, and such changes could adversely affect sales and income. In addition,other restrictions arising from applicable law could cause limitations in credit terms currently offered or a reduction in the level of credit granted by the Company,or by third parties, and this could adversely impact sales, income or cash flow.
The US Dodd-Frank Wall Street Reform and Consumer Protection Act (“Dodd-Frank Act”) was signed into law in July 2010. Among other things, the Dodd-FrankAct created a Bureau of Consumer Financial Protection with broad rule-making and supervisory authority for a wide range of consumer financial services,including Signet’s customer financing programs. The Bureau’s authority became effective in July 2011. Any new regulatory initiatives by the Bureau could imposeadditional costs and/or restrictions on credit practices of the Sterling Jewelers and Zale divisions, which could adversely affect their ability to conduct its business.
Signet’s share price may be volatile.
Signet’s share price may fluctuate substantially as a result of variations in the actual or anticipated results and financial conditions of Signet and other companies inthe retail industry. In addition, the stock market has experienced price and volume fluctuations that have affected the market price of many retail and other stocksin a manner unrelated, or disproportionate, to the operating performance of these companies.
24

Table of Contents
Signet provides public guidance on its expected operating and financial results for future periods. Although Signet believes that this guidance provides investorsand analysts with a better understanding of management’s expectations for the future and is useful to its stockholders and potential stockholders, such guidance iscomprised of forward-looking statements subject to the risks and uncertainties described in this report and in our other public filings and public statements.Signet’s actual results may not always be in line with or exceed the provided guidance or the expectations of our investors and analysts, especially in times ofeconomic uncertainty. In the past, when the Company has reduced its previously provided guidance, the market price of Signet’s common stock has declined. If, inthe future, Signet’s operating or financial results for a particular period do not meet our guidance or the expectations of our investors and analysts or if we reduceour guidance for future periods, the market price of our common stock may decline.
In addition, Signet may fail to meet the expectations of its stockholders or of analysts at some time in the future. If the analysts that regularly follow theCompany’s stock lower their rating or lower their projections for future growth and financial performance, the Company’s stock price could decline.
Signet’s sales, operating income, cash and inventory levels fluctuate on a seasonal basis.
Signet’s business is highly seasonal, with a significant proportion of its sales and operating profit generated during its fourth quarter, which includes the HolidaySeason. Management expects to continue to experience a seasonal fluctuation in its sales and earnings. Therefore, there is limited ability to compensate forshortfalls in fourth quarter sales or earnings by changes in its operations and strategies in other quarters, or to recover from any extensive disruption, for example,due to sudden adverse changes in consumer confidence, inclement weather conditions having an impact on a significant number of stores in the last few daysimmediately before Christmas Day or disruption to warehousing and store replenishment systems. A significant shortfall in results for the fourth quarter of anyfiscal year would therefore be expected to have a material adverse effect on the annual results of operations. Disruption at lesser peaks in sales at Valentine’s Dayand Mother’s Day would be expected to impact the results to a lesser extent. Additionally, in anticipation of increased sales activity in the Holiday Season, Signetincurs certain significant incremental expenses prior to and during peak selling seasons, including advertising and costs associated with hiring a substantial numberof temporary employees to supplement our existing workforce.
Deterioration in the Company’s capital structure or financial performance could result in constraints on capital or financial covenant breaches. Inaddition, a portion of the Company’s debt is variable rate and volatility in benchmark interest rates could adversely impact the Company’s financial results.
While Signet has a strong balance sheet with adequate liquidity to meet its operating requirements, the credit ratings agencies periodically review our capitalstructure and the quality and stability of our earnings. A deterioration in Signet’s capital structure or the quality and stability of earnings could result in adowngrade of Signet’s credit rating. Any negative ratings actions could also constrain the capital available to the Company, could limit the Company’s access tofunding for its operations, funding dividends and share repurchases, and increase the Company’s financing costs. Changes in general credit market conditionscould also affect Signet’s ability to access capital at rates and on terms we determine to be attractive. If our ability to access capital becomes constrained, ourinterest costs will likely increase, which could have a material adverse effect on our results of operations, financial condition and cash flows. Additionally, as aresult of the Company’s exposure to variable interest rate debt, volatility in benchmark interest rates could adversely impact the Company’s financial results.
Signet’s borrowing agreements include various financial covenants and operating restrictions. A material deterioration in its financial performance could result in acovenant being breached. If Signet were to breach, or believed it was going to breach, a financial covenant it would have to renegotiate its terms with currentlenders or find alternative sources of financing if current lenders required cancellation of facilities or early repayment.
Fluctuations in foreign exchange rates could adversely impact the Company’s results of operations and financial condition.
Signet publishes its consolidated annual financial statements in US dollars. At January 28, 2017 , Signet held approximately 91% of its total assets in entitieswhose functional currency is the US dollar and generated approximately 86% of its sales and 94% of its operating income in US dollars for the fiscal year thenended. All the remaining assets, sales and operating income are in UK British pounds and Canadian dollars. Therefore, the Company’s results of operations andbalance sheet are subject to fluctuations in the exchange rates between the US dollar and both the British pound and Canadian dollar. Accordingly, any decrease inthe weighted average value of the British pound or Canadian dollar against the US dollar would decrease reported sales and operating income.
The monthly average exchange rates are used to prepare the income statement and are calculated based on the daily exchange rates experienced by the UK Jewelrydivision and the Canadian subsidiaries of the Zale division in the fiscal month.
Where British pounds or Canadian dollars are held or used to fund the cash flow requirements of the business, any decrease in the weighted average value of theBritish pound or Canadian dollar against the US dollar would reduce the amount of cash and cash equivalents.
In addition, the prices of certain materials and products bought on the international markets by Signet are denominated in foreign currencies. As a result, Signet andits subsidiaries have exposures to exchange rate fluctuations on its cost of goods sold, as well as volatility of input prices if foreign manufacturers and suppliers areimpacted by exchange rate fluctuations.
25

Table of Contents
Fluctuations in the availability and pricing of commodities, particularly polished diamonds and gold, which account for the majority of Signet’smerchandise costs, could adversely impact its earnings and cash availability.
The jewelry industry generally is affected by fluctuations in the price and supply of diamonds, gold and, to a lesser extent, other precious and semi-precious metalsand stones. In particular, diamonds accounted for about 45% , and gold about 14% , of Signet’s merchandise costs in Fiscal 2017 .
In Fiscal 2017 , prices for the assortment of polished diamonds utilized by Signet decreased slightly compared to prior year. Industry forecasts indicate that overthe medium and longer term, the demand for diamonds will probably increase faster than the growth in supply, particularly as a result of growing demand incountries such as China and India. Therefore, the cost of diamonds is anticipated to rise over time, although fluctuations in price are likely to continue to occur.The mining, production and inventory policies followed by major producers of rough diamonds can have a significant impact on diamond prices, as can theinventory and buying patterns of jewelry retailers and other parties in the supply chain.
While jewelry manufacturing is the major final demand for gold, management believes that the cost of gold is predominantly impacted by investment transactionswhich have resulted in significant volatility in the gold price in recent years. Signet’s cost of merchandise and potentially its earnings may be adversely impactedby investment market considerations that cause the price of gold to significantly escalate.
The availability of diamonds is significantly influenced by the political situation in diamond producing countries and by the Kimberley Process, an inter-governmental agreement for the international trading of rough diamonds. Until acceptable alternative sources of diamonds can be developed, any sustainedinterruption in the supply of diamonds from significant producing countries, or to the trading in rough and polished diamonds which could occur as a result ofdisruption to the Kimberley Process, could adversely affect Signet, as well as the retail jewelry market as a whole. In addition, the current Kimberley Processdecision making procedure is dependent on reaching a consensus among member governments, which can result in the protracted resolution of issues, and there islittle expectation of significant reform over the long-term. The impact of this review process on the supply of diamonds, and consumers’ perception of the diamondsupply chain, is unknown. In addition to the Kimberley Process, the supply of diamonds to the US is also impacted by certain governmental trade sanctionsimposed on Zimbabwe.
The possibility of constraints in the supply of diamonds of a size and quality Signet requires to meet its merchandising requirements may result in changes inSignet’s supply chain practices, for example its rough sourcing initiative. In addition, Signet may from time to time choose to hold more inventory, purchase rawmaterials at an earlier stage in the supply chain or enter into commercial agreements of a nature that it currently does not use. Such actions could require theinvestment of cash and/or additional management skills. Such actions may not result in the expected returns and other projected benefits anticipated bymanagement.
An inability to increase retail prices to reflect higher commodity costs would result in lower profitability. Historically, jewelry retailers have been able, over time,to increase prices to reflect changes in commodity costs. However, in general, particularly sharp increases in commodity costs may result in a time lag beforeincreased commodity costs are fully reflected in retail prices. As Signet uses an average cost inventory methodology, volatility in its commodity costs may alsoresult in a time lag before cost increases are reflected in retail prices. There is no certainty that such price increases will be sustainable, so downward pressure ongross margins and earnings may occur. In addition, any sustained increases in the cost of commodities could result in the need to fund a higher level of inventory orchanges in the merchandise available to the customer.
In August 2012, the SEC, pursuant to the Dodd-Frank Act, issued final rules, which require annual disclosure and reporting on the source and use of certainminerals, including gold, from the Democratic Republic of Congo and adjoining countries. The gold supply chain is complex and, while management believes thatthe rules currently cover less than 1% of annual worldwide gold production (based upon recent estimates), the final rules require Signet and other affectedcompanies that file with the SEC to make specified country of origin inquiries of our suppliers, and otherwise to exercise reasonable due diligence in determiningthe country of origin and certain other information relating to any of the statutorily designated minerals (gold, tin, tantalum and tungsten), that are used in productssold by Signet in the US and elsewhere. On May 27, 2016, Signet filed with the SEC its Form Specialized Disclosure (“SD”) and accompanying Conflict MineralsReport in accordance with the SEC’s rules, which together describe our country of origin inquiries and due diligence measures relating to the source and chain ofcustody of those designated minerals Signet deemed necessary to the functionality or production of our products, the results of those activities and our relateddeterminations with respect to the calendar year ended December 31, 2015.
There may be reputational risks associated with the potential negative response of our customers and other stakeholders to future disclosures by Signet in the eventthat, due to the complexity of the global supply chain, Signet is unable to sufficiently verify the origin of the relevant metals. Also, if future responses toverification requests by suppliers of any of the covered minerals used in our products are inadequate or adverse, Signet’s ability to obtain merchandise may beimpaired and our compliance costs may increase. The final rules also cover tungsten and tin, which are contained in a small proportion of items that are sold bySignet. It is possible that other minerals, such as diamonds, could be subject to similar rules.
Price increases may have an adverse impact on Signet’s performance.
If significant price increases are implemented, by any division or across a wide range of merchandise, the impact on earnings will depend on, among other factors,the pricing by competitors of similar products in the same geographic area and the response by customers to higher prices. Such price increases may result in lowersales and adversely impact earnings.
26

Table of Contents
Signet’s competitors are specialty jewelry retailers, as well as other jewelry retailers, including department stores, mass merchandisers, discount stores, apparel andaccessory fashion stores, brand retailers, shopping clubs, home shopping television channels, direct home sellers, online retailers and auction sites. In addition,other retail categories and other forms of expenditure, such as electronics and travel, also compete for consumers’ discretionary expenditure, particularly during theholiday gift giving season. Therefore, the price of jewelry relative to other products influences the proportion of consumers’ expenditure that is spent on jewelry. Ifthe relative price of jewelry increases, Signet’s sales and earnings may decline.
The Company’s ability to satisfy the accounting requirements for “hedge accounting,” or the default or insolvency of a counterparty to a hedging contract,could adversely impact results.
Signet hedges a portion of its purchases of gold for both its Sterling Jewelers and UK Jewelry divisions and hedges the US dollar requirements of its UK Jewelrydivision. The failure to satisfy the requirements of the appropriate accounting requirements, or a default or insolvency of a counterparty to a contract, couldincrease the volatility of results and may impact the timing of recognition of gains and losses in the income statement.
The Company’s inability to obtain merchandise that customers wish to purchase, particularly ahead of and during the fourth quarter, could adverselyimpact sales.
The abrupt loss or disruption of any significant supplier during the three month period (August to October) leading up to the fourth quarter could result in amaterial adverse effect on Signet’s business.
Also, if management misjudges expected customer demand or fails to identify changes in customer demand and/or its supply chain does not respond in a timelymanner, it could adversely impact Signet’s results by causing either a shortage of merchandise or an accumulation of excess inventory.
Signet benefits from close commercial relationships with a number of suppliers. Damage to, or loss of, any of these relationships could have a detrimental effect onresults. Management holds regular reviews with major suppliers. Signet’s most significant supplier accounts for 5.5% of merchandise. Government requirementsregarding sources of commodities, such as those required by the Dodd-Frank Act, could result in Signet choosing to terminate relationships with suppliers in thefuture due to a change in a supplier’s sourcing practices or Signet’s compliance with laws and internal policies.
Luxury and prestige watch manufacturers and distributors normally grant agencies the right to sell their ranges on a store-by-store basis. The watch brands sold byErnest Jones, and to a lesser extent Jared, help attract customers and build sales in all categories. Therefore, an inability to obtain or retain watch agencies for alocation could harm the performance of that particular store. In the case of Ernest Jones, the inability to gain additional prestige watch agencies is an importantfactor in, and may reduce the likelihood of, opening new stores, which could adversely impact sales growth.
The growth in importance of branded merchandise within the jewelry market may adversely impact Signet’s sales and earnings if it is unable to obtain supplies ofbranded merchandise that the customer wishes to purchase. In addition, if Signet loses the distribution rights to an important branded jewelry range, it couldadversely impact sales and earnings.
Signet has had success in recent years in the development of branded merchandise that is exclusive to its stores. If Signet is not able to further develop suchbranded merchandise, or is unable to successfully develop further such initiatives, it may adversely impact sales and earnings.
The Company’s ability to recruit, train, motivate and retain suitably qualified sales associates could adversely impact sales and earnings.
Management regards the customer experience as an essential element in the success of its business. Competition for suitable individuals or changes in labor andhealthcare laws could require us to incur higher labor costs. Therefore an inability to recruit, train, motivate and retain suitably qualified sales associates couldadversely impact sales and earnings.
Loss of confidence by consumers in Signet’s brand names, poor execution of marketing programs and reduced marketing expenditure could have adetrimental impact on sales.
Primary factors in determining customer buying decisions in the jewelry sector include customer confidence in the retailer and in the brands it sells, together withthe level and quality of customer service. The ability to differentiate Signet’s stores and merchandise from competitors by its branding, marketing and advertisingprograms is an important factor in attracting consumers. If these programs are poorly executed, the level of support for them is reduced, or the customer losesconfidence in any of Signet’s brands for whatever reason, it could unfavorably impact sales and earnings.
Long-term changes in consumer attitudes to jewelry could be unfavorable and harm jewelry sales.
Consumer attitudes to diamonds, gold and other precious metals and gemstones also influence the level of Signet’s sales. Attitudes could be affected by a variety ofissues including concern over the source of raw materials; the impact of mining and refining of minerals on the environment, the local community and the politicalstability of the producing country; labor conditions in the supply chain; and the availability of and consumer attitudes to substitute products such as cubic zirconia,moissanite and laboratory-created diamonds. A negative change in consumer attitudes to jewelry could adversely impact sales and earnings.
27

Table of Contents
The retail jewelry industry is highly fragmented and competitive.
The retail jewelry industry is competitive. If Signet’s competitive position deteriorates, operating results or financial condition could be adversely affected.
Aggressive discounting by competitors may adversely impact Signet’s performance in the short term. This is particularly the case for easily comparable pieces ofjewelry, of similar quality, sold through stores that are situated near to those that Signet operates.
Signet faces significant competition from independent and regional specialty jewelry retailers that are able to adjust their competitive stance, for example onpricing, to local market conditions. This can put individual Signet stores at a competitive disadvantage as Signet division’s have a national pricing strategy.
The Company’s inability to rent stores that satisfy management’s operational and financial criteria could adversely impact sales, as could changes inlocations where customers shop.
Signet’s results are dependent on a number of factors relating to its stores. These include the availability of desirable property, the demographic characteristics ofthe area around the store, the design and maintenance of the stores, the availability of attractive locations within the shopping center that also meet the operationaland financial criteria of management, the terms of leases and Signet’s relationship with major landlords. If Signet is unable to rent stores that satisfy its operationaland financial criteria, or if there is a disruption in its relationship with its major landlords, sales could be adversely affected.
Given the length of property leases that Signet enters into, it is dependent upon the continued popularity of particular retail locations. As Signet tests and developsnew types of store locations and designs, there is no certainty as to their success. The majority of long-term space growth opportunities in the US are in newdevelopments and therefore future store space is in part dependent on the investment by real estate developers in new projects. Limited new real estatedevelopment taking place would make it challenging to identify and secure suitable new store locations. The UK Jewelry division has a more diverse range of storelocations than in the US or Canada, including some exposure to smaller retail centers which do not justify the investment required to refurbish the site to thecurrent store format. Consequently, the UK Jewelry division is gradually closing stores in such locations as leases expire or satisfactory property transactions canbe executed; however, the ability to secure such property transactions is not certain.
The rate of new store development is dependent on a number of factors including obtaining suitable real estate, the capital resources of Signet, the availability ofappropriate staff and management and the level of the financial return on investment required by management.
Signet’s success is dependent on the strength and effectiveness of its relationships with its various stakeholders whose behavior may be affected by itsmanagement of social, ethical and environmental risks.
Social, ethical and environmental matters influence Signet’s reputation, demand for merchandise by consumers, the ability to recruit staff, relations with suppliersand standing in the financial markets. Signet’s success is dependent on the strength and effectiveness of its relationships with its various stakeholders: customers,shareholders, employees and suppliers. In recent years, stakeholder expectations have increased and Signet’s success and reputation will depend on its ability tomeet these higher expectations. Signet’s success also depends upon its reputation for integrity in sourcing its merchandise, which, if adversely affected couldimpact consumer sentiment and willingness to purchase Signet’s merchandise.
Inadequacies in and disruption to systems could result in lower sales and increased costs or adversely impact the reporting and control procedures.
Signet is dependent on the suitability, reliability and durability of its systems and procedures, including its accounting, information technology, data protection,warehousing and distribution systems, and those of our service providers. If support ceased for a critical externally supplied software package or system,management would have to implement an alternative software package or system or begin supporting the software internally. Disruption to parts of the businesscould result in lower sales and increased costs.
Signet is in the process of substantially modifying our enterprise resource planning systems, which involves updating or replacing legacy systems with successorsystems over the course of several years. These system changes and upgrades can require significant capital investments and dedication of resources. While Signetfollows a disciplined methodology when evaluating and making such changes, there can be no assurances that the Company will successfully implement suchchanges, that such changes will occur without disruptions to its operations or that the new or upgraded systems will achieve the desired business objectives. Anydamage, disruption or shutdown of the Company’s information systems, or the failure to successfully implement new or upgraded systems, could have a directmaterial adverse effect on Signet’s results of operations.
An inability to successfully develop and maintain a relevant omni-channel experience for customers could adversely impact Signet’s business and results ofoperations.
Signet’s business has evolved from an in-store experience to interaction with customers across numerous channels, including in-store, online, mobile and socialmedia, among others. Omni-channel retailing is rapidly evolving and Signet must keep pace with changing customer expectations and new developments by ourcompetitors. Our customers are increasingly using computers, tablets, mobile phones and other devices to comparison shop, determine product availability andcomplete purchases online. Signet must compete by offering a consistent and convenient shopping experience for our customers regardless of the ultimate saleschannel and by investing in, providing and maintaining digital tools for our customers
28

Table of Contents
that have the right features and are reliable and easy to use. If Signet is unable to make, improve or develop relevant customer-facing technology in a timelymanner, the Company’s ability to compete and its results of operations could be materially and adversely affected. In addition, if Signet’s online activities or othercustomer-facing technology systems do not function as designed, the Company may experience a loss of customer confidence, data security breaches, lost sales orbe exposed to fraudulent purchases, any of which could materially and adversely affect our business operations, reputation and results of operations.
Security breaches and other disruptions to Signet’s information technology infrastructure and databases could interfere with Signet’s operations, and couldcompromise Signet’s and its customers’ and suppliers’ information, exposing Signet to liability which would cause Signet’s business and reputation tosuffer.
Signet operates in multiple channels and, in the Sterling Jewelers division, maintains its own customer financing operation. Signet is also increasingly using mobiledevices, social media and other online activities to connect with customers, staff and other stakeholders. Therefore, in the ordinary course of business, Signet reliesupon information technology networks and systems, some of which are managed by third parties, to process, transmit and store electronic information, and tomanage or support a variety of business processes and activities, including eCommerce sales, supply chain, merchandise distribution, customer invoicing andcollection of payments. Signet uses information technology systems to record, process and summarize financial information and results of operations for internalreporting purposes and to comply with regulatory financial reporting, legal and tax requirements. Additionally, Signet collects and stores sensitive data, includingintellectual property, proprietary business information, the propriety business information of our customers and suppliers, as well as personally identifiableinformation of Signet’s customers and employees, in data centers and on information technology networks. The secure operation of these networks, and theprocessing and maintenance of this information is critical to Signet’s business operations and strategy. Despite security measures and business continuity plans, wemay not timely anticipate evolving techniques used to effect security breaches that may result in damage, disruptions or shutdowns of Signet’s and our third-partyvendors’ networks and infrastructure due to attacks by hackers, including phishing or other cyber-attacks, or breaches due to employee error or malfeasance, orother disruptions during the process of upgrading or replacing computer software or hardware, power outages, computer viruses, telecommunication or utilityfailures or natural disasters or other catastrophic events. The occurrence of any of these events could compromise Signet’s networks and the information storedthere, including personal, proprietary or confidential information about Signet, our customers or our third-party vendors, and personally identifiable information ofSignet’s customers and employees could be accessed, manipulated, publicly disclosed, lost or stolen, exposing our customers to the risk of identity theft andexposing Signet or our third-party vendors to a risk of loss or misuse of this information. To date, these attacks or breaches have not had a material impact onSignet’s business or operations; however, any such access, disclosure or other loss of information could result in legal claims or proceedings, liability or regulatorypenalties under laws protecting the privacy of personal information, significant breach-notification costs, lost sales and a disruption to operations (including ourability to process consumer transactions and manage inventories), media attention, and damage to Signet’s reputation, which could adversely affect Signet’sbusiness. In addition, it could harm Signet’s reputation and ability to execute its business through service and business interruptions, management distractionand/or damage to physical infrastructure, which could adversely impact sales, costs and earnings. If Signet is the target of a cybersecurity attack resulting inunauthorized disclosure of our customer data, we may be required to undertake costly notification and credit monitoring procedures. Compliance with these lawswill likely increase the costs of doing business.
The regulatory environment related to information security, data collection and privacy is becoming increasingly demanding, with new and changing requirementsapplicable to Signet’s business, and compliance with those requirements could result in additional costs, such as costs related to organizational changes,implementing additional protection technologies, training employees and engaging consultants.
These risks could have a material adverse effect on Signet’s results of operations, financial condition and cash flow.
An adverse decision in legal proceedings and/or tax matters could reduce earnings.
Signet is involved in legal proceedings incidental to its business. Litigation is inherently unpredictable. Any claims against us, whether meritorious or not, could betime consuming, result in costly litigation, require significant amounts of management time and result in the diversion of significant operational resources.
In March 2008, private plaintiffs filed a class action lawsuit for an unspecified amount against Sterling Jewelers Inc. (“Sterling”), a subsidiary of Signet, in USDistrict Court for the Southern District of New York, which has been referred to private arbitration. In September 2008, the US Equal Employment OpportunitiesCommission filed a lawsuit against Sterling in US District Court for the Western District of New York. Sterling denies the allegations from both parties and hasbeen defending these cases vigorously. If, however, it is unsuccessful in either defense, Sterling could be required to pay substantial damages. At this point, nooutcome or amount of loss is able to be estimated. See Note 25 in Item 8.
In August 2016, individual plaintiffs filed putative class actions asserting claims under the federal securities laws in the US District Court for the Southern Districtof New York against the Company and its Chief Executive Officer and Chief Financial Officer seeking an unspecified amount of damages. The cases wereconsolidated and an amended complaint was filed in January 2017. Plaintiffs sought leave from court which was granted to file a second amended complaint.Signet denies the current allegations and intends to defend the case vigorously. If, however, it is unsuccessful in its defense, Signet could be required to paysubstantial damages. At this point, no outcome or amount of loss is able to be estimated. See Note 25 in Item 8.
29

Table of Contents
At any point in time, various tax years are subject to, or are in the process of, audit by various taxing authorities. To the extent that management’s estimates ofsettlements change or the final tax outcome of these matters is different than the amounts recorded, such differences will impact income tax in the period in whichsuch determinations are made.
Failure to comply with labor regulations could adversely affect the Company’s business.
State, federal and global laws and regulations regarding employment change frequently and the ultimate cost of compliance cannot be precisely estimated. Failureby Signet to comply with labor regulations could result in fines and legal actions. In addition, the ability to recruit and retain staff could be harmed.
Collective bargaining activity could disrupt the Company’s operations, increase our labor costs or interfere with the ability of our management to focus onexecuting our business strategies.
The employees of our diamond polishing factory in Garborone, Botswana are covered by a collective bargaining agreement. If relationships with these employeesbecome adverse, operations at the factory could experience labor disruptions such as strikes, lockouts, boycotts and public demonstrations. Labor regulation andthe negotiation of new or existing collective bargaining agreements could lead to higher wage and benefit costs, changes in work rules that raise operatingexpenses, legal costs and limitations on our ability to take cost saving measures during economic downturns.
The Company’s ability to comply with changes in laws and regulations could adversely affect our business.
Signet’s policies and procedures are designed to comply with all applicable laws and regulations. Changing legal and regulatory requirements in the US and otherjurisdictions in which Signet operates have increased the complexity of the regulatory environment in which the business operates and the cost of compliance.Failure to comply with the various regulatory requirements may result in damage to Signet’s reputation, civil and criminal liability, fines and penalties, and furtherincrease the cost of regulatory compliance.
Changes in existing taxation benefits, rules or practices may adversely affect the Company’s financial results.
The Company operates through various subsidiaries in numerous countries throughout the world. Consequently, Signet is subject to changes in tax laws, treaties orregulations or the interpretation or enforcement thereof in the United States or jurisdictions where any subsidiaries operate or are incorporated. Tax laws, treatiesand regulations are highly complex and subject to interpretation. The Company’s income tax expense is based upon interpretation of the tax laws in effect invarious countries at the time such expense was incurred. If these tax laws, treaties or regulations were to change or any tax authority were to successfully challengeour assessment of the effects of such laws, treaties and regulations in any country, this could result in a higher effective tax rate on the Company’s taxable earnings,which could have a material adverse effect on the Company’s results of operations.
In addition, the Organization for Economic Co-Operation and Development (“OECD”) has published an action plan seeking multilateral cooperation to reform thetaxation of multinational companies. Countries already have begun to implement some of these action items, and likely will continue to adopt more of them overthe next several years. This may result in unilateral or uncoordinated local country application of the action items. Any such inconsistencies in the tax laws ofcountries where the Company operates or is incorporated may lead to increased uncertainty with respect to tax positions or otherwise increase the potential fordouble taxation. Proposals for U.S. tax reform also potentially could have a significant adverse effect on us. In addition, the European Commission has conductedinvestigations in multiple countries focusing on whether local country tax legislation or rulings provide preferential tax treatment in violation of European Unionstate aid rules. Any impacts of these actions could increase the Company’s tax liabilities, which in turn could have a material adverse effect on the Company’sresults of operations and financial condition.
The Parent Company is incorporated in Bermuda. The directors intend to conduct the Parent Company’s affairs such that, based on current law and practice of therelevant tax authorities, the Parent Company will not become resident for tax purposes in any other territory. At the present time, there is no Bermuda income orprofits tax, withholding tax, capital gains tax, capital transfer tax, estate duty or inheritance tax payable by the Parent Company or by its shareholders in respect ofits common shares. The Parent Company has obtained an assurance from the Minister of Finance of Bermuda under the Exempted Undertakings Tax ProtectionAct 1966 that, in the event that any legislation is enacted in Bermuda imposing any tax computed on profits or income, or computed on any capital asset, gain orappreciation or any tax in the nature of estate duty or inheritance tax, such tax shall not, until March 31, 2035, be applicable to it or to any of its operations or to itsshares, debentures or other obligations except insofar as such tax applies to persons ordinarily resident in Bermuda or is payable by it in respect of real propertyowned or leased by it in Bermuda. Given the limited duration of the Minister of Finance’s assurance, the Parent Company cannot be certain that it will not besubject to Bermuda tax after March 31, 2035. In the event the Parent Company were to become subject to any Bermuda tax after such date, it could have a materialadverse effect on the Parent Company’s results of operations and financial condition.
Likewise, Signet’s non-U.S. subsidiaries operate in a manner that they should not be subject to U.S. income tax because none of them should be treated as engagedin a trade or business in the U.S. If, despite this, the IRS were to successfully contend that the Parent Company or any of its non-U.S. subsidiaries are engaged in atrade or business in the U.S., such entity could be subject to U.S. corporate income and branch profits taxes on the portion of its earnings effectively connected tosuch U.S. business, which could adversely affect the Company’s results of operations.
30

Table of Contents
Investors may face difficulties in enforcing proceedings against Signet Jewelers Limited as it is domiciled in Bermuda.
It is doubtful whether courts in Bermuda would enforce judgments obtained by investors in other jurisdictions, including the US, Canada and the UK, against theParent Company or its directors or officers under the securities laws of those jurisdictions or entertain actions in Bermuda against the Parent Company or itsdirectors or officers under the securities laws of other jurisdictions.
Any difficulty executing or integrating an acquisition, a business combination or a major business initiative may result in expected returns and otherprojected benefits from such an exercise not being realized.
Any difficulty in executing or integrating an acquisition, a business combination or a major business initiative, including our direct diamond sourcing capabilities,may result in expected returns and other projected benefits from such an exercise not being realized. The acquisition of companies with operating margins lowerthan that of Signet may cause an overall lower operating margin for Signet. A significant transaction could also disrupt the operation of our current activities anddivert significant management time and resources. Signet’s current borrowing agreements place certain limited constraints on our ability to make an acquisition orenter into a business combination, and future borrowing agreements could place tighter constraints on such actions.
Additional indebtedness relating to the acquisition of Zale Corporation reduces the availability of cash to fund other business initiatives.
Signet’s additional indebtedness to fund the acquisition of Zale Corporation has significantly increased Signet’s outstanding debt. This additional indebtednessrequires us to dedicate a portion of our cash flow to servicing this debt, which may impact the availability of cash to fund other business initiatives, includingdividends and share repurchases. Significant changes to Signet’s financial condition as a result of global economic changes or difficulties in the integration orexecution of strategies of the acquired business may affect our ability to satisfy the financial covenants included in the terms of the financing arrangements.
Failure to successfully combine Signet’s and Zale Corporation’s businesses in the expected time frame may adversely affect the future results of thecombined company, and there is no assurance that we will be able to fully achieve integration-related efficiencies or that those achieved will offsettransaction-related costs.
The success of the transaction will depend, in part, on our ability to successfully combine the Signet and Zale businesses in order to realize the anticipated benefitsand synergies from combination. If the combined company is not able to achieve these objectives, or is not able to achieve these objectives on a timely basis, theanticipated benefits of the transaction may not be realized fully. In addition, we have incurred a number of substantial transaction and integration-related costsassociated with completing the transaction, combining the operations of the two companies and taking steps to achieve desired synergies. Transaction costsinclude, but are not limited to, fees paid to legal, financial, accounting and integration advisors, regulatory filing fees and printing costs. Additional unanticipatedcosts may be incurred in the integration of our and Zale Corporation’s businesses. There can be no assurance that the realization of other efficiencies related to theintegration of the two businesses, as well as the elimination of certain duplicative costs, will offset the incremental transaction-related costs over time. Thus, anynet benefit may not be achieved in the near term, the long term, or at all.
Additionally, these integration difficulties could result in declines in the market value of our common stock.
The Company’s ability to protect intellectual property could have a negative impact on our brands, reputation and operating results.
Signet’s trade names, trademarks, copyrights, patents and other intellectual property are important assets and an essential element of the Company’s strategy. Theunauthorized reproduction, theft or misappropriation of Signet’s intellectual property could diminish the value of its brands or reputation and cause a decline insales. Protection of Signet’s intellectual property and maintenance of distinct branding are particularly important as they distinguish our products and services fromthose of our competitors. The costs of defending our intellectual property may adversely affect the Company’s operating results. In addition, any infringement orother intellectual property claim made against Signet, whether or not it has merit, could be time-consuming, result in costly litigation, cause product delays, orrequire the Company to enter into royalty or licensing agreements. As a result, any such claim could have a material adverse effect on Signet’s operating results.
If the Company’s goodwill or indefinite-lived intangible assets become impaired, we may be required to record significant charges to earnings.
We have a substantial amount of goodwill and indefinite-lived intangible assets on our balance sheet as a result of the Zale Corporation acquisition. We reviewgoodwill and indefinite-lived intangible assets for impairment annually or whenever events or circumstances indicate impairment may have occurred. Applicationof the impairment test requires judgment, including the identification of reporting units, assignment of assets, liabilities and goodwill to reporting units, and thedetermination of fair value of each reporting unit. There is a risk that a significant deterioration in a key estimate or assumption or a less significant deterioration toa combination of assumptions or the sale of a part of a reporting unit could result in an impairment charge in the future, which could have a significant adverseimpact on our reported earnings.
For further information on our testing for goodwill impairment, see “Critical Accounting Policies” under Part II, Item 7, Management’s Discussion and Analysis ofFinancial Condition and Results of Operations.
31

Table of Contents
Loss of one or more key executive officers or employees could adversely impact performance, as could the appointment of an inappropriate successor orsuccessors.
Signet’s future success will partly depend upon the ability of senior management and other key employees to implement an appropriate business strategy. WhileSignet has entered into termination protection agreements with such key personnel, the retention of their services cannot be guaranteed and the loss of suchservices could have a material adverse effect on Signet’s ability to conduct its business. Competition for key personnel in the retail industry is intense, and Signet’sfuture success will also depend on our ability to attract and retain talented personnel. In addition, any new executives may wish, subject to Board approval, tochange the strategy of Signet. The appointment of new executives may therefore adversely impact performance.
ITEM 1B. UNRESOLVED STAFF COMMENTS
Not applicable.
ITEM 2. PROPERTIES
The following table provides the location, use and size of our distribution, corporate and other non-retail facilities required to support the Company’s globaloperations as of January 28, 2017 :
Location Function Approximate square
footage Lease or Own Lease expiration
Akron, Ohio (1) Corporate and distribution 460,000 Lease 2047Akron, Ohio Credit 86,000 Lease 2047Akron, Ohio Training 12,000 Lease 2047Akron, Ohio Repair Center 38,000 Own N/AAkron, Ohio Corporate 34,900 Lease 2019Barberton, Ohio Non-merchandise fulfillment 135,000 Lease 2031New York City, New York Design 4,600 Lease 2020New York City, New York Diamond trading 2,000 Lease 2021Irving, Texas (2) Corporate and distribution 414,000 Lease 2018Toronto, Ontario (Canada) Distribution and fulfillment 26,000 Lease 2019Birmingham, UK Corporate and eCommerce fulfillment 255,000 Own N/ABorehamwood, Hertfordshire (UK) Corporate and distribution 36,200 Lease 2020Gaborone, Botswana Diamond polishing 34,200 Own N/AMumbai, India Diamond liaison 3,000 Lease 2018
(1) Signet is expanding the Akron headquarters by approximately 80,000 square feet to enhance distribution capabilities. The expansion is scheduled to be open for operation by the end of Fiscal 2018.(2) Signet will be relocating the Dallas headquarters to a new 225,000 square foot facility upon expiration of the existing lease for the facility in Irving, Texas. The lease for this new headquarters will expire in
2028. Additionally, Signet is currently building a 31,000 square foot freestanding repair facility in Dallas, Texas, similar to the repair center in Akron, Ohio. It is scheduled to open for operation in March 2017with the new lease set to expire in 2028.
Sufficient distribution exists in all geographies to meet the respective needs of the Company’s operations.
Global retail property
Signet attributes great importance to the location and appearance of its stores. Accordingly, in each of Signet’s divisions, investment decisions on selecting sitesand refurbishing stores are made centrally, and strict real estate and investment criteria are applied. Below is a summary of property details by geography for ourretail operations as of January 28, 2017 :
32
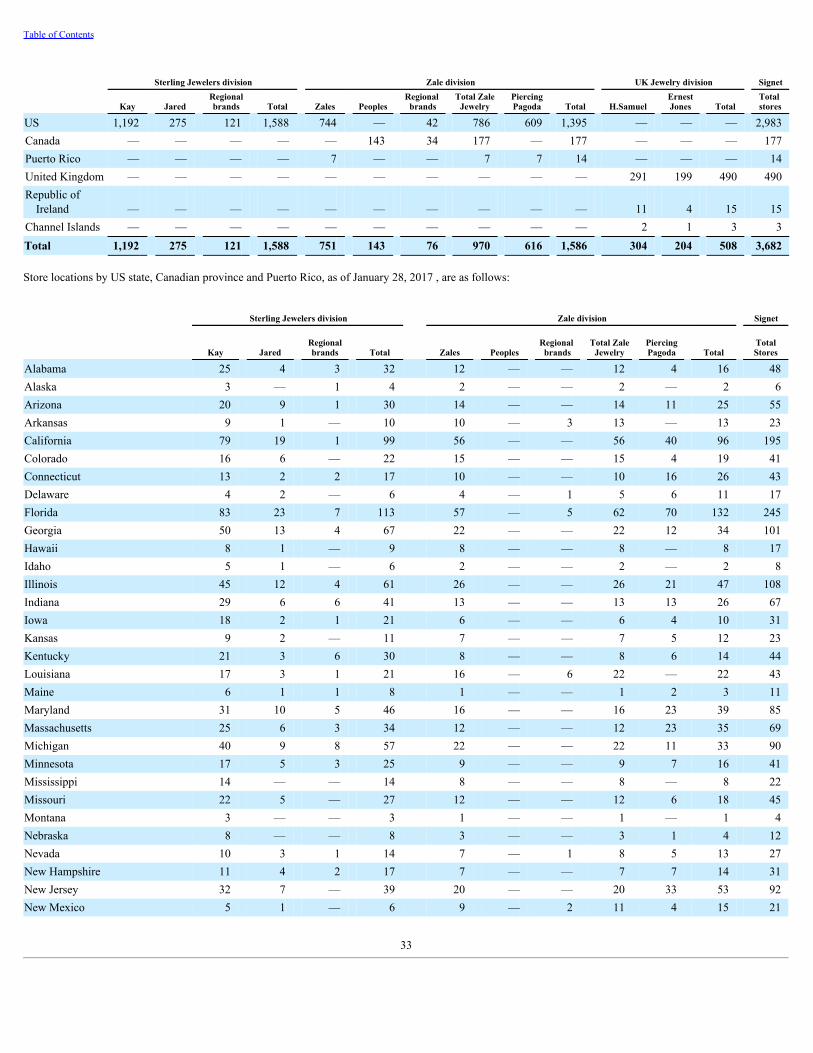
Table of Contents
Sterling Jewelers division Zale division UK Jewelry division Signet
Kay Jared Regionalbrands Total Zales Peoples
Regional brands
Total ZaleJewelry
PiercingPagoda Total H.Samuel
ErnestJones Total
Total stores
US 1,192 275 121 1,588 744 — 42 786 609 1,395 — — — 2,983Canada — — — — — 143 34 177 — 177 — — — 177Puerto Rico — — — — 7 — — 7 7 14 — — — 14United Kingdom — — — — — — — — — — 291 199 490 490Republic of
Ireland — — — — — — — — — — 11 4 15 15Channel Islands — — — — — — — — — — 2 1 3 3Total 1,192 275 121 1,588 751 143 76 970 616 1,586 304 204 508 3,682
Store locations by US state, Canadian province and Puerto Rico, as of January 28, 2017 , are as follows:
Sterling Jewelers division Zale division Signet
Kay Jared Regionalbrands Total Zales Peoples
Regional brands
Total ZaleJewelry
PiercingPagoda Total
TotalStores
Alabama 25 4 3 32 12 — — 12 4 16 48Alaska 3 — 1 4 2 — — 2 — 2 6Arizona 20 9 1 30 14 — — 14 11 25 55Arkansas 9 1 — 10 10 — 3 13 — 13 23California 79 19 1 99 56 — — 56 40 96 195Colorado 16 6 — 22 15 — — 15 4 19 41Connecticut 13 2 2 17 10 — — 10 16 26 43Delaware 4 2 — 6 4 — 1 5 6 11 17Florida 83 23 7 113 57 — 5 62 70 132 245Georgia 50 13 4 67 22 — — 22 12 34 101Hawaii 8 1 — 9 8 — — 8 — 8 17Idaho 5 1 — 6 2 — — 2 — 2 8Illinois 45 12 4 61 26 — — 26 21 47 108Indiana 29 6 6 41 13 — — 13 13 26 67Iowa 18 2 1 21 6 — — 6 4 10 31Kansas 9 2 — 11 7 — — 7 5 12 23Kentucky 21 3 6 30 8 — — 8 6 14 44Louisiana 17 3 1 21 16 — 6 22 — 22 43Maine 6 1 1 8 1 — — 1 2 3 11Maryland 31 10 5 46 16 — — 16 23 39 85Massachusetts 25 6 3 34 12 — — 12 23 35 69Michigan 40 9 8 57 22 — — 22 11 33 90Minnesota 17 5 3 25 9 — — 9 7 16 41Mississippi 14 — — 14 8 — — 8 — 8 22Missouri 22 5 — 27 12 — — 12 6 18 45Montana 3 — — 3 1 — — 1 — 1 4Nebraska 8 — — 8 3 — — 3 1 4 12Nevada 10 3 1 14 7 — 1 8 5 13 27New Hampshire 11 4 2 17 7 — — 7 7 14 31New Jersey 32 7 — 39 20 — — 20 33 53 92New Mexico 5 1 — 6 9 — 2 11 4 15 21
33

Table of Contents
New York 67 9 3 79 43 — — 43 64 107 186North Carolina 46 12 1 59 20 — 1 21 19 40 99North Dakota 4 — — 4 3 — — 3 1 4 8Ohio 66 16 21 103 19 — — 19 23 42 145Oklahoma 10 2 — 12 11 — 4 15 — 15 27Oregon 16 3 — 19 5 — — 5 5 10 29Pennsylvania 62 11 7 80 36 — 1 37 63 100 180Rhode Island 4 1 — 5 2 — — 2 3 5 10South Carolina 26 3 2 31 10 — — 10 6 16 47South Dakota 3 — — 3 3 — — 3 1 4 7Tennessee 28 8 3 39 18 — 1 19 5 24 63Texas 76 30 — 106 99 — 17 116 21 137 243Utah 10 3 — 13 2 — — 2 3 5 18Vermont 2 — — 2 1 — — 1 1 2 4Virginia 40 10 7 57 26 — — 26 27 53 110Washington 19 3 7 29 14 — — 14 12 26 55West Virginia 10 — 6 16 6 — — 6 8 14 30Wisconsin 23 4 4 31 8 — — 8 13 21 52Wyoming 2 — — 2 3 — — 3 — 3 5US 1,192 275 121 1,588 744 — 42 786 609 1,395 2,983Alberta — — — — — 23 8 31 — 31 31British Columbia — — — — — 24 2 26 — 26 26Manitoba — — — — — 5 — 5 — 5 5New Brunswick — — — — — 3 — 3 — 3 3Newfoundland — — — — — 2 — 2 — 2 2Nova Scotia — — — — — 7 2 9 — 9 9Ontario — — — — — 68 21 89 — 89 89Prince Edward Island — — — — — 2 1 3 — 3 3Saskatchewan — — — — — 9 — 9 — 9 9Canada — — — — — 143 34 177 — 177 177Puerto Rico — — — — 7 — — 7 7 14 14Total North America 1,192 275 121 1,588 751 143 76 970 616 1,586 3,174
North America retail property
Signet’s Sterling Jewelers, Zale Jewelry and Piercing Pagoda segments operate stores and kiosks in the US, with substantially all of the locations being leased. Inaddition to a minimum annual rent cost, the majority of mall stores are also liable to pay rent based on sales above a specified base level. In Fiscal 2017 , most ofthe mall stores and kiosks only made base rental payments. Under the terms of a typical lease, the Company is required to conform and maintain its usage to agreedstandards, including meeting required advertising expenditure as a percentage of sales, and are responsible for its proportionate share of expenses associated withcommon area maintenance, utilities and taxes of the mall.
The initial term of a mall store lease is generally ten years for Sterling Jewelers and Zale Jewelry and one to five years for Piercing Pagoda kiosks. Towards the endof a lease, management evaluates whether to renew a lease and refit the store, using similar operational and investment criteria as for a new store. Wheremanagement is uncertain whether the location will meet management’s required return on investment, but the store is profitable, the leases may be renewed for oneto five years, during which time the store’s performance is further evaluated. There are typically about 250 such mall stores at any one time in the Sterling Jewelerssegment, as well as the Zale Jewelry segment. Jared stores are normally opened on 10 to 15 year leases with options to extend the lease, and rents are not salesrelated. A refurbishment of a Jared store is normally undertaken every five to ten years.
The Zale Jewelry segment operates stores in Canada and Puerto Rico, all under operating leases, with terms and characteristics similar to the US locationsdescribed above. The Piercing Pagoda segment operates kiosks in Puerto Rico, all under operating leases, with terms and characteristics similar to the US locationsdescribed above.
34

Table of Contents
At January 28, 2017 , the average unexpired lease term of leased premises for the Sterling Jewelers segment was approximately 5 years, and approximately 52% ofthese leases had terms expiring within five years. The cost of remodeling a mall store is similar to the cost of a new mall store, which is typically between $0.3million and $0.7 million, depending on the scope of the remodel project. Jared refurbishments typically cost on average less than $0.2 million. New Jared storestypically cost between $2.1 million and $3.1 million. In Fiscal 2017 , a total of 64 store locations were remodeled ( Fiscal 2016 : 95 locations).
At January 28, 2017 , the average unexpired lease term of leased premises for the Zale Jewelry and Piercing Pagoda segments was 4 and 2 years, respectively, withapproximately 80% of these leases having terms expiring within five years. The cost of remodeling a Zale Jewelry mall store is similar to the cost of a new mallstore, which is typically between $0.3 million and $0.7 million. The cost of a new Piercing Pagoda kiosk approximates $0.1 million. In Fiscal 2017 , store remodelswere completed at 42 Zale Jewelry stores and 83 Piercing Pagoda kiosks. In Fiscal 2016 , store remodels were completed at 45 Zale Jewelry stores and 74 PiercingPagoda kiosks.
In the US, the Sterling Jewelers, Zale Jewelry and Piercing Pagoda segments collectively lease approximately 20% of store and kiosk locations from a singlelessor. In Canada, Zale Jewelry leases approximately 50% of its store locations from four lessors, with no individual lessor relationship exceeding 15% of its storelocations. The segments had no other relationship with any lessor relating to 10% or more of its locations.
During the past five fiscal years, the Company generally has been successful in renewing its store leases as they expire and has not experienced difficulty insecuring suitable locations for its stores. No store lease is individually material to Signet’s Sterling Jewelers, Zale Jewelry or Piercing Pagoda operations.
UK retail property
The UK Jewelry division’s stores are generally leased under full repairing and insuring leases (equivalent to triple net leases in the US). Wherever possible, Signetis shortening the length of new leases that it enters into, or including break clauses in order to improve the flexibility of its lease commitments. At January 28, 2017, the average unexpired lease term of UK Jewelry premises was 5 years, and a majority of leases had either break clauses or terms expiring within five years. Rentsare usually subject to upward review every five years if market conditions so warrant. An increasing proportion of rents also have an element related to the sales ofa store, subject to a minimum annual value.
At the end of the lease period, subject to certain limited exceptions, UK Jewelry leaseholders generally have statutory rights to enter into a new lease of thepremises on negotiated terms. As current leases expire, Signet believes that it will be able to renew leases, if desired, for present store locations or to obtain leasesin equivalent or improved locations in the same general area. Signet has not experienced difficulty in securing leases for suitable locations for its UK Jewelrystores. No store lease is individually material to Signet’s UK Jewelry operations.
A typical UK Jewelry store undergoes a major remodel every ten years and a less costly refurbishment every five years. It is intended that these investments will befinanced by cash from operating activities. The cost of remodeling a regular store is typically between £150,000 and £600,000 for both H.Samuel and Ernest Jones,while remodels in prestigious locations typically doubles those costs.
The UK Jewelry division has no relationship with any lessor relating to 10% or more of its store locations.
Other
The Company has entered into agreements to assign or sublease certain premises as of January 28, 2017 . See Note 25 of Item 8 for additional information.
ITEM 3. LEGAL PROCEEDINGS
See discussion of legal proceedings in Note 25 of Item 8.
ITEM 4. MINE SAFETY DISCLOSURE
Not applicable.
35
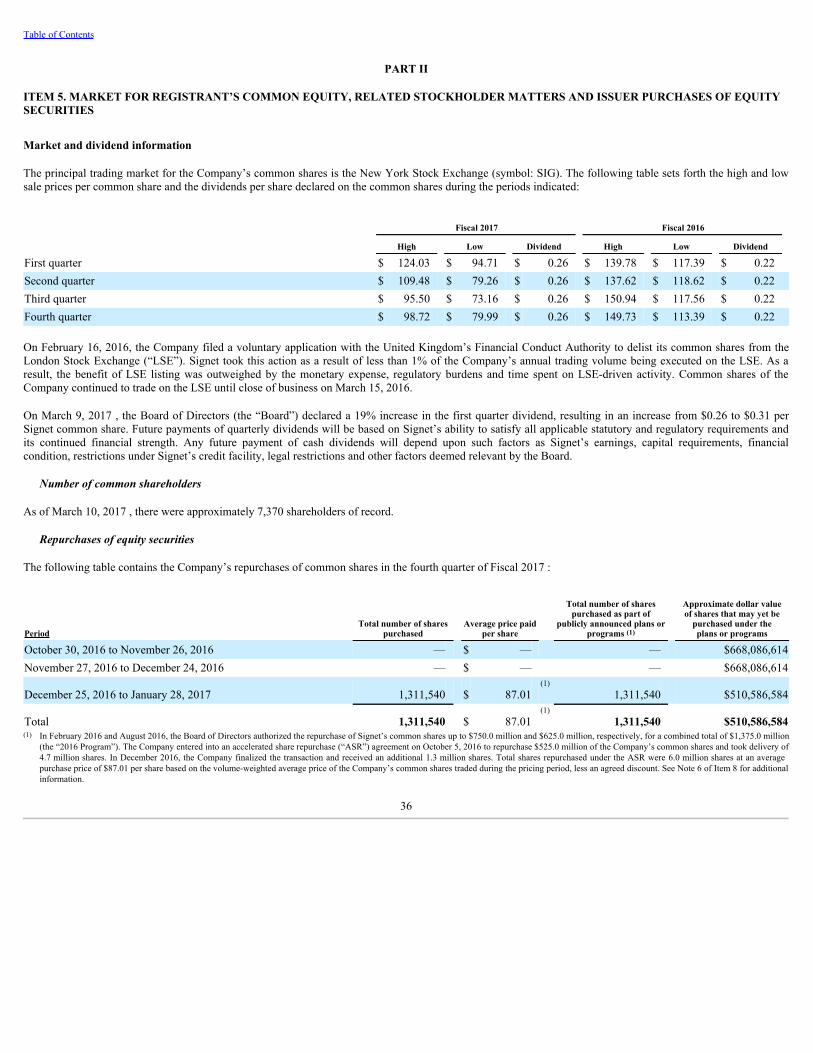
Table of Contents
PART II
ITEM 5. MARKET FOR REGISTRANT’S COMMON EQUITY, RELATED STOCKHOLDER MATTERS AND ISSUER PURCHASES OF EQUITYSECURITIES
Market and dividend information
The principal trading market for the Company’s common shares is the New York Stock Exchange (symbol: SIG). The following table sets forth the high and lowsale prices per common share and the dividends per share declared on the common shares during the periods indicated:
Fiscal 2017 Fiscal 2016 High Low Dividend High Low Dividend First quarter $ 124.03 $ 94.71 $ 0.26 $ 139.78 $ 117.39 $ 0.22 Second quarter $ 109.48 $ 79.26 $ 0.26 $ 137.62 $ 118.62 $ 0.22 Third quarter $ 95.50 $ 73.16 $ 0.26 $ 150.94 $ 117.56 $ 0.22 Fourth quarter $ 98.72 $ 79.99 $ 0.26 $ 149.73 $ 113.39 $ 0.22
On February 16, 2016, the Company filed a voluntary application with the United Kingdom’s Financial Conduct Authority to delist its common shares from theLondon Stock Exchange (“LSE”). Signet took this action as a result of less than 1% of the Company’s annual trading volume being executed on the LSE. As aresult, the benefit of LSE listing was outweighed by the monetary expense, regulatory burdens and time spent on LSE-driven activity. Common shares of theCompany continued to trade on the LSE until close of business on March 15, 2016.
On March 9, 2017 , the Board of Directors (the “Board”) declared a 19% increase in the first quarter dividend, resulting in an increase from $0.26 to $0.31 perSignet common share. Future payments of quarterly dividends will be based on Signet’s ability to satisfy all applicable statutory and regulatory requirements andits continued financial strength. Any future payment of cash dividends will depend upon such factors as Signet’s earnings, capital requirements, financialcondition, restrictions under Signet’s credit facility, legal restrictions and other factors deemed relevant by the Board.
Number of common shareholders
As of March 10, 2017 , there were approximately 7,370 shareholders of record.
Repurchases of equity securities
The following table contains the Company’s repurchases of common shares in the fourth quarter of Fiscal 2017 :
PeriodTotal number of shares
purchased Average price paid
per share
Total number of sharespurchased as part of
publicly announced plans orprograms (1)
Approximate dollar valueof shares that may yet be
purchased under theplans or programs
October 30, 2016 to November 26, 2016 — $ — — $668,086,614November 27, 2016 to December 24, 2016 — $ — — $668,086,614
December 25, 2016 to January 28, 2017 1,311,540 $ 87.01(1) 1,311,540 $510,586,584
Total 1,311,540 $ 87.01(1) 1,311,540 $510,586,584
(1) In February 2016 and August 2016, the Board of Directors authorized the repurchase of Signet’s common shares up to $750.0 million and $625.0 million, respectively, for a combined total of $1,375.0 million(the “2016 Program”). The Company entered into an accelerated share repurchase (“ASR”) agreement on October 5, 2016 to repurchase $525.0 million of the Company’s common shares and took delivery of4.7 million shares. In December 2016, the Company finalized the transaction and received an additional 1.3 million shares. Total shares repurchased under the ASR were 6.0 million shares at an averagepurchase price of $87.01 per share based on the volume-weighted average price of the Company’s common shares traded during the pricing period, less an agreed discount. See Note 6 of Item 8 for additionalinformation.
36
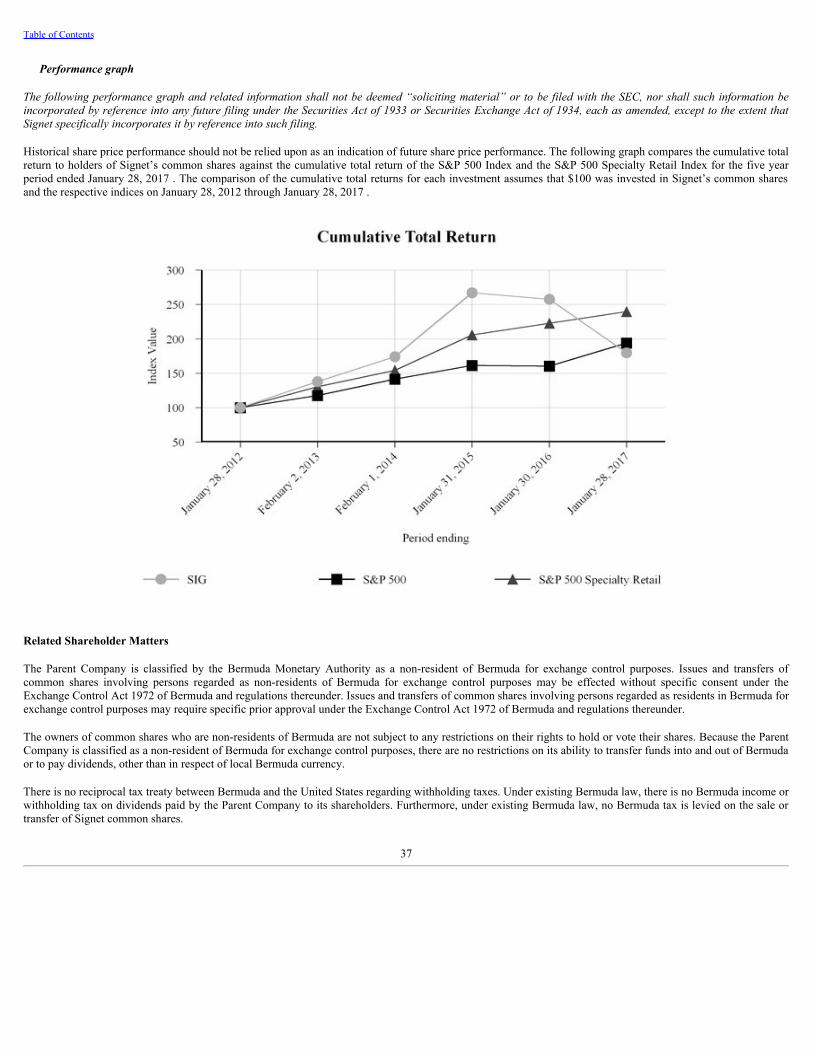
Table of Contents
Performance graph
The following performance graph and related information shall not be deemed “soliciting material” or to be filed with the SEC, nor shall such information beincorporated by reference into any future filing under the Securities Act of 1933 or Securities Exchange Act of 1934, each as amended, except to the extent thatSignet specifically incorporates it by reference into such filing.
Historical share price performance should not be relied upon as an indication of future share price performance. The following graph compares the cumulative totalreturn to holders of Signet’s common shares against the cumulative total return of the S&P 500 Index and the S&P 500 Specialty Retail Index for the five yearperiod ended January 28, 2017 . The comparison of the cumulative total returns for each investment assumes that $100 was invested in Signet’s common sharesand the respective indices on January 28, 2012 through January 28, 2017 .
Related Shareholder Matters
The Parent Company is classified by the Bermuda Monetary Authority as a non-resident of Bermuda for exchange control purposes. Issues and transfers ofcommon shares involving persons regarded as non-residents of Bermuda for exchange control purposes may be effected without specific consent under theExchange Control Act 1972 of Bermuda and regulations thereunder. Issues and transfers of common shares involving persons regarded as residents in Bermuda forexchange control purposes may require specific prior approval under the Exchange Control Act 1972 of Bermuda and regulations thereunder.
The owners of common shares who are non-residents of Bermuda are not subject to any restrictions on their rights to hold or vote their shares. Because the ParentCompany is classified as a non-resident of Bermuda for exchange control purposes, there are no restrictions on its ability to transfer funds into and out of Bermudaor to pay dividends, other than in respect of local Bermuda currency.
There is no reciprocal tax treaty between Bermuda and the United States regarding withholding taxes. Under existing Bermuda law, there is no Bermuda income orwithholding tax on dividends paid by the Parent Company to its shareholders. Furthermore, under existing Bermuda law, no Bermuda tax is levied on the sale ortransfer of Signet common shares.
37

Table of Contents
ITEM 6. SELECTED CONSOLIDATED FINANCIAL DATA
The financial data included below for Fiscal 2017 , Fiscal 2016 and Fiscal 2015 has been derived from the audited consolidated financial statements included inItem 8. The financial data for these periods should be read in conjunction with the financial statements, including the notes thereto, and Item 7. The financial dataincluded below for Fiscal 2014 and Fiscal 2013 has been derived from the previously published consolidated audited financial statements not included in thisdocument.
FINANCIAL DATA: Fiscal 2017 Fiscal 2016 Fiscal 2015 (1) Fiscal 2014 Fiscal 2013 (2) Income statement: (in millions) Sales $ 6,408.4 $ 6,550.2 $ 5,736.3 $ 4,209.2 $ 3,983.4 Gross margin $ 2,360.8 $ 2,440.4 $ 2,074.2 $ 1,580.5 $ 1,537.4 Selling, general and administrative expenses $ (1,880.2) $ (1,987.6) $ (1,712.9) $ (1,196.7) $ (1,138.3) Operating income $ 763.2 $ 703.7 $ 576.6 $ 570.5 $ 560.5 Net income attributable to common shareholders $ 531.3 $ 467.9 $ 381.3 $ 368.0 $ 359.9 Adjusted EBITDA (3) $ 955.0 $ 891.5 $ 762.9 $ 680.7 $ 659.9 Same store sales percentage (decrease) increase (1.9)% 4.1 % 4.1 % 4.4 % 3.3 %
(Income statement as a % of sales) Sales 100.0 % 100.0 % 100.0 % 100.0 % 100.0 % Gross margin 36.8 % 37.3 % 36.2 % 37.5 % 38.6 % Selling, general and administrative expenses (29.3)% (30.4)% (29.9)% (28.4)% (28.6)% Operating income 11.9 % (4) 10.7 % (4) 10.0 % (4) 13.5 % 14.1 % Net income attributable to common shareholders 8.3 % 7.1 % 6.6 % 8.7 % 9.0 % Adjusted EBITDA (3) 14.9 % 13.6 % 13.3 % 16.2 % 16.6 %
Per share data: Earnings per common share:
Basic $ 7.13 $ 5.89 $ 4.77 $ 4.59 $ 4.37 Diluted $ 7.08 $ 5.87 $ 4.75 $ 4.56 $ 4.35
Dividends declared per common share $ 1.04 $ 0.88 $ 0.72 $ 0.60 $ 0.48
Weighted average common shares outstanding: (in millions) Basic 74.5 79.5 79.9 80.2 82.3 Diluted 76.7 79.7 80.2 80.7 82.8
Balance sheet: (in millions) Total assets (5) $ 6,597.8 $ 6,464.9 $ 6,203.0 $ 3,916.1 $ 3,616.5 Total liabilities (5) $ 3,495.7 $ 3,404.2 $ 3,392.6 $ 1,353.0 $ 1,286.6 Series A redeemable convertible preferred shares $ 611.9 n/a n/a n/a n/a Net (debt) cash (3) $ (1,310.3) $ (1,241.0) $ (1,256.4) $ 228.3 $ 301.0 Working capital $ 3,438.9 $ 3,437.0 $ 3,210.3 $ 2,467.0 $ 2,292.2 Common shares outstanding 68.3 79.4 80.3 80.2 81.4 (1) On May 29, 2014, the Company completed the acquisition of Zale Corporation. Fiscal 2015 results include Zale Corporation’s results since the date of acquisition. See Note 3 of Item 8 for additional
information.(2) Fiscal 2013 was a 53 week period. The 53 rd week added $56.4 million in net sales and decreased diluted earnings per share by approximately $0.02 for the fiscal period.(3) Adjusted EBITDA and net (debt) cash are non-GAAP measures; see “GAAP and non-GAAP Measures” below.(4) The acquisition of Zale in May 2014, with operating margins lower than that of Signet, caused an overall lower operating margin for Signet.(5) Results reclassified in accordance with Signet’s adoption of Accounting Standards Update 2015-03, which requires debt issuance costs to be presented on the balance sheet as a direct deduction from the debt
liability. See Note 2 of Item 8 for additional information.n/a Not applicable as Series A redeemable convertible preferred shares were issued in October 2016.
38

Table of Contents
Fiscal 2017 Fiscal 2016 Fiscal 2015 (1) Fiscal 2014 Fiscal 2013 Other financial data: Free cash flow (in millions) (2) $ 400.3 $ 216.8 $ 62.8 $ 82.8 $ 178.5 Effective tax rate 23.9% 28.9% 29.5% 35.0% 35.4% ROCE (2) 21.4% 21.0% 19.5% 25.2% 28.1% Adjusted leverage ratio (2) 3.6x 3.3x 3.5x 1.8x 1.8x
Store and employee data: Store locations (at end of period) 3,682 3,625 3,579 1,964 1,954 Number of employees (full-time equivalents) 29,566 (3) 29,057 (3) 28,949 (3) 18,179 (3) 17,877
(1) On May 29, 2014, the Company completed the acquisition of Zale Corporation. Fiscal 2015 includes Zale Corporation’s results since the date of acquisition. See Note 3 of Item 8 for additional information.(2) Free cash flow, ROCE and adjusted leverage ratio are non-GAAP measures; see “GAAP and non-GAAP Measures” below.(3)
Number of employees includes 163 , 194, 226 and 211 full-time equivalents employed in the diamond polishing plant located in Botswana for Fiscal 2017, Fiscal 2016, Fiscal 2015, and Fiscal 2014,respectively.
GAAP AND NON-GAAP MEASURES
The discussion and analysis of Signet’s results of operations, financial condition and liquidity contained in this Annual Report on Form 10-K are based upon theconsolidated financial statements of Signet which are prepared in accordance with US GAAP and should be read in conjunction with Signet’s financial statementsand the related notes included in Item 8. A number of non-GAAP measures are used by management to analyze and manage the performance of the business, andthe required disclosures for these non-GAAP measures are shown below. In particular, the terms “at constant exchange rates,” “underlying” and “underlying atconstant exchange rates” are used in a number of places. “At constant exchange rates” is used to indicate where items have been adjusted to eliminate the impact ofexchange rate movements on translation of British pound and Canadian dollar amounts to US dollars. “Underlying” is used to indicate where adjustments forsignificant, unusual and non-recurring items have been made and “underlying at constant exchange rates” indicates where the underlying items have been furtheradjusted to eliminate the impact of exchange rate movements on translation of British pound and Canadian dollar amounts to US dollars.
Signet provides such non-GAAP information in reporting its financial results to give investors additional data to evaluate its operations. Management does not, nordoes it suggest investors should, consider such non-GAAP measures in isolation from, or in substitution for, financial information prepared in accordance withGAAP.
1. Income Statements at Constant Exchange Rates
Movements in the British pound and Canadian dollar to US dollar exchange rates have an impact on Signet’s results. The UK Jewelry division is managed inBritish pounds and the Canadian reporting unit of the Zale Jewelry segment in Canadian dollars as sales and a majority of operating expenses are incurred in thoseforeign currencies. The results for each are then translated into US dollars for external reporting purposes. Management believes it assists in understanding theperformance of Signet and its segments if constant currency figures are given. This is particularly so in periods when exchange rates are volatile. The constantcurrency amounts are calculated by retranslating the prior year figures using the current year’s exchange rate. Management considers it useful to exclude theimpact of movements in the British pound and Canadian dollar to US dollar exchange rates to analyze and explain changes and trends in Signet’s underlyingbusiness, which is consistent with the manner in which management evaluates performance of its businesses which do not operate using the US dollar as theirfunctional currency. Additionally, in connection with management’s evaluation of its attainment of performance goals, currency effects are excluded.
39

Table of Contents
(a) Fiscal 2017 percentage change in results at constant exchange rates
(in millions, except per share amounts) Fiscal 2017 Fiscal 2016 Change % Impact of
exchange ratemovement
Fiscal 2016at constant
exchange rates(non-GAAP)
Change % fromFiscal 2016
at constant exchangerates (non-GAAP)
Sales by segment: Sterling Jewelers $ 3,930.4 $ 3,988.7 (1.5)% $ — $ 3,988.7 (1.5)%Zale Jewelry 1,549.7 1,568.2 (1.2)% (3.0) 1,565.2 (1.0)%Piercing Pagoda 263.1 243.2 8.2 % — 243.2 8.2 %UK Jewelry 647.1 737.6 (12.3)% (96.4) 641.2 0.9 %Other 18.1 12.5 44.8 % — 12.5 44.8 %
Total sales 6,408.4 6,550.2 (2.2)% (99.4) 6,450.8 (0.7)%Cost of sales (4,047.6) (4,109.8) 1.5 % 67.2 (4,042.6) (0.1)%
Gross margin 2,360.8 2,440.4 (3.3)% (32.2) 2,408.2 (2.0)%Selling, general and administrative expenses (1,880.2) (1,987.6) 5.4 % 23.1 (1,964.5) 4.3 %Other operating income, net 282.6 250.9 12.6 % — 250.9 12.6 %
Operating income (loss) by segment: Sterling Jewelers 715.8 718.6 (0.4)% — 718.6 (0.4)%Zale Jewelry (1) 62.2 44.3 40.4 % 0.4 44.7 39.1 %Piercing Pagoda (2) 11.2 7.8 43.6 % — 7.8 43.6 %UK Jewelry 45.6 61.5 (25.9)% (10.2) 51.3 (11.1)%Other (3) (71.6) (128.5) 44.3 % 0.7 (127.8) 44.0 %
Total operating income 763.2 703.7 8.5 % (9.1) 694.6 9.9 %Interest expense, net (49.4) (45.9) (7.6)% — (45.9) (7.6)%
Income before income taxes 713.8 657.8 8.5 % (9.1) 648.7 10.0 %Income taxes (170.6) (189.9) 10.2 % 1.8 (188.1) 9.3 %
Net income 543.2 467.9 16.1 % (7.3) 460.6 17.9 %Dividends on redeemable convertible preferred shares (11.9) — nm — — nm
Net income attributable to common shareholders $ 531.3 $ 467.9 13.5 % $ (7.3) $ 460.6 15.3 %Basic earnings per share $ 7.13 $ 5.89 21.1 % $ (0.10) $ 5.79 23.1 %Diluted earnings per share $ 7.08 $ 5.87 20.6 % $ (0.09) $ 5.78 22.5 %(1) Zale Jewelry includes net operating loss impact of $16.4 million and $23.1 million for purchase accounting adjustments in Fiscal 2017 and Fiscal 2016 , respectively.(2) Piercing Pagoda includes net operating loss impact of $0.4 million and $3.3 million for purchase accounting adjustments in Fiscal 2017 and Fiscal 2016 , respectively.(3) Other includes $28.4 million in Fiscal 2017 of integration costs for consulting expenses associated with information technology (“IT”) implementations, severance related to organizational changes and and
expenses associated with the settlement of miscellaneous legal matters pending as of the date of the Zale acquisition. Other includes $78.9 million in Fiscal 2016 of transaction and integration costs primarilyattributable to the legal settlement of $34.2 million over appraisal rights, expenses associated with legal, tax, accounting, IT implementations and consulting services, as well as severance costs.
nm Not meaningful.
40

Table of Contents
(b) Fourth quarter Fiscal 2017 percentage change in results at constant exchange rates
(in millions, except per share amounts)
13 weeks ended
January 28, 2017
13 weeks ended
January 30, 2016 Change %
Impact of exchange
rate movement
13 weeks ended January 30,
2016 at constant
exchange rates (non-GAAP)
Change % from 13weeks ended January 30,
2016 at constant
exchange rates (non-GAAP)
Sales by segment: Sterling Jewelers $ 1,398.1 $ 1,452.5 (3.7)% $ — $ 1,452.5 (3.7)%Zale Jewelry 554.9 577.0 (3.8)% 2.1 579.1 (4.2)%Piercing Pagoda 83.7 78.1 7.2 % — 78.1 7.2 %UK Jewelry 227.6 282.6 (19.5)% (47.2) 235.4 (3.3)%Other 5.6 2.4 133.3 % — 2.4 133.3 %
Total sales 2,269.9 2,392.6 (5.1)% (45.1) 2,347.5 (3.3)%Cost of sales (1,324.4) (1,376.6) 3.8 % 27.2 (1,349.4) 1.9 %
Gross margin 945.5 1,016.0 (6.9)% (17.9) 998.1 (5.3)%Selling, general and administrative expenses (615.3) (686.6) 10.4 % 8.9 (677.7) 9.2 %Other operating income, net 69.0 63.7 8.3 % — 63.7 8.3 %
Operating income (loss) by segment: Sterling Jewelers 298.0 305.4 (2.4)% — 305.4 (2.4)%Zale Jewelry (1) 62.7 54.2 15.7 % 0.3 54.5 15.0 %Piercing Pagoda (2) 9.0 8.8 2.3 % — 8.8 2.3 %UK Jewelry 42.6 57.8 (26.3)% (9.6) 48.2 (11.6)%Other (3) (13.1) (33.1) 60.4 % 0.3 (32.8) 60.1 %
Total operating income 399.2 393.1 1.6 % (9.0) 384.1 3.9 %Interest expense, net (13.0) (12.1) (7.4)% — (12.1) (7.4)%
Income before income taxes 386.2 381.0 1.4 % (9.0) 372.0 3.8 %Income taxes (88.7) (109.1) 18.7 % 1.8 (107.3) 17.3 %
Net income 297.5 271.9 9.4 % (7.2) 264.7 12.4 %Dividends on redeemable convertible preferred shares (9.7) — nm — — nm
Net income attributable to common shareholders $ 287.8 $ 271.9 5.8 % $ (7.2) $ 264.7 8.7 %Basic earnings per share $ 4.17 $ 3.43 21.6 % $ (0.09) $ 3.34 24.9 %Diluted earnings per share $ 3.92 $ 3.42 14.6 % $ (0.09) $ 3.33 17.7 %(1) Zale Jewelry includes net operating loss impact of $3.2 million and $6.0 million for purchase accounting adjustments in Fiscal 2017 and Fiscal 2016 , respectively.(2) Piercing Pagoda includes net operating loss impact of $0.1 million and $0.2 million for purchase accounting adjustments in Fiscal 2017 and Fiscal 2016 , respectively.(3) Other includes $9.9 million for the 13 weeks ended January 28, 2017 of integration costs for consulting expenses associated with IT implementations, severance related to organizational changes and expenses
associated with the settlement of miscellaneous legal matters pending as of the date of the Zale acquisition. Other includes $19.1 million for the 13 weeks ended January 30, 2016 of transaction and integrationcosts primarily attributed to expenses associated with legal, tax, accounting, IT implementations and consulting services, as well as severance costs.
nm Not meaningful.
41

Table of Contents
(c) Fiscal 2016 percentage change in results at constant exchange rates
(in millions, except per share amounts) Fiscal 2016 Fiscal 2015 Change %
Impact of exchange
rate movement
Fiscal 2015 at constant
exchange rates (non-GAAP)
Change % from Fiscal2015
at constant exchange rates
(non-GAAP)
Sales by segment: Sterling Jewelers $ 3,988.7 $ 3,765.0 5.9 % $ — $ 3,765.0 5.9 %Zale Jewelry 1,568.2 1,068.7 46.7 % (31.7) 1,037.0 51.2 %Piercing Pagoda 243.2 146.9 65.6 % — 146.9 65.6 %UK Jewelry 737.6 743.6 (0.8)% (47.3) 696.3 5.9 %Other 12.5 12.1 3.3 % — 12.1 3.3 %
Total sales 6,550.2 5,736.3 14.2 % (79.0) 5,657.3 15.8 %Cost of sales (4,109.8) (3,662.1) (12.2)% 56.2 (3,605.9) (14.0)%
Gross margin 2,440.4 2,074.2 17.7 % (22.8) 2,051.4 19.0 %Selling, general and administrative expenses (1,987.6) (1,712.9) (16.0)% 21.2 (1,691.7) (17.5)%Other operating income, net 250.9 215.3 16.5 % 0.2 215.5 16.4 %
Operating income (loss) by segment: Sterling Jewelers 718.6 624.3 15.1 % — 624.3 15.1 %Zale Jewelry (1) 44.3 (1.9) 0.3 (1.6) nmPiercing Pagoda (2) 7.8 (6.3) nm — (6.3) nmUK Jewelry 61.5 52.2 17.8 % (2.0) 50.2 22.5 %Other (3) (128.5) (91.7) (40.1)% 0.3 (91.4) (40.6)%
Total operating income 703.7 576.6 22.0 % (1.4) 575.2 22.3 %Interest expense, net (45.9) (36.0) (27.5)% — (36.0) (27.5)%
Income before income taxes 657.8 540.6 21.7 % (1.4) 539.2 22.0 %Income taxes (189.9) (159.3) (19.2)% 0.1 (159.2) (19.3)%
Net income $ 467.9 $ 381.3 22.7 % (1.3) 380.0 23.1 %Basic earnings per share $ 5.89 $ 4.77 23.5 % $ (0.01) $ 4.76 23.7 %Diluted earnings per share $ 5.87 $ 4.75 23.6 % $ (0.01) $ 4.74 23.8 %
(1) Zale Jewelry includes net operating loss impact of $23.1 million and $35.1 million for purchase accounting adjustments in Fiscal 2016 and Fiscal 2015, respectively.(2) Piercing Pagoda includes net operating loss impact of $3.3 million and $10.8 million for purchase accounting adjustments in Fiscal 2016 and Fiscal 2015, respectively.(3) Other includes $78.9 million and $59.8 million of transaction and integration expenses in Fiscal 2016 and Fiscal 2015, respectively. Transaction and integration costs include expenses associated with advisor
fees for legal, tax, accounting, IT implementations and consulting, severance and the legal settlement of $34.2 million over appraisal rights in Fiscal 2016.nm Not meaningful.
42

Table of Contents
(d) Fourth quarter Fiscal 2016 percentage change in results at constant exchange rates
(in millions, except per share amounts)
13 weeks ended January 30,
2016 13 weeks ended
January 31, 2015 Change %
Impact of exchange
rate movement
13 weeks ended January 31,
2015 at constant
exchange rates (non-GAAP)
Change % from 13weeks ended January 31,
2015 at constant
exchange rates (non-GAAP)
Sales by segment: Sterling Jewelers $ 1,452.5 $ 1,358.3 6.9 % $ — $ 1,358.3 6.9 %Zale Jewelry 577.0 564.6 2.2 % (16.3) 548.3 5.2 %Piercing Pagoda 78.1 72.1 8.3 % — 72.1 8.3 %UK Jewelry 282.6 278.0 1.7 % (11.1) 266.9 5.9 %Other 2.4 3.4 (29.4)% — 3.4 (29.4)%
Total sales 2,392.6 2,276.4 5.1 % (27.4) 2,249.0 6.4 %Cost of sales (1,376.6) (1,364.3) (0.9)% 18.0 (1,346.3) (2.3)%
Gross margin 1,016.0 912.1 11.4 % (9.4) 902.7 12.6 %Selling, general and administrative expenses (686.6) (634.5) (8.2)% 7.7 (626.8) (9.5)%Other operating income, net 63.7 54.1 17.7 % 0.2 54.3 17.3 %
Operating income (loss) by segment: Sterling Jewelers 305.4 260.0 17.5 % — 260.0 17.5 %Zale Jewelry (1) 54.2 32.8 65.2 % 0.4 33.2 63.3 %Piercing Pagoda (2) 8.8 3.3 166.7 % — 3.3 166.7 %UK Jewelry 57.8 53.8 7.4 % (2.0) 51.8 11.6 %Other (3) (33.1) (18.2) (81.9)% 0.1 (18.1) (82.9)%
Total operating income 393.1 331.7 18.5 % (1.5) 330.2 19.0 %Interest expense, net (12.1) (7.9) (53.2)% (0.1) (8.0) (51.3)%
Income before income taxes 381.0 323.8 17.7 % (1.6) 322.2 18.2 %Income taxes (109.1) (95.8) (13.9)% 0.2 (95.6) (14.1)%
Net income $ 271.9 $ 228.0 19.3 % $ (1.4) $ 226.6 20.0 %Basic earnings per share $ 3.43 $ 2.85 20.4 % $ (0.01) $ 2.84 20.8 %Diluted earnings per share $ 3.42 $ 2.84 20.4 % $ (0.01) $ 2.83 20.8 %
(1) Zale Jewelry includes net operating loss impact of $6.0 million and $14.7 million for purchase accounting adjustments in Fiscal 2016 and Fiscal 2015, respectively.(2) Piercing Pagoda includes net operating loss impact of $0.2 million and $6.1 million for purchase accounting adjustments in Fiscal 2016 and Fiscal 2015, respectively.(3) Other includes $19.1 million and $9.2 million of transaction and integration expenses in Fiscal 2016 and Fiscal 2015, respectively, which are primarily attributable to advisor fees for legal, tax, accounting, IT
implementations and consulting services, as well as severance costs.
2. Operating data reflecting the impact of material acquisitions and acquisition-related costs
The below table reflects the impact of costs associated with the acquisition of Zale Corporation (the “Acquisition”), along with certain other accountingadjustments made. Management finds the information useful to analyze the results of the business excluding these items in order to appropriately evaluate theperformance of the business without the impact of significant and unusual items. Management views acquisition-related impacts as events that are not necessarilyreflective of operational performance during a period. In particular, management believes the consideration of measures that exclude such expenses can assist inthe comparison of operational performance in different periods which may or may not include such expenses.
43

Table of Contents
(a) Fiscal 2017 operating data reflecting the impact of integration costs and accounting adjustments
(in millions, except per share amount and % of sales)Signet consolidated,
as reported Accounting
adjustments (1) Integration
costs (2) Adjusted Signet
Sales $ 6,408.4 100.0 % $ (13.3) $ — $ 6,421.7 100.0 %Cost of sales (4,047.6) (63.2)% 2.0 — (4,049.6) (63.1)%
Gross margin 2,360.8 36.8 % (11.3) — 2,372.1 36.9 %Selling, general and administrative expenses (1,880.2) (29.3)% (5.5) (28.4) (1,846.3) (28.7)%Other operating income, net 282.6 4.4 % — — 282.6 4.4 %
Operating income 763.2 11.9 % (16.8) (28.4) 808.4 12.6 %Interest expense, net (49.4) (0.8)% — — (49.4) (0.8)%
Income before income taxes 713.8 11.1 % (16.8) (28.4) 759.0 11.8 %Income taxes (170.6) (2.6)% 6.2 10.8 (187.6) (2.9)%
Net income $ 543.2 8.5 % $ (10.6) $ (17.6) $ 571.4 8.9 %Dividends on redeemable convertible preferred shares (11.9) nm — — (11.9) nm
Net income attributable to common shareholders $ 531.3 8.3 % $ (10.6) $ (17.6) $ 559.5 8.7 %Earnings per share - diluted $ 7.08 $ (0.14) $ (0.23) $ 7.45 (1) Includes the impact of all acquisition adjustments recognized in conjunction with the Acquisition in Fiscal 2015.(2) Integration costs are consulting expenses associated with IT implementations, severance related to organizational changes and expenses associated with the settlement of miscellaneous legal matters pending
as of the date of the Zale acquisition. These costs are included within Signet’s Other segment.
(b) Fourth quarter Fiscal 2017 operating data reflecting the impact of integration costs and accounting adjustments
(in millions, except per share amount and % of sales)Signet consolidated,
as reported Accounting
adjustments (1) Integration
costs (2) Adjusted Signet
Sales $ 2,269.9 100.0 % $ (2.6) $ — $ 2,272.5 100.0 %Cost of sales (1,324.4) (58.3)% 0.9 — (1,325.3) (58.3)%
Gross margin 945.5 41.7 % (1.7) — 947.2 41.7 %Selling, general and administrative expenses (615.3) (27.1)% (1.6) (9.9) (603.8) (26.6)%Other operating income, net 69.0 3.0 % — — 69.0 3.0 %
Operating income 399.2 17.6 % (3.3) (9.9) 412.4 18.1 %Interest expense, net (13.0) (0.6)% — — (13.0) (0.5)%
Income before income taxes 386.2 17.0 % (3.3) (9.9) 399.4 17.6 %Income taxes (88.7) (3.9)% 1.1 3.8 (93.6) (4.1)%
Net income $ 297.5 13.1 % $ (2.2) $ (6.1) $ 305.8 13.5 %Dividends on redeemable convertible preferred shares (9.7) nm — — (9.7) nm
Net income attributable to common shareholders $ 287.8 12.7 % $ (2.2) $ (6.1) $ 296.1 13.0 %Earnings per share - diluted $ 3.92 $ (0.03) $ (0.08) $ 4.03
(1) Includes the impact of all acquisition adjustments recognized in conjunction with the Acquisition in Fiscal 2015.(2) Integration costs include consulting expenses associated with IT implementations, severance related to organizational changes and expenses associated with the settlement of miscellaneous legal matters
pending as of the date of the Zale acquisition. These costs are included within Signet’s Other segment.
44
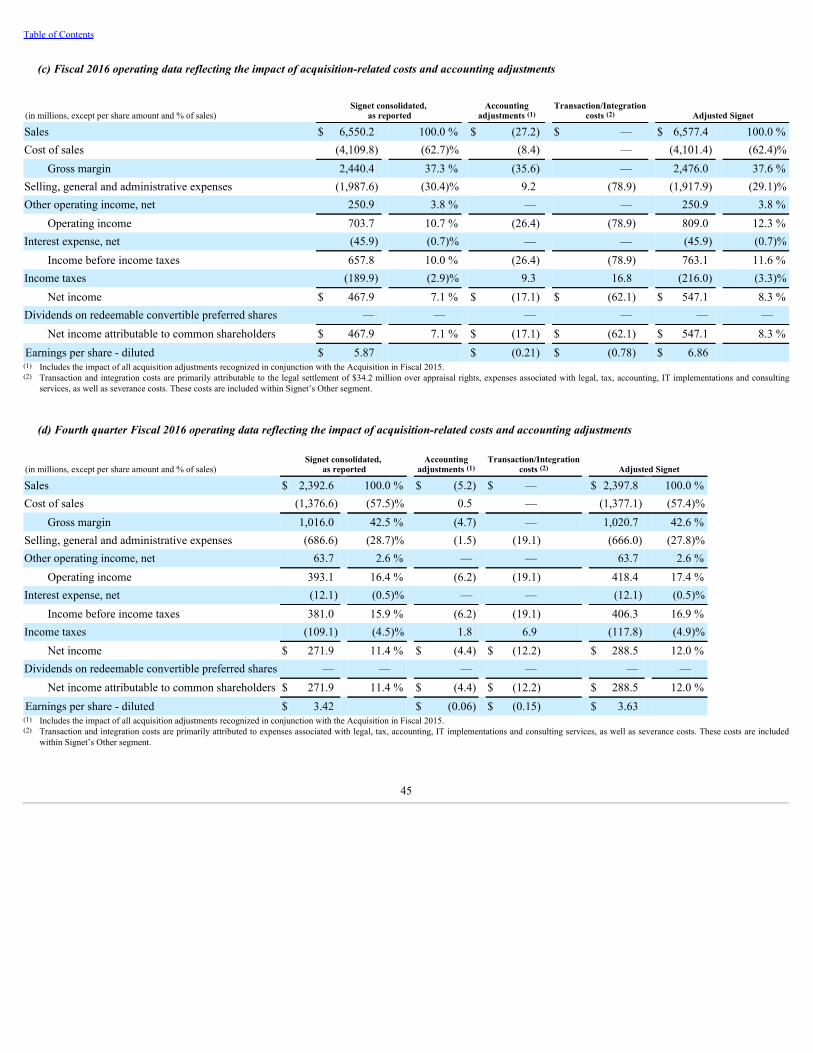
Table of Contents
(c) Fiscal 2016 operating data reflecting the impact of acquisition-related costs and accounting adjustments
(in millions, except per share amount and % of sales)Signet consolidated,
as reported Accounting
adjustments (1) Transaction/Integration
costs (2) Adjusted Signet
Sales $ 6,550.2 100.0 % $ (27.2) $ — $ 6,577.4 100.0 %Cost of sales (4,109.8) (62.7)% (8.4) — (4,101.4) (62.4)%
Gross margin 2,440.4 37.3 % (35.6) — 2,476.0 37.6 %Selling, general and administrative expenses (1,987.6) (30.4)% 9.2 (78.9) (1,917.9) (29.1)%Other operating income, net 250.9 3.8 % — — 250.9 3.8 %
Operating income 703.7 10.7 % (26.4) (78.9) 809.0 12.3 %Interest expense, net (45.9) (0.7)% — — (45.9) (0.7)%
Income before income taxes 657.8 10.0 % (26.4) (78.9) 763.1 11.6 %Income taxes (189.9) (2.9)% 9.3 16.8 (216.0) (3.3)%
Net income $ 467.9 7.1 % $ (17.1) $ (62.1) $ 547.1 8.3 %Dividends on redeemable convertible preferred shares — — — — — —
Net income attributable to common shareholders $ 467.9 7.1 % $ (17.1) $ (62.1) $ 547.1 8.3 %Earnings per share - diluted $ 5.87 $ (0.21) $ (0.78) $ 6.86
(1) Includes the impact of all acquisition adjustments recognized in conjunction with the Acquisition in Fiscal 2015.(2) Transaction and integration costs are primarily attributable to the legal settlement of $34.2 million over appraisal rights, expenses associated with legal, tax, accounting, IT implementations and consulting
services, as well as severance costs. These costs are included within Signet’s Other segment.
(d) Fourth quarter Fiscal 2016 operating data reflecting the impact of acquisition-related costs and accounting adjustments
(in millions, except per share amount and % of sales)Signet consolidated,
as reported Accounting
adjustments (1) Transaction/Integration
costs (2) Adjusted Signet
Sales $ 2,392.6 100.0 % $ (5.2) $ — $ 2,397.8 100.0 %Cost of sales (1,376.6) (57.5)% 0.5 — (1,377.1) (57.4)%
Gross margin 1,016.0 42.5 % (4.7) — 1,020.7 42.6 %Selling, general and administrative expenses (686.6) (28.7)% (1.5) (19.1) (666.0) (27.8)%Other operating income, net 63.7 2.6 % — — 63.7 2.6 %
Operating income 393.1 16.4 % (6.2) (19.1) 418.4 17.4 %Interest expense, net (12.1) (0.5)% — — (12.1) (0.5)%
Income before income taxes 381.0 15.9 % (6.2) (19.1) 406.3 16.9 %Income taxes (109.1) (4.5)% 1.8 6.9 (117.8) (4.9)%
Net income $ 271.9 11.4 % $ (4.4) $ (12.2) $ 288.5 12.0 %Dividends on redeemable convertible preferred shares — — — — — —
Net income attributable to common shareholders $ 271.9 11.4 % $ (4.4) $ (12.2) $ 288.5 12.0 %Earnings per share - diluted $ 3.42 $ (0.06) $ (0.15) $ 3.63
(1) Includes the impact of all acquisition adjustments recognized in conjunction with the Acquisition in Fiscal 2015.(2) Transaction and integration costs are primarily attributed to expenses associated with legal, tax, accounting, IT implementations and consulting services, as well as severance costs. These costs are included
within Signet’s Other segment.
45

Table of Contents
3. Net Debt
Net debt is a non-GAAP measure defined as the total of cash and cash equivalents less loans, overdrafts and long-term debt. Management considers this metric tobe helpful in understanding the total indebtedness of the Company after consideration of liquidity available from cash balances on-hand.
(in millions)January 28,
2017 January 30,
2016 January 31,
2015
Cash and cash equivalents $ 98.7 $ 137.7 $ 193.6Loans and overdrafts (91.1) (57.7) (95.7)Long-term debt (1,317.9) (1,321.0) (1,354.3)
Net debt $ (1,310.3) $ (1,241.0) $ (1,256.4)
4. Return on Capital Employed Excluding Goodwill (“ROCE”)
ROCE is a non-GAAP measure calculated by dividing the 52 week annual operating income by the average quarterly capital employed and is expressed as apercentage. Capital employed includes accounts and other receivables, inventories, property, plant and equipment, other assets, accounts payable, accrued expensesand other current liabilities, other liabilities, deferred revenue and retirement benefit asset/obligation. This is a key performance indicator used by management forassessing the effective operation of the business and is considered a useful disclosure for investors as it provides a measure of the return on Signet’s operatingassets. Further, this metric is utilized in evaluating management performance and incorporated into management’s long-term incentive plan metrics.
Fiscal 2017 Fiscal 2016 Fiscal 2015 Fiscal 2014 Fiscal 2013
ROCE 21.4% 21.0% 19.5% 25.2% 28.1%
5. Free Cash Flow
Free cash flow is a non-GAAP measure defined as the net cash provided by operating activities less purchases of property, plant and equipment. Managementconsiders that this is helpful in understanding how the business is generating cash from its operating and investing activities that can be used to meet the financingneeds of the business. Free cash flow is an indicator used by management frequently in evaluating its overall liquidity and determining appropriate capitalallocation strategies. Free cash flow does not represent the residual cash flow available for discretionary expenditure.
(in millions) Fiscal 2017 Fiscal 2016 Fiscal 2015
Net cash provided by operating activities $ 678.3 $ 443.3 $ 283.0Purchase of property, plant and equipment (278.0) (226.5) (220.2)
Free cash flow $ 400.3 $ 216.8 $ 62.8
46

Table of Contents
6. Leverage Ratio
The leverage ratio is a non-GAAP measure calculated by dividing Signet’s adjusted debt by adjusted EBITDAR. Adjusted debt is a non-GAAP measure defined asdebt recorded in the consolidated balance sheet, plus Series A redeemable convertible preferred shares, plus an adjustment for operating leases (8x annual rentexpense), less 70% of outstanding in-house finance receivables recorded in the consolidated balance sheet. Adjusted EBITDAR is a non-GAAP measure. AdjustedEBITDAR is defined as earnings before interest and income taxes (operating income), depreciation and amortization, and non-cash acquisition-related accountingadjustments (“Adjusted EBITDA”) and further excludes rent expense for properties occupied under operating leases, non-cash share-based compensation expenseand the income statement impact of the finance receivables related to the in-house credit program. Adjusted EBITDA and Adjusted EBITDAR are consideredimportant indicators of operating performance as they exclude the effects of financing and investing activities by eliminating the effects of interest, depreciationand amortization costs and accounting adjustments. Management believes these financial measures are helpful to enhancing investors’ ability to analyze trends inSignet’s business and evaluate Signet’s performance relative to other companies. Management also utilizes these metrics to evaluate its current credit profile,which is similar to rating agency methodologies.
(in millions) Fiscal 2017 Fiscal 2016 Fiscal 2015 Fiscal 2014 Fiscal 2013
Adjusted debt: Long-term debt $ 1,317.9 $ 1,321.0 $ 1,354.3 $ — $ —Loans and overdrafts 91.1 57.7 95.7 19.3 —Series A redeemable convertible preferred shares (1)(4) 611.9 n/a n/a n/a n/aAdjustments:
8x rent expense 4,195.2 4,205.6 3,703.2 2,589.6 2,528.070% of in-house credit program financing receivables (1,269.3) (1,208.2) (1,087.0) (949.2) (835.0)
Adjusted debt $ 4,946.8 $ 4,376.1 $ 4,066.2 $ 1,659.7 $ 1,693.0
Adjusted EBITDAR: Operating income $ 763.2 $ 703.7 $ 576.6 $ 570.5 $ 560.5Depreciation and amortization on property, plant and equipment (2) 175.0 161.4 140.4 110.2 99.4Amortization of definite-lived intangibles (2)(3) 13.8 13.9 9.3 — —Amortization of unfavorable leases and contracts (3) (19.7) (28.7) (23.7) — —Other non-cash accounting adjustments (3) 22.7 41.2 60.3 — —
Adjusted EBITDA $ 955.0 $ 891.5 $ 762.9 $ 680.7 $ 659.9Rent expense 524.4 525.7 462.9 323.7 316.0Share-based compensation expense 8.0 16.4 12.1 14.4 15.7Finance income from in-house credit program (277.6) (252.5) (217.9) (186.4) (159.7)Late charge income (4) (36.0) (33.9) (31.3) (29.4) (27.5)Net bad debt expense (4) 212.1 190.5 160.0 138.3 122.4
Adjusted EBITDAR $ 1,385.9 $ 1,337.7 $ 1,148.7 $ 941.3 $ 926.8 Adjusted Leverage ratio 3.6x 3.3x 3.5x 1.8x 1.8x(1) Series A redeemable convertible preferred shares were issued in October 2016.(2) Total amount of depreciation and amortization reflected on the consolidated statement of cash flows for Fiscal 2017 , Fiscal 2016 and Fiscal 2015 equals $188.8 million , $175.3 million and $149.7 million ,
respectively, which includes $13.8 million , $13.9 million and $9.3 million , respectively, related to the amortization of definite-lived intangibles, primarily favorable leases and trade names.(3) Total net operating loss relating to Acquisition accounting adjustments is $16.8 million , $26.4 million and $45.9 million for Fiscal 2017 , Fiscal 2016 and Fiscal 2015 , respectively, as reflected in the non-
GAAP tables above.(4) Adjusted debt and adjusted EBITDA have been recalculated to align with methodologies commonly utilized by credit rating agencies and others in evaluating leverage.n/a Not applicable.
47

Table of Contents
ITEM 7. MANAGEMENT’S DISCUSSION AND ANALYSIS OF FINANCIAL CONDITION AND RESULTS OF OPERATIONS
FORWARD-LOOKING STATEMENTS
This Annual Report on Form 10-K contains statements which are forward-looking statements within the meaning of the Private Securities Litigation Reform Act of1995. These statements, based upon management’s beliefs and expectations as well as on assumptions made by and data currently available to management, appearin a number of places throughout this Annual Report on Form 10-K and include statements regarding, among other things, Signet’s results of operation, financialcondition, liquidity, prospects, growth, strategies and the industry in which Signet operates. The use of the words “expects,” “intends,” “anticipates,” “estimates,”“predicts,” “believes,” “should,” “potential,” “may,” “forecast,” “objective,” “plan,” or “target,” and other similar expressions are intended to identify forward-looking statements. These forward-looking statements are not guarantees of future performance and are subject to a number of risks and uncertainties, includingbut not limited to general economic conditions, regulatory changes following the United Kingdom’s announcement to exit from the European Union, a decline inconsumer spending, the merchandising, pricing and inventory policies followed by Signet, the reputation of Signet and its brands, the level of competition in thejewelry sector, the cost and availability of diamonds, gold and other precious metals, regulations relating to customer credit, seasonality of Signet’s business,financial market risks, deterioration in customers’ financial condition, exchange rate fluctuations, changes in Signet’s credit rating, changes in consumer attitudesregarding jewelry, management of social, ethical and environmental risks, the development and maintenance of Signet’s omni-channel retailing, security breachesand other disruptions to Signet’s information technology infrastructure and databases, inadequacy in and disruptions to internal controls and systems, changes inassumptions used in making accounting estimates relating to items such as extended service plans and pensions, risks related to Signet being a Bermudacorporation, the impact of the acquisition of Zale Corporation on relationships, including with employees, suppliers, customers and competitors, an adversedecision in legal proceedings, and our ability to successfully integrate Zale Corporation’s operations and to realize synergies from the transaction.
For a discussion of these risks and other risks and uncertainties which could cause actual results to differ materially from those expressed in any forward lookingstatement, see Item 1A and elsewhere in this Annual Report on Form 10-K. Signet undertakes no obligation to update or revise any forward-looking statements toreflect subsequent events or circumstances, except as required by law.
GAAP AND NON-GAAP MEASURES
The following discussion and analysis of the results of operations, financial condition and liquidity is based upon the consolidated financial statements of Signetwhich are prepared in accordance with US GAAP. The following information should be read in conjunction with Signet’s financial statements and the related notesincluded in Item 8.
A number of non-GAAP measures are used by management to analyze and manage the performance of the business. See Item 6 for the required disclosures relatedto these measures. Signet provides such non-GAAP information in reporting its financial results to give investors additional data to evaluate its operations. TheCompany’s management does not, nor does it suggest investors should, consider such non-GAAP measures in isolation from, or in substitution for, financialinformation prepared in accordance with GAAP.
Exchange Translation Impact
The monthly average exchange rates are used to prepare the income statement and are calculated each month from the weekly average exchange rates weighted bysales. In Fiscal 2018, it is anticipated a five percent movement in the British pound to US dollar exchange rate would impact income before income taxes byapproximately $2.2 million, while a five percent movement in the Canadian dollar to US dollar exchange rate would have a negligible impact on income beforeincome taxes.
Transactions Affecting Comparability of Results of Operations and Liquidity and Capital Resources
The comparability of the Company’s operating results for Fiscal 2017 , Fiscal 2016 and Fiscal 2015 presented herein has been affected by certain transactions,including:
• The Zale Acquisition that closed on May 29, 2014, as described in Note 3 of Item 8, resulting in Zale contributing 247 days of performance during theyear-to-date period of Fiscal 2015 based on the timing of the acquisition;
• Certain transaction and integration costs;
• Zale Acquisition financing as described in Note 3 and Note 20 of Item 8, including global financing arrangements; and
• Certain purchase accounting adjustments.
48

Table of Contents
Fiscal 2017 Overview
Same store sales decreased 1.9% compared to an increase of 4.1% in Fiscal 2016 ; total sales were down 2.2% to $6,408.4 million compared to $6,550.2 million inFiscal 2016 . Operating margin increased 120 basis points to 11.9% compared to 10.7% in Fiscal 2016 . Operating income increased 8.5% to $763.2 millioncompared to $703.7 million in Fiscal 2016 . Diluted earnings per share increased 20.6% to $7.08 compared to $5.87 in Fiscal 2016 . Higher profit dollars and theincreased operating margin rate were driven by operating expense reductions, a decrease in transaction/integration costs, and efficiencies in field operations andcorporate support initiatives. See “GAAP and Non-GAAP Measures” section in Item 6 for additional information.
Signet’s long-term debt was $1,317.9 million at January 28, 2017 and $1,321.0 million at January 30, 2016 . Cash and cash equivalents were $98.7 million and$137.7 million , as of January 28, 2017 and January 30, 2016 , respectively. During Fiscal 2017 , Signet repurchased 11.2 million shares at an average cost of$89.10 per share. Of the $1.0 billion worth of repurchases, $625.0 million were executed to offset dilution from the October preferred convertible offering.
Drivers of Operating Profitability
The key measures and drivers of operating profitability are:
• total sales - driven by the change in same store sales and net store selling space;
• gross margin; and
• level of selling, general and administrative expenses.
Same Store Sales
Same store sales growth is calculated by comparison of sales in stores that were open in both the current and the prior fiscal year. Sales from stores that have beenopen for less than 12 months, including acquisitions, are excluded from the comparison until their 12-month anniversary. Sales after the 12-month anniversary arecompared against the equivalent prior period sales within the comparable store sales comparison. Stores closed in the current financial period are included up to thedate of closure and the comparative period is correspondingly adjusted. Stores that have been relocated or expanded, but remain within the same local geographicarea, are included within the comparison with no adjustment to either the current or comparative period. Stores that have been refurbished are also included withinthe comparison except for the period when the refurbishment was taking place, when those stores are excluded from the comparison both for the current year andfor the comparative period. Sales to employees are also excluded. Comparisons at divisional level are made in local currency and consolidated comparisons aremade at constant exchange rates and exclude the effect of exchange rate movements by recalculating the prior period results as if they had been generated at theweighted average exchange rate for the current period. eCommerce sales are included in the calculation of same store sales for the period and the comparativefigures from the anniversary of the launch of the relevant website. Same store sales exclude the 53 rd week in the fiscal year in which it occurs. Managementconsiders same store sales useful as it is a major benchmark used by investors to judge performance within the retail industry.
Net Store Selling Space
Sterling Jewelers
division Zale division UK Jewelry division Total Signet
Fiscal 2017 Openings 76 77 9 162 Closures (28) (73) (4) (105) Net change in store selling space 4.3% (0.2)% 1.0% 2.6%
Fiscal 2016 Openings 60 38 10 108 Closures (24) (33) (5) (62) Net change in store selling space 5.0% 0.5 % 1.5% 3.3%
Fiscal 2015 Openings 75 12 8 95 Closures (42) (54) (3) (99)
Net change in store selling space 4.9% n/a 1.8% 48.1%(1)
(1) Excluding Zale division, net change in store selling space for Signet was 4% in Fiscal 2015.n/a Not applicable as Zale division was acquired on May 29, 2014. See Note 3 of Item 8 for additional information.
49

Table of Contents
Cost of Sales and Gross Margin
Cost of sales is mostly composed of merchandise costs (net of discounts and allowances). Cost of sales also contains:
• Occupancy costs such as rent, common area maintenance, depreciation and real estate tax.
• Net bad debt expense and customers’ late payments primarily under the Sterling Jewelers customer finance program.
• Store operating expenses such as utilities, displays and merchant credit costs.
• Distribution costs including freight, processing, inventory shrinkage and related payroll.
As the classification of cost of sales or selling, general and administrative expenses varies from retailer to retailer and few retailers have in-house customer financeprograms, Signet’s gross margin percentage may not be directly comparable to other retailers.
Factors that influence gross margin include pricing, changes in merchandise costs (principally diamonds), changes in non-merchandise components of cost of sales(as described above), changes in sales mix, foreign exchange, gold and currency hedges and the economics of services such as repairs and extended service plans.The price of diamonds varies depending on their size, cut, color and clarity. At times, Signet uses gold and currency hedges to reduce its exposure to marketvolatility in the cost of gold and the pound sterling to the US dollar exchange rate, but it is not able to do so for diamonds. For gold and currencies, the hedgingperiod can extend to 24 months, although the majority of hedge contracts will normally be for a maximum of 12 months.
The percentage mix of the merchandise cost component of cost of sales, based on US dollars, is as follows:
Sterling Jewelers
division Zale division UK Jewelry
division Total Signet
Fiscal 2017 Diamonds 54% 36% 16% 45%Gold 14% 14% 15% 14%All Other 32% 50% 69% 41%
Fiscal 2016 Diamonds 53% 39% 15% 45%Gold 14% 14% 16% 14%All Other 33% 47% 69% 41%
Signet uses an average cost inventory methodology and, as jewelry inventory turns slowly, the impact of movements in the cost of diamonds and gold takes time tobe fully reflected in the gross margin. Signet’s inventory turns faster in the fourth quarter than in the other three quarters, therefore, changes in the cost ofmerchandise is more impactful on the gross margin in that quarter. Furthermore, Signet’s hedging activities result in movements in the purchase cost ofmerchandise taking some time before being reflected in the gross margin. An increase in inventory turn would accelerate the rate at which commodity costs impactgross margin.
Accounts receivable comprise a large volume of transactions with no one customer representing a significant balance. The net bad debt expense includes anestimate of the allowance for losses as of the balance sheet date. The allowance is calculated using a proprietary model that analyzes factors such as delinquencyrates and recovery rates. A 100% allowance is made for any amount that is more than 90 days aged on a recency basis and any amount associated with an accountthe owner of which has filed for bankruptcy, as well as an allowance for those 90 days aged and under based on historical loss information and paymentperformance. A small portion of sales under the Zale banners are financed through our in-house customer programs but represent an immaterial amount of theCompany’s credit sales, receivable balance, and bad debt expense.
Selling, General and Administrative Expense (“SGA”)
SGA expense primarily includes store staff and store administrative costs as well as advertising and promotional costs. It also includes field support centerexpenses such as information technology, credit, finance, eCommerce and other operating expenses not specifically categorized elsewhere in the consolidatedincome statements.
The primary drivers of staffing costs are the number of full time equivalent employees and the level of compensation, taxes and other benefits paid. Managementvaries, on a store by store basis, the hours worked based on the expected level of selling activity, subject to minimum staffing levels required to operate the store.Non-store staffing levels are less variable. A significant element of compensation is performance based and is primarily dependent on sales and operating profit.
The level of advertising expenditure can vary. The largest element of advertising expenditure is national television advertising and is determined by management’sjudgment of the appropriate level of advertising impressions and the cost of purchasing media.
50

Table of Contents
Other Operating Income
Other operating income is predominantly interest income arising from in-house customer finance provided to the customers of the Sterling Jewelers division. Itslevel is dependent on the rate of interest charged, the credit program selected by the customer and the level of outstanding balances. The level of outstandingbalances is primarily dependent on the sales of the Sterling Jewelers division, the proportion of sales that use the in-house customer finance, as well as programmix and the monthly collection rate.
Operating Income
To maintain current levels of operating income, Signet needs to achieve same store sales growth sufficient to offset any adverse movement in gross margin, anyincrease in operating costs, and any adverse changes in other operating income. Same store sales growth above the level required to offset the factors outlinedabove allows the business to achieve leverage of its cost base and improve operating income. Slower sales growth or a sales decline would normally result inreduced operating income. When foreseen, Signet may be able to reduce costs to help offset the impact of slow or negative sales growth. A key factor in drivingoperating income is the level of average sales per store, with higher productivity allowing leverage of expenses. The acquisition of Zale diluted operating marginfor Signet. But through the execution of synergies, Signet operating margins have grown over the past two years.
Results of Operations
Fiscal 2017 Fiscal 2016 Fiscal 2015 (1)
(in millions) $ % of sales $ % of sales $ % of sales
Sales $ 6,408.4 100.0 % $ 6,550.2 100.0 % $ 5,736.3 100.0 %Cost of sales (4,047.6) (63.2) (4,109.8) (62.7) (3,662.1) (63.8)
Gross margin 2,360.8 36.8 2,440.4 37.3 2,074.2 36.2Selling, general and administrative expenses (1,880.2) (29.3) (1,987.6) (30.4) (1,712.9) (29.9)Other operating income, net 282.6 4.4 250.9 3.8 215.3 3.7
Operating income 763.2 11.9 703.7 10.7 576.6 10.0Interest expense, net (49.4) (0.8) (45.9) (0.7) (36.0) (0.6)
Income before income taxes 713.8 11.1 657.8 10.0 540.6 9.4Income taxes (170.6) (2.6) (189.9) (2.9) (159.3) (2.8)
Net income $ 543.2 8.5 % $ 467.9 7.1 % $ 381.3 6.6 %(1) Fiscal 2015 results include Zale Corporation’s performance since the date of acquisition. See Note 3 of Item 8 for additional information.
COMPARISON OF FISCAL 2017 TO FISCAL 2016
• Same store sales: down 1.9% .
• Operating income: up 8.5% to $763.2 million . Adjusted (1) operating income: flat to prior year at $808.4 million .
• Operating margin: increased to 11.9% , up 120 basis points. Adjusted (1) operating margin: up 30 basis points to 12.6% .
• Diluted earnings per share: up 20.6% to $7.08 . Adjusted (1) diluted earnings per share: up 8.6% to $7.45 .
(1) Non-GAAP measure, see Item 6. The Company uses adjusted metrics, which adjust for purchase accounting and costs incurred principally in relation to the Zale Acquisition includingtransaction and integration expenses.
In Fiscal 2017 , Signet’s same store sales decreased by 1.9% , compared to an increase of 4.1% in Fiscal 2016 . Total sales were $6,408.4 million compared to$6,550.2 million in Fiscal 2016 , down $141.8 million or 2.2% compared to an increase of 14.2% in Fiscal 2016 . Merchandise categories and collections werebroadly lower most notably in the mall selling channel, while select merchandise and selling channels performed relatively well, such as diamond fashion jewelry,bracelets, earrings, and the off-mall and kiosk selling channels. eCommerce sales were $363.1 million and 5.7% of sales compared to $359.6 million and 5.5% ofsales in Fiscal 2016 . The breakdown of Signet’s sales performance is set out in the table below.
51

Table of Contents
Change from previous year
Fiscal 2017Same store sales
(1) Non-same store sales,
net (2) Total sales at
constant exchange rate (3)
Exchange translation impact (3)
Total sales as reported
Total sales (in millions)
Sterling Jewelers division (2.6)% 1.1% (1.5)% — % (1.5)% $ 3,930.4Zale Jewelry (2.4)% 1.4% (1.0)% (0.2)% (1.2)% $ 1,549.7Piercing Pagoda 6.6 % 1.6% 8.2 % — % 8.2 % $ 263.1
Zale division (1.2)% 1.4% 0.2 % (0.1)% 0.1 % $ 1,812.8UK Jewelry division 0.1 % 0.8% 0.9 % (13.2)% (12.3)% $ 647.1Other (4) 44.8 % $ 18.1Signet (1.9)% 1.2% (0.7)% (1.5)% (2.2)% $ 6,408.4Adjusted Signet (3) $ 6,421.7(1) Based on stores open for at least 12 months. eCommerce sales are included in the calculation of same store sales for the period and comparative figures from the anniversary of the launch of the relevant
website.(2) Includes all sales from stores not open for 12 months.(3) Non-GAAP measure, see Item 6.(4) Includes sales from Signet’s diamond sourcing initiative.
Sterling Jewelers sales
In Fiscal 2017 , Sterling Jewelers total sales were $3,930.4 million , down 1.5% , compared to $3,988.7 million in Fiscal 2016 , and same store sales decreased2.6% compared to an increase of 3.7% in Fiscal 2016 . Sales performance was led by fashion jewelry such as Ever Us and non-branded earrings and bracelets.Bridal performance was led by Vera Wang Love, Neil Lane, the newly introduced Chosen assortment, and non-branded rings. The average merchandisetransaction value (“ATV”) increased driven by mix with particular strength in higher-value diamond jewelry, coupled with declines in select lower average sellingprice point collections such as Charmed Memories and watches. The number of merchandise transactions decreased due to the same dynamic. Mix of merchandiseincreased toward higher-value, less-transactional collections (e.g. Ever Us) in lieu of higher-transactional, lower-value collections (e.g. Charmed Memories).
Changes from previous year
Fiscal 2017
Same store
sales (1) Non-same store sales,
net (2) Total sales
as reported Total sales
(in millions)
Kay (1.4)% 1.8 % 0.4 % $ 2,539.7Jared (3) (4.1)% 2.1 % (2.0)% $ 1,227.5Regional brands (9.6)% (11.0)% (20.6)% $ 163.2Sterling Jewelers division (2.6)% 1.1 % (1.5)% $ 3,930.4(1) Based on stores open for at least 12 months. eCommerce sales are included in the calculation of same store sales for the period and comparative figures from the anniversary of the launch of the relevant
website.(2) Includes all sales from stores not open for 12 months.(3) Includes smaller concept Jared stores such as Jared Vault and Jared Jewelry Boutique.
Average Merchandise Transaction Value (1)(2) Merchandise Transactions
Average Value Change from previous year Change from previous year
Fiscal Year Fiscal 2017 Fiscal 2016 Fiscal 2017 Fiscal 2016 Fiscal 2017 Fiscal 2016
Kay $ 458 $ 430 6.5 % 7.0% (8.4)% (2.4)%Jared $ 556 $ 558 (0.4)% —% (5.1)% (0.4)%Regional brands $ 454 $ 426 6.6 % 4.4% (15.9)% (6.0)%Sterling Jewelers division $ 485 $ 464 4.5 % 4.8% (7.9)% (2.1)%(1) Average merchandise transaction value is defined as net merchandise sales on a same store basis divided by the total number of customer transactions.(2) Net merchandise sales include all merchandise product sales, net of discounts and returns. In addition, excluded from net merchandise sales are sales tax in the US, repairs, warranty, insurance, employee and
other miscellaneous sales.
52

Table of Contents
Zale division sales
The Zale division’s Fiscal 2017 sales were $1,812.8 million compared to $1,811.4 million in Fiscal 2016 . Zale Jewelry contributed $1,549.7 million and PiercingPagoda contributed $263.1 million of revenues, compared to $1,568.2 million and $243.2 million , respectively, in the prior year. Total Zale division sales includedpurchase accounting adjustments of $13.3 million and $27.2 million in Fiscal 2017 and Fiscal 2016 , respectively, related to a reduction of deferred revenueassociated with extended warranty sales. Same store sales decreased 1.2% compared to an increase of 4.8% in Fiscal 2016 . Zale sales growth was led by diamondfashion jewelry such as Ever Us and Endless Brilliance. This was offset by a decline in select bridal collections, solitaires, and loose diamond sales. Zale divisionATV increased 5.3% , while the number of transactions decreased 5.8% . Zale had greater sales productivity in higher-value, lower-transactional collections (e.g.Vera Wang Fashion, Ever Us). Piercing Pagoda ATV increased 13.7% , while the number of transactions decreased 6.2% due to merchandise mix toward higherpriced gold and diamond assortments.
Change from previous year
Fiscal 2017Same store sales (1)
(2) Non-same store sales,
net
Total sales at constant exchange
rate Exchange
translation impact
Total sales as reported
Total sales (in millions)
Zales (1.4)% 2.7 % 1.3 % — % 1.3 % $ 1,257.4Gordon’s (12.2)% (14.3)% (26.5)% — % (26.5)% $ 57.7
Zale US Jewelry (2.0)% 1.7 % (0.3)% — % (0.3)% $ 1,315.1Peoples (4.6)% 1.1 % (3.5)% (1.1)% (4.6)% $ 204.9Mappins (4.2)% (6.9)% (11.1)% (1.3)% (12.4)% $ 29.7
Zale Canada Jewelry (4.5)% — % (4.5)% (1.2)% (5.7)% $ 234.6Total Zale Jewelry (2.4)% 1.4 % (1.0)% (0.2)% (1.2)% $ 1,549.7Piercing Pagoda 6.6 % 1.6 % 8.2 % — % 8.2 % $ 263.1
Zale division (1.2)% 1.4 % 0.2 % (0.1)% 0.1 % $ 1,812.8(1) Based on stores open for at least 12 months. Same store sales include merchandise and repair sales and excludes warranty and insurance revenues. eCommerce sales are included in the calculation of same
store sales for the period and comparative figures from the anniversary of the launch of the relevant website.
Average Merchandise Transaction Value (1)(2) MerchandiseTransactions
Average Value Change fromprevious year
Change fromprevious year
Fiscal Year (4) Fiscal 2017 Fiscal 2016 Fiscal 2017 Fiscal 2017
Zales $ 460 $ 451 2.0% (3.2)%Gordon’s $ 435 $ 430 1.2% (13.1)%Peoples (3) $ 401 $ 376 6.6% (10.9)%Mappins (3) $ 347 $ 332 4.5% (8.4)%
Total Zale Jewelry $ 424 $ 410 3.4% (5.3)%Piercing Pagoda $ 58 $ 51 13.7% (6.2)%
Zale division $ 217 $ 206 5.3% (5.8)%(1) Average merchandise transaction value is defined as net merchandise sales on a same store basis divided by the total number of customer transactions.(2) Net merchandise sales include all merchandise product sales net of discounts and returns. In addition, excluded from net merchandise sales are repairs, warranty, insurance, employee and other miscellaneous
sales.(3) Amounts for Zale Canada Jewelry stores are denominated in Canadian dollars.(4) Change from prior year for average merchandise transaction value and merchandise transactions only includes Fiscal 2017 as Signet did not own Zale division for the entire comparable period in Fiscal 2016
due to timing of Zale acquisition in May 2014.
UK Jewelry sales
In Fiscal 2017 , the UK Jewelry division’s total sales were $647.1 million , down 12.3% , compared to $737.6 million in Fiscal 2016 and up 0.9% at constantexchange rates (non-GAAP measure, see Item 6). Same store sales increased by 0.1% compared to an increase of 4.9% in Fiscal 2016 . ATV increased 6.0% , ledby bridal jewelry, prestige watches, and select fashion diamond jewelry, offset by a 6.3% decrease in the number of transactions.
53
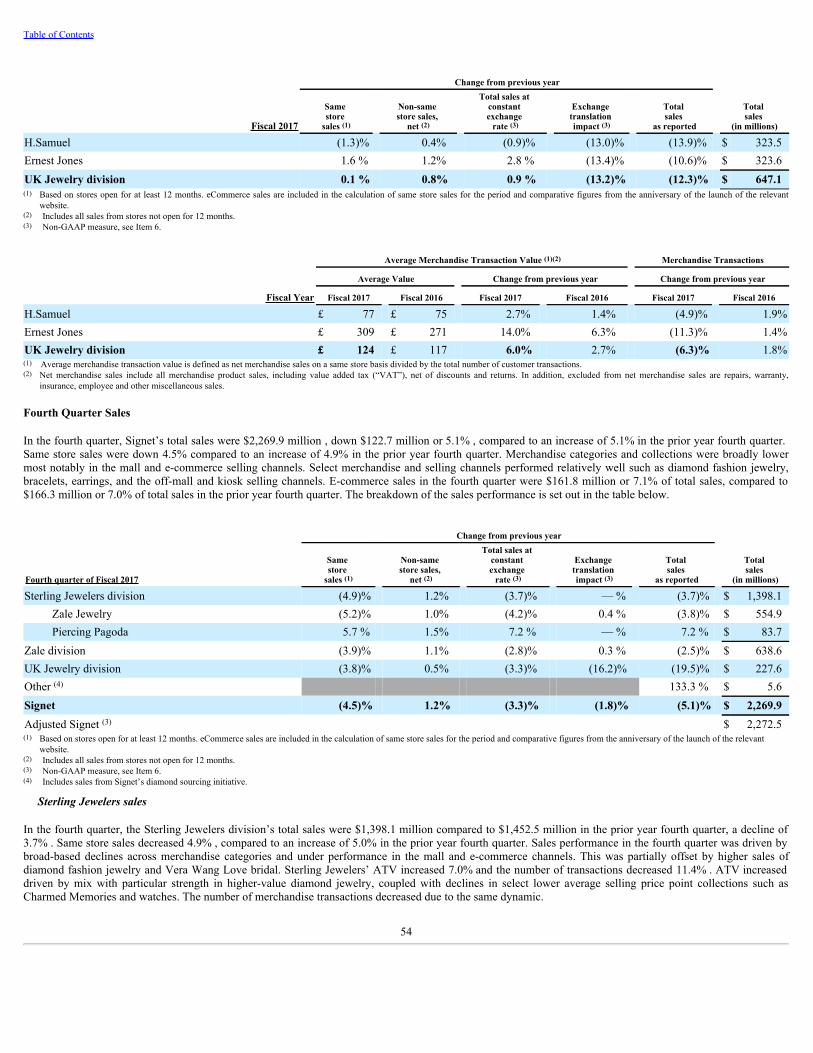
Table of Contents
Change from previous year
Fiscal 2017
Same store
sales (1) Non-same store sales,
net (2)
Total sales at constant exchange
rate (3) Exchange
translation impact (3)
Total sales
as reported Total sales
(in millions)
H.Samuel (1.3)% 0.4% (0.9)% (13.0)% (13.9)% $ 323.5Ernest Jones 1.6 % 1.2% 2.8 % (13.4)% (10.6)% $ 323.6UK Jewelry division 0.1 % 0.8% 0.9 % (13.2)% (12.3)% $ 647.1(1) Based on stores open for at least 12 months. eCommerce sales are included in the calculation of same store sales for the period and comparative figures from the anniversary of the launch of the relevant
website.(2) Includes all sales from stores not open for 12 months.(3) Non-GAAP measure, see Item 6.
Average Merchandise Transaction Value (1)(2) Merchandise Transactions
Average Value Change from previous year Change from previous year
Fiscal Year Fiscal 2017 Fiscal 2016 Fiscal 2017 Fiscal 2016 Fiscal 2017 Fiscal 2016
H.Samuel £ 77 £ 75 2.7% 1.4% (4.9)% 1.9%Ernest Jones £ 309 £ 271 14.0% 6.3% (11.3)% 1.4%UK Jewelry division £ 124 £ 117 6.0% 2.7% (6.3)% 1.8%(1) Average merchandise transaction value is defined as net merchandise sales on a same store basis divided by the total number of customer transactions.(2) Net merchandise sales include all merchandise product sales, including value added tax (“VAT”), net of discounts and returns. In addition, excluded from net merchandise sales are repairs, warranty,
insurance, employee and other miscellaneous sales.
Fourth Quarter Sales
In the fourth quarter, Signet’s total sales were $2,269.9 million , down $122.7 million or 5.1% , compared to an increase of 5.1% in the prior year fourth quarter.Same store sales were down 4.5% compared to an increase of 4.9% in the prior year fourth quarter. Merchandise categories and collections were broadly lowermost notably in the mall and e-commerce selling channels. Select merchandise and selling channels performed relatively well such as diamond fashion jewelry,bracelets, earrings, and the off-mall and kiosk selling channels. E-commerce sales in the fourth quarter were $161.8 million or 7.1% of total sales, compared to$166.3 million or 7.0% of total sales in the prior year fourth quarter. The breakdown of the sales performance is set out in the table below.
Change from previous year
Fourth quarter of Fiscal 2017
Same store
sales (1) Non-same store sales,
net (2)
Total sales at constant exchange
rate (3) Exchange
translation impact (3)
Total sales
as reported Total sales
(in millions)
Sterling Jewelers division (4.9)% 1.2% (3.7)% — % (3.7)% $ 1,398.1Zale Jewelry (5.2)% 1.0% (4.2)% 0.4 % (3.8)% $ 554.9Piercing Pagoda 5.7 % 1.5% 7.2 % — % 7.2 % $ 83.7
Zale division (3.9)% 1.1% (2.8)% 0.3 % (2.5)% $ 638.6UK Jewelry division (3.8)% 0.5% (3.3)% (16.2)% (19.5)% $ 227.6Other (4) 133.3 % $ 5.6Signet (4.5)% 1.2% (3.3)% (1.8)% (5.1)% $ 2,269.9Adjusted Signet (3) $ 2,272.5(1) Based on stores open for at least 12 months. eCommerce sales are included in the calculation of same store sales for the period and comparative figures from the anniversary of the launch of the relevant
website.(2) Includes all sales from stores not open for 12 months.(3) Non-GAAP measure, see Item 6.(4) Includes sales from Signet’s diamond sourcing initiative.
Sterling Jewelers sales
In the fourth quarter, the Sterling Jewelers division’s total sales were $1,398.1 million compared to $1,452.5 million in the prior year fourth quarter, a decline of3.7% . Same store sales decreased 4.9% , compared to an increase of 5.0% in the prior year fourth quarter. Sales performance in the fourth quarter was driven bybroad-based declines across merchandise categories and under performance in the mall and e-commerce channels. This was partially offset by higher sales ofdiamond fashion jewelry and Vera Wang Love bridal. Sterling Jewelers’ ATV increased 7.0% and the number of transactions decreased 11.4% . ATV increaseddriven by mix with particular strength in higher-value diamond jewelry, coupled with declines in select lower average selling price point collections such asCharmed Memories and watches. The number of merchandise transactions decreased due to the same dynamic.
54
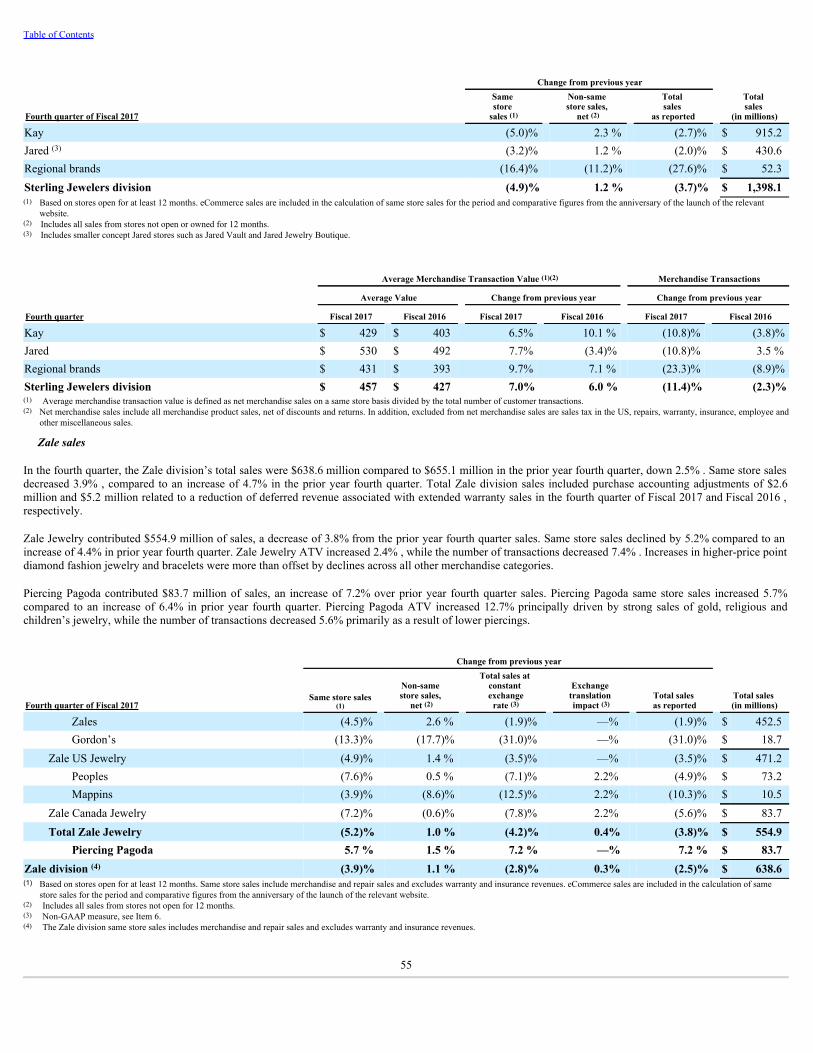
Table of Contents
Change from previous year
Fourth quarter of Fiscal 2017
Same store
sales (1) Non-same store sales,
net (2) Total sales
as reported Total sales
(in millions)
Kay (5.0)% 2.3 % (2.7)% $ 915.2Jared (3) (3.2)% 1.2 % (2.0)% $ 430.6Regional brands (16.4)% (11.2)% (27.6)% $ 52.3Sterling Jewelers division (4.9)% 1.2 % (3.7)% $ 1,398.1(1) Based on stores open for at least 12 months. eCommerce sales are included in the calculation of same store sales for the period and comparative figures from the anniversary of the launch of the relevant
website.(2) Includes all sales from stores not open or owned for 12 months.(3) Includes smaller concept Jared stores such as Jared Vault and Jared Jewelry Boutique.
Average Merchandise Transaction Value (1)(2) Merchandise Transactions
Average Value Change from previous year Change from previous year
Fourth quarter Fiscal 2017 Fiscal 2016 Fiscal 2017 Fiscal 2016 Fiscal 2017 Fiscal 2016
Kay $ 429 $ 403 6.5% 10.1 % (10.8)% (3.8)%Jared $ 530 $ 492 7.7% (3.4)% (10.8)% 3.5 %Regional brands $ 431 $ 393 9.7% 7.1 % (23.3)% (8.9)%Sterling Jewelers division $ 457 $ 427 7.0% 6.0 % (11.4)% (2.3)%(1) Average merchandise transaction value is defined as net merchandise sales on a same store basis divided by the total number of customer transactions.(2) Net merchandise sales include all merchandise product sales, net of discounts and returns. In addition, excluded from net merchandise sales are sales tax in the US, repairs, warranty, insurance, employee and
other miscellaneous sales.
Zale sales
In the fourth quarter, the Zale division’s total sales were $638.6 million compared to $655.1 million in the prior year fourth quarter, down 2.5% . Same store salesdecreased 3.9% , compared to an increase of 4.7% in the prior year fourth quarter. Total Zale division sales included purchase accounting adjustments of $2.6million and $5.2 million related to a reduction of deferred revenue associated with extended warranty sales in the fourth quarter of Fiscal 2017 and Fiscal 2016 ,respectively.
Zale Jewelry contributed $554.9 million of sales, a decrease of 3.8% from the prior year fourth quarter sales. Same store sales declined by 5.2% compared to anincrease of 4.4% in prior year fourth quarter. Zale Jewelry ATV increased 2.4% , while the number of transactions decreased 7.4% . Increases in higher-price pointdiamond fashion jewelry and bracelets were more than offset by declines across all other merchandise categories.
Piercing Pagoda contributed $83.7 million of sales, an increase of 7.2% over prior year fourth quarter sales. Piercing Pagoda same store sales increased 5.7%compared to an increase of 6.4% in prior year fourth quarter. Piercing Pagoda ATV increased 12.7% principally driven by strong sales of gold, religious andchildren’s jewelry, while the number of transactions decreased 5.6% primarily as a result of lower piercings.
Change from previous year
Fourth quarter of Fiscal 2017Same store sales
(1) Non-same store sales,
net (2)
Total sales at constant exchange
rate (3) Exchange
translation impact (3)
Total sales as reported
Total sales (in millions)
Zales (4.5)% 2.6 % (1.9)% —% (1.9)% $ 452.5Gordon’s (13.3)% (17.7)% (31.0)% —% (31.0)% $ 18.7
Zale US Jewelry (4.9)% 1.4 % (3.5)% —% (3.5)% $ 471.2Peoples (7.6)% 0.5 % (7.1)% 2.2% (4.9)% $ 73.2Mappins (3.9)% (8.6)% (12.5)% 2.2% (10.3)% $ 10.5
Zale Canada Jewelry (7.2)% (0.6)% (7.8)% 2.2% (5.6)% $ 83.7Total Zale Jewelry (5.2)% 1.0 % (4.2)% 0.4% (3.8)% $ 554.9
Piercing Pagoda 5.7 % 1.5 % 7.2 % —% 7.2 % $ 83.7Zale division (4) (3.9)% 1.1 % (2.8)% 0.3% (2.5)% $ 638.6(1) Based on stores open for at least 12 months. Same store sales include merchandise and repair sales and excludes warranty and insurance revenues. eCommerce sales are included in the calculation of same
store sales for the period and comparative figures from the anniversary of the launch of the relevant website.(2) Includes all sales from stores not open for 12 months.(3) Non-GAAP measure, see Item 6.(4) The Zale division same store sales includes merchandise and repair sales and excludes warranty and insurance revenues.
55

Table of Contents
Average Merchandise Transaction Value (1)(2) Merchandise Transactions
Average Value Change from previous year Change from previous year
Fourth quarter Fiscal 2017 Fiscal 2016 Fiscal 2017 Fiscal 2016 Fiscal 2017 Fiscal 2016
Zales $ 421 $ 418 0.7% 6.1 % (5.1)% (0.1)%Gordon’s $ 405 $ 399 1.5% (0.3)% (14.5)% (7.9)%Peoples (3) $ 367 $ 346 6.1% 6.5 % (13.4)% (6.7)%Mappins (3) $ 328 $ 297 10.4% (1.4)% (12.9)% (7.3)%
Total Zale Jewelry $ 387 $ 378 2.4% 6.2 % (7.4)% (2.1)%Piercing Pagoda $ 62 $ 55 12.7% 10.0 % (5.6)% (2.7)%
Zale division $ 227 $ 221 2.7% 6.8 % (6.5)% (2.4)%(1) Average merchandise transaction value is defined as net merchandise sales on a same store basis divided by the total number of customer transactions.(2) Net merchandise sales include all merchandise product sales net of discounts and returns. In addition, excluded from net merchandise sales are repairs, warranty, insurance, employee and other miscellaneous
sales.(3) Amounts for Zale Canada Jewelry stores are denominated in Canadian dollars.
UK Jewelry sales
In the fourth quarter, the UK Jewelry division’s total sales were down by 19.5% to $227.6 million compared to $282.6 million in the prior year fourth quarter anddown 3.3% at constant exchange rates (non-GAAP measure, see Item 6). Same store sales decreased 3.8% compared to an increase of 4.7% in the prior year fourthquarter. Average merchandise transaction value increased 8.0% and the number of transactions decreased 11.8% . The results were driven principally by weakersales of highly-transactional merchandise such as fashion jewelry, fashion watches and gifts, offset by stronger sales of prestige watches and bridal jewelry.
Change from previous year
Fourth quarter of Fiscal 2017
Same store
sales (1) Non-same store sales,
net (2)
Total sales at constant exchange
rate (3) Exchange
translation impact (3)
Total sales
as reported Total sales
(in millions)
H.Samuel (5.3)% 0.4% (4.9)% (15.9)% (20.8)% $ 119.7Ernest Jones (4) (2.1)% 0.6% (1.5)% (16.4)% (17.9)% $ 107.9UK Jewelry division (3.8)% 0.5% (3.3)% (16.2)% (19.5)% $ 227.6(1) Based on stores open for at least 12 months. eCommerce sales are included in the calculation of same store sales for the period and comparative figures from the anniversary of the launch of the relevant
website.(2) Includes all sales from stores not open for 12 months.(3) Non-GAAP measure, see Item 6.(4) Includes stores selling under the Leslie Davis nameplate.
Average Merchandise Transaction Value (1)(2) Merchandise Transactions
Average Value Change from previous year Change from previous year
Fourth quarter Fiscal 2017 Fiscal 2016 Fiscal 2017 Fiscal 2016 Fiscal 2017 Fiscal 2016
H.Samuel £ 78 £ 75 4.0% 1.4% (10.3)% 2.0 %Ernest Jones (3) £ 299 £ 253 18.2% 9.1% (17.5)% (2.1)%UK Jewelry division £ 121 £ 112 8.0% 3.7% (11.8)% 1.1 %(1) Average merchandise transaction value is defined as net merchandise sales on a same store basis divided by the total number of customer transactions.(2) Net merchandise sales include all merchandise product sales, including value added tax (“VAT”), net of discounts and returns. In addition, excluded from net merchandise sales are repairs, warranty,
insurance, employee and other miscellaneous sales.(3) Includes stores selling under the Leslie Davis nameplate.
56
Table of Contents
Cost of Sales and Gross Margin
In Fiscal 2017 , gross margin was $2,360.8 million or 36.8% of sales compared to $2,440.4 million or 37.3% of sales in Fiscal 2016 . The decrease in gross margindollars was attributable to lower sales and higher bad debt expense offset in part by decreased effect of purchase accounting adjustments of $11.3 million comparedto $35.6 million . Adjusted gross margin was $2,372.1 million or 36.9% of adjusted sales compared to $2,476.0 million or 37.6% in the prior year (non-GAAPmeasure, see Item 6). The decrease in the adjusted gross margin rate from prior year of 70 basis points was principally due to lower sales, higher bad debt expenseand de-leverage on store occupancy costs.
• The Sterling Jewelers division gross margin dollars decreased $64.0 million compared to Fiscal 2016 , reflecting decreased sales and a decline in the grossmargin rate of 100 basis points due to higher bad debt expense and de-leverage on store occupancy costs. Gross merchandise margin rate was flat to prioryear.
• In the Zale division, gross margin dollars increased $24.0 million compared to Fiscal 2016 , primarily attributable to the decreased effect of purchaseaccounting adjustments which totaled $11.3 million in Fiscal 2017 and $35.6 million in the prior year. The adjusted gross margin dollars were virtuallyflat to prior year and the rate increased 30 basis points reflecting higher merchandise margins of 100 basis points, offset in part by de-leverage on storeoccupancy costs.
• In the UK Jewelry division, gross margin dollars decreased $39.5 million compared to Fiscal 2016 , reflecting gross margin rate decrease of 170 basispoints. The decreases in dollars and rate were driven principally by lower sales, de-leverage on store occupancy, a 90 basis point decline in the grossmerchandise margin rate, including the unfavorable effect of foreign exchange.
In the fourth quarter, the consolidated gross margin was $945.5 million or 41.7% of sales compared to $1,016.0 million or 42.5% of sales in the prior year fourthquarter. Adjusted gross margin was $947.2 million or 41.7% of adjusted sales compared to $1,020.7 million or 42.6% in the prior year fourth quarter (non-GAAPmeasure, see Item 6). The declines in both the consolidated gross margin and adjusted gross margin were driven principally by lower sales leading to de-leverageon fixed costs as well as incremental promotional activity resulting in a flat merchandise margin rate to last year.
The declines in both gross margin and adjusted gross margin were driven principally by lower sales leading to deleverage on fixed costs as well as morepromotional activity.
• Gross margin dollars in the Sterling Jewelers division decreased $41.2 million compared to prior year fourth quarter, while the gross margin ratedecreased 120 basis points due primarily to lower sales which de-leveraged fixed costs, such as store occupancy. In addition, higher bad debt expense andincremental promotional activity unfavorably impacted the gross margin rate.
• In the Zale division, gross margin dollars decreased $2.3 million compared to prior year fourth quarter. Included in gross margin were purchaseaccounting adjustments totaling $1.6 million compared to $4.7 million in prior year fourth quarter. Adjusted gross margin dollars in the Zale divisiondecreased $5.3 million compared to the prior year fourth quarter. The adjusted gross margin rate increased 40 basis points with higher merchandisemargins of 120 basis points more than offsetting de-leverage of fixed costs on lower sales.
• In the UK Jewelry division, gross margin dollars decreased $26.6 million compared to Fiscal 2016 , while the gross margin rate decreased 220 basispoints driven principally by de-leverage on lower sales and lower merchandise margins due to increased promotional activity.
Selling, General and Administrative Expenses
Selling, general and administrative expenses for Fiscal 2017 were $1,880.2 million or 29.3% of sales compared to $1,987.6 million or 30.4% of sales in Fiscal2016 , down $107.4 million . The decrease was attributable to lower variable compensation costs due to lower sales and a reduction in integration costs primarilyas a result of the $34.2 million appraisal settlement in the prior year. Included in SGA were unfavorable purchase accounting adjustments of $5.5 million andintegration costs of $28.4 million in Fiscal 2017 compared to favorable purchase accounting adjustments of $9.2 million and transaction and integration costs of$78.9 million in Fiscal 2016 . Adjusted SGA was $1,846.3 million or 28.7% of adjusted sales compared to 29.1% in the prior year (non-GAAP measure, see Item6). The decrease in dollars and rate was driven primarily by lower variable compensation due to lower sales, lower advertising expense, merchant fee savings inZale credit programs and favorable foreign exchange translation, offset in part by higher information technology (“IT”) expense associated with Signet’s ITmodernization roadmap.
In the fourth quarter, SGA expense was $615.3 million or 27.1% of sales compared to $686.6 million or 28.7% of sales in the prior year fourth quarter. Thedecrease was attributable to lower variable compensation costs due to lower sales and a reduction in integration costs including consulting costs incurred inconnection with the Zale integration, severance related to organizational changes and expenses associated with the settlement of miscellaneous legal matterspending as of the date of the Zale acquisition. Included in SGA were unfavorable purchase accounting adjustments of $1.6 million and integration costs of $9.9million compared to unfavorable purchase accounting adjustments of $1.5 million and integration costs of $19.1 million in the prior year fourth quarter. AdjustedSGA was $603.8 million or 26.6% of adjusted sales compared to 27.8% in the prior year (non-GAAP measure, see Item 6). The 120 basis point decrease in SGArate was driven primarily by lower variable compensation including short-term and long-term incentive compensation, impact of synergies, lower advertisingexpense, merchant fee savings in Zale credit programs and foreign exchange translation. Offsetting these items was higher IT expense associated with Signet’s ITmodernization roadmap.
57
Table of Contents
Other Operating Income, Net
In Fiscal 2017 , other operating income, net was $282.6 million or 4.4% of sales compared to $250.9 million or 3.8% of sales in Fiscal 2016 . In the fourth quarter,other operating income, net was $69.0 million or 3.0% of sales compared to $63.7 million or 2.6% of sales in the prior year fourth quarter. The year-over-yearincrease was primarily attributable to higher interest income earned from higher outstanding receivable balances.
Operating Income
In Fiscal 2017 , operating income was $763.2 million or 11.9% of sales compared to $703.7 million or 10.7% of sales in Fiscal 2016 . Included in operating incomewere purchase accounting adjustments of $16.8 million and transaction and integration costs of $28.4 million . Adjusted operating income was $808.4 million or12.6% of adjusted sales compared to 12.3% in the prior year (non-GAAP measure, see Item 6).
Fiscal 2017 Fiscal 2016
(in millions) $ % of sales $ % of sales
Sterling Jewelers division$ 715.8
18.2% $ 718.6 18.0%Zale division (1) 73.4 4.0% 52.1 2.9%UK Jewelry division 45.6 7.0% 61.5 8.3%Other (2) (71.6) nm (128.5) nm
Operating income $ 763.2 11.9% $ 703.7 10.7%(1) Zale division includes net operating loss impact of $16.8 million for purchase accounting adjustments. Excluding the impact from accounting adjustments, Zale division’s operating income was $90.2 million
or 5.0% of sales. The Zale division operating income included $62.2 million from Zale Jewelry or 4.0% of sales and $11.2 million from Piercing Pagoda or 4.3% of sales. In the prior year, Zale divisionincludes net operating loss impact of $26.4 million for purchase accounting adjustments. Excluding the impact from accounting adjustments, Zale division’s operating income was $78.5 million or 4.3% ofsales. The Zale division operating income included $44.3 million from Zale Jewelry or 2.8% of sales and $7.8 million from Piercing Pagoda or 3.2% of sales.
(2) Other includes $28.4 million and $78.9 million of transaction and integration expenses in Fiscal 2017 and Fiscal 2016 , respectively. Transaction and integration costs include legal settlement of $34.2 millionover appraisal rights, and expenses associated with legal, tax, accounting, information technology implementation, consulting and severance.
nm Not meaningful.
In the fourth quarter, operating income was $399.2 million or 17.6% of sales compared to $393.1 million or 16.4% of sales in prior year fourth quarter. Included inoperating income were purchase accounting adjustments of $3.3 million and transaction and integration costs of $9.9 million . Adjusted operating income was$412.4 million or 18.1% of adjusted sales compared to 17.4% in the prior year (non-GAAP measure, see Item 6).
Fourth Quarter Fiscal 2017 Fourth Quarter Fiscal 2016
(in millions) $ % of sales $ % of sales
Sterling Jewelers division$ 298.0
21.3% $ 305.4 21.0%Zale division (1) 71.7 11.2% 63.0 9.6%UK Jewelry division 42.6 18.7% 57.8 20.5%Other (2) (13.1) nm (33.1) nm
Operating income $ 399.2 17.6% $ 393.1 16.4%(1) Zale division includes net operating loss impact of $3.3 million for purchase accounting adjustments. Excluding the impact from accounting adjustments, Zale division’s operating income was $75.0 million or
11.7% of sales. The Zale division operating income included $62.7 million from Zale Jewelry or 11.3% of sales and $9.0 million from Piercing Pagoda or 10.8% of sales. In the prior year fourth quarter, Zaledivision includes net operating loss impact of $6.2 million for purchase accounting adjustments. Excluding the impact from accounting adjustments, Zale division’s operating income was $69.2 million or10.6% of sales. The Zale division operating income included $54.2 million from Zale Jewelry or 9.4% of sales and $8.8 million from Piercing Pagoda or 11.3% of sales.
(2) Other includes $9.9 million and $19.1 million of transaction and integration expenses in Fiscal 2017 and Fiscal 2016 , respectively. Transaction and integration costs include expenses associated with legal,tax, information technology implementation, consulting and severance.
nm Not meaningful.
Interest Expense, Net
In Fiscal 2017 , net interest expense was $49.4 million compared to $45.9 million in Fiscal 2016 . The weighted average interest rate for the Company’s debtoutstanding was 2.8% compared to 2.6% in the prior year.
In the fourth quarter, net interest expense was $13.0 million compared to $12.1 million in the prior year fourth quarter. The weighted average interest rate for theCompany’s debt outstanding was 2.9% compared to 2.7% in the prior year fourth quarter.
Income Before Income Taxes
In Fiscal 2017 , income before income taxes increased $56.0 million to $713.8 million or 11.1% of sales compared to $657.8 million or 10.0% of sales in Fiscal2016 .
In the fourth quarter, income before income taxes increased $5.2 million to $386.2 million or 17.0% of sales compared to $381.0 million or 15.9% of sales in theprior year fourth quarter.
58

Table of Contents
Income Taxes
Income tax expense for Fiscal 2017 was $170.6 million compared to $189.9 million in Fiscal 2016 , with an effective tax rate of 23.9% for Fiscal 2017 comparedto 28.9% in Fiscal 2016 . In the fourth quarter, income tax expense was $88.7 million compared to $109.1 million in the prior year fourth quarter. The lowereffective tax rate in Fiscal 2017 was driven principally by income mix by jurisdiction and effect of global reinsurance and financing arrangements, includingcertain intra-entity debt agreements which mature on various dates between fiscal year 2022 and 2027.
Net Income
Net income for Fiscal 2017 was up 16.1% to $543.2 million or 8.5% of sales compared to $467.9 million or 7.1% of sales in Fiscal 2016 .
For the fourth quarter, net income was up 9.4% to $297.5 million or 13.1% of sales compared to $271.9 million or 11.4% of sales in the prior year fourth quarter.
Earnings per Share
For Fiscal 2017 , diluted earnings per share were $7.08 compared to $5.87 in Fiscal 2016 , an increase of 20.6% . Adjusted diluted earnings per share were $7.45compared to $6.86 in the prior year (non-GAAP measure, see Item 6). The weighted average diluted number of common shares outstanding was 76.7 million compared to 79.7 million in Fiscal 2016 . Signet repurchased 11.2 million shares in Fiscal 2017 compared to 1.0 million shares in Fiscal 2016 .
For the fourth quarter, diluted earnings per share were $3.92 compared to $3.42 in the prior year fourth quarter, up 14.6% . Adjusted diluted earnings per sharewere $4.03 compared to $3.63 in the prior year fourth quarter (non-GAAP measure, see Item 6). The weighted average diluted number of common sharesoutstanding was 75.8 million compared to 79.4 million in the prior year fourth quarter.
The Company issued preferred shares on October 5, 2016, which include a cumulative dividend right and may be converted into common shares. The Company’scomputation of diluted earnings per share includes the effect of potential common shares for outstanding awards issued under the Company’s share-basedcompensation plans and preferred shares upon conversion, if dilutive. In computing diluted EPS, the Company also adjusts the numerator used in the basic EPScomputation, subject to anti-dilution requirements, to add back the dividends (declared or cumulative undeclared) applicable to the preferred shares. For the fourthquarter and year to date periods, the preferred shares were more dilutive if conversion was assumed. See Item 8 for additional information related to the preferredshares (Note 5) or the calculation of earnings per share (Note 7).
Dividends per Common Share
In Fiscal 2017 , dividends of $1.04 were declared by the Board of Directors compared to $0.88 in Fiscal 2016 .
COMPARISON OF FISCAL 2016 TO FISCAL 2015
• Same store sales: up 4.1%.
• Operating income: up 22.0% to $703.7 million. Adjusted (1) operating income: up 18.6% to $809.0 million.
• Operating margin: increased to 10.7%, up 70 basis points. Adjusted (1) operating margin: up 50 basis points to 12.3%.
• Diluted earnings per share: up 23.6% to $5.87. Adjusted (1) diluted earnings per share: up 21.8% to $6.86.
(1)
Non-GAAP measure, see Item 6. The Company uses adjusted metrics, which adjust for purchase accounting and costs incurred principally in relation to the Zale Acquisition includingtransaction and integration expenses.
In Fiscal 2016, Signet’s same store sales increased by 4.1%, compared to an increase of 4.1% in Fiscal 2015. Total sales were $6,550.2 million comparedto $5,736.3 million in Fiscal 2015, up $813.9 million or 14.2% compared to an increase of 36.3% in Fiscal 2015. Bridal sales were nearly half of total merchandisesales, down 10 basis points versus prior year due to strong sales of fashion jewelry collections such as Ever Us. eCommerce sales were $359.6 million and 5.5% ofsales compared to $283.6 million and 4.9% of sales in Fiscal 2015. The breakdown of Signet’s sales performance is set out in the table below.
59

Table of Contents
Change from previous year
Fiscal 2016Same store sales
(1) Non-same store sales,
net (2) Total sales at
constant exchange rate (3)
Exchange translation impact (3)
Total sales as reported
Total sales (in millions)
Sterling Jewelers division 3.7% 2.2% 5.9% — % 5.9 % $ 3,988.7Zale Jewelry 4.3% $ 1,568.2Piercing Pagoda 7.5% $ 243.2
Zale division (4) 4.8% $ 1,811.4UK Jewelry division 4.9% 1.0% 5.9% (6.7)% (0.8)% $ 737.6Other (5) — nm nm — % nm $ 12.5Signet 4.1% 11.7% 15.8% (1.6)% 14.2 % $ 6,550.2Adjusted Signet (3) $ 6,577.4(1) Based on stores open for at least 12 months. eCommerce sales are included in the calculation of same store sales for the period and comparative figures from the anniversary of the launch of the relevant
website.(2) Includes all sales from stores not open for 12 months.(3) Non-GAAP measure, see Item 6.(4) Zale division results in the prior year reflect the 247 days of performance subsequent to the acquisition of Zale Corporation as of May 29, 2014.(5) Includes sales from Signet’s diamond sourcing initiative.nm Not meaningful.
Sterling Jewelers sales
In Fiscal 2016, Sterling Jewelers total sales were up 5.9% to $3,988.7 million compared to $3,765.0 million in Fiscal 2015, and same store salesincreased 3.7% compared to an increase of 4.8% in Fiscal 2015. Sales increases were broad based and driven by a combination of factors primarily in Kay Jewelersstores. Growth was led by fashion jewelry such as Ever Us, Diamonds in Rhythm, and non-branded earrings and bracelets. Bridal also grew led by Neil Lane, VeraWang Love, and non-branded rings. Branded, differentiated, and exclusive (“branded”) merchandise in Sterling Jewelers increased 30 basis points to 32.6% ofSterling Jeweler’s merchandise sales. The average merchandise transaction value increased driven by improved mix with particular strength in diamond jewelrycoupled with declines in select lower average selling price point collections such as Charmed Memories. The number of merchandise transactions decreased due tothe same dynamic. Mix of merchandise increased for higher-value, less-transactional collections (e.g. Ever Us) in lieu of higher-transactional, lower-valuecollections (e.g. Charmed Memories). This trend of higher average merchandise transaction value and lower transactions existed for Kay as well as for SterlingJewelers overall. In Jared, the average merchandise transaction value was flat to prior year and the number of merchandise transactions decreased due tomerchandise mix.
Changes from previous year
Fiscal 2016
Same store
sales (1) Non-same store sales,
net (2) Total sales
as reported Total sales
(in millions)
Kay 5.7 % 2.1 % 7.8 % $ 2,530.3Jared (3) 0.6 % 4.4 % 5.0 % $ 1,252.9Regional brands (1.2)% (7.5)% (8.7)% $ 205.5Sterling Jewelers division 3.7 % 2.2 % 5.9 % $ 3,988.7(1) Based on stores open for at least 12 months. eCommerce sales are included in the calculation of same store sales for the period and comparative figures from the anniversary of the launch of the relevant
website.(2) Includes all sales from stores not open for 12 months.(3) Includes smaller concept Jared stores such as Jared Vault and Jared Jewelry Boutique.
Average Merchandise Transaction Value (1)(2) Merchandise Transactions
Average Value Change from previous year Change from previous year
Fiscal 2016 Fiscal 2016 Fiscal 2015 Fiscal 2016 Fiscal 2015 Fiscal 2016 Fiscal 2015
Kay $ 429 $ 401 7.0% 4.7% (2.4)% 2.0 %Jared $ 553 $ 553 —% 0.7% (0.4)% 4.1 %Regional brands $ 425 $ 407 4.4% 2.2% (6.0)% (1.6)%Sterling Jewelers division $ 462 $ 441 4.8% 3.3% (2.1)% 2.3 %(1) Average merchandise transaction value is defined as net merchandise sales on a same store basis divided by the total number of customer transactions.(2) Net merchandise sales include all merchandise product sales, net of discounts and returns. In addition, excluded from net merchandise sales are sales tax in the US, repairs, warranty, insurance, employee and
other miscellaneous sales.
60

Table of Contents
Zale sales
As Zale was acquired May 29, 2014, there is no comparable period presented. The Zale division’s Fiscal 2016 sales were $1,811.4 million. Zale Jewelrycontributed $1,568.2 million and Piercing Pagoda contributed $243.2 million of revenues. Total Zale division sales included purchase accounting adjustmentsof $(27.2) million related to a reduction of deferred revenue associated with extended warranty sales. Same store sales increased 4.8%. Similar to Sterling Jewelers,Zale sales growth was led by fashion jewelry particularly in collections that were cross-sold between divisions such as Ever Us and LeVian. Bridal also increasedled by Vera Wang Love. Zale division average merchandise transaction value increased 4.6% while the number of transactions were flat. Like Sterling, Zale hadgreater sales productivity in high-value, lower-transactional collections (e.g. Ever Us). This was especially the case in Piercing Pagoda (average merchandisetransaction value up 10.9%; number of transactions down 1.2%) and to a lesser degree at the Zale Jewelry segment (average merchandise transaction value up2.8%; number of transactions up 1.6%). Branded merchandise was 42.9% of the Zale division’s merchandise sales.
Change from previous year
Fiscal 2016 Same store sales (1) Non-same store sales,
net Total sales at
constant exchange rate
Exchange translation
impact Total sales as reported
Total sales (in millions)
Zales 5.5 % $ 1,241.0Gordon’s (7.0)% $ 78.5
Zale US Jewelry 4.7 % $ 1,319.5Peoples 3.4 % $ 214.8Mappins (2.5)% $ 33.9
Zale Canada Jewelry 2.6 % $ 248.7Total Zale Jewelry 4.3 % $ 1,568.2Piercing Pagoda 7.5 % $ 243.2
Zale division 4.8 % $ 1,811.4(1) Based on stores open for at least 12 months. Same store sales includes merchandise and repair sales and excludes warranty and insurance revenues. eCommerce sales are included in the calculation of same
store sales for the period and comparative figures from the anniversary of the launch of the relevant website.
UK Jewelry sales
In Fiscal 2016, the UK Jewelry division’s total sales were down 0.8% to $737.6 million compared to $743.6 million in Fiscal 2015 and up 5.9% at constantexchange rates (non-GAAP measure, see Item 6). Same store sales increased by 4.9% compared to an increase of 5.3% in Fiscal 2015. Sales performance in theUK Jewelry division was driven by growth in average merchandise transaction value and number of transactions, 2.7% and 1.8% respectively, led by brandeddiamond jewelry and watches. In H.Samuel, average merchandise transaction value increased 1.4% driven by strong diamond sales. Increases in the number oftransactions of 1.9% were influenced by higher sales of beads and Perfect Fit, the entry-level priced engagement ring collection. In Ernest Jones, the averagemerchandise transaction value and number of transactions increased 6.3% and 1.4%, respectively. The sales mix shifted toward jewelry brands and prestigewatches. Transaction increases in Ernest Jones were driven by strength across jewelry and watch categories due in part to new product assortment and newtelevision advertising.
Change from previous year
Fiscal 2016
Same store
sales (1) Non-same store sales,
net (2)
Total sales at constant exchange
rate (3) Exchange
translation impact (3)
Total sales
as reported Total sales
(in millions)
H.Samuel 2.8% 0.2% 3.0% (6.5)% (3.5)% $ 375.8Ernest Jones 7.3% 1.9% 9.2% (7.0)% 2.2 % $ 361.8UK Jewelry division 4.9% 1.0% 5.9% (6.7)% (0.8)% $ 737.6(1)
Based on stores open for at least 12 months. eCommerce sales are included in the calculation of same store sales for the period and comparative figures from the anniversary of the launch of the relevantwebsite.
(2) Includes all sales from stores not open for 12 months.(3) Non-GAAP measure, see Item 6.
61
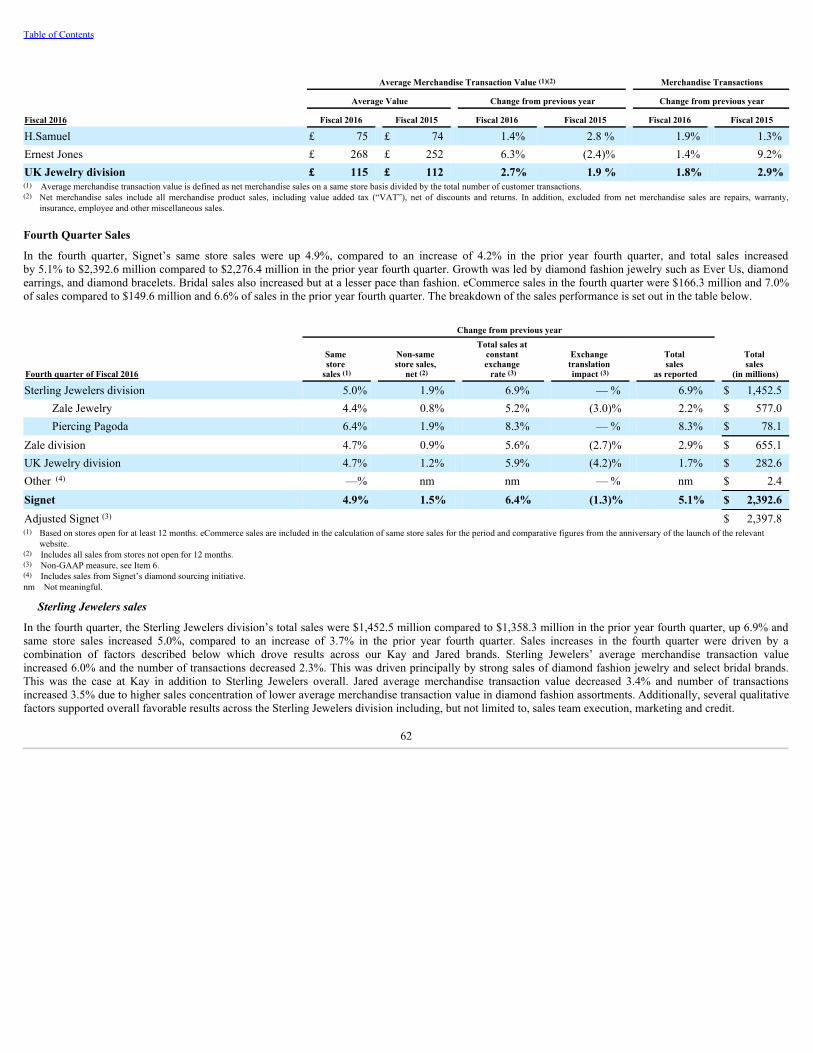
Table of Contents
Average Merchandise Transaction Value (1)(2) Merchandise Transactions
Average Value Change from previous year Change from previous year
Fiscal 2016 Fiscal 2016 Fiscal 2015 Fiscal 2016 Fiscal 2015 Fiscal 2016 Fiscal 2015
H.Samuel £ 75 £ 74 1.4% 2.8 % 1.9% 1.3%Ernest Jones £ 268 £ 252 6.3% (2.4)% 1.4% 9.2%UK Jewelry division £ 115 £ 112 2.7% 1.9 % 1.8% 2.9%(1) Average merchandise transaction value is defined as net merchandise sales on a same store basis divided by the total number of customer transactions.(2) Net merchandise sales include all merchandise product sales, including value added tax (“VAT”), net of discounts and returns. In addition, excluded from net merchandise sales are repairs, warranty,
insurance, employee and other miscellaneous sales.
Fourth Quarter Sales
In the fourth quarter, Signet’s same store sales were up 4.9%, compared to an increase of 4.2% in the prior year fourth quarter, and total sales increasedby 5.1% to $2,392.6 million compared to $2,276.4 million in the prior year fourth quarter. Growth was led by diamond fashion jewelry such as Ever Us, diamondearrings, and diamond bracelets. Bridal sales also increased but at a lesser pace than fashion. eCommerce sales in the fourth quarter were $166.3 million and 7.0%of sales compared to $149.6 million and 6.6% of sales in the prior year fourth quarter. The breakdown of the sales performance is set out in the table below.
Change from previous year
Fourth quarter of Fiscal 2016
Same store
sales (1) Non-same store sales,
net (2)
Total sales at constant exchange
rate (3) Exchange
translation impact (3)
Total sales
as reported Total sales
(in millions)
Sterling Jewelers division 5.0% 1.9% 6.9% — % 6.9% $ 1,452.5Zale Jewelry 4.4% 0.8% 5.2% (3.0)% 2.2% $ 577.0Piercing Pagoda 6.4% 1.9% 8.3% — % 8.3% $ 78.1
Zale division 4.7% 0.9% 5.6% (2.7)% 2.9% $ 655.1UK Jewelry division 4.7% 1.2% 5.9% (4.2)% 1.7% $ 282.6Other (4) —% nm nm — % nm $ 2.4Signet 4.9% 1.5% 6.4% (1.3)% 5.1% $ 2,392.6Adjusted Signet (3) $ 2,397.8(1) Based on stores open for at least 12 months. eCommerce sales are included in the calculation of same store sales for the period and comparative figures from the anniversary of the launch of the relevant
website.(2) Includes all sales from stores not open for 12 months.(3) Non-GAAP measure, see Item 6.(4) Includes sales from Signet’s diamond sourcing initiative.nm Not meaningful.
Sterling Jewelers sales
In the fourth quarter, the Sterling Jewelers division’s total sales were $1,452.5 million compared to $1,358.3 million in the prior year fourth quarter, up 6.9% andsame store sales increased 5.0%, compared to an increase of 3.7% in the prior year fourth quarter. Sales increases in the fourth quarter were driven by acombination of factors described below which drove results across our Kay and Jared brands. Sterling Jewelers’ average merchandise transaction valueincreased 6.0% and the number of transactions decreased 2.3%. This was driven principally by strong sales of diamond fashion jewelry and select bridal brands.This was the case at Kay in addition to Sterling Jewelers overall. Jared average merchandise transaction value decreased 3.4% and number of transactionsincreased 3.5% due to higher sales concentration of lower average merchandise transaction value in diamond fashion assortments. Additionally, several qualitativefactors supported overall favorable results across the Sterling Jewelers division including, but not limited to, sales team execution, marketing and credit.
62

Table of Contents
Change from previous year
Fourth quarter of Fiscal 2016
Same store
sales (1) Non-same store sales,
net (2) Total sales
as reported Total sales
(in millions)
Kay 7.4 % 1.7 % 9.1 % $ 940.8Jared (3) 1.4 % 3.9 % 5.3 % $ 439.5Regional brands (1.8)% (5.8)% (7.6)% $ 72.2Sterling Jewelers division 5.0 % 1.9 % 6.9 % $ 1,452.5(1) Based on stores open for at least 12 months. eCommerce sales are included in the calculation of same store sales for the period and comparative figures from the anniversary of the launch of the relevant
website.(2) Includes all sales from stores not open or owned for 12 months.(3) Includes smaller concept Jared stores such as Jared Vault and Jared Jewelry Boutique.
Average Merchandise Transaction Value (1)(2) Merchandise Transactions
Average Value Change from previous year Change from previous year
Fourth quarter of Fiscal 2016 Fiscal 2016 Fiscal 2015 Fiscal 2016 Fiscal 2015 Fiscal 2016 Fiscal 2015
Kay $ 403 $ 366 10.1 % 5.8% (3.8)% (1.7)%Jared $ 488 $ 505 (3.4)% 2.7% 3.5 % 0.1 %Regional brands $ 392 $ 366 7.1 % 1.1% (8.9)% (2.4)%Sterling Jewelers division $ 425 $ 401 6.0 % 4.7% (2.3)% (1.3)%(1) Average merchandise transaction value is defined as net merchandise sales on a same store basis divided by the total number of customer transactions.(2) Net merchandise sales include all merchandise product sales, net of discounts and returns. In addition, excluded from net merchandise sales are sales tax in the US, repairs, warranty, insurance, employee and
other miscellaneous sales.
Zale sales
In the fourth quarter, the Zale division’s total sales were $655.1 million compared to $636.7 million in the prior year fourth quarter, up 2.9% and same store salesincreased 4.7%, compared to an increase of 1.5% in the prior year fourth quarter. Zale Jewelry contributed $577.0 million and Piercing Pagoda contributed $78.1million of revenues, an increase of 2.2% and 8.3%, respectively. Total Zale division sales included purchase accounting adjustments of $(5.2) million and $(12.8)million related to a reduction of deferred revenue associated with extended warranty sales in the fourth quarter of Fiscal 2016 and Fiscal 2015, respectively.
In the Zale Jewelry segment, average merchandise transaction value increased 6.2%, while the number of transactions decreased 2.1%. This was driven principallyby strong sales of diamond fashion jewelry and bridal. In the Piercing Pagoda segment, average merchandise transaction value increased 10.0%, while the numberof transactions decreased 2.7%. This was driven principally by strong sales of gold and diamond jewelry.
Change from previous year
Fourth quarter of Fiscal 2016Same store sales
(1) Non-same store sales,
net (2)
Total sales at constant exchange
rate (3) Exchange
translation impact (3)
Total sales as reported
Total sales (in millions)
Zales 6.3 % 1.7 % 8.0 % — % 8.0 % $ 461.2Gordon’s (7.5)% (8.1)% (15.6)% — % (15.6)% $ 27.1
Zale US Jewelry 5.4 % 0.9 % 6.3 % — % 6.3 % $ 488.3Peoples 0.3 % 0.9 % 1.2 % (15.6)% (14.4)% $ 77.0Mappins (7.6)% (2.4)% (10.0)% (14.0)% (24.0)% $ 11.7
Zale Canada Jewelry (0.8)% 0.4 % (0.4)% (15.4)% (15.8)% $ 88.7Total Zale Jewelry 4.4 % 0.8 % 5.2 % (3.0)% 2.2 % $ 577.0
Piercing Pagoda 6.4 % 1.9 % 8.3 % — % 8.3 % $ 78.1Zale division (4) 4.7 % 0.9 % 5.6 % (2.7)% 2.9 % $ 655.1(1) Based on stores open for at least 12 months. eCommerce sales are included in the calculation of same store sales for the period and comparative figures from the anniversary of the launch of the relevant
website.(2) Includes all sales from stores not open for 12 months.(3) Non-GAAP measure.(4) The Zale division same store sales includes merchandise and repair sales and excludes warranty and insurance revenues.
63
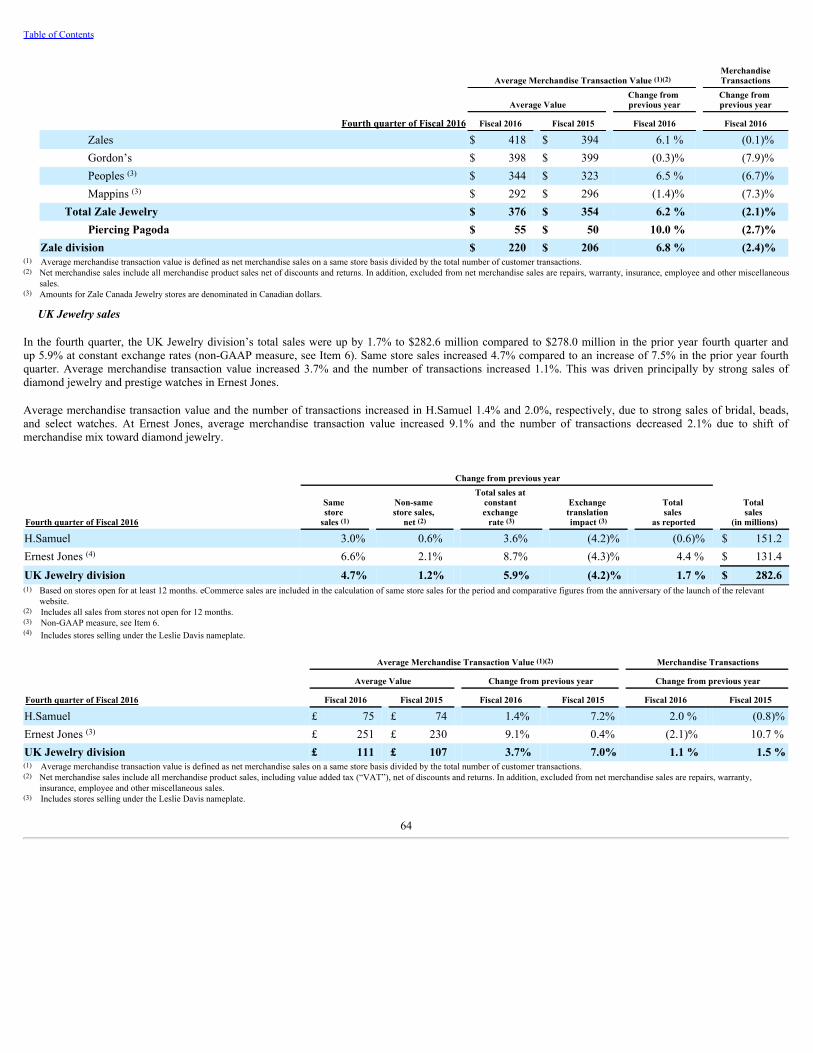
Table of Contents
Average Merchandise Transaction Value (1)(2) MerchandiseTransactions
Average Value Change from previous year
Change from previous year
Fourth quarter of Fiscal 2016 Fiscal 2016 Fiscal 2015 Fiscal 2016 Fiscal 2016
Zales $ 418 $ 394 6.1 % (0.1)%Gordon’s $ 398 $ 399 (0.3)% (7.9)%Peoples (3) $ 344 $ 323 6.5 % (6.7)%Mappins (3) $ 292 $ 296 (1.4)% (7.3)%
Total Zale Jewelry $ 376 $ 354 6.2 % (2.1)%Piercing Pagoda $ 55 $ 50 10.0 % (2.7)%
Zale division $ 220 $ 206 6.8 % (2.4)%(1) Average merchandise transaction value is defined as net merchandise sales on a same store basis divided by the total number of customer transactions.(2) Net merchandise sales include all merchandise product sales net of discounts and returns. In addition, excluded from net merchandise sales are repairs, warranty, insurance, employee and other miscellaneous
sales.(3) Amounts for Zale Canada Jewelry stores are denominated in Canadian dollars.
UK Jewelry sales
In the fourth quarter, the UK Jewelry division’s total sales were up by 1.7% to $282.6 million compared to $278.0 million in the prior year fourth quarter andup 5.9% at constant exchange rates (non-GAAP measure, see Item 6). Same store sales increased 4.7% compared to an increase of 7.5% in the prior year fourthquarter. Average merchandise transaction value increased 3.7% and the number of transactions increased 1.1%. This was driven principally by strong sales ofdiamond jewelry and prestige watches in Ernest Jones.
Average merchandise transaction value and the number of transactions increased in H.Samuel 1.4% and 2.0%, respectively, due to strong sales of bridal, beads,and select watches. At Ernest Jones, average merchandise transaction value increased 9.1% and the number of transactions decreased 2.1% due to shift ofmerchandise mix toward diamond jewelry.
Change from previous year
Fourth quarter of Fiscal 2016
Same store
sales (1) Non-same store sales,
net (2)
Total sales at constant exchange
rate (3) Exchange
translation impact (3)
Total sales
as reported Total sales
(in millions)
H.Samuel 3.0% 0.6% 3.6% (4.2)% (0.6)% $ 151.2Ernest Jones (4) 6.6% 2.1% 8.7% (4.3)% 4.4 % $ 131.4UK Jewelry division 4.7% 1.2% 5.9% (4.2)% 1.7 % $ 282.6(1) Based on stores open for at least 12 months. eCommerce sales are included in the calculation of same store sales for the period and comparative figures from the anniversary of the launch of the relevant
website.(2) Includes all sales from stores not open for 12 months.(3) Non-GAAP measure, see Item 6.(4) Includes stores selling under the Leslie Davis nameplate.
Average Merchandise Transaction Value (1)(2) Merchandise Transactions
Average Value Change from previous year Change from previous year
Fourth quarter of Fiscal 2016 Fiscal 2016 Fiscal 2015 Fiscal 2016 Fiscal 2015 Fiscal 2016 Fiscal 2015
H.Samuel £ 75 £ 74 1.4% 7.2% 2.0 % (0.8)%Ernest Jones (3) £ 251 £ 230 9.1% 0.4% (2.1)% 10.7 %UK Jewelry division £ 111 £ 107 3.7% 7.0% 1.1 % 1.5 %(1) Average merchandise transaction value is defined as net merchandise sales on a same store basis divided by the total number of customer transactions.(2) Net merchandise sales include all merchandise product sales, including value added tax (“VAT”), net of discounts and returns. In addition, excluded from net merchandise sales are repairs, warranty,
insurance, employee and other miscellaneous sales.(3) Includes stores selling under the Leslie Davis nameplate.
64

Table of Contents
Cost of Sales and Gross Margin
In Fiscal 2016, gross margin was $2,440.4 million or 37.3% of sales compared to $2,074.2 million or 36.2% of sales in Fiscal 2015. Adjusted gross marginwas $2,476.0 million or 37.6% of adjusted sales compared to 36.9% in the prior year (non-GAAP measure, see Item 6). The increase in the adjusted gross marginrate from prior year of 70 basis points was due to improved merchandise margin from commodity costs and synergies, as well as store occupancy cost leverage.
• The Sterling Jewelers division gross margin dollars increased $107.7 million compared to Fiscal 2015, reflecting increased sales and a gross margin rateimprovement of 50 basis points. The gross margin rate expansion was driven by an improvement in the merchandise margin due to favorable commoditycosts and store occupancy cost leverage.
• In the Zale division, gross margin dollars increased $255.6 million compared to Fiscal 2015. Included in gross margin were purchasing accountingadjustments totaling $35.6 million in Fiscal 2016 and $57.3 million in the prior year. Adjusted gross margin dollars increased $233.9 million compared tothe prior year (prior year represents a partial year of ownership due to the acquisition date of May 29, 2014), reflecting an adjusted gross margin rateimprovement of 170 basis points. Higher sales and synergies favorably affected merchandise margins, distribution costs, and store occupancy. Thisincluded initiatives focused on discount controls, vendor terms and allowances, supply chain cost efficiencies and rent savings.
• In the UK Jewelry division, gross margin dollars increased $3.9 million compared to Fiscal 2015, reflecting gross margin rate improvement of 80 basispoints. The increases in dollars and rate were driven principally by leverage on store occupancy.
In the fourth quarter, the consolidated gross margin was $1,016.0 million or 42.5% of sales compared to $912.1 million or 40.1% of sales in the prior year fourthquarter. Adjusted gross margin was $1,020.7 million or 42.6% of adjusted sales compared to 40.9% in the prior year fourth quarter (non-GAAP measure, see Item6). The increase in the adjusted gross margin rate from prior year of 170 basis points was consistent with the full year, due primarily to gross margin synergiesincluding sourcing and discount controls related mostly to the Zale division, as well as favorable commodity and leverage on store occupancy costs.
• Gross margin dollars in the Sterling Jewelers division increased $57.4 million compared to the prior year fourth quarter, reflecting higher sales and a grossmargin rate increase of 120 basis points. The gross margin rate expansion was driven by an improvement in the merchandise margin due primarily tofavorable commodity costs and store occupancy cost leverage.
• In the Zale division, gross margin dollars increased $41.8 million compared to prior year fourth quarter. Included in gross margin were purchaseaccounting adjustments totaling $4.7 million in current year fourth quarter compared to $24.8 million in prior year. Adjusted gross margin dollars in theZale division increased $21.7 million compared to the prior year fourth quarter. The adjusted gross margin rate increased 270 basis points, as synergiesfavorably affected merchandise margins, distribution costs and store occupancy.
• In the UK Jewelry division, gross margin dollars increased $4.0 million compared to Fiscal 2015, reflecting a gross margin rate improvement of 80 basispoints. The increases in dollars and rate were driven principally by leverage on store occupancy.
Selling, General and Administrative Expenses
Selling, general and administrative expenses for Fiscal 2016 were $1,987.6 million or 30.4% of sales compared to $1,712.9 million or 29.9% of sales in Fiscal2015, up $274.7 million, which includes a full year of Zale SGA expense, compared to the partial year reported in the prior period due to the timing of theacquisition. In addition, included in SGA were favorable purchase accounting adjustments of $9.2 million offset by transaction and integration costs of $78.9million, which includes the impact of the legal settlement of $34.2 million over appraisal rights, consulting and internal costs incurred in connection with theintegration of Zale acquisition, severance costs and implementation costs incurred in connection with our IT modernization and standardization initiatives.Adjusted SGA was $1,917.9 million or 29.1% of adjusted sales compared to 28.8% in the prior year (non-GAAP measure, see Item 6). The increase in dollars andrate was driven primarily by central costs around product research and development, as well as incremental investments in advertising, IT support and employeebenefits.
In the fourth quarter, SGA expense was $686.6 million or 28.7% of sales compared to $634.5 million or 27.9% of sales in the prior year fourth quarter. In addition,included in SGA were purchase accounting adjustments of $1.5 million and transaction and integration costs of $19.1 million, which includes consulting costsincurred in connection with the integration of Zale acquisition, severance costs and implementation costs associated with our IT modernization and standardizationinitiatives. Adjusted SGA was $666.0 million or 27.8% of adjusted sales compared to 27.5% in the prior year (non-GAAP measure, see Item 6). The 30 basis pointincrease in SGA rate was driven primarily by an increase in central costs associated with higher information technology recurring expense, product research anddevelopment, and harmonization of employee compensation among North America divisions. Partially offsetting these higher central costs was leverage onadvertising and store payroll.
Other Operating Income, Net
In Fiscal 2016, other operating income was $250.9 million or 3.8% of sales compared to $215.3 million or 3.7% of sales in Fiscal 2015. This increase wasprimarily due to higher interest income earned from higher outstanding receivable balances.
Other operating income in the fourth quarter was $63.7 million or 2.6% of sales compared to $54.1 million or 2.4% of sales in the prior year fourth quarter. Thisincrease was also primarily due to higher interest income earned from higher outstanding receivable balances.
65

Table of Contents
Operating Income
In Fiscal 2016, operating income was $703.7 million or 10.7% of sales compared to $576.6 million or 10.0% of sales in Fiscal 2015. Included in operating incomewere purchase accounting adjustments of $26.4 million and transaction and integration costs of $78.9 million. Adjusted operating income was $809.0million or 12.3% of adjusted sales compared to 11.8% in the prior year (non-GAAP measure, see Item 6).
Fiscal 2016 Fiscal 2015
(in millions) $ % of sales $ % of sales
Sterling Jewelers division$ 718.6
18.0% $ 624.3 16.6 %Zale division (1) 52.1 2.9% (8.2) (0.7)%UK Jewelry division 61.5 8.3% 52.2 7.0 %Other (2) (128.5) nm (91.7) nm
Operating income $ 703.7 10.7% $ 576.6 10.0 %(1) Zale division includes net operating loss impact of $26.4 million for purchase accounting adjustments. Excluding the impact from accounting adjustments, Zale division’s operating income was $78.5 million
or 4.3% of sales. The Zale division operating income included $44.3 million from Zale Jewelry or 2.8% of sales and $7.8 million from Piercing Pagoda or 3.2% of sales. In the prior year, Zale divisionincludes net operating loss impact of $45.9 million for purchase accounting adjustments. Excluding the impact from accounting adjustments, Zale division’s operating income was $37.7 million or 3.0% ofsales. The Zale division operating loss included $1.9 million from Zale Jewelry or (0.2)% of sales and $6.3 million from Piercing Pagoda or (4.3)% of sales.
(2) Other includes $78.9 million and $59.8 million of transaction and integration expenses in Fiscal 2016 and 2015, respectively. Transaction and integration costs include legal settlement of $34.2 million overappraisal rights, and expenses associated with legal, tax, accounting, information technology implementation, consulting and severance.
nmNot meaningful.
In the fourth quarter, operating income was $393.1 million or 16.4% of sales compared to $331.7 million or 14.6% of sales in prior year fourth quarter. Included inoperating income were purchase accounting adjustments of $6.2 million and transaction and integration costs of $19.1 million. Adjusted operating incomewas $418.4 million or 17.4% of adjusted sales compared to 15.8% in the prior year (non-GAAP measure, see Item 6).
Fourth Quarter Fiscal 2016 Fourth Quarter Fiscal 2015
(in millions) $ % of sales $ % of sales
Sterling Jewelers division$ 305.4
21.0% $ 260.0 19.1%Zale division (1) 63.0 9.6% 36.1 5.7%UK Jewelry division 57.8 20.5% 53.8 19.4%Other (2) (33.1) nm (18.2) nm
Operating income $ 393.1 16.4% $ 331.7 14.6%(1) Zale division includes net operating loss impact of $6.2 million for purchase accounting adjustments. Excluding the impact from accounting adjustments, Zale division’s operating income was $69.2
million or 10.6% of sales. The Zale division operating income included $54.2 million from Zale Jewelry or 9.4% of sales and $8.8 million from Piercing Pagoda or 11.3% of sales. In the prior year fourthquarter, Zale division includes net operating loss impact of $20.8 million for purchase accounting adjustments. Excluding the impact from accounting adjustments, Zale division’s operating income was $56.9million or 8.7% of sales. The Zale division operating income included $32.8 million from Zale Jewelry or 5.8% of sales and $3.3 million from Piercing Pagoda or 4.6% of sales.
(2) Other includes $19.1 million and $9.2 million of transaction and integration expenses in Fiscal 2016 and 2015, respectively. Transaction and integration costs include expenses associated with legal, tax,information technology implementation, consulting and severance.
nm Not meaningful.
Interest Expense, Net
In Fiscal 2016, net interest expense was $45.9 million compared to $36.0 million in Fiscal 2015. The increase in interest expense was driven by the addition of $1.4billion of debt financing at a weighted average interest rate of 2.6% related to the Zale acquisition, which was outstanding for the full 12 months of Fiscal 2016,versus only a partial year in the prior period.
In the fourth quarter, net interest expense was $12.1 million compared to $7.9 million in the prior year fourth quarter driven by the timing of repayments of ourfourth quarter borrowings under our variable rate revolving credit facility, coupled with slightly higher interest rates. Further contributing to the increase wasadditional expense related to our interest rate hedging instrument which effectively converted a portion of variable-rate debt into fixed-rate debt during the firstquarter of Fiscal 2016.
Income Before Income Taxes
For Fiscal 2016, income before income taxes was up 21.7% to $657.8 million or 10.0% of sales compared to $540.6 million or 9.4% of sales in Fiscal 2015.
For the fourth quarter, income before income taxes was up 17.7% to $381.0 million or 15.9% of sales compared to $323.8 million or 14.2% of sales in the prioryear fourth quarter.
66

Table of Contents
Income Taxes
Income tax expense for Fiscal 2016 was $189.9 million compared to $159.3 million in Fiscal 2015, with an effective tax rate of 28.9% for Fiscal 2016 comparedto 29.5% in Fiscal 2015. This reduction of 60 basis points in Signet’s effective tax rate primarily reflects the full year benefit of Signet’s amended capital structureand financing arrangements utilized to fund the acquisition of Zale Corporation.
In the fourth quarter, income tax expense was $109.1 million compared to $95.8 million in the prior year fourth quarter. The fourth quarter effective tax ratewas 28.6% compared to 29.6% in the prior year fourth quarter also driven principally by income mix by jurisdiction and increased effect of Signet’s globalfinancing arrangements.
Net Income
Net income for Fiscal 2016 was up 22.7% to $467.9 million or 7.1% of sales compared to $381.3 million or 6.6% of sales in Fiscal 2015.
For the fourth quarter, net income was up 19.3% to $271.9 million or 11.4% of sales compared to $228.0 million or 10.0% of sales in the prior year fourth quarter.
Earnings Per Share
For Fiscal 2016, diluted earnings per share were $5.87 compared to $4.75 in Fiscal 2015, an increase of 23.6%. Adjusted diluted earnings per sharewere $6.86 compared to $5.63 in the prior year (non-GAAP measure, see Item 6). The weighted average diluted number of common shares outstanding was 79.7million compared to 80.2 million in Fiscal 2015. Signet repurchased 1,018,568 shares in Fiscal 2016 compared to 288,393 shares in Fiscal 2015.
For the fourth quarter, diluted earnings per share were $3.42 compared to $2.84 in the prior year fourth quarter, up 20.4%. Adjusted diluted earnings per sharewere $3.63 compared to $3.06 in the prior year fourth quarter (non-GAAP measure, see Item 6). The weighted average diluted number of common sharesoutstanding was 79.4 million compared to 80.2 million in the prior year fourth quarter.
Dividends Per Share
In Fiscal 2016, dividends of $0.88 were approved by the Board of Directors compared to $0.72 in Fiscal 2015.
67

Table of Contents
LIQUIDITY AND CAPITAL RESOURCES
Summary Cash Flow
The following table provides a summary of Signet’s cash flow activity for Fiscal 2017 , Fiscal 2016 and Fiscal 2015 :
(in millions) Fiscal 2017 Fiscal 2016 Fiscal 2015
Net cash provided by operating activities $ 678.3 $ 443.3 $ 283.0Net cash used in investing activities (278.4) (228.7) (1,652.6)Net cash (used in) provided by financing activities (438.2) (266.6) 1,320.9Decrease in cash and cash equivalents (38.3) (52.0) (48.7)
Cash and cash equivalents at beginning of period 137.7 193.6 247.6Decrease in cash and cash equivalents (38.3) (52.0) (48.7)Effect of exchange rate changes on cash and cash equivalents (0.7) (3.9) (5.3)Cash and cash equivalents at end of period $ 98.7 $ 137.7 $ 193.6
Free cash flow (1) $ 400.3 $ 216.8 $ 62.8(1) Non-GAAP measure. See Item 6 for additional information.
OVERVIEW
Operating activities provide the primary source of cash and are influenced by a number of factors, such as:
• net income;
• changes in the level of inventory as a result of sales and new store growth;
• changes to accounts receivable driven by the in-house customer finance program metrics including average monthly collection rate and the mix of financeoffer participation;
• changes to accrued expenses including variable compensation; and
• deferred revenue, reflective of the performance of extended service plan sales.
Other sources of cash include borrowings, issuance of common and preferred shares for cash and proceeds from the securitization facility relating to Signet’sSterling Jewelers finance receivables.
Net Cash Provided By Operating Activities
Signet derives most of its operating cash from net income through the sale of jewelry. As a retail business, Signet receives cash when it makes a sale to a customeror when the payment has been processed by Signet or the relevant bank if the payment is made by third-party credit or debit card. Partially offsetting cash receiptsvia sales are payments of operating expenses. Signet’s largest operating expenses are cost of inventory along with payroll and payroll-related benefits.
Working Capital
Changes to accounts receivable are driven by the Sterling Jewelers division in-house credit program. If a customer makes use of financing provided by the SterlingJewelers division, the cash is received over time based on terms of the agreement. In Fiscal 2017 , 62.0% of the Sterling Jewelers division’s sales were made usingcustomer financing provided by Signet, as compared to 61.5% in Fiscal 2016 . The average monthly collection rate from the Sterling Jewelers customer in-housefinance receivables was 11.0% as compared to 11.5% in Fiscal 2016 . Changes in credit participation and the collection rate impact the level of receivables.
Changes to accounts payable are primarily driven by the timing and amount of merchandise purchased, the mix of merchandise purchased and the relevantpayment terms. Signet typically pays for merchandise within 30 days of receipt. Due to the nature of specialty retail jewelry, it is usual for inventory to turnover onaverage once approximately every 12 months.
Signet’s working capital requirements fluctuate during the year as a result of the seasonal nature of sales, and movements in the British pound and Canadian dollarto US dollar exchange rate. The working capital needs of the business normally decline from January to August, as inventory and accounts receivable decreasefrom seasonal peaks. As inventory is purchased for the fourth quarter, there is a working capital outflow which reaches its highest levels in mid- to late-November.The peak level of working capital is typically $100 million to $150 million above the typical January to August level, and can be accentuated by new storeopenings. The working capital position then reverses over the Holiday Season.
68

Table of Contents
The change in inventory is primarily driven by the sales performance of the existing stores, the net change in store space and the seasonal pattern of sales. Otherfactors which drive changes to inventory include changes in sourcing practices, commodity costs, foreign exchange and merchandise mix. To further enhanceproduct selection, test new jewelry designs and working capital levels, Signet enters into consignment arrangements for merchandise. The majority of inventoryheld on consignment is in the US, which at January 28, 2017 amounted to $574.0 million as compared to $441.9 million at January 30, 2016 . The principal termsof the consignment agreements, which can generally be terminated by either party, are such that Signet can return any or all of the inventory to the relevantsupplier without financial or commercial penalties. When Signet sells consignment inventory, it becomes liable to the supplier for the cost of the item. The sale ofany such inventory is accounted for on a gross basis (see principal accounting policies, Item 8).
Signet’s working capital is also impacted by movements in deferred revenue associated with the sales of extended service plans sold in Sterling Jewelers and Zaledivisions. Movements in deferred revenue reflect the level of divisional sales and the attachment rate of service plan sales. Therefore if sales increase, workingcapital would be expected to increase. Similarly, a decrease in sales would be expected to result in a reduction in working capital.
Signet’s largest class of operating expense relates to store and central payroll and benefits. These are typically paid on a weekly, biweekly or monthly basis, withannual bonus payments also being made. Operating lease payments in respect of stores occupied are normally paid on a monthly basis by the Sterling Jewelers andZale divisions and on a quarterly basis by the UK Jewelry division. Payment for advertising on television, radio or in print is usually made between 30 and 60 daysafter the advertisement appears. Other expenses, none of which are material, have various payment terms.
Investment in new space requires significant investment in working capital, as well as fixed capital investment, due to the inventory turn, and the additionalinvestment required to fund sales in the Sterling Jewelers and Zale divisions utilizing in-house customer finance. Of the total investment required to open a newstore in the US, between 50% and 60% is typically accounted for by working capital. New stores are usually opened in the third quarter or early in the fourthquarter of a fiscal year. A reduction in the number of store openings results in the difference between the level of funding required in the first half of a fiscal yearand the peak level being lower, while an increase in the number of store openings would have the opposite impact.
Fiscal 2017 Cash Flow Results
In Fiscal 2017 , net cash provided by operating activities was $678.3 million as compared to $443.3 million in Fiscal 2016 . The increase of $235.0 million isattributable to a $75.3 million increase in net income, a $22.5 million increase in depreciation and amortization (including amortization of unfavorable intangibleliabilities) related to the elevated level of capital expenditures since the acquisition of Zale in Fiscal 2014 and the following cash flows associated with changes inoperating assets and liabilities:
• Cash used for accounts receivable was $102.7 million compared to $189.8 million in Fiscal 2016 , reflecting an increase in the underlying accountsreceivable as a result of the 50 basis point decline in the collection rate from customers. The collection rate decline is due principally to a continuation ofthe shift in credit plan mix towards plans requiring lower monthly payments and an increase in the average transaction value. Our receivable portfolio hasexperienced growth compared to the prior year end, however, this growth trajectory has flattened in recent periods. Credit applications compared to theprior year end are down by approximately 10% which is driven by declines in retail traffic, primarily mall traffic which has has lowered the number ofactive credit accounts compared to the prior year end by approximately 23,000, or 1.5%. Slowed growth in the receivable portfolio has also contributed toa higher rate of charge-offs as a percentage of average gross accounts receivable of 10.7% in the current year compared to 9.9% in the prior year. Asaccounts are charged-off that were originated in periods of high portfolio growth during a period of slower portfolio growth, this ratio will increase.
• Cash used for inventory and inventory-related items was $9.7 million compared to $46.0 million in Fiscal 2016 . The change in inventory cash flows isattributed to the change in total inventory on-hand to $2,449.3 million in Fiscal 2017 compared to $2,453.9 million in Fiscal 2016 . Key factors impactingthe decrease in total inventory were sound inventory management and the effect of foreign exchange, offset by increases associated with new store growthand higher commodity prices.
• Cash used for other receivables and other assets was $6.9 million compared to $70.6 million in Fiscal 2016 primarily due to an increase in deferredextended service plan selling costs.
• Cash used for accrued expenses and other liabilities was $21.8 million in Fiscal 2017 compared to $51.8 million of cash in-flows in Fiscal 2016 primarilydue to a decrease in payroll-related accrued expenses, including short-term and long-term incentive compensation.
• Cash provided by deferred revenue was $43.6 million in Fiscal 2017 compared to $76.3 million in Fiscal 2016 . The increase in deferred revenue wasprimarily driven by higher extended service plan sales in the Sterling Jewelers and Zale divisions.
• Cash provided by income taxes was $38.9 million compared to $25.7 million of cash outflows in Fiscal 2016 due to lower estimated tax payments madein Fiscal 2017 as a result of lower taxable income and Signet’s lower effective tax rate.
69

Table of Contents
Cash Used in Investing Activities
Net cash used in investing activities primarily reflects the purchases of property, plant and equipment related to the:
• rate of space expansion in the US;
• investment in existing stores, reflecting the level of investment in sales-enhancing technology, and the number of store remodels and relocations carriedout; and
• investments in IT modernization and digital ecosystem.
When evaluating new store investment, management uses an investment hurdle rate of a 20% internal rate of return on a pre-tax basis over a five year period,assuming the release of working capital at the end of the five years. Capital expenditure accounts for about 45% of the investment in a new store in the SterlingJewelers division. The balance is accounted for by investment in inventory and the funding of customer financing. Signet typically carries out a remodel of itsstores every 10 years but does have some discretion as to the timing of such expenditure. A remodel is evaluated using the same investment procedures as for anew store. Minor store refurbishments are typically carried out every five years. In addition to store remodels, Signet carries out minor store refurbishments wherestores are profitable but do not satisfy the investment hurdle rate required for a full remodel; this is usually associated with a short term lease renewal. Wherepossible, the investment appraisal approach is also used to evaluate other investment opportunities.
In Fiscal 2017 , net cash used in investing activities was $278.4 million , compared to $228.7 million in Fiscal 2016 and $1,652.6 million in Fiscal 2015 .Excluding the acquisition of Zale in Fiscal 2015, cash used in investing activities was $223.4 million . The overall increase in capital additions was primarily dueto new stores and investments in eCommerce and modernization of legacy IT systems in all divisions. In Fiscal 2017 and Fiscal 2016 , capital expenditures in eachdivision exceeded depreciation and amortization recognized. See table below for additional information regarding capital additions.
Fiscal 2017 Fiscal 2016 Fiscal 2015
(in millions) Capital additions in Sterling Jewelers $ 154.5 $ 141.6 $ 157.6Capital additions in Zale division 97.7 57.9 42.0Capital additions in UK Jewelry 25.7 26.4 20.2Capital additions in Other 0.1 0.6 0.4Total purchases of property, plant and equipment $ 278.0 $ 226.5 $ 220.2
Ratio of capital additions to depreciation and amortization in Sterling Jewelers 137.1% 133.3% 164.7%Ratio of capital additions to depreciation and amortization in Zale division 181.9% 120.4% 135.5%Ratio of capital additions to depreciation and amortization in UK Jewelry 119.0% 131.3% 91.4%Ratio of capital additions to depreciation and amortization for Signet 147.2% 129.2% 147.1%
Free Cash Flow
Free cash flow (non-GAAP measure, see Item 6) is defined as net cash provided by operating activities less purchases of property, plant and equipment. Free cashflow in Fiscal 2017 was $400.3 million compared to $216.8 million and $62.8 million in Fiscal 2016 and Fiscal 2015 , respectively. The increase in free cash flowin Fiscal 2017 compared to Fiscal 2016 was primarily due to growth in profitability and working capital management, primarily through improvements ininventory planning.
Cash Provided By/Used in Financing Activities
The major items within financing activities are discussed below:
Proceeds from issuance of equity shares
On October 5, 2016 , the Company issued 625,000 preferred shares to Green Equity Investors VI, L.P., Green Equity Investors Side VI, L.P., LGP Associates VI-ALLC and LGP Associates VI-B LLC, all affiliates of Leonard Green & Partners, L.P., (together, the “Investors”) for an aggregate purchase price of $625.0 million ,or $1,000 per share (the “Stated Value”) pursuant to the investment agreement dated August 24, 2016. In connection with the issuance of the preferred shares, theCompany incurred direct and incremental expenses of $13.7 million , including financial advisory fees, closing costs, legal expenses and other offering-relatedexpenses. The preferred shares rank senior to the Company’s common shares, with respect to dividend rights and rights on the distribution of assets on anyvoluntary or involuntary liquidation, dissolution or winding up of the affairs of the Company. Preferred shareholders are entitled to a cumulative dividend at therate of 5% per annum, payable quarterly in arrears, commencing on February 15, 2017. See Note 5 of Item 8 for additional information related to preferredshareholder rights.
70
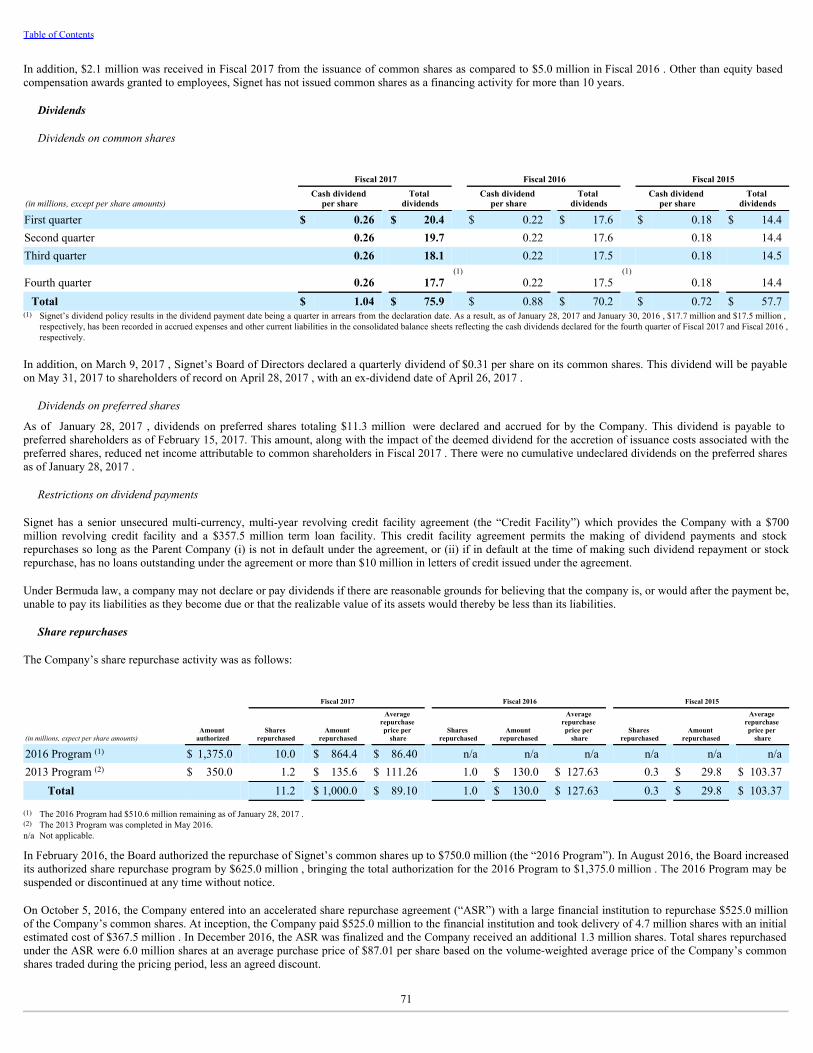
Table of Contents
In addition, $2.1 million was received in Fiscal 2017 from the issuance of common shares as compared to $5.0 million in Fiscal 2016 . Other than equity basedcompensation awards granted to employees, Signet has not issued common shares as a financing activity for more than 10 years.
Dividends
Dividends on common shares
Fiscal 2017 Fiscal 2016 Fiscal 2015
(in millions, except per share amounts)Cash dividend
per share Total
dividends Cash dividend
per share Total
dividends Cash dividend
per share Total
dividends
First quarter $ 0.26 $ 20.4 $ 0.22 $ 17.6 $ 0.18 $ 14.4Second quarter 0.26 19.7 0.22 17.6 0.18 14.4Third quarter 0.26 18.1 0.22 17.5 0.18 14.5
Fourth quarter 0.26 17.7(1) 0.22 17.5
(1) 0.18 14.4
Total $ 1.04 $ 75.9 $ 0.88 $ 70.2 $ 0.72 $ 57.7(1) Signet’s dividend policy results in the dividend payment date being a quarter in arrears from the declaration date. As a result, as of January 28, 2017 and January 30, 2016 , $17.7 million and $17.5 million ,
respectively, has been recorded in accrued expenses and other current liabilities in the consolidated balance sheets reflecting the cash dividends declared for the fourth quarter of Fiscal 2017 and Fiscal 2016 ,respectively.
In addition, on March 9, 2017 , Signet’s Board of Directors declared a quarterly dividend of $0.31 per share on its common shares. This dividend will be payableon May 31, 2017 to shareholders of record on April 28, 2017 , with an ex-dividend date of April 26, 2017 .
Dividends on preferred shares
As of January 28, 2017 , dividends on preferred shares totaling $11.3 million were declared and accrued for by the Company. This dividend is payable topreferred shareholders as of February 15, 2017. This amount, along with the impact of the deemed dividend for the accretion of issuance costs associated with thepreferred shares, reduced net income attributable to common shareholders in Fiscal 2017 . There were no cumulative undeclared dividends on the preferred sharesas of January 28, 2017 .
Restrictions on dividend payments
Signet has a senior unsecured multi-currency, multi-year revolving credit facility agreement (the “Credit Facility”) which provides the Company with a $700million revolving credit facility and a $357.5 million term loan facility. This credit facility agreement permits the making of dividend payments and stockrepurchases so long as the Parent Company (i) is not in default under the agreement, or (ii) if in default at the time of making such dividend repayment or stockrepurchase, has no loans outstanding under the agreement or more than $10 million in letters of credit issued under the agreement.
Under Bermuda law, a company may not declare or pay dividends if there are reasonable grounds for believing that the company is, or would after the payment be,unable to pay its liabilities as they become due or that the realizable value of its assets would thereby be less than its liabilities.
Share repurchases
The Company’s share repurchase activity was as follows:
Fiscal 2017 Fiscal 2016 Fiscal 2015
(in millions, expect per share amounts)Amount
authorized Shares repurchased Amount
repurchased
Average repurchase price per
share Shares repurchased Amount
repurchased
Average repurchase price per
share Shares repurchased Amount
repurchased
Average repurchase price per
share
2016 Program (1) $ 1,375.0 10.0 $ 864.4 $ 86.40 n/a n/a n/a n/a n/a n/a2013 Program (2) $ 350.0 1.2 $ 135.6 $ 111.26 1.0 $ 130.0 $ 127.63 0.3 $ 29.8 $ 103.37
Total 11.2 $ 1,000.0 $ 89.10 1.0 $ 130.0 $ 127.63 0.3 $ 29.8 $ 103.37 (1) The 2016 Program had $510.6 million remaining as of January 28, 2017 .
(2) The 2013 Program was completed in May 2016.n/a Not applicable.
In February 2016, the Board authorized the repurchase of Signet’s common shares up to $750.0 million (the “2016 Program”). In August 2016, the Board increasedits authorized share repurchase program by $625.0 million , bringing the total authorization for the 2016 Program to $1,375.0 million . The 2016 Program may besuspended or discontinued at any time without notice.
On October 5, 2016, the Company entered into an accelerated share repurchase agreement (“ASR”) with a large financial institution to repurchase $525.0 millionof the Company’s common shares. At inception, the Company paid $525.0 million to the financial institution and took delivery of 4.7 million shares with an initialestimated cost of $367.5 million . In December 2016, the ASR was finalized and the Company received an additional 1.3 million shares. Total shares repurchasedunder the ASR were 6.0 million shares at an average purchase price of $87.01 per share based on the volume-weighted average price of the Company’s commonshares traded during the pricing period, less an agreed discount.
71
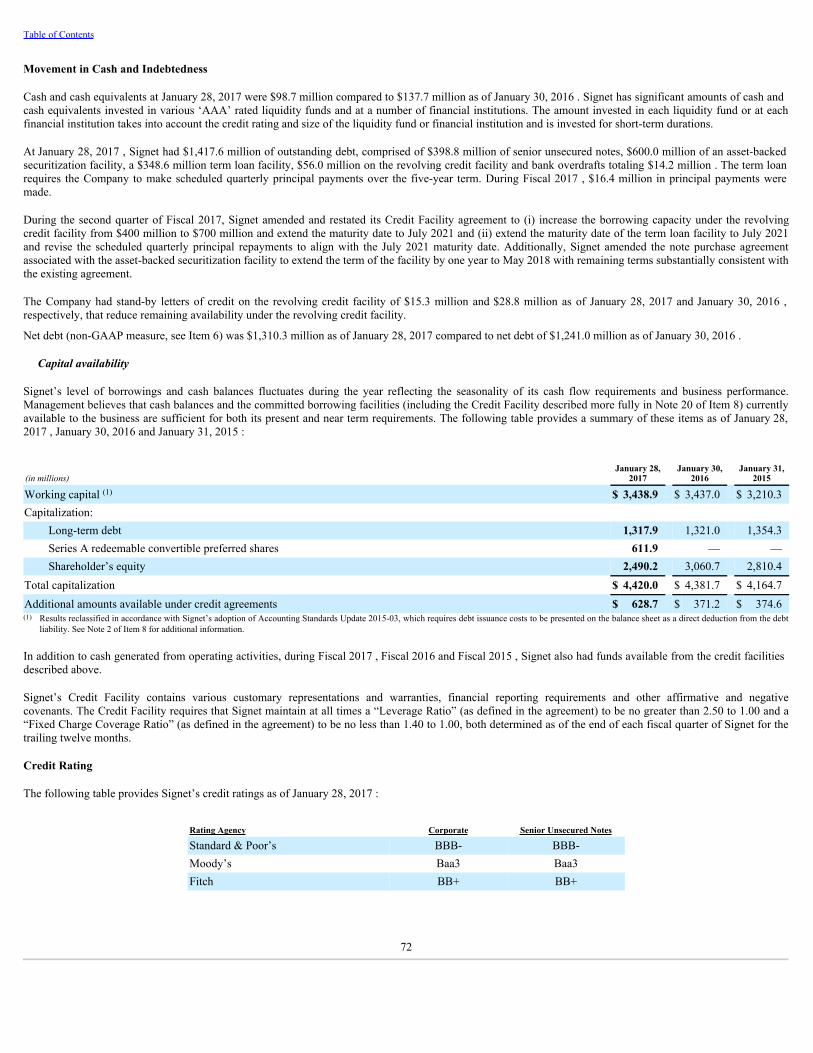
Table of Contents
Movement in Cash and Indebtedness
Cash and cash equivalents at January 28, 2017 were $98.7 million compared to $137.7 million as of January 30, 2016 . Signet has significant amounts of cash andcash equivalents invested in various ‘AAA’ rated liquidity funds and at a number of financial institutions. The amount invested in each liquidity fund or at eachfinancial institution takes into account the credit rating and size of the liquidity fund or financial institution and is invested for short-term durations.
At January 28, 2017 , Signet had $1,417.6 million of outstanding debt, comprised of $398.8 million of senior unsecured notes, $600.0 million of an asset-backedsecuritization facility, a $348.6 million term loan facility, $56.0 million on the revolving credit facility and bank overdrafts totaling $14.2 million . The term loanrequires the Company to make scheduled quarterly principal payments over the five-year term. During Fiscal 2017 , $16.4 million in principal payments weremade.
During the second quarter of Fiscal 2017, Signet amended and restated its Credit Facility agreement to (i) increase the borrowing capacity under the revolvingcredit facility from $400 million to $700 million and extend the maturity date to July 2021 and (ii) extend the maturity date of the term loan facility to July 2021and revise the scheduled quarterly principal repayments to align with the July 2021 maturity date. Additionally, Signet amended the note purchase agreementassociated with the asset-backed securitization facility to extend the term of the facility by one year to May 2018 with remaining terms substantially consistent withthe existing agreement.
The Company had stand-by letters of credit on the revolving credit facility of $15.3 million and $28.8 million as of January 28, 2017 and January 30, 2016 ,respectively, that reduce remaining availability under the revolving credit facility.
Net debt (non-GAAP measure, see Item 6) was $1,310.3 million as of January 28, 2017 compared to net debt of $1,241.0 million as of January 30, 2016 .
Capital availability
Signet’s level of borrowings and cash balances fluctuates during the year reflecting the seasonality of its cash flow requirements and business performance.Management believes that cash balances and the committed borrowing facilities (including the Credit Facility described more fully in Note 20 of Item 8) currentlyavailable to the business are sufficient for both its present and near term requirements. The following table provides a summary of these items as of January 28,2017 , January 30, 2016 and January 31, 2015 :
(in millions)January 28,
2017 January 30,
2016 January 31,
2015
Working capital (1) $ 3,438.9 $ 3,437.0 $ 3,210.3Capitalization:
Long-term debt 1,317.9 1,321.0 1,354.3Series A redeemable convertible preferred shares 611.9 — —Shareholder’s equity 2,490.2 3,060.7 2,810.4
Total capitalization $ 4,420.0 $ 4,381.7 $ 4,164.7Additional amounts available under credit agreements $ 628.7 $ 371.2 $ 374.6(1) Results reclassified in accordance with Signet’s adoption of Accounting Standards Update 2015-03, which requires debt issuance costs to be presented on the balance sheet as a direct deduction from the debt
liability. See Note 2 of Item 8 for additional information.
In addition to cash generated from operating activities, during Fiscal 2017 , Fiscal 2016 and Fiscal 2015 , Signet also had funds available from the credit facilitiesdescribed above.
Signet’s Credit Facility contains various customary representations and warranties, financial reporting requirements and other affirmative and negativecovenants. The Credit Facility requires that Signet maintain at all times a “Leverage Ratio” (as defined in the agreement) to be no greater than 2.50 to 1.00 and a“Fixed Charge Coverage Ratio” (as defined in the agreement) to be no less than 1.40 to 1.00, both determined as of the end of each fiscal quarter of Signet for thetrailing twelve months.
Credit Rating
The following table provides Signet’s credit ratings as of January 28, 2017 :
Rating Agency Corporate Senior Unsecured Notes
Standard & Poor’s BBB- BBB-Moody’s Baa3 Baa3Fitch BB+ BB+
72

Table of Contents
OFF-BALANCE SHEET ARRANGEMENTS
Merchandise held on consignment
Signet held $574.0 million of consignment inventory which is not recorded on the balance sheet at January 28, 2017 , as compared to $441.9 million at January 30,2016 . The principal terms of the consignment agreements, which can generally be terminated by either party, are such that Signet can return any, or all of, theinventory to the relevant supplier without financial or commercial penalty.
Contingent property liabilities
At January 28, 2017 , approximately 26 UK Jewelry property leases had been assigned by Signet to third parties (and remained unexpired and occupied byassignees at that date) and approximately 12 additional properties were sub-let at that date. Should the assignees or sub-tenants fail to fulfill any obligations inrespect of those leases or any other leases which have at any other time been assigned or sub-let, Signet or one of its UK subsidiaries may be liable for thosedefaults. The number of such claims arising to date has been small, and the liability, which is charged to the income statement as it arises, has not been material.
CONTRACTUAL OBLIGATIONS
A summary of operating lease obligations is set out below. These primarily relate to minimum payments due under store lease arrangements. The majority of thestore operating leases provide for the payment of base rentals plus real estate taxes, insurance, common area maintenance fees and merchant association dues.Additional information regarding Signet’s operating leases is available in Item 2 and Note 25 included in Item 8.
Long-term debt obligations comprise borrowings with an original maturity of greater than one year. It is expected that operating commitments will be funded fromfuture operating cash flows and no additional facilities will be required to meet these obligations.
Contractual obligations as of January 28, 2017
(in millions)Less than one year
Between one and three years
Between three and five years
More than five years Total
Long-term debt obligations - Principal (1) $ 22.4 $ 671.5 $ 310.7 $ 400.0 $ 1,404.6Long-term debt obligations - Interest (2) 40.9 63.0 45.9 47.0 196.8Operating lease obligations (3) 450.0 700.4 566.8 901.1 2,618.3Capital commitments 48.4 — — — 48.4Pensions 3.3 — — — 3.3Commitment fee payments 1.3 2.6 1.8 — 5.7Deferred compensation plan 3.0 7.0 10.6 23.8 44.4Current income tax 101.8 — — — 101.8Other long-term liabilities (4) — — — 5.0 5.0Total $ 671.1 $ 1,444.5 $ 935.8 $ 1,376.9 $ 4,428.3(1) Includes principal payments on all long-term debt obligations.(2) Includes future interest payments on all long-term debt obligations, inclusive of both fixed- and variable-rate debt. Projected interest costs on variable rate debt were calculated using rates in effect at
January 28, 2017 . Amounts exclude the amortization of debt discounts, the amortization of loan fees and fees for lines of credit that would be included in interest expense in the consolidated incomestatements.
(3) Operating lease obligations relate to minimum payments due under store lease arrangements. Most store operating leases require payment of real estate taxes, insurance and common area maintenance fees.Real estate taxes, insurance and common area maintenance fees were approximately 30% of base rentals for Fiscal 2017 . These are not included in the table above. Some operating leases also requireadditional payments based on a percentage of sales.
(4) Other long-term liabilities reflect loss reserves related to credit insurance services provided by insurance subsidiaries. We have reflected these payments under “Other,” as the timing of the future payments isdependent on the actual processing of the claims.
Not included in the table above are obligations under employment agreements and ordinary course purchase orders for merchandise.
IMPACT OF INFLATION
The impact of inflation on Signet’s results for the past three years has not been significant apart from the impact of the commodity costs changes, and in the UK,the impact on merchandise costs due to the currency translation of the British pound against the US dollar.
73

Table of Contents
CRITICAL ACCOUNTING POLICIES
Critical accounting policies covering areas of greater complexity that are subject to the exercise of judgment due to the reliance on key estimates are listed below.A comprehensive listing of Signet’s critical accounting policies is set forth in Note 1 of the consolidated financial statements in Item 8.
Revenue recognition for extended service plans and lifetime warranty agreements (“ESP”)
The Company recognizes revenue related to lifetime warranty sales in proportion to when the expected costs will be incurred. The deferral period for lifetimewarranty sales in each division is determined from patterns of claims costs, including estimates of future claims costs expected to be incurred. Managementreviews the trends in claims to assess whether changes are required to the revenue and cost recognition rates utilized. A significant change in estimates related tothe time period or pattern in which warranty-related costs are expected to be incurred could materially impact revenues. The deferral period and recognition ratesof deferred revenue related to lifetime warranty sales is determined based on multi-year patterns of claims costs; therefore, a shift in historical experience of claimscost and frequency over several periods would be required to alter the revenue recognition pattern materially. All direct costs associated with the sale of these plansare deferred and amortized in proportion to the revenue recognized.
The Sterling Jewelers division sells ESP, subject to certain conditions, to perform repair work over the life of the product. Revenue from the sale of the lifetimeESP is recognized consistent with the estimated pattern of claim costs expected to be incurred by the Company in connection with performing under the ESPobligations. Based on an evaluation of historical claims data, management currently estimates that substantially all claims will be incurred within 17 years of thesale of the warranty contract.
In the second quarter of Fiscal 2016, an operational change related to the Sterling Jewelers division’s ESP associated with ring sizing was made to further alignZale and Sterling ESP policies. As a result, revenue from the sale of these lifetime ESP in the Sterling Jewelers division is deferred and recognized over 17 yearsfor all plans, with approximately 57% of revenue recognized within the first two years for plans sold on or after May 2, 2015 ( January 30, 2016 : 57% ) and 42%of revenue recognized within the first two years for plans sold prior to May 2, 2015 ( January 30, 2016 : 42% ; January 31, 2015 : 45% ).
The Zale division also sells ESP. Zale Jewelry customers are offered lifetime warranties on certain products that cover sizing and breakage with an option topurchase theft protection for a two-year period. Revenue from the sale of lifetime ESP is deferred and recognized over 10 years, with approximately 69% ofrevenue recognized within the first two years ( January 30, 2016 : 69% ; January 31, 2015 : 69% ).
Deferred revenue related to extended service plans, voucher promotions and other items at the end of Fiscal 2017 and Fiscal 2016 was $935.9 million and $889.4million , respectively.
Property, plant and equipment
Property, plant and equipment are reviewed for impairment whenever events or circumstances indicate that the carrying amount of an asset may not be recoverable.Potentially impaired assets or asset groups are identified by reviewing the cash flows of individual stores. Recoverability of assets to be held and used is measuredby a comparison of the carrying amount of an asset to estimated undiscounted future cash flows expected to be generated by the asset, based on the Company’sinternal business plans. If the undiscounted cash flow is less than the asset’s carrying amount, the impairment charge recognized is determined by estimating thefair value of the assets and recording a loss for the amount that the carrying value exceeds the estimated fair value. The Company utilizes historical experience,internal business plans and an appropriate discount rate to estimate the fair value. Property and equipment at stores planned for closure are depreciated over arevised estimate of their useful lives.
In Fiscal 2017 , the income statement includes a charge of $1.3 million for impairment of assets as compared to $0.7 million in Fiscal 2016 . Property, plant andequipment, net , totaled $822.9 million as of January 28, 2017 and $727.6 million as of January 30, 2016 . Depreciation and amortization expense for Fiscal 2017and Fiscal 2016 was $175.0 million and $161.4 million , respectively. Application of alternative assumptions, such as changes in estimates of future cash flows,could produce significantly different results. A 10% decrease in the estimated undiscounted cash flows for the stores with indicators of impairment would not havehad a material impact on the Company’s results of operations in Fiscal 2017 .
Goodwill and intangibles
Goodwill is evaluated for impairment annually and more frequently if indicators of impairment arise. In evaluating goodwill for impairment, the Company firstassesses qualitative factors to determine whether it is more likely than not that the fair value of a reporting unit is less than its carrying value (including goodwill).If the Company concludes that it is not more likely than not that the fair value of a reporting unit is less than its carrying value, then no further testing is required.However, if the Company concludes that it is more likely than not that the fair value of a reporting unit is less than its carrying value, then the two-step goodwillimpairment test is performed to identify a potential goodwill impairment and measure the amount of impairment to be recognized, if any. The two-step impairmenttest involves estimating the fair value of all assets and liabilities of the reporting unit, including the implied fair value of goodwill, through either estimateddiscounted future cash flows or market-based methodologies.
The annual testing date for goodwill allocated to the Sterling Jewelers reporting unit is the last day of the fourth quarter. The annual testing date for goodwillallocated to the reporting units associated with the Zale division and the Other reporting unit is May 31. There have been no goodwill impairment charges recordedduring the fiscal periods presented in the consolidated financial statements as financial results for the reporting units
74

Table of Contents
have met or exceeded financial projections developed at the time of the acquisitions. If future economic conditions are different than those projected bymanagement, future impairment charges may be required. Goodwill totaled $517.6 million as of January 28, 2017 and $515.5 million as of January 30, 2016 .
Intangible assets with definite lives are amortized and reviewed for impairment whenever events or circumstances indicate that the carrying amount of the assetmay not be recoverable. If the estimated undiscounted future cash flows related to the asset are less than the carrying amount, the Company recognizes animpairment charge equal to the difference between the carrying value and the estimated fair value, usually determined by the estimated discounted future cashflows of the asset. Intangible assets with definite lives, net of accumulated amortization, totaled $12.2 million as of January 28, 2017 and $25.6 million as ofJanuary 30, 2016 .
Intangible assets with indefinite lives are reviewed for impairment each year in the second quarter and may be reviewed more frequently if certain events occur orcircumstances change. The Company first performs a qualitative assessment to determine whether it is more likely than not that the indefinite-lived intangible assetis impaired. If the Company determines that it is more likely than not that the fair value of the asset is less than its carrying amount, the Company estimates the fairvalue, usually determined by the estimated discounted future cash flows of the asset, compares that value with its carrying amount and records an impairmentcharge, if any. If future economic conditions are different than those projected by management, future impairment charges may be required. Intangible assets withindefinite lives totaled $404.8 million as of January 28, 2017 and $402.2 million as of January 30, 2016 .
Income taxes
Income taxes are accounted for using the asset and liability method, which requires the recognition of deferred tax assets and liabilities for the expected future taxconsequences of events that have been included in the consolidated financial statements. Under this method, deferred tax assets and liabilities are recognized byapplying statutory tax rates in effect in the years in which the differences between the financial reporting and tax filing bases of existing assets and liabilities areexpected to reverse. The effect of a change in tax rates on deferred tax assets and liabilities is recognized in income in the period that includes the enactment date.A valuation allowance is established against deferred tax assets when it is more likely than not that some portion or all of the deferred tax assets will not berealized, based on management’s evaluation of all available evidence, both positive and negative, including reversals of deferred tax liabilities, projected futuretaxable income and results of recent operations. The Company recorded a valuation allowance of $31.5 million and $31.9 million , as of January 28, 2017 andJanuary 30, 2016 , respectively, due to uncertainties related to the Company’s ability to utilize some of the deferred tax assets, primarily consisting of net operatinglosses, foreign tax credits and foreign capital losses carried forward.
The annual effective tax rate is based on annual income, statutory tax rates and tax planning strategies available in the various jurisdictions in which the Companyoperates. The Company does not recognize tax benefits related to positions taken on certain tax matters unless the position is more likely than not to be sustainedupon examination by tax authorities. At any point in time, various tax years are subject to or are in the process of being audited by various taxing authorities. TheCompany records a reserve for uncertain tax positions, including interest and penalties. To the extent that management’s estimates of settlements change, or thefinal tax outcome of these matters is different than the amounts recorded, such differences will impact the income tax provision in the period in which suchdeterminations are made. If the reserve for uncertain tax positions decreased by 10%, the impact would be approximately $1.0 million as of January 28, 2017 . SeeNote 9 in Item 8 for additional information regarding deferred tax assets and unrecognized tax benefits.
Accounts receivable
Accounts receivable are stated at their nominal amounts and primarily include account balances outstanding from Sterling Jewelers division in-house customerfinance programs. The finance receivables from the in-house customer finance programs are comprised of a large volume of transactions with no one customerrepresenting a significant balance. The initial acceptance of customer finance arrangements is based on proprietary consumer credit model scores. Subsequent tothe initial financed purchase, the Company monitors the credit quality of its customer finance receivable portfolio based on payment activity driving the aging ofreceivables, as well as proprietary models assessing each account’s probability of default. Subsequent to the initial financed purchase, the Company monitors thecredit quality of its customer finance receivable portfolio based on payment activity driving the aging of receivables, as well as through the use of proprietarybehavioral and collection models which assess each account’s probability of default based on performance on their account and regularly refreshed credit bureauattributes.
Accounts receivable under the customer finance programs are presented net of an allowance for uncollectible amounts. This allowance represents management’sestimate of the expected losses in the accounts receivable portfolio as of the balance sheet date, and is calculated using a model that analyzes factors such asdelinquency rates and recovery rates. An allowance for amounts 90 days aged and under is established based on historical loss experience and paymentperformance information. A 100% allowance is made for any amount aged more than 90 days on a recency basis and any amount associated with an account theowner of which has filed for bankruptcy. The recency-aging methodology is based on receipt of qualifying payments which vary depending on the account status.A customer’s account ages each month five days after their due date listed on their statement, allowing for a grace period before collection efforts begin. Aqualifying payment can be no less than 75% of the scheduled payment, increasing with the delinquency level. If an account holder is two payments behind, thenthey must make a full minimum payment to return to current status. If an account holder is three payments behind, then they must make three full payments beforereturning to a current status. If an account holder is more than three payments behind, then the entire past due amount is required to return to a current status. Theallowance
75

Table of Contents
calculation is reviewed by management to assess whether, based on economic events, additional analysis is required to appropriately estimate losses inherent in theportfolio.
Allowances for uncollectible amounts are recorded as a charge to cost of sales in the consolidated income statement. Receivables are charged off to the allowancewhen amounts become more than 120 days aged on the recency method and more than 240 days aged on the contractual method. The allowance at January 28,2017 was $138.7 million against a gross accounts receivable balance of $1,952.0 million . This compares to an allowance of $130.0 million against a grossaccounts receivable balance of $1,855.9 million at January 30, 2016 . If management’s estimate of the allowance for uncollectible accounts had been different by10% at the end of Fiscal 2017 , cost of sales would have been impacted by approximately $13.9 million .
Inventories
Inventories are primarily held for resale and are valued at the lower of cost or market value. Cost is determined using weighted-average cost for all inventoriesexcept for inventories held in the Company’s diamond sourcing operations where cost is determined using specific identification. Inventory reserves for obsolete,slow moving or defective items are calculated as the difference between the cost of inventory and its estimated market value, based on targeted inventory turnrates, future demand, management strategy and market conditions. Due to the inventory being primarily comprised of precious stones and metals including gold,the age of the inventory has a limited impact on the estimated market value. Inventory reserves for shrinkage are estimated and recorded based on historicalphysical inventory results, expectations of future inventory losses and current inventory levels. Physical inventories are taken at least once annually for all storelocations and distribution centers. Historically, the Company’s actual physical inventory count results have shown our estimates to be materially accurate.Management does not believe there is a reasonable likelihood that changes in the Company’s inventory shrinkage levels will occur so as to have a material effecton the Company’s financial condition or results of operations in future periods. The total inventory reserve was $43.2 million at the end of Fiscal 2017 and Fiscal2016 . Total inventory at January 28, 2017 was $2,449.3 million as compared to $2,453.9 million at January 30, 2016 .
Employee Benefits
Signet operates a defined benefit pension plan in the UK (the “UK Plan”) which ceased to admit new employees effective April 2004. The UK Plan providesbenefits to participating eligible employees. Beginning in Fiscal 2014, a change to the benefit structure was implemented and members’ benefits that accumulateafter that date are now based upon career average salaries, whereas previously, all benefits were based on salaries at retirement.
The Company utilizes significant assumptions, along with the actual employee census data, in determining its net periodic pension cost and benefit obligationsincluded in the consolidated financial statements. The net periodic pension cost of the UK Plan is measured on an actuarial basis using the projected unit creditmethod and several actuarial assumptions, the most significant of which are the discount rate and the expected long-term rate of return on plan assets. The netperiodic pension cost is charged to selling, general and administrative expenses in the consolidated income statements. See Note 19 in Item 8 for additionalinformation.
The funded status of the UK Plan is recognized on the balance sheet, and is the difference between the fair value of plan assets and the projected benefit obligationmeasured at the balance sheet date. Gains or losses and prior service costs or credits that arise and are not included as components of net periodic pension cost arerecognized, net of tax, in OCI. The funded status of the UK Plan at January 28, 2017 was a $31.9 million asset as compared to a $51.3 million asset at January 30,2016 . Based on the composition of the assets held and obligations of the UK Plan as of January 28, 2017 , a 10 basis point change in the discount rate would havechanged the funded status of the UK Plan by approximately $3.8 million. The estimated net periodic pension cost in Fiscal 2017 would have changed byapproximately $0.6 million if a 10 basis point change in the discount rate and expected long-term rate of return on plan assets were to occur.
Accounting changes and recent accounting standards
For a description of accounting changes and recent accounting standards, including the expected dates of adoption and estimated effects, if any, on ourconsolidated financial statements, see Note 2 in Item 8 of this Annual Report on Form 10-K.
76

Table of Contents
ITEM 7A. QUANTITATIVE AND QUALITATIVE DISCLOSURES ABOUT MARKET RISK
Signet is exposed to market risk arising from fluctuations in foreign currency exchange rates, interest rates and precious metal prices, which could affect itsconsolidated financial position, earnings and cash flows. Signet monitors and manages these market exposures as a fundamental part of its overall risk managementprogram, which recognizes the volatility of financial markets and seeks to reduce the potentially adverse effects of this volatility on Signet’s operating results.Signet manages its exposure to market risk through its regular operating and financing activities and, when deemed appropriate, through the use of derivativefinancial instruments. Signet uses derivative financial instruments as risk management tools and not for trading purposes.
As certain of the UK Jewelry division’s purchases are denominated in US dollars and its net cash flows are in British pounds, Signet’s policy is to enter intoforward foreign currency exchange contracts and foreign currency swaps to manage the exposure to the US dollar. Signet also hedges a significant portion offorecasted merchandise purchases using commodity forward contracts. Additionally, the Zale division occasionally enters into forward foreign currency exchangecontracts to manage the currency fluctuations associated with purchases for our Canadian operations. These contracts are entered into with large, reputablefinancial institutions, thereby minimizing the credit exposure from our counterparties.
Signet has significant amounts of cash and cash equivalents invested at several financial institutions. The amount invested at each financial institution takes intoaccount the long-term credit rating and size of the financial institution. The interest rates earned on cash and cash equivalents will fluctuate in line with short-terminterest rates.
MARKET RISK MANAGEMENT POLICY
A committee of the Board is responsible for the implementation of market risk management policies within the treasury policies and guidelines framework, whichare deemed to be appropriate by the Board for the management of market risk.
Signet’s exposure to market risk is managed by Signet’s Treasury Committee, consisting of Signet’s Chief Executive Officer, Chief Financial Officer, Senior VicePresident - Tax and Treasury, Senior Vice President - Controller and Treasurer. Where deemed necessary to achieve the objective of reducing market risk volatilityon Signet’s operating results, certain derivative instruments are entered into after review and approval by the Treasury Committee. Signet uses derivative financialinstruments for risk management purposes only.
A description of Signet’s accounting policies for derivative instruments is included in Note 1 of Item 8. Signet’s current portfolio of derivative financialinstruments consists of an interest rate swap, forward foreign currency exchange contracts, commodity forward purchase contracts and net zero-cost collararrangements. An analysis quantifying the fair value change in derivative financial instruments held by Signet to manage its exposure to interest rates, foreignexchange rates and commodity prices is detailed in Note 17 of Item 8.
Foreign Currency Exchange Rate Risk
Approximately 91% of Signet’s total assets were held in entities whose functional currency is the US dollar at January 28, 2017 and generated approximately 86%of its sales and 94% of its operating income in US dollars in Fiscal 2017 . All remaining assets, sales and operating income are in UK British pounds and Canadiandollars.
In translating the results of the UK Jewelry division and the Canadian subsidiary of the Zale Jewelry segment, Signet’s results are subject to fluctuations in theexchange rates between the US dollar and both the British pound and Canadian dollar. Any depreciation in the weighted average value of the US dollar against theBritish pound or Canadian dollar could increase reported revenues and operating profit and any appreciation in the weighted average value of the US dollar againstthe British pound or Canadian dollar could decrease reported revenues and operating profit.
The UK Jewelry division buys certain products and materials on international markets that are priced in US dollars, and therefore has an exposure to exchangerates on the cost of goods sold. Signet uses certain derivative financial instruments to hedge a portion of this exposure within treasury guidelines approved by theBoard.
Signet holds a fluctuating amount of British pounds reflecting the cash generating characteristics of the UK Jewelry division. Signet’s objective is to minimize netforeign exchange exposure to the income statement on British pound denominated items through managing this level of cash, British pound denominatedintercompany balances and US dollar to British pound swaps. In order to manage the foreign exchange exposure and minimize the level of British pound cash heldby Signet, the British pound denominated subsidiaries pay dividends regularly to their immediate holding companies and excess British pounds are sold inexchange for US dollars.
Commodity Price Risk
Signet’s results are subject to fluctuations in the cost of diamonds, gold and certain other precious metals which are key raw material components of the productssold by Signet.
It is Signet’s policy to minimize the impact of precious metal commodity price volatility on operating results through the use of commodity forward purchasecontracts, or by entering into either purchase options or net zero-cost collar arrangements, within treasury guidelines approved by the Board.
77

Table of Contents
Interest Rate Risk
Signet’s interest income or expense is exposed to volatility in interest rates. This exposure is driven by both the currency denomination of the cash or debt, the mixof fixed and floating rate debt used, the type of cash investments and the total amount of cash and debt outstanding. As of January 28, 2017 , a hypothetical 100basis point increase in interest rates would result in additional annual interest expense of approximately $7.3 million , including the effect of the interest rate swapdesignated as a cash flow hedge.
Sensitivity Analysis
Management has used a sensitivity analysis technique that measures the change in the fair value of Signet’s financial instruments from hypothetical changes inmarket rates as shown in the table below.
Fair value changes arising from:
(in millions)
Fair Value January 28,
2017 10 basis pointdecrease in
interest rates
10% depreciation
of $ against £
10% depreciation
of $ against C$
10% depreciation
of gold prices
Fair Value January 30, 2016
Foreign exchange contracts $ 3.0 $ — $ (2.1) $ (4.6) $ — $ 0.6Commodity contracts (3.4) — — — (11.2) (0.2)Interest rate swap 0.4 (0.3) — — — (3.4)
The amounts generated from the sensitivity analysis quantify the impact of market risk assuming that certain adverse market conditions, specified in the tableabove, occur. They are not forward-looking estimates of market risk. Actual results in the future are likely to differ materially from those projected due to changesin the portfolio of financial instruments held and actual developments in the global financial markets.
Any changes in the portfolio of financial instruments held and developments in the global financial markets may cause fluctuations in interest rates, exchange ratesand precious metal prices to exceed the hypothetical amounts disclosed in the table above. The sensitivity scenarios are intended to allow an expected risk measureto be applied to the scenarios, as opposed to the scenarios themselves being an indicator of the maximum expected risk.
The fair value of derivative financial instruments is determined based on market value equivalents at period end, taking into account the current interest rateenvironment, current foreign currency forward rates or current commodity forward rates.
The estimated changes in the fair value for foreign exchange rates are based on a 10% depreciation of the US dollar against British pound and Canadian dollarfrom the levels applicable at January 28, 2017 with all other variables remaining constant.
78
Table of Contents
ITEM 8. FINANCIAL STATEMENTS AND SUPPLEMENTARY DATA
Report of Independent Registered Public Accounting Firm
The Board of Directors and Shareholders
Signet Jewelers Limited:
We have audited the accompanying consolidated balance sheets of Signet Jewelers Limited and subsidiaries (Signet) as of January 28, 2017 and January 30, 2016,and the related consolidated income statements, statements of comprehensive income, statements of cash flows, and statements of shareholders’ equity for each ofthe 52 week periods ended January 28, 2017, January 30, 2016, and January 31, 2015. We also have audited Signet’s internal control over financial reporting as ofJanuary 28, 2017, based on criteria established in Internal Control - Integrated Framework (2013) issued by the Committee of Sponsoring Organizations of theTreadway Commission (COSO). Signet’s management is responsible for these consolidated financial statements, for maintaining effective internal control overfinancial reporting, and for its assessment of the effectiveness of internal control over financial reporting, included in management’s annual report on internalcontrol over financial reporting included in Item 9A. Our responsibility is to express an opinion on these consolidated financial statements and an opinion on theCompany’s internal control over financial reporting based on our audits.
We conducted our audits in accordance with the standards of the Public Company Accounting Oversight Board (United States). Those standards require that weplan and perform the audits to obtain reasonable assurance about whether the financial statements are free of material misstatement and whether effective internalcontrol over financial reporting was maintained in all material respects. Our audits of the consolidated financial statements included examining, on a test basis,evidence supporting the amounts and disclosures in the financial statements, assessing the accounting principles used and significant estimates made bymanagement, and evaluating the overall financial statement presentation. Our audit of internal control over financial reporting included obtaining an understandingof internal control over financial reporting, assessing the risk that a material weakness exists, and testing and evaluating the design and operating effectiveness ofinternal control based on the assessed risk. Our audits also included performing such other procedures as we considered necessary in the circumstances. We believethat our audits provide a reasonable basis for our opinions.
A company’s internal control over financial reporting is a process designed to provide reasonable assurance regarding the reliability of financial reporting and thepreparation of financial statements for external purposes in accordance with generally accepted accounting principles. A company’s internal control over financialreporting includes those policies and procedures that (1) pertain to the maintenance of records that, in reasonable detail, accurately and fairly reflect thetransactions and dispositions of the assets of the company; (2) provide reasonable assurance that transactions are recorded as necessary to permit preparation offinancial statements in accordance with generally accepted accounting principles, and that receipts and expenditures of the company are being made only inaccordance with authorizations of management and directors of the company; and (3) provide reasonable assurance regarding prevention or timely detection ofunauthorized acquisition, use, or disposition of the company’s assets that could have a material effect on the financial statements.
Because of its inherent limitations, internal control over financial reporting may not prevent or detect misstatements. Also, projections of any evaluation ofeffectiveness to future periods are subject to the risk that controls may become inadequate because of changes in conditions, or that the degree of compliance withthe policies or procedures may deteriorate.
In our opinion, the consolidated financial statements referred to above present fairly, in all material respects, the financial position of Signet as of January 28, 2017and January 30, 2016, and the results of its operations and its cash flows for each of the 52 week periods ended January 28, 2017, January 30, 2016 and January 31,2015, in conformity with U.S. generally accepted accounting principles. Also in our opinion, Signet maintained, in all material respects, effective internal controlover financial reporting as of January 28, 2017, based on criteria established in Internal Control - Integrated Framework (2013) issued by the Committee ofSponsoring Organizations of the Treadway Commission (COSO).
/s/ KPMG LLP
Cleveland, OhioMarch 16, 2017
79

Table of Contents
SIGNET JEWELERS LIMITED
CONSOLIDATED INCOME STATEMENTS
(in millions, except per share amounts) Fiscal 2017 Fiscal 2016 Fiscal 2015 Notes
Sales $ 6,408.4 $ 6,550.2 $ 5,736.3 4Cost of sales (4,047.6) (4,109.8) (3,662.1)
Gross margin 2,360.8 2,440.4 2,074.2 Selling, general and administrative expenses (1,880.2) (1,987.6) (1,712.9) Other operating income, net 282.6 250.9 215.3 10
Operating income 763.2 703.7 576.6 4Interest expense, net (49.4) (45.9) (36.0)
Income before income taxes 713.8 657.8 540.6 Income taxes (170.6) (189.9) (159.3) 9
Net income 543.2 467.9 381.3 Dividends on redeemable convertible preferred shares (11.9) — — 6
Net income attributable to common shareholders $ 531.3 $ 467.9 $ 381.3
Earnings per common share: Basic $ 7.13 $ 5.89 $ 4.77 7Diluted $ 7.08 $ 5.87 $ 4.75 7
Weighted average common shares outstanding: Basic 74.5 79.5 79.9 7Diluted 76.7 79.7 80.2 7
Dividends declared per common share $ 1.04 $ 0.88 $ 0.72 6
The accompanying notes are an integral part of these consolidated financial statements.
80
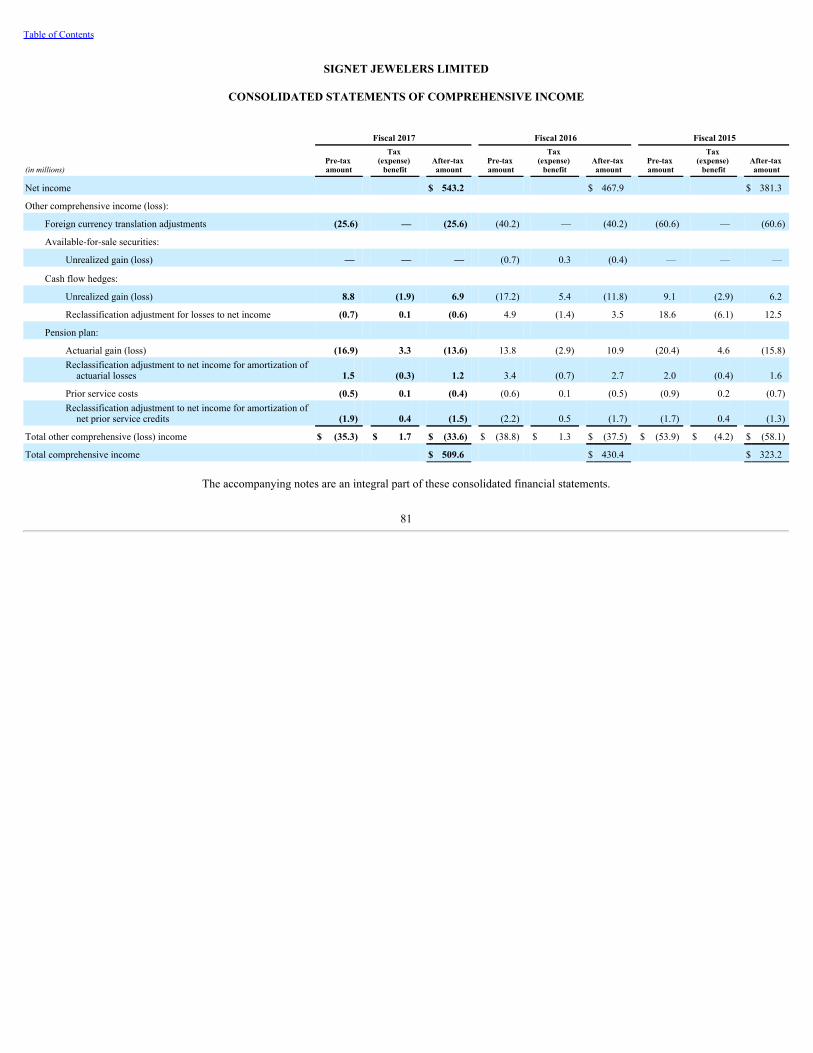
Table of Contents
SIGNET JEWELERS LIMITED
CONSOLIDATED STATEMENTS OF COMPREHENSIVE INCOME
Fiscal 2017 Fiscal 2016 Fiscal 2015
(in millions)Pre-tax amount
Tax (expense)
benefit After-tax amount Pre-tax
amount Tax
(expense) benefit After-tax
amount Pre-tax amount
Tax (expense)
benefit After-tax amount
Net income $ 543.2 $ 467.9 $ 381.3
Other comprehensive income (loss):
Foreign currency translation adjustments (25.6) — (25.6) (40.2) — (40.2) (60.6) — (60.6)
Available-for-sale securities:
Unrealized gain (loss) — — — (0.7) 0.3 (0.4) — — —
Cash flow hedges:
Unrealized gain (loss) 8.8 (1.9) 6.9 (17.2) 5.4 (11.8) 9.1 (2.9) 6.2
Reclassification adjustment for losses to net income (0.7) 0.1 (0.6) 4.9 (1.4) 3.5 18.6 (6.1) 12.5
Pension plan:
Actuarial gain (loss) (16.9) 3.3 (13.6) 13.8 (2.9) 10.9 (20.4) 4.6 (15.8)Reclassification adjustment to net income for amortization of
actuarial losses 1.5 (0.3) 1.2 3.4 (0.7) 2.7 2.0 (0.4) 1.6
Prior service costs (0.5) 0.1 (0.4) (0.6) 0.1 (0.5) (0.9) 0.2 (0.7)Reclassification adjustment to net income for amortization of
net prior service credits (1.9) 0.4 (1.5) (2.2) 0.5 (1.7) (1.7) 0.4 (1.3)
Total other comprehensive (loss) income $ (35.3) $ 1.7 $ (33.6) $ (38.8) $ 1.3 $ (37.5) $ (53.9) $ (4.2) $ (58.1)
Total comprehensive income $ 509.6 $ 430.4 $ 323.2
The accompanying notes are an integral part of these consolidated financial statements.
81

Table of Contents
SIGNET JEWELERS LIMITED
CONSOLIDATED BALANCE SHEETS
(in millions, except par value per share amount)January 28,
2017 January 30,
2016 Notes
Assets As adjusted 2Current assets:
Cash and cash equivalents $ 98.7 $ 137.7 1Accounts receivable, net 1,858.0 1,756.4 11Other receivables 95.9 84.0 Other current assets 136.3 152.6 Income taxes 4.4 3.5 Inventories 2,449.3 2,453.9 12
Total current assets 4,642.6 4,588.1 Non-current assets: Property, plant and equipment, net 822.9 727.6 13Goodwill 517.6 515.5 14Intangible assets, net 417.0 427.8 14Other assets 165.1 154.6 15Deferred tax assets 0.7 — 9Retirement benefit asset 31.9 51.3 19Total assets $ 6,597.8 $ 6,464.9 Liabilities and Shareholders’ equity Current liabilities:
Loans and overdrafts $ 91.1 $ 57.7 20Accounts payable 255.7 269.1 Accrued expenses and other current liabilities 478.2 498.3 21Deferred revenue 276.9 260.3 22Income taxes 101.8 65.7
Total current liabilities 1,203.7 1,151.1 Non-current liabilities: Long-term debt 1,317.9 1,321.0 20Other liabilities 213.7 230.5 23Deferred revenue 659.0 629.1 22Deferred tax liabilities 101.4 72.5 9Total liabilities 3,495.7 3,404.2
Commitments and contingencies 25Series A redeemable convertible preferred shares of $0.01 par value: 500 shares authorized,
0.625 shares outstanding 611.9 — 5Shareholders’ equity:
Common shares of $0.18 par value: authorized 500 shares, 68.3 shares outstanding (2016: 79.4 outstanding) 15.7 15.7 6
Additional paid-in capital 280.7 279.9 Other reserves 0.4 0.4 Treasury shares at cost: 18.9 shares (2016: 7.8 shares) (1,494.8) (495.8) 6Retained earnings 3,995.9 3,534.6 6Accumulated other comprehensive loss (307.7) (274.1) 8
Total shareholders’ equity 2,490.2 3,060.7 Total liabilities, redeemable convertible preferred shares and shareholders’ equity $ 6,597.8 $ 6,464.9
The accompanying notes are an integral part of these consolidated financial statements.
82

Table of Contents
SIGNET JEWELERS LIMITED
CONSOLIDATED STATEMENTS OF CASH FLOWS
(in millions) Fiscal 2017 Fiscal 2016 Fiscal 2015
Cash flows from operating activities: Net income $ 543.2 $ 467.9 $ 381.3Adjustments to reconcile net income to net cash provided by operating activities:
Depreciation and amortization 188.8 175.3 149.7Amortization of unfavorable leases and contracts (19.7) (28.7) (23.7)Pension benefit (1.6) — (2.4)Share-based compensation 8.0 16.4 12.1Deferred taxation 27.7 25.0 (47.6)Excess tax benefit from exercise of share awards (2.4) (6.9) (11.8)Amortization of debt discount and issuance costs 2.8 3.6 7.4Other non-cash movements 0.4 3.6 2.7Changes in operating assets and liabilities:
Increase in accounts receivable (102.7) (189.8) (194.6)Increase in other receivables and other assets (20.4) (44.1) (18.0)Decrease (increase) in other current assets 13.5 (26.5) (35.5)Increase in inventories (9.7) (46.0) (121.6)(Decrease) increase in accounts payable (7.0) (6.4) 23.7(Decrease) increase in accrued expenses and other liabilities (21.8) 51.8 64.8Increase in deferred revenue 43.6 76.3 102.3Increase (decrease) in income taxes payable 38.9 (25.7) (1.6)
Pension plan contributions (3.3) (2.5) (4.2)Net cash provided by operating activities 678.3 443.3 283.0
Investing activities Purchase of property, plant and equipment (278.0) (226.5) (220.2)Purchase of available-for-sale securities (10.4) (6.2) (5.7)Proceeds from sale of available-for-sale securities 10.0 4.0 2.5Acquisition of Zale Corporation, net of cash acquired — — (1,429.2)
Net cash used in investing activities (278.4) (228.7) (1,652.6)Financing activities
Dividends paid on common shares (75.6) (67.1) (55.3)Proceeds from issuance of common shares 2.1 5.0 6.1Proceeds from issuance of redeemable convertible preferred shares, net of issuance costs 611.3 — —Excess tax benefit from exercise of share awards 2.4 6.9 11.8Proceeds from senior notes — — 398.4Proceeds from term loan — — 400.0Repayments of term loan (16.4) (25.0) (10.0)Proceeds from securitization facility 2,404.1 2,303.9 1,941.9Repayments of securitization facility (2,404.1) (2,303.9) (1,341.9)Proceeds from revolving credit facility 1,270.0 316.0 260.0Repayments of revolving credit facility (1,214.0) (316.0) (260.0)Payment of debt issuance costs (2.7) — (20.5)Repurchase of common shares (1,000.0) (130.0) (29.8)Net settlement of equity based awards (4.9) (8.3) (18.4)Principal payments under capital lease obligations (0.2) (1.0) (0.8)Proceeds from (repayment of) short-term borrowings (10.2) (47.1) 39.4
Net cash (used in) provided by financing activities (438.2) (266.6) 1,320.9Cash and cash equivalents at beginning of period 137.7 193.6 247.6Decrease in cash and cash equivalents (38.3) (52.0) (48.7)

Effect of exchange rate changes on cash and cash equivalents (0.7) (3.9) (5.3)Cash and cash equivalents at end of period $ 98.7 $ 137.7 $ 193.6
Non-cash investing activities: Capital expenditures in accounts payable $ 9.2 $ 9.3 $ 6.2
Supplemental cash flow information: Interest paid $ 47.1 $ 41.6 $ 25.4Income taxes paid $ 104.0 $ 180.1 $ 208.8
The accompanying notes are an integral part of these consolidated financial statements.
83

Table of Contents
SIGNET JEWELERS LIMITED
CONSOLIDATED STATEMENTS OF SHAREHOLDERS’ EQUITY
(in millions)
Common shares at par value
Additional paid-in capital
Other reserves
Treasury shares
Retained earnings
Accumulated other
comprehensive (loss) income
Total shareholders’
equity
Balance at February 1, 2014 $ 15.7 $ 258.8 $ 0.4 $ (346.2) $ 2,812.9 $ (178.5) $ 2,563.1Net income — — — — 381.3 — 381.3Other comprehensive loss — — — — — (58.1) (58.1)Dividends on common shares — — — — (57.7) — (57.7)Repurchase of common shares — — — (29.8) — — (29.8)Net settlement of equity based awards — (3.0) — (3.2) (0.4) — (6.6)Share options exercised — (2.7) — 9.2 (0.4) — 6.1Share-based compensation expense — 12.1 — — — — 12.1
Balance at January 31, 2015 15.7 265.2 0.4 (370.0) 3,135.7 (236.6) 2,810.4Net income — — — — 467.9 — 467.9Other comprehensive loss — — — — — (37.5) (37.5)Dividends on common shares — — — — (70.2) — (70.2)Repurchase of common shares — — — (130.0) — — (130.0)Net settlement of equity based awards — (1.5) — (1.1) 1.3 — (1.3)Share options exercised — (0.2) — 5.3 (0.1) — 5.0Share-based compensation expense — 16.4 — — — — 16.4
Balance at January 30, 2016 15.7 279.9 0.4 (495.8) 3,534.6 (274.1) 3,060.7Net income — — — — 543.2 — 543.2Other comprehensive loss — — — — — (33.6) (33.6)Dividends on common shares — — — — (75.9) — (75.9)Dividends on redeemable convertible
preferred shares — — — — (11.9) — (11.9)Repurchase of common shares — — — (1,000.0) — — (1,000.0)Net settlement of equity based awards — (7.2) — (1.1) 5.9 — (2.4)Share options exercised — — — 2.1 — — 2.1Share-based compensation expense — 8.0 — — — — 8.0
Balance at January 28, 2017 $ 15.7 $ 280.7 $ 0.4 $ (1,494.8) $ 3,995.9 $ (307.7) $ 2,490.2
The accompanying notes are an integral part of these consolidated financial statements.
84

Table of Contents
SIGNET JEWELERS LIMITED
NOTES TO THE CONSOLIDATED FINANCIAL STATEMENTS
1 . Organization and summary of significant accounting policies
Signet Jewelers Limited (“Signet” or the “Company”), a holding company incorporated in Bermuda, is the world’s largest retailer of diamond jewelry. TheCompany operates through its 100% owned subsidiaries with sales primarily in the United States (“US”), United Kingdom (“UK”) and Canada. Signet manages itsbusiness as five reportable segments: the Sterling Jewelers division, the Zale division, which consists of the Zale Jewelry and Piercing Pagoda segments, the UKJewelry division and Other. The “Other” reportable segment consists of all non-reportable segments, including subsidiaries involved in the purchasing andconversion of rough diamonds to polished stones and unallocated corporate administrative functions. See Note 4 for additional discussion of the Company’ssegments.
Signet’s sales are seasonal, with the first quarter slightly exceeding 20% of annual sales, the second and third quarters each approximating 20% and the fourthquarter accounting for almost 40% of annual sales, with December being by far the most important month of the year. The “Holiday Season” consists of results forthe months of November and December. As a result, approximately 45% to 55% of Signet’s annual operating income normally occurs in the fourth quarter,comprised of nearly all of the UK Jewelry and Zale divisions’ annual operating income and about 40% to 45% of the Sterling Jewelers division’s annual operatingincome.
The Company has evaluated events and transactions for potential recognition or disclosure through the date the financial statements were issued. There are nomaterial related party transactions. The following accounting policies have been applied consistently in the preparation of the Company’s financial statements.
(a) Basis of preparation
The consolidated financial statements of Signet are prepared in accordance with US generally accepted accounting principles (“US GAAP”) and include the resultsfor the 52 week period ended January 28, 2017 (“ Fiscal 2017 ”), as Signet’s fiscal year ends on the Saturday nearest to January 31. The comparative periods arefor the 52 week period ended January 30, 2016 (“ Fiscal 2016 ”) and the 52 week period ended January 31, 2015 (“ Fiscal 2015 ”). Intercompany transactions andbalances have been eliminated in consolidation. Certain prior year amounts have been reclassified to conform to the current year presentation.
(b) Use of estimates
The preparation of these consolidated financial statements, in conformity with US GAAP and US Securities and Exchange Commission (“SEC”) regulations,requires management to make estimates and assumptions that affect the reported amounts of assets and liabilities, disclosure of contingent assets and liabilities atthe date of the consolidated financial statements and reported amounts of revenues and expenses during the reported period. Actual results could differ from thoseestimates. Estimates and assumptions are primarily made in relation to the valuation of accounts receivable, inventories, deferred revenue, derivatives, employeebenefits, income taxes, contingencies, asset impairments, indefinite-lived intangible assets, as well as depreciation and amortization of long-lived assets.
The reported results of operations are not indicative of results expected in future periods.
(c) Foreign currency translation
The financial position and operating results of certain foreign operations, including the UK Jewelry division and the Canadian operations of the Zale Jewelrysegment, are consolidated using the local currency as the functional currency. Assets and liabilities are translated at the rates of exchange on the balance sheet date,and revenues and expenses are translated at the monthly average rates of exchange during the period. Resulting translation gains or losses are included in theaccompanying consolidated statements of shareholders’ equity as a component of accumulated other comprehensive income (loss) (“AOCI”). Gains or lossesresulting from foreign currency transactions are included within the consolidated income statements, whereas translation adjustments and gains or losses related tointercompany loans of a long-term investment nature are recognized as a component of AOCI.
See Note 8 for additional discussion of the Company’s foreign currency translation.
(d) Revenue recognition
The Company recognizes revenue when there is persuasive evidence of an arrangement, delivery of products has occurred or services have been rendered, the saleprice is fixed and determinable, and collectability is reasonably assured. The Company’s revenue streams and their respective accounting treatments are discussedbelow.
Merchandise sale and repairs
Store sales are recognized when the customer receives and pays for the merchandise at the store with cash, in-house customer finance, private label credit cardprograms or a third party credit card. For online sales shipped to customers, sales are recognized at the estimated time the customer has received the merchandise.Amounts related to shipping and handling that are billed to customers are reflected in sales and the related costs are reflected in cost of sales. Revenues on the saleof merchandise are reported net of anticipated returns and sales tax collected. Returns are
85

Table of Contents
estimated based on previous return rates experienced. Any deposits received from a customer for merchandise are deferred and recognized as revenue when thecustomer receives the merchandise. Revenues derived from providing replacement merchandise on behalf of insurance organizations are recognized upon receiptof the merchandise by the customer. Revenues on repair of merchandise are recognized when the service is complete and the customer collects the merchandise atthe store.
Extended service plans and lifetime warranty agreements (“ESP”)
The Company recognizes revenue related to ESP sales in proportion to when the expected costs will be incurred. The deferral period for ESP sales in each divisionis determined from patterns of claims costs, including estimates of future claims costs expected to be incurred. Management reviews the trends in claims to assesswhether changes are required to the revenue and cost recognition rates utilized. A significant change in estimates related to the time period or pattern in whichwarranty-related costs are expected to be incurred could materially impact revenues. All direct costs associated with the sale of these plans are deferred andamortized in proportion to the revenue recognized and disclosed as either other current assets or other assets in the consolidated balance sheets.
The Sterling Jewelers division sells ESP, subject to certain conditions, to perform repair work over the life of the product. Revenue from the sale of the lifetimeESP is recognized consistent with the estimated pattern of claim costs expected to be incurred by the Company in connection with performing under the ESPobligations. Based on an evaluation of historical claims data, management currently estimates that substantially all claims will be incurred within 17 years of thesale of the warranty contract.
In the second quarter of Fiscal 2016, an operational change related to the Sterling Jewelers division’s ESP associated with ring sizing was made to further alignZale and Sterling ESP policies. As a result, revenue from the sale of these lifetime ESP in the Sterling Jewelers division is deferred and recognized over 17 yearsfor all plans, with approximately 57% of revenue recognized within the first two years for plans sold on or after May 2, 2015 ( January 30, 2016 : 57% ) and 42%of revenue recognized within the first two years for plans sold prior to May 2, 2015 ( January 30, 2016 : 42% ; January 31, 2015 : 45% ).
The Zale division also sells ESP. Zale Jewelry customers are offered lifetime warranties on certain products that cover sizing and breakage with an option topurchase theft protection for a two-year period. Revenue from the sale of lifetime ESP is deferred and recognized over 10 years, with approximately 69% ofrevenue recognized within the first two years ( January 30, 2016 : 69% ; January 31, 2015 : 69% ). Revenues related to the optional theft protection are deferredand recognized in proportion to when the expected claims costs will be incurred over the two-year contract period. Zale Jewelry customers are also offered a two-year watch warranty and a one-year warranty that covers breakage. Piercing Pagoda customers are also offered a one-year warranty that covers breakage. Revenuefrom the two-year watch warranty and one-year breakage warranty is recognized on a straight-line basis over the respective contract terms.
The Sterling Jewelers division also sells a Jewelry Replacement Plan (“JRP”). The JRP is designed to protect customers from damage or defects of purchasedmerchandise for a period of three years. If the purchased merchandise is defective or becomes damaged under normal use in that time period, the item will bereplaced. JRP revenue is deferred and recognized on a straight-line basis over the period of expected claims costs.
Signet also sells warranty agreements in the capacity of an agent on behalf of a third-party. The commission that Signet receives from the third-party is recognizedat the time of sale less an estimate of cancellations based on historical experience.
Sale vouchers
Certain promotional offers award sale vouchers to customers who make purchases above a certain value, which grant a fixed discount on a future purchase within astated time frame. The Company accounts for such vouchers by allocating the fair value of the voucher between the initial purchase and the future purchase usingthe relative-selling-price method. Sale vouchers are not sold on a stand-alone basis. The fair value of the voucher is determined based on the average salestransactions in which the vouchers were issued, when the vouchers are expected to be redeemed and the estimated voucher redemption rate. The fair valueallocated to the future purchase is recorded as deferred revenue.
Consignment inventory sales
Sales of consignment inventory are accounted for on a gross sales basis as the Company is the primary obligor providing independent advice, guidance and after-sales service to customers. The products sold from consignment inventory are indistinguishable from other products that are sold to customers and are sold on thesame terms. Supplier products are selected at the discretion of the Company. The Company is responsible for determining the selling price, physical security of theproducts and collections of accounts receivable.
(e) Cost of sales and selling, general and administrative expenses
Cost of sales includes merchandise costs net of discounts and allowances, freight, processing and distribution costs of moving merchandise from suppliers todistribution centers and stores inclusive of payroll, inventory shrinkage, store operating and occupancy costs, net bad debts and charges for late payments under thein-house customer finance programs. Store operating and occupancy costs include utilities, rent, real estate taxes, common area maintenance charges anddepreciation. Selling, general and administrative expenses include store staff and store administrative costs; centralized administrative expenses, includinginformation technology and credit; advertising and promotional costs and other operating expenses not specifically categorized elsewhere in the consolidatedincome statements.
86

Table of Contents
Compensation and benefits costs included within cost of sales and selling, general and administrative expenses were as follows:
(in millions) Fiscal 2017 Fiscal 2016 Fiscal 2015
Wages and salaries $ 1,183.2 $ 1,222.8 $ 1,095.6Payroll taxes 96.5 101.1 91.8Employee benefit plans 19.3 17.5 9.6Share-based compensation 8.0 16.4 12.1
Total compensation and benefits $ 1,307.0 $ 1,357.8 $ 1,209.1
(f) Store opening costs
The opening costs of new locations are expensed as incurred.
(g) Advertising and promotional costs
Advertising and promotional costs are expensed within selling, general and administrative expenses. Production costs are expensed at the first communication ofthe advertisements, while communication expenses are recognized each time the advertisement is communicated. For catalogs and circulars, costs are all expensedat the first date they can be viewed by the customer. Point of sale promotional material is expensed when first displayed in the stores. Gross advertising coststotaled $380.6 million in Fiscal 2017 ( Fiscal 2016 : $384.2 million ; Fiscal 2015 : $333.0 million ).
(h) In-house customer finance programs
Sterling Jewelers division operates customer in-house finance programs that allow customers to finance merchandise purchases from its stores. Finance charges arerecognized in accordance with the contractual agreements. Gross interest earned is recorded as other operating income in the consolidated income statements. SeeNote 10 for additional discussion of the Company’s other operating income. In addition to interest-bearing accounts, a portion of credit sales are made usinginterest-free financing for one year or less, subject to certain conditions.
Accrual of interest is suspended when accounts become more than 90 days aged on a recency basis. Upon suspension of the accrual of interest, interest income issubsequently recognized to the extent cash payments are received. Accrual of interest is resumed when receivables are removed from the non-accrual status.
(i) Income taxes
Income taxes are accounted for using the asset and liability method, which requires the recognition of deferred tax assets and liabilities for the expected future taxconsequences of events that have been included in the consolidated financial statements. Under this method, deferred tax assets and liabilities are recognized byapplying statutory tax rates in effect in the years in which the differences between the financial reporting and tax filing bases of existing assets and liabilities areexpected to reverse. The effect of a change in tax rates on deferred tax assets and liabilities is recognized in income in the period that includes the enactment date.A valuation allowance is established against deferred tax assets when it is more likely than not that some portion or all of the deferred tax assets will not berealized, based on management’s evaluation of all available evidence, both positive and negative, including reversals of deferred tax liabilities, projected futuretaxable income and results of recent operations.
The Company does not recognize tax benefits related to positions taken on certain tax matters unless the position is more likely than not to be sustained uponexamination by tax authorities. At any point in time, various tax years are subject to or are in the process of being audited by various taxing authorities. TheCompany records a reserve for uncertain tax positions, including interest and penalties. To the extent that management’s estimates of settlements change, or thefinal tax outcome of these matters is different than the amounts recorded, such differences will impact the income tax provision in the period in which suchdeterminations are made.
See Note 9 for additional discussion of the Company’s income taxes.
(j) Cash and cash equivalents
Cash and cash equivalents are comprised of cash on hand, money market deposits and amounts placed with external fund managers with an original maturity ofthree months or less. Cash and cash equivalents are carried at cost which approximates fair value. In addition, receivables from third-party credit card issuerstypically converted to cash within 5 days of the original sales transaction are considered cash equivalents.
The following table summarizes the details of the Company’s cash and cash equivalents:
(in millions)January 28,
2017 January 30,
2016
Cash and cash equivalents held in money markets and other accounts $ 65.6 $ 100.4Cash equivalents from third-party credit card issuers 31.1 35.4Cash on hand 2.0 1.9
Total cash and cash equivalents $ 98.7 $ 137.7
87

Table of Contents
(k) Accounts receivable
Accounts receivable under the customer finance programs are presented net of an allowance for uncollectible amounts. This allowance represents management’sestimate of the expected losses in the accounts receivable portfolio as of the balance sheet date, and is calculated using a model that analyzes factors such asdelinquency rates and recovery rates. An allowance for amounts 90 days aged and under on a recency basis is established based on historical loss experience andpayment performance information. A 100% allowance is made for any amount aged more than 90 days on a recency basis and any amount associated with anaccount the owner of which has filed for bankruptcy.
Signet’s recency method of aging has been in place and unchanged since the inception of the in-house consumer financing program. The delinquency level ismeasured by the number of days since the last qualifying payment was received, with the qualifying payment increasing with delinquency level. The averageminimum scheduled payment on a customer account is 8% . The minimum payment does not decline as the balance declines.
See Note 11 for additional discussion of the Company’s accounts receivables.
(l) Inventories
Inventories are primarily held for resale and are valued at the lower of cost or market value. Cost is determined using weighted-average cost for all inventoriesexcept for inventories held in the Company’s diamond sourcing operations, where cost is determined using specific identification. Cost includes charges directlyrelated to bringing inventory to its present location and condition. Such charges would include warehousing, security, distribution and certain buying costs. Marketvalue is defined as estimated selling price less all estimated costs of completion and costs to be incurred in marketing, selling and distribution. Inventory reservesare recorded for obsolete, slow moving or defective items and shrinkage. Inventory reserves for obsolete, slow moving or defective items are calculated as thedifference between the cost of inventory and its estimated market value based on targeted inventory turn rates, future demand, management strategy and marketconditions. Due to the inventory being primarily comprised of precious stones and metals including gold, the age of the inventory has a limited impact on theestimated market value. Inventory reserves for shrinkage are estimated and recorded based on historical physical inventory results, expectations of future inventorylosses and current inventory levels. Physical inventories are taken at least once annually for all store locations and distribution centers.
See Note 12 for additional discussion of the Company’s inventories.
(m) Vendor contributions
Contributions are received from vendors through various programs and arrangements including cooperative advertising. Where vendor contributions related toidentifiable promotional events are received, contributions are matched against the costs of promotions. Vendor contributions received as general contributions andnot related to specific promotional events are recognized as a reduction of inventory costs.
(n) Property, plant and equipment
Property, plant and equipment are stated at cost less accumulated depreciation, amortization and impairment charges. Maintenance and repair costs are expensed asincurred. Depreciation and amortization are recognized on the straight-line method over the estimated useful lives of the related assets as follows:
Buildings 30 – 40 years when land is owned or the remaining term of lease, not to exceed 40 yearsLeasehold improvements Remaining term of lease, not to exceed 10 yearsFurniture and fixtures Ranging from 3 – 10 yearsEquipment and software Ranging from 3 – 5 years
Computer software purchased or developed for internal use is stated at cost less accumulated amortization. Signet’s policy provides for the capitalization ofexternal direct costs of materials and services associated with developing or obtaining internal use computer software. In addition, Signet also capitalizes certainpayroll and payroll-related costs for employees directly associated with internal use computer projects. Amortization is charged on a straight-line basis overperiods from three to five years.
Property, plant and equipment are reviewed for impairment whenever events or circumstances indicate that the carrying amount of an asset may not be recoverable.Potentially impaired assets or asset groups are identified by reviewing the cash flows of individual stores. Recoverability of assets to be held and used is measuredby a comparison of the carrying amount of an asset to estimated undiscounted future cash flows expected to be generated by the asset, based on the Company’sinternal business plans. If the undiscounted cash flow is less than the asset’s carrying amount, the impairment charge recognized is determined by estimating thefair value of the assets and recording a loss for the amount that the carrying value exceeds the estimated fair value. The Company utilizes historical experience,internal business plans and an appropriate discount rate to estimate the fair value. Property and equipment at stores planned for closure are depreciated over arevised estimate of their useful lives.
See Note 13 for additional discussion of the Company’s property, plant and equipment.
88

Table of Contents
(o) Goodwill and intangibles
In a business combination, the Company estimates and records the fair value of identifiable intangible assets and liabilities acquired. The fair value of theseintangible assets and liabilities is estimated based on management’s assessment, including determination of appropriate valuation technique and consideration ofany third party appraisals, when necessary. Significant estimates in valuing intangible assets and liabilities acquired include, but are not limited to, future expectedcash flows associated with the acquired asset or liability, expected life and discount rates. The excess purchase price over the estimated fair values of the assetsacquired and liabilities assumed is recognized as goodwill. Goodwill is recorded by the Company’s reporting units based on the acquisitions made by each.Goodwill is evaluated for impairment annually and more frequently if indicators of impairment arise. In evaluating goodwill for impairment, the Company firstassesses qualitative factors to determine whether it is more likely than not that the fair value of a reporting unit is less than its carrying value (including goodwill).If the Company concludes that it is not more likely than not that the fair value of a reporting unit is less than its carrying value, then no further testing is required.However, if the Company concludes that it is more likely than not that the fair value of a reporting unit is less than its carrying value, then the two-step goodwillimpairment test is performed to identify a potential goodwill impairment and measure the amount of impairment to be recognized, if any. The two-step impairmenttest involves estimating the fair value of all assets and liabilities of the reporting unit, including the implied fair value of goodwill, through either estimateddiscounted future cash flows or market-based methodologies.
The annual testing date for goodwill allocated to the Sterling Jewelers reporting unit is the last day of the fourth quarter. The annual testing date for goodwillallocated to the reporting units associated with the Zale division and the Other reporting unit is May 31. There have been no goodwill impairment charges recordedduring the fiscal periods presented in the consolidated financial statements as financial results for the reporting units have met or exceeded financial projectionsdeveloped at the time of the acquisitions. If future economic conditions are different than those projected by management, future impairment charges may berequired.
Intangible assets with definite lives are amortized and reviewed for impairment whenever events or circumstances indicate that the carrying amount of the assetmay not be recoverable. If the estimated undiscounted future cash flows related to the asset are less than the carrying amount, the Company recognizes animpairment charge equal to the difference between the carrying value and the estimated fair value, usually determined by the estimated discounted future cashflows of the asset.
Intangible assets with indefinite lives are reviewed for impairment each year in the second quarter and may be reviewed more frequently if certain events occur orcircumstances change. The Company first performs a qualitative assessment to determine whether it is more likely than not that the indefinite-lived intangible assetis impaired. If the Company determines that it is more likely than not that the fair value of the asset is less than its carrying amount, the Company estimates the fairvalue, usually determined by the estimated discounted future cash flows of the asset, compares that value with its carrying amount and records an impairmentcharge, if any. If future economic conditions are different than those projected by management, future impairment charges may be required.
See Note 14 for additional discussion of the Company’s goodwill and intangibles.
(p) Derivatives and hedge accounting
The Company enters into various types of derivative instruments to mitigate certain risk exposures related to changes in commodity costs and foreign exchangerates. Derivative instruments are recorded in the consolidated balance sheets at fair value, as either assets or liabilities, with an offset to net income or othercomprehensive income (“OCI”), depending on whether the derivative qualifies as an effective hedge.
If a derivative instrument meets certain criteria, it may be designated as a cash flow hedge on the date it is entered into. For cash flow hedge transactions, theeffective portion of the changes in fair value of the derivative instrument is recognized directly in equity as a component of AOCI and is recognized in theconsolidated income statements in the same period(s) and on the same financial statement line in which the hedged item affects net income. Amounts excludedfrom the effectiveness calculation and any ineffective portions of the change in fair value of the derivatives are recognized immediately in other operating income,net in the consolidated income statements. In addition, gains and losses on derivatives that do not qualify for hedge accounting are recognized immediately in otheroperating income, net.
In the normal course of business, the Company may terminate cash flow hedges prior to the occurrence of the underlying forecasted transaction. For cash flowhedges terminated prior to the occurrence of the underlying forecasted transaction, management monitors the probability of the associated forecasted cash flowtransactions to assess whether any gain or loss recorded in AOCI should be immediately recognized in net income. Cash flows from derivative contracts areincluded in net cash provided by operating activities.
See Note 17 for additional discussion of the Company’s derivatives and hedge activities.
(q) Employee Benefits
Signet operates a defined benefit pension plan in the UK (the “UK Plan”) which ceased to admit new employees effective April 2004. The UK Plan providesbenefits to participating eligible employees. Beginning in Fiscal 2014, a change to the benefit structure was implemented and members’ benefits that accumulateafter that date are now based upon career average salaries, whereas previously, all benefits were based on salaries at retirement. The UK Plan’s assets are held bythe UK Plan.
89

Table of Contents
The net periodic pension cost of the UK Plan is measured on an actuarial basis using the projected unit credit method and several actuarial assumptions, the mostsignificant of which are the discount rate and the expected long-term rate of return on plan assets. Other material assumptions include rates of participant mortality,the expected long-term rate of compensation and pension increases, and rates of employee attrition. Gains and losses occur when actual experience differs fromactuarial assumptions. If such gains or losses exceed 10% of the greater of plan assets or plan liabilities, Signet amortizes those gains or losses over the averageremaining service period of the employees. The net periodic pension cost is charged to selling, general and administrative expenses in the consolidated incomestatements.
The funded status of the UK Plan is recognized on the balance sheet, and is the difference between the fair value of plan assets and the projected benefit obligationmeasured at the balance sheet date. Gains or losses and prior service costs or credits that arise and are not included as components of net periodic pension cost arerecognized, net of tax, in OCI.
Signet also operates a defined contribution plan in the UK and a defined contribution retirement savings plan in the US. Contributions made by Signet to thesepension arrangements are charged primarily to selling, general and administrative expenses in the consolidated income statements as incurred.
See Note 19 for additional discussion of the Company’s employee benefits.
(r) Borrowing costs
Borrowings include interest-bearing bank loans, accounts receivable securitization program and bank overdrafts. Borrowing costs are capitalized and amortizedinto interest expense over the contractual term of the related loan.
See Note 20 for additional discussion of the Company’s borrowing costs.
(s) Share-based compensation
Signet measures share-based compensation cost for awards classified as equity at the grant date based on the estimated fair value of the award and recognizes thecost as an expense on a straight-line basis (net of estimated forfeitures) over the requisite service period of employees. Certain share plans include a conditionwhereby vesting is contingent on growth exceeding a given target, and therefore awards granted with this condition are considered to be performance-basedawards.
Signet estimates fair value using a Black-Scholes model for awards granted under the Omnibus Plan and the binomial valuation model for awards granted underthe Share Saving Plans. Deferred tax assets for awards that result in deductions on the income tax returns of subsidiaries are recorded by Signet based on theamount of compensation cost recognized and the subsidiaries’ statutory tax rate in the jurisdiction in which it will receive a deduction. Differences between thedeferred tax assets recognized for financial reporting purposes and the actual tax deduction reported on the subsidiaries’ income tax return are recorded inadditional paid-in-capital (if the tax deduction exceeds the deferred tax asset) or in the income statement (if the deferred tax asset exceeds the tax deduction and noadditional paid-in-capital exists from previous awards).
Share-based compensation is primarily recorded in selling, general and administrative expenses in the consolidated income statements, along with the relevantsalary cost.
See Note 24 for additional discussion of the Company’s share-based compensation plans.
(t) Contingent liabilities
Provisions for contingent liabilities are recorded for probable losses when management is able to reasonably estimate the loss or range of loss. When it isreasonably possible that a contingent liability may result in a loss or additional loss, the range of the loss is disclosed.
See Note 25 for additional discussion of the Company’s contingencies.
(u) Leases
Signet’s operating leases generally include retail store locations. Certain operating leases include predetermined rent increases, which are charged to the incomestatement on a straight-line basis over the lease term, including any construction period or other rental holiday. Other amounts paid under operating leases, such ascontingent rentals, taxes and common area maintenance, are charged to the income statement as incurred. Premiums paid to acquire short-term leasehold propertiesand inducements to enter into a lease are recognized on a straight-line basis over the lease term. In addition, certain leases provide for contingent rentals that arenot measurable at inception. These contingent rentals are primarily based on a percentage of sales in excess of a predetermined level. These amounts are excludedfrom minimum rent and are included in the determination of rent expense when it is probable that the expense has been incurred and the amount is reasonablyestimable.
See Note 25 for additional discussion of the Company’s leases.
(v) Common shares
New shares are recorded in common shares at their par value when issued. The excess of the issue price over the par value is recorded in additional paid-in capital.
90

Table of Contents
(w) Preferred shares
On October 5, 2016 , the Company issued 625,000 shares of Series A Convertible Preference Shares (“preferred shares”) for an aggregate price of $625.0 million .The preferred shares were issued under an effective registration statement filed with the SEC. The accounting guidance under Financial Accounting StandardsBoard (“FASB”) Accounting Standards Codification (“ASC”) Topic 480, “Distinguishing Liabilities from Equity,” requires preferred securities that areredeemable for cash or other assets to be classified outside of permanent equity if redeemable at a fixed or determinable price on a fixed or determinable date, atthe option of the holder, or upon the occurrence of an event that is not solely within the control of the issuer. The Company's preferred shares were classified astemporary equity and recorded in the consolidated balance sheet at fair value upon issuance.
See Note 5 for additional information regarding the Company's preferred shares.
(x) Dividends
Dividends on common shares are reflected as a reduction of retained earnings in the period in which they are formally declared by the Board of Directors (the“Board”). In addition, the cumulative dividends on preferred shares, whether or not declared, are reflected as a reduction of retained earnings.
2 . New accounting pronouncements
New accounting pronouncements adopted during the period
Share-based compensation
In June 2014, the FASB issued Accounting Standards Update (“ASU”) No. 2014-12, “Compensation - Stock Compensation (Topic 718): Accounting for Share-Based Payments When the Terms of an Award Provide That a Performance Target Could Be Achieved after the Requisite Service Period.” The new guidancerequires that a performance target that affects vesting and that could be achieved after the requisite service period be treated as a performance condition. As such,the performance target should not be reflected in estimating the grant-date fair value of the award. ASU No. 2014-12 is effective for annual periods, and interimperiods within those annual periods, beginning after December 15, 2015, with early adoption permitted. Signet adopted this guidance during Fiscal 2017 . Theadoption of this guidance did not have a material impact on the Company’s financial position or results of operations.
Debt issuance costs
In April 2015, the FASB issued ASU No. 2015-03, “Interest - Imputation of Interest (Subtopic 835-30): Simplifying the Presentation of Debt Issuance Costs.” Thenew guidance requires that debt issuance costs related to a recognized debt liability be presented on the balance sheet as a direct deduction from the debt liability,similar to the presentation of debt discounts. In August 2015, the FASB issued ASU No. 2015-15, “Interest - Imputation of Interest (Subtopic 835-30): Simplifyingthe Presentation of Debt Issuance Costs.” The new guidance provides clarity that the SEC would not object to the deferral and presentation of debt issuance costsrelated to line-of-credit arrangements as an asset and subsequently amortizing the deferred debt issuance costs ratably over the term of the line-of-creditarrangement. ASU Nos. 2015-03 and 2015-15 are effective for annual periods, and interim periods within those annual periods, beginning after December 15,2015, with early adoption permitted. Signet adopted this guidance during Fiscal 2017 . Accordingly, the Company adjusted the consolidated balance sheet as ofJanuary 30, 2016 by reducing total assets and debt for amounts classified as deferred debt issuance costs of $9.5 million . Signet continues to present debt issuancecosts relating to its revolving credit facility and asset-backed securitization facility as other assets in the consolidated balance sheets.
See Note 20 for additional discussion of the Company's debt issuance costs.
New accounting pronouncements to be adopted in future periods
Credit losses
In June 2016, the FASB issued ASU No. 2016-13, “Financial Instruments - Credit Losses (Topic 326): Measurement of Credit Losses on Financial Instruments.”The new guidance requires entities to measure and recognize expected credit losses for financial assets measured at amortized cost basis. The estimate of expectedcredit losses should consider historical information, current information, and reasonable and supportable forecasts of expected losses over the remainingcontractual life that affect collectibility. ASU No. 2016-13 is effective for annual periods, and interim periods within those annual periods, beginning afterDecember 15, 2019, with early adoption permitted. Signet currently expects to adopt this guidance when effective, and continues to assess the impact the adoptionof this guidance will have on the Company’s financial position or results of operations.
Revenue recognition
In May 2014, the FASB issued ASU No. 2014-09, “Revenue from Contracts with Customers (Topic 606).” The new guidance affects any entity that either entersinto contracts with customers to transfer goods or services or enters into contracts for the transfer of nonfinancial assets, unless those contracts are within the scopeof other standards (for example, insurance contracts or lease contracts). The core principle of the guidance is that an entity should recognize revenue to depict thetransfer of promised goods or services to customers in an amount that reflects the consideration
91

Table of Contents
to which the entity expects to be entitled in exchange for those goods or services. ASU No. 2014-09 provides alternative methods of retrospective adoption. InAugust 2015, the FASB issued an update (ASU No. 2015-14) that defers the effective date by one year. As a result, ASU No. 2014-09 is effective for annualperiods, and interim periods within those annual periods, beginning after December 15, 2017, with early adoption permitted for annual periods beginning afterDecember 15, 2016, including interim periods within that annual period.
There are many aspects of this new accounting guidance that are still being interpreted. The FASB has recently issued updates to certain aspects of the guidance toaddress implementation issues. In March 2016, the FASB issued additional guidance concerning “Principal versus Agent” considerations (reporting revenue grossversus net); in April 2016, the FASB issued additional guidance on identifying performance obligations and licensing; and in May 2016, the FASB issuedadditional guidance on collectibility, noncash consideration, presentation of sales tax, and transition. These updates are intended to improve the operability andunderstandability of the implementation guidance and have the same effective date and transition requirements as ASU No. 2014-09 guidance discussed above.
Signet is in the process of evaluating contracts with customers under the new guidance and cannot currently estimate the financial statement impact of adoption.The Company expects to progress through its assessment during Fiscal 2018 and will adopt this guidance in the first quarter of our fiscal year ending February 2,2019. A decision has not yet been made regarding the transition method the Company will use to adopt the new guidance.
Inventory
In July 2015, the FASB issued ASU No. 2015-11, “Inventory (Topic 330): Simplifying the Measurement of Inventory.” The new guidance states that inventorywill be measured at the lower of cost and net realizable value. The ASU defines net realizable value as the estimated selling prices in the ordinary course ofbusiness, less reasonably predictable costs of completion, disposal and transportation. ASU No. 2015-11 is effective for annual periods, and interim periods withinthose annual periods, beginning after December 15, 2016. Signet plans to adopt this guidance in the first quarter of Fiscal 2018. Signet does not expect the adoptionof this guidance to have a material impact on the Company’s financial position or results of operations.
Financial instruments
In January 2016, the FASB issued ASU No. 2016-01, “Financial Instruments - Overall (Subtopic 825-10): Recognition and Measurement of Financial Assets andFinancial Liabilities.” The new guidance primarily impacts accounting for equity investments and financial liabilities under the fair value option, as well as, thepresentation and disclosure requirements for financial instruments. Under the new guidance, equity investments will generally be measured at fair value, withsubsequent changes in fair value recognized in net income. ASU No. 2016-01 is effective for annual periods, and interim periods within those annual periods,beginning after December 15, 2017. Signet plans to adopt this guidance in the first quarter of our fiscal year ending February 2, 2019. Signet does not expect theadoption of this guidance to have a material impact on the Company’s financial position or results of operations.
Leases
In February 2016, the FASB issued ASU No. 2016-02, “Leases (Topic 842).” The new guidance primarily impacts lessee accounting by requiring the recognitionof a right-of-use asset and a corresponding lease liability on the balance sheet for long-term lease agreements. The lease liability will be equal to the present valueof all reasonably certain lease payments. The right-of-use asset will be based on the liability, subject to adjustment for initial direct costs. Lease agreements that are12 months or less are permitted to be excluded from the balance sheet. In general, leases will be amortized on a straight-line basis with the exception of financelease agreements. ASU No. 2016-02 is effective for annual periods, and interim periods within those annual periods, beginning after December 15, 2018, withearly adoption permitted. Signet is currently assessing the timing of adoption which is effective for the first quarter of our fiscal year ending February 1, 2020 andthe impact that adopting this guidance will have on the Company’s financial position or results of operations.
Liabilities
In March 2016, the FASB issued ASU No. 2016-04, “Liabilities - Extinguishments of Liabilities (Subtopic 405-20).” The new guidance addresses diversity inpractice related to the derecognition of a prepaid stored-value product liability. Liabilities related to the sale of prepaid stored-value products within the scope ofthis update are financial liabilities. ASU No. 2016-04 is effective for annual periods, and interim periods within those annual periods, beginning after December 15,2017, with early adoption permitted. Signet plans to adopt this guidance in the first quarter of our fiscal year ending February 2, 2019. Signet does not expect theadoption of this guidance to have a material impact on the Company’s financial position or results of operations.
Share-based compensation
In March 2016, the FASB issued ASU No. 2016-09, “Compensation - Stock Compensation (Topic 718): Improvements to Employee Share-Based PaymentAccounting.” The new guidance simplifies several aspects of the accounting for share-based payment transactions, including the income tax consequences,classification of awards as either equity or liabilities, and classification on the statement of cash flows. ASU No. 2016-09 is effective for annual periods, andinterim periods within those annual periods, beginning after December 15, 2016. This guidance is effective for Signet in the first quarter of Fiscal 2018. Signetdoes not expect the adoption of this guidance to have a material impact on the Company’s financial position or results of operations.
92
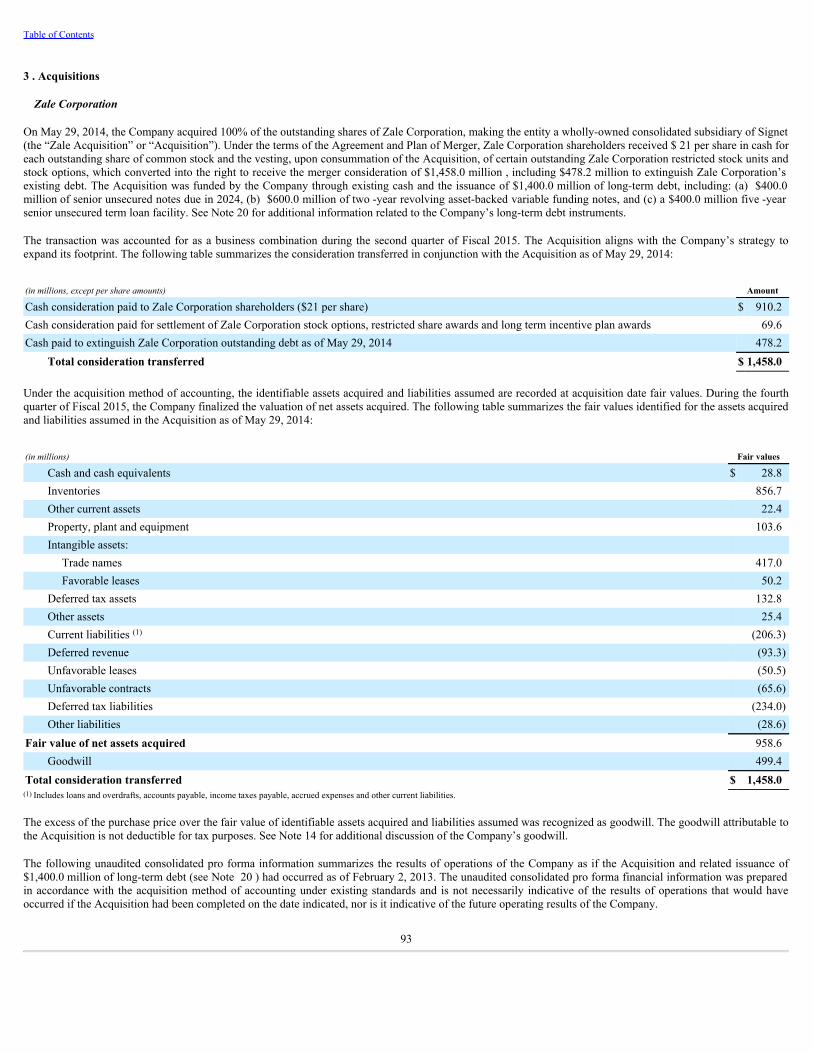
Table of Contents
3 . Acquisitions
Zale Corporation
On May 29, 2014, the Company acquired 100% of the outstanding shares of Zale Corporation, making the entity a wholly-owned consolidated subsidiary of Signet(the “Zale Acquisition” or “Acquisition”). Under the terms of the Agreement and Plan of Merger, Zale Corporation shareholders received $ 21 per share in cash foreach outstanding share of common stock and the vesting, upon consummation of the Acquisition, of certain outstanding Zale Corporation restricted stock units andstock options, which converted into the right to receive the merger consideration of $1,458.0 million , including $478.2 million to extinguish Zale Corporation’sexisting debt. The Acquisition was funded by the Company through existing cash and the issuance of $1,400.0 million of long-term debt, including: (a) $400.0million of senior unsecured notes due in 2024, (b) $600.0 million of two -year revolving asset-backed variable funding notes, and (c) a $400.0 million five -yearsenior unsecured term loan facility. See Note 20 for additional information related to the Company’s long-term debt instruments.
The transaction was accounted for as a business combination during the second quarter of Fiscal 2015. The Acquisition aligns with the Company’s strategy toexpand its footprint. The following table summarizes the consideration transferred in conjunction with the Acquisition as of May 29, 2014:
(in millions, except per share amounts) Amount
Cash consideration paid to Zale Corporation shareholders ($21 per share) $ 910.2Cash consideration paid for settlement of Zale Corporation stock options, restricted share awards and long term incentive plan awards 69.6Cash paid to extinguish Zale Corporation outstanding debt as of May 29, 2014 478.2
Total consideration transferred $ 1,458.0
Under the acquisition method of accounting, the identifiable assets acquired and liabilities assumed are recorded at acquisition date fair values. During the fourthquarter of Fiscal 2015, the Company finalized the valuation of net assets acquired. The following table summarizes the fair values identified for the assets acquiredand liabilities assumed in the Acquisition as of May 29, 2014:
(in millions) Fair values
Cash and cash equivalents $ 28.8Inventories 856.7Other current assets 22.4Property, plant and equipment 103.6Intangible assets:
Trade names 417.0Favorable leases 50.2
Deferred tax assets 132.8Other assets 25.4Current liabilities (1) (206.3)Deferred revenue (93.3)Unfavorable leases (50.5)Unfavorable contracts (65.6)Deferred tax liabilities (234.0)Other liabilities (28.6)
Fair value of net assets acquired 958.6Goodwill 499.4
Total consideration transferred $ 1,458.0(1) Includes loans and overdrafts, accounts payable, income taxes payable, accrued expenses and other current liabilities.
The excess of the purchase price over the fair value of identifiable assets acquired and liabilities assumed was recognized as goodwill. The goodwill attributable tothe Acquisition is not deductible for tax purposes. See Note 14 for additional discussion of the Company’s goodwill.
The following unaudited consolidated pro forma information summarizes the results of operations of the Company as if the Acquisition and related issuance of$1,400.0 million of long-term debt (see Note 20 ) had occurred as of February 2, 2013. The unaudited consolidated pro forma financial information was preparedin accordance with the acquisition method of accounting under existing standards and is not necessarily indicative of the results of operations that would haveoccurred if the Acquisition had been completed on the date indicated, nor is it indicative of the future operating results of the Company.
93

Table of Contents
(in millions, except per share amounts) Fiscal 2015
Pro forma sales $ 6,325.1Pro forma net income $ 462.1Pro forma earnings per share – basic $ 5.78Pro forma earnings per share – diluted $ 5.76
The unaudited pro forma information gives effect to actual operating results prior to the Acquisition and has been adjusted with respect to certain aspects of theAcquisition to reflect the following:
• Acquisition accounting adjustments to reset deferred revenue associated with extended service plans sold by Zale Corporation prior to the Acquisition tofair value as of the acquisition date. The fair value of deferred revenue is determined based on the estimated costs remaining to be incurred for futureobligations associated with the outstanding plans at the time of the Acquisition, plus a reasonable profit margin on the estimated costs. These adjustmentsalso reflect the impact of deferring the revenue associated with the lifetime extended service plans over a 10 -year period as disclosed in Note 1 .
• Additional depreciation and amortization expenses that would have been recognized assuming fair value adjustments to the existing Zale Corporationassets acquired and liabilities assumed, including intangible assets, favorable and unfavorable leases, and unfavorable contracts and expense associatedwith the fair value step-up of inventory acquired.
• Tax impact of the Company’s amended capital structure as a result of the Acquisition and related issuance of $1,400.0 million of long-term debt.
• Adjustment of valuation allowances associated with US and Canadian deferred tax assets, including net operating loss carryforwards.
• Exclusion of acquisition-related costs of $58.0 million , which were included in the Company’s results of operations for the year ended January 31, 2015,respectively. Also excluded were costs associated with the unsecured bridge facility discussed in Note 20 of $4.0 million , which were expensed in Fiscal2015. All amounts were reported within the Other segment.
The unaudited pro forma results do not reflect future events that either have occurred or may occur after the Acquisition, including, but not limited to, theanticipated realization of expected operating synergies in subsequent periods. They also do not give effect to acquisition-related costs that the Company expects toincur in connection with the Acquisition, including, but not limited to, additional professional fees, employee integration, retention and severance costs.
4 . Segment information
Financial information for each of Signet’s reportable segments is presented in the tables below. Signet’s chief operating decision maker utilizes sales and operatingincome, after the elimination of any inter-segment transactions, to determine resource allocations and performance assessment measures. Signet’s sales are derivedfrom the retailing of jewelry, watches, other products and services as generated through the management of its five reportable segments: the Sterling Jewelersdivision, the Zale division, which consists of the Zale Jewelry and Piercing Pagoda segments, the UK Jewelry division and Other.
The Sterling Jewelers division operates in all 50 US states. Its stores operate nationally in malls and off-mall locations principally as Kay Jewelers (“Kay”), KayJewelers Outlet, Jared The Galleria Of Jewelry (“Jared”) and Jared Vault. The division also operates a variety of mall-based regional brands.
The Zale division operates jewelry stores (Zale Jewelry) and kiosks (Piercing Pagoda), located primarily in shopping malls throughout the US, Canada and PuertoRico. Zale Jewelry includes the US store brand Zales (Zales Jewelers and Zales Outlet), which operates in all 50 US states, and the Canadian store brand PeoplesJewellers, which operates in nine provinces. The division also operates regional brands Gordon’s Jewelers and Mappins. Piercing Pagoda operates through mall-based kiosks.
The UK Jewelry division operates stores in the UK, Republic of Ireland and Channel Islands. Its stores operate in shopping malls and off-mall locations (i.e. highstreet) principally as H.Samuel and Ernest Jones.
The Other reportable segment consists of all non-reportable segments, including subsidiaries involved in the purchasing and conversion of rough diamonds topolished stones, that are below the quantifiable threshold for separate disclosure as a reportable segment and unallocated corporate administrative functions.
94
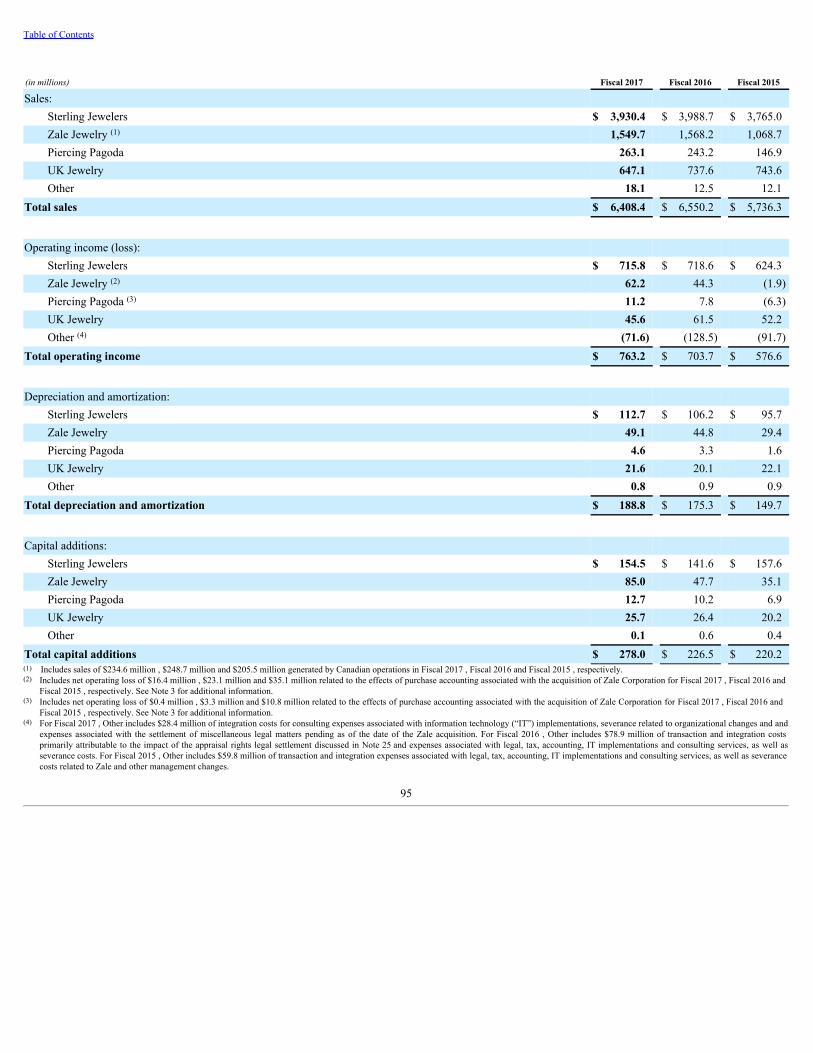
Table of Contents
(in millions) Fiscal 2017 Fiscal 2016 Fiscal 2015
Sales: Sterling Jewelers $ 3,930.4 $ 3,988.7 $ 3,765.0Zale Jewelry (1) 1,549.7 1,568.2 1,068.7Piercing Pagoda 263.1 243.2 146.9UK Jewelry 647.1 737.6 743.6Other 18.1 12.5 12.1
Total sales $ 6,408.4 $ 6,550.2 $ 5,736.3
Operating income (loss): Sterling Jewelers $ 715.8 $ 718.6 $ 624.3Zale Jewelry (2) 62.2 44.3 (1.9)Piercing Pagoda (3) 11.2 7.8 (6.3)UK Jewelry 45.6 61.5 52.2Other (4) (71.6) (128.5) (91.7)
Total operating income $ 763.2 $ 703.7 $ 576.6
Depreciation and amortization: Sterling Jewelers $ 112.7 $ 106.2 $ 95.7Zale Jewelry 49.1 44.8 29.4Piercing Pagoda 4.6 3.3 1.6UK Jewelry 21.6 20.1 22.1Other 0.8 0.9 0.9
Total depreciation and amortization $ 188.8 $ 175.3 $ 149.7
Capital additions: Sterling Jewelers $ 154.5 $ 141.6 $ 157.6Zale Jewelry 85.0 47.7 35.1Piercing Pagoda 12.7 10.2 6.9UK Jewelry 25.7 26.4 20.2Other 0.1 0.6 0.4
Total capital additions $ 278.0 $ 226.5 $ 220.2(1) Includes sales of $234.6 million , $248.7 million and $205.5 million generated by Canadian operations in Fiscal 2017 , Fiscal 2016 and Fiscal 2015 , respectively.(2) Includes net operating loss of $16.4 million , $23.1 million and $35.1 million related to the effects of purchase accounting associated with the acquisition of Zale Corporation for Fiscal 2017 , Fiscal 2016 and
Fiscal 2015 , respectively. See Note 3 for additional information.(3) Includes net operating loss of $0.4 million , $3.3 million and $10.8 million related to the effects of purchase accounting associated with the acquisition of Zale Corporation for Fiscal 2017 , Fiscal 2016 and
Fiscal 2015 , respectively. See Note 3 for additional information.(4) For Fiscal 2017 , Other includes $28.4 million of integration costs for consulting expenses associated with information technology (“IT”) implementations, severance related to organizational changes and and
expenses associated with the settlement of miscellaneous legal matters pending as of the date of the Zale acquisition. For Fiscal 2016 , Other includes $78.9 million of transaction and integration costsprimarily attributable to the impact of the appraisal rights legal settlement discussed in Note 25 and expenses associated with legal, tax, accounting, IT implementations and consulting services, as well asseverance costs. For Fiscal 2015 , Other includes $59.8 million of transaction and integration expenses associated with legal, tax, accounting, IT implementations and consulting services, as well as severancecosts related to Zale and other management changes.
95

Table of Contents
(in millions)January 28,
2017 January 30,
2016
Total assets: Sterling Jewelers $ 4,015.4 $ 3,788.0Zale Jewelry 1,940.7 1,955.1Piercing Pagoda 141.6 141.8UK Jewelry 372.6 427.8Other 127.5 152.2
Total assets $ 6,597.8 $ 6,464.9
Total long-lived assets: Sterling Jewelers $ 567.3 $ 519.7Zale Jewelry 1,050.1 1,013.7Piercing Pagoda 61.4 53.3UK Jewelry 70.7 75.3Other 8.0 8.9
Total long-lived assets $ 1,757.5 $ 1,670.9
Total liabilities: Sterling Jewelers $ 2,061.4 $ 1,982.2Zale Jewelry 524.3 530.3Piercing Pagoda 28.2 28.5UK Jewelry 110.6 132.0Other 771.2 731.2
Total liabilities $ 3,495.7 $ 3,404.2
(in millions) Fiscal 2017 Fiscal 2016 Fiscal 2015
Sales by product: Diamonds and diamond jewelry $ 3,853.7 $ 3,918.1 $ 3,450.6Gold, silver jewelry, other products and services 2,090.0 2,116.4 1,784.5Watches 464.7 515.7 501.2
Total sales $ 6,408.4 $ 6,550.2 $ 5,736.3
5 . Redeemable preferred shares
On October 5, 2016 , the Company issued 625,000 preferred shares to Green Equity Investors VI, L.P., Green Equity Investors Side VI, L.P., LGP Associates VI-ALLC and LGP Associates VI-B LLC, all affiliates of Leonard Green & Partners, L.P., (together, the “Investors”) for an aggregate purchase price of $625.0 million ,or $1,000 per share (the “Stated Value”) pursuant to the investment agreement dated August 24, 2016. In connection with the issuance of the preferred shares, theCompany incurred direct and incremental expenses of $13.7 million , including financial advisory fees, closing costs, legal expenses and other offering-relatedexpenses. These direct and incremental expenses originally reduced the preferred shares carrying value, and are accreted through retained earnings as a deemeddividend from the date of issuance through the first possible known redemption date, November 2024. Accretion relating to these fees of $0.6 million was recordedin the consolidated balance sheet as of January 28, 2017 .
96

Table of Contents
Dividend rights: The preferred shares rank senior to the Company’s common shares, with respect to dividend rights and rights on the distribution of assets on anyvoluntary or involuntary liquidation, dissolution or winding up of the affairs of the Company. The liquidation preference for preferred shares is equal to the greaterof (a) the Stated Value per share, plus all accrued but unpaid dividends and (b) the consideration holders would have received if preferred shares were convertedinto common shares immediately prior to the liquidation. As of January 28, 2017 , the liquidation preference was $636.3 million . Preferred shareholders areentitled to a cumulative dividend at the rate of 5% per annum, payable quarterly in arrears, commencing on February 15, 2017, either in cash or by increasing theStated Value at the option of the Company. In addition, preferred shareholders were entitled to receive dividends or distributions declared or paid on commonshares on an as-converted basis, other than the Company’s regularly declared quarterly cash dividends not in excess of 130% of the arithmetic average of theregular, quarterly cash dividends per common share, if any, declared by the Company during the preceding four calendar quarters.
On November 2, 2016, the Board of Directors approved certain changes to the rights of the preferred shareholders, including the following: (a) elimination of theright of preferred shareholders to receive dividends or other distributions declared on the Company’s common shares and inclusion of adjustments to theconversion rate in the event of any dividend, distribution, spin-off or certain other events or transactions in respect of the common shares; and (b) addition of arequirement for approval by the holders of the majority of the issued preferred shares for the declaration or payment by the Company of any dividends or otherdistributions on the common shares other than (i) regularly declared quarterly cash dividends paid on the issued common shares in any calendar quarter in anamount per share that is not more than 130% of the arithmetic average of the regular, quarterly cash dividends per common share, if any, declared by the Companyduring the preceding four calendar quarters for such quarter and (ii) any dividends or other distributions which are paid or distributed at the same time on thecommon shares and the preferred shares, provided that the amount paid or distributed to the preferred shares is based on the number of common shares into whichsuch preferred shares could be converted on the applicable record date for such dividends or other distributions.
Conversion features: Preferred shares are convertible at the option of the holders at any time into common shares at the then applicable conversion rate. Theconversion rate of 10.6529 common shares per preferred share was established as the Stated Value divided by the defined conversion price of $93.8712 . As ofJanuary 28, 2017 , the maximum number of common shares that could be required to be issued if converted was 6.7 million shares. The conversion rate is subjectto certain anti-dilution and other adjustments, including stock split / reverse stock split transactions, regular dividends declared on common shares, sharerepurchases (excluding amounts through open market transactions or accelerated share repurchases) and issuances of common shares or other securities convertibleinto common shares. The initial issuance did not include a beneficial conversion feature as the conversion price used to set the conversion ratio at the time ofissuance was greater than the Company’s common stock price.
At any time on or after October 5, 2018, all or a portion of outstanding preferred shares are convertible at the option of the Company if the closing price ofcommon shares exceeds 175% of the then applicable conversion price for at least 20 consecutive trading days.
Redemption rights: At any time after November 15, 2024, the Company will have the right to redeem any or all, and the holders of the preferred shares will havethe right to require the Company to repurchase any or all, of the preferred shares for cash at a price equal to the Stated Value plus all accrued but unpaid dividends.Upon certain change of control or delisting events involving the Company, preferred shareholders can require the Company to repurchase, subject to certainexceptions, all or any portion of its preferred shares at (a) an amount in cash equal to 101% of the Stated Value plus all accrued but unpaid dividends or (b) theconsideration the holders would have received if they had converted their preferred shares into common shares immediately prior to the change of control event.
Voting rights: Preferred shareholders are entitled to vote with the holders of common shares on an as-converted basis. Holders of preferred shares are entitled to aseparate class vote with respect to certain designee(s) for election to the Company’s Board of Directors, amendments to the Company’s organizational documentsthat have an adverse effect on the preferred shareholders and issuances by the Company of securities that are senior to, or equal in priority with, the preferredshares.
Registration rights: Preferred shareholders have certain customary registration rights with respect to the preferred shares and the shares of common shares intowhich they are converted, pursuant to the terms of a registration rights agreement.
6 . Common shares, treasury shares, reserves and dividends
Common shares
The par value of each Common Share is 18 cent s. The consideration received for common shares relating to options issued during Fiscal 2017 was $2.1 million (Fiscal 2016 : $5.0 million ; Fiscal 2015 : $6.1 million ).
Treasury shares
Signet may from time to time repurchase common shares under various share repurchase programs authorized by Signet’s Board. Repurchases may be made in theopen market, through block trades, accelerated share repurchase agreements or otherwise. The timing, manner, price and amount of any repurchases will bedetermined by the Company at its discretion, and will be subject to economic and market conditions, stock prices, applicable legal requirements and other factors.The repurchase programs are funded through Signet’s existing cash reserves and liquidity sources. Repurchased shares are held as treasury shares and may be usedby Signet for general corporate purposes.
97

Table of Contents
Treasury shares represent the cost of shares that the Company purchased in the market under the applicable authorized repurchase program, shares forfeited underthe Omnibus Incentive Plan and those previously held by the Employee Stock Ownership Trust (“ESOT”) to satisfy options under the Company’s share optionplans.
In February 2016, the Board authorized the repurchase of Signet’s common shares up to $750.0 million (the “2016 Program”). In August 2016, the Board increasedits authorized share repurchase program by $625.0 million , bringing the total authorization for the 2016 Program to $1,375.0 million . The 2016 Program may besuspended or discontinued at any time without notice.
On October 5, 2016, the Company entered into an accelerated share repurchase agreement (“ASR”) with a large financial institution to repurchase $525.0 millionof the Company’s common shares. At inception, the Company paid $525.0 million to the financial institution and took delivery of 4.7 million shares with an initialestimated cost of $367.5 million . In December 2016, the ASR was finalized and the Company received an additional 1.3 million shares. Total shares repurchasedunder the ASR were 6.0 million shares at an average purchase price of $87.01 per share based on the volume-weighted average price of the Company’s commonshares traded during the pricing period, less an agreed discount.
The Company reflected shares delivered as treasury shares as of the date the shares were physically delivered in computing the weighted average common sharesoutstanding for both basic and diluted earnings per share. The ASR was accounted for as a treasury stock transaction and a forward stock purchase contract. Theforward stock purchase contract was determined to be indexed to the Company’s own stock and met all of the applicable criteria for equity classification.
During Fiscal 2017 , the Company also repurchased 5.2 million common shares through open market transactions for a total cost of $475.0 million . The sharerepurchase activity is outlined in the table below:
Fiscal 2017 Fiscal 2016 Fiscal 2015
(in millions, expect per share amounts)Amount
authorized Shares repurchased Amount
repurchased
Average repurchase price per
share Shares repurchased Amount
repurchased
Average repurchase price per
share Shares repurchased Amount
repurchased
Average repurchase price per
share
2016 Program (1) $ 1,375.0 10.0 $ 864.4 $ 86.40 n/a n/a n/a n/a n/a n/a2013 Program (2) $ 350.0 1.2 $ 135.6 $ 111.26 1.0 $ 130.0 $ 127.63 0.3 $ 29.8 $ 103.37
Total 11.2 $ 1,000.0 $ 89.10 1.0 $ 130.0 $ 127.63 0.3 $ 29.8 $ 103.37(1) The 2016 Program had $510.6 million remaining as of January 28, 2017 .(2) The 2013 Program was completed in May 2016.n/a Not applicable.
Shares held in treasury by the Company as of January 28, 2017 and January 30, 2016 were 18.9 million and 7.8 million , respectively. Shares were reissued in theamounts of 0.1 million and 0.2 million , net of taxes and forfeitures, in Fiscal 2017 and Fiscal 2016 , respectively, to satisfy awards outstanding under existingshare-based compensation plans.
Dividends on common shares
Fiscal 2017 Fiscal 2016 Fiscal 2015
(in millions, except per share amounts)Cash dividend
per share Total
dividends Cash dividend
per share Total
dividends Cash dividend
per share Total
dividends
First quarter $ 0.26 $ 20.4 $ 0.22 $ 17.6 $ 0.18 $ 14.4Second quarter 0.26 19.7 0.22 17.6 0.18 14.4Third quarter 0.26 18.1 0.22 17.5 0.18 14.5
Fourth quarter 0.26 17.7(1) 0.22 17.5
(1) 0.18 14.4
Total $ 1.04 $ 75.9 $ 0.88 $ 70.2 $ 0.72 $ 57.7(1) Signet’s dividend policy results in the dividend payment date being a quarter in arrears from the declaration date. As a result, as of January 28, 2017 and January 30, 2016 , $17.7 million and $17.5 million ,
respectively, has been recorded in accrued expenses and other current liabilities in the consolidated balance sheets reflecting the cash dividends declared for the fourth quarter of Fiscal 2017 and Fiscal 2016 ,respectively.
In addition, on March 9, 2017 , Signet’s Board declared a quarterly dividend of $0.31 per share on its common shares. This dividend will be payable on May 31,2017 to shareholders of record on April 28, 2017 , with an ex-dividend date of April 26, 2017 .
Dividends on preferred shares
As of January 28, 2017 , dividends on preferred shares totaling $11.3 million were declared and accrued for by the Company. As disclosed in the consolidatedincome statements, there were no cumulative undeclared dividends on the preferred shares that reduced net income attributable to common shareholders. Inaddition, a $0.6 million deemed dividend related to accretion of issuance costs associated with the preferred shares was recognized in Fiscal 2017 .
98

Table of Contents
These direct and incremental expenses originally reduced the preferred shares carrying value, and are accreted through retained earnings as a deemed dividendfrom the date of issuance through the first possible known redemption date, November 2024. Accretion relating to these fees of $0.6 million was recorded in theconsolidated balance sheet as of January 28, 2017 .
Other
As of January 28, 2017 , the principal trading market for the Company’s common shares is the New York Stock Exchange (symbol: SIG). The Company alsomaintained a standard listing of its common shares on the London Stock Exchange (“LSE”) (symbol: SIG) during Fiscal 2016. On February 16, 2016, theCompany filed a voluntary application with the United Kingdom’s Financial Conduct Authority to delist its common shares from the LSE. Common shares of theCompany continued to trade on the LSE until close of business on March 15, 2016.
7 . Earnings per common share (“EPS”)
Basic EPS is computed by dividing net income attributable to common shareholders by the weighted average number of common shares outstanding for the period.The computation of basic EPS is outlined in the table below:
(in millions, except per share amounts) Fiscal 2017 Fiscal 2016 Fiscal 2015
Numerator: Net income attributable to common shareholders $ 531.3 $ 467.9 $ 381.3
Denominator: Weighted average common shares outstanding 74.5 79.5 79.9
EPS – basic $ 7.13 $ 5.89 $ 4.77
The dilutive effect of share awards represents the potential impact of outstanding awards issued under the Company’s share-based compensation plans, includingrestricted shares and restricted stock units issued under the Omnibus Plan and stock options issued under the Share Saving Plans and Executive Plans. The dilutiveeffect of preferred shares represents the potential impact for common shares that would be issued upon conversion. Potential common share dilution related toshare awards and preferred shares is determined using the treasury stock and if-converted methods, respectively. Under the if-converted method, the preferredshares are assumed to be converted at the beginning of the period, and the resulting common shares are included in the denominator of the diluted EPS calculationfor the entire period being presented. Additionally, cumulative dividends and accretion for issuance costs associated with the preferred shares are added back to netincome attributable to common shareholders. See Note 5 for additional discussion of the Company’s preferred shares. The computation of diluted EPS is outlinedin the table below:
(in millions, except per share amounts) Fiscal 2017 Fiscal 2016 Fiscal 2015
Numerator: Net income attributable to common shareholders $ 531.3 $ 467.9 $ 381.3Add: Dividends on preferred shares 11.9 — —
Numerator for diluted EPS $ 543.2 $ 467.9 $ 381.3
Denominator: Weighted average common shares outstanding 74.5 79.5 79.9Plus: Dilutive effect of share awards 0.1 0.2 0.3Plus: Dilutive effect of preferred shares 2.1 — —
Diluted weighted average common shares outstanding 76.7 79.7 80.2
EPS – diluted $ 7.08 $ 5.87 $ 4.75
The calculation of diluted EPS excludes the following share awards on the basis that their effect would be anti-dilutive.
(in millions) Fiscal 2017 Fiscal 2016 Fiscal 2015
Share awards 0.1 0.1
—
99

Table of Contents
8 . Accumulated other comprehensive income (loss)
The following tables present the changes in AOCI by component and the reclassifications out of AOCI, net of tax:
Pension plan
(in millions)
Foreign currency
translation Losses on
available-for-salesecurities, net
Gains (losses) on cash flow
hedges Actuarial
gains (losses)
Prior service credits(costs)
Accumulated other
comprehensive (loss) income
Balance at February 1, 2014 $ (137.0) $ — $ (14.3) $ (42.5) $ 15.3 $ (178.5)OCI before reclassifications (60.6) — 6.2 (15.8) (0.7) (70.9)Amounts reclassified from AOCI to net income — — 12.5 1.6 (1.3) 12.8
Net current period OCI (60.6) — 18.7 (14.2) (2.0) (58.1)Balance at January 31, 2015 $ (197.6) $ — $ 4.4 $ (56.7) $ 13.3 $ (236.6)
OCI before reclassifications (40.2) (0.4) (11.8) 10.9 (0.5) (42.0)Amounts reclassified from AOCI to net income — — 3.5 2.7 (1.7) 4.5
Net current period OCI (40.2) (0.4) (8.3) 13.6 (2.2) (37.5)Balance at January 30, 2016 $ (237.8) $ (0.4) $ (3.9) $ (43.1) $ 11.1 $ (274.1)
OCI before reclassifications (25.6) — 6.9 (13.6) (0.4) (32.7)Amounts reclassified from AOCI to net income — — (0.6) 1.2 (1.5) (0.9)
Net current period OCI (25.6) — 6.3 (12.4) (1.9) (33.6)Balance at January 28, 2017 $ (263.4) $ (0.4) $ 2.4 $ (55.5) $ 9.2 $ (307.7)
The amounts reclassified from AOCI were as follows:
Amounts reclassified from AOCI
(in millions) Fiscal 2017 Fiscal 2016 Fiscal 2015 Income statement caption
(Gains) losses on cash flow hedges: Foreign currency contracts $ (2.7) $ (0.4) $ 1.3 Cost of sales (see Note 17)Interest rate swaps 2.2 2.7 — Interest expense, net (see Note 17)Commodity contracts (0.2) 2.6 17.3 Cost of sales (see Note 17)
Total before income tax (0.7) 4.9 18.6 Income taxes 0.1 (1.4) (6.1)
Net of tax (0.6) 3.5 12.5
Defined benefit pension plan items:
Amortization of unrecognized actuarial losses 1.5 3.4 2.0 Selling, general and administrativeexpenses (1)
Amortization of unrecognized net prior servicecredits (1.9) (2.2) (1.7)
Selling, general and administrativeexpenses (1)
Total before income tax (0.4) 1.2 0.3 Income taxes 0.1 (0.2) —
Net of tax (0.3) 1.0 0.3
Total reclassifications, net of tax $ (0.9) $ 4.5 $ 12.8 (1) These items are included in the computation of net periodic pension benefit (cost). See Note 19 for additional information.
100

Table of Contents
9 . Income taxes
(in millions) Fiscal 2017 Fiscal 2016 Fiscal 2015
Income before income taxes: – US $ 424.0 $ 426.1 $ 380.8– Foreign 289.8 231.7 159.8
Total income before income taxes $ 713.8 $ 657.8 $ 540.6
Current taxation: – US $ 137.6 $ 161.7 $ 199.5– Foreign 3.9 3.5 7.8
Deferred taxation: – US 28.1 22.3 (47.9)– Foreign 1.0 2.4 (0.1)
Total income taxes $ 170.6 $ 189.9 $ 159.3
As the statutory rate of corporation tax in Bermuda is 0% , the differences between the US federal income tax rate and the effective tax rates for Signet have beenpresented below:
Fiscal 2017 Fiscal 2016 Fiscal 2015
US federal income tax rates 35.0 % 35.0 % 35.0 %US state income taxes 1.9 % 2.7 % 2.1 %Differences between US federal and foreign statutory income tax rates (0.2)% (0.5)% (0.8)%Expenditures permanently disallowable for tax purposes, net of permanent tax benefits 0.4 % 0.5 % 0.8 %Disallowable transaction costs 0.1 % 2.1 % 0.7 %Impact of global reinsurance arrangements (5.4)% (2.4)% (1.5)%Impact of global financing arrangements (8.2)% (8.7)% (7.2)%Other items 0.3 % 0.2 % 0.4 %Effective tax rate 23.9 % 28.9 % 29.5 %
In Fiscal 2017 , Signet’s effective tax rate was lower than the US federal income tax rate primarily due to the impact of Signet’s global reinsurance and financingarrangements utilized to fund the acquisition of Zale. Signet’s future effective tax rate is dependent on changes in the geographic mix of income.
101

Table of Contents
Deferred taxes
Deferred tax assets (liabilities) consisted of the following:
January 28, 2017 January 30, 2016
(in millions) Assets (Liabilities) Total Assets (Liabilities) Total
Intangible assets $ — $ (160.1) $ (160.1) $ — $ (156.2) $ (156.2)US property, plant and equipment — (86.2) (86.2) — (73.6) (73.6)Foreign property, plant and equipment 5.0 — 5.0 5.4 — 5.4Inventory valuation — (289.4) (289.4) — (252.8) (252.8)Allowances for doubtful accounts 60.4 — 60.4 54.1 — 54.1Revenue deferral 216.0 — 216.0 188.5 — 188.5Derivative instruments — — — 1.6 — 1.6Straight-line lease payments 37.5 — 37.5 35.0 — 35.0Deferred compensation 16.5 — 16.5 13.9 — 13.9Retirement benefit obligations — (6.1) (6.1) — (10.3) (10.3)Share-based compensation 5.7 — 5.7 7.4 — 7.4Other temporary differences 51.0 — 51.0 52.4 — 52.4Net operating losses and foreign tax credits 69.2 — 69.2 80.6 — 80.6Value of foreign capital losses 11.3 — 11.3 13.4 — 13.4
Total gross deferred tax assets (liabilities) $ 472.6 $ (541.8) $ (69.2) $ 452.3 $ (492.9) $ (40.6)Valuation allowance (31.5) — (31.5) (31.9) — (31.9)
Deferred tax assets (liabilities) $ 441.1 $ (541.8) $ (100.7) $ 420.4 $ (492.9) $ (72.5)
Disclosed as: Non-current assets $ 0.7 $ —Non-current liabilities (101.4) (72.5)
Deferred tax assets (liabilities) $ (100.7) $ (72.5)
As of January 28, 2017 , Signet had deferred tax assets associated with net operating loss carry forwards of $43.8 million , which are subject to ownership changelimitations rules under Section 382 of the Internal Revenue Code (“IRC”) and various US state regulations, and expire between 2017 and 2033. Deferred tax assetsassociated with foreign tax credits also subject to Section 382 of the IRC total $13.7 million as of January 28, 2017 , which expire between 2017 and 2024 andforeign net operating loss carryforwards of $11.7 million , which expire between 2018 and 2037. Additionally, Signet had foreign capital loss carry forwarddeferred tax assets of $11.3 million ( Fiscal 2016 : $13.4 million ), which are only available to offset future capital gains, if any, over an indefinite period.
The decrease in the total valuation allowance in Fiscal 2017 was $0.4 million ( Fiscal 2016 : $0.5 million net decrease; Fiscal 2015 : $7.5 million net increase). Thevaluation allowance primarily relates to foreign capital and trading loss carry forwards, foreign tax credits and net operating losses that, in the judgment ofmanagement, are not more likely than not to be realized.
Signet believes that it is more likely than not that deferred tax assets not subject to a valuation allowance as of January 28, 2017 will be offset where permissible bydeferred tax liabilities or realized on future tax returns, primarily from the generation of future taxable income.
102

Table of Contents
Uncertain tax positions
The following table summarizes the activity related to the Company’s unrecognized tax benefits for US federal, US state and non-US tax jurisdictions:
(in millions) Fiscal 2017 Fiscal 2016 Fiscal 2015
Unrecognized tax benefits, beginning of period $ 11.4 $ 11.4 $ 4.6Acquired existing unrecognized tax benefits — — 4.3Increases related to current year tax positions 2.4 2.0 3.5Prior year tax positions:
Increases — — —Decreases — — (0.1)
Cash settlements — — —Lapse of statute of limitations (1.9) (1.9) (0.4)Difference on foreign currency translation 0.1 (0.1) (0.5)
Unrecognized tax benefits, end of period $ 12.0 $ 11.4 $ 11.4
As of January 28, 2017 , Signet had approximately $12.0 million of unrecognized tax benefits in respect to uncertain tax positions. The unrecognized tax benefitsrelate primarily to financing arrangements and intra-group charges which are subject to different and changing interpretations of tax law. If all of theseunrecognized tax benefits were settled in Signet’s favor, the effective income tax rate would be favorably impacted by $11.6 million .
Signet recognizes accrued interest and, where appropriate, penalties related to unrecognized tax benefits within income tax expense. As of January 28, 2017 ,Signet had accrued interest of $3.1 million and $0.7 million of accrued penalties.
Over the next twelve months management believes that it is reasonably possible that there could be a reduction of some or all of the unrecognized tax benefits as ofJanuary 28, 2017 due to settlement of the uncertain tax positions with the tax authorities.
Signet has business activity in all states within the US and files income tax returns for the US federal jurisdiction and all applicable states. Signet also files incometax returns in the UK, Canada and certain other foreign jurisdictions. Signet is subject to examinations by the US federal and state and Canadian tax authorities fortax years ending after November 1, 2011 and is subject to examination by the UK tax authority for tax years ending after February 1, 2014.
10 . Other operating income, net
(in millions) Fiscal 2017 Fiscal 2016 Fiscal 2015
Interest income from in-house customer finance programs $ 282.5 $ 252.6 $ 217.9Other 0.1 (1.7) (2.6)
Other operating income, net $ 282.6 $ 250.9 $ 215.3
11 . Accounts receivable, net
Signet’s accounts receivable primarily consist of US customer in-house financing receivables. The accounts receivable portfolio consists of a population that is ofsimilar characteristics and is evaluated collectively for impairment.
(in millions)January 28,
2017 January 30,
2016
Accounts receivable by portfolio segment, net: Sterling Jewelers customer in-house finance receivables $ 1,813.3 $ 1,725.9Zale customer in-house finance receivables 33.4 13.6Other accounts receivable 11.3 16.9
Total accounts receivable, net $ 1,858.0 $ 1,756.4
Signet grants credit to customers based on a variety of credit quality indicators, including consumer financial information and prior payment experience. On anongoing basis, management monitors the credit exposure based on past due status and collection experience, as it has found a meaningful correlation between thepast due status of customers and the risk of loss.
103

Table of Contents
During the third quarter of Fiscal 2016, Signet implemented a program to provide in-house credit to customers in the Zale division’s US locations (“second look”).The allowance for credit losses associated with Zale customer in-house finance receivables was immaterial as of January 28, 2017 and January 30, 2016 .
Other accounts receivable is comprised primarily of accounts receivable relating to the insurance loss replacement business in the UK Jewelry division of $11.0million ( Fiscal 2016 : $13.6 million ).
Sterling Jewelers customer in-house finance receivables
The allowance for credit losses on Sterling Jewelers customer in-house finance receivables is shown below:
(in millions) Fiscal 2017 Fiscal 2016 Fiscal 2015
Beginning balance: $ (130.0) $ (113.1) $ (97.8)Charge-offs, net 203.4 173.6 144.7Recoveries 35.1 35.3 27.5Provision (247.2) (225.8) (187.5)
Ending balance $ (138.7) $ (130.0) $ (113.1)Ending receivable balance evaluated for impairment 1,952.0 1,855.9 1,666.0
Sterling Jewelers customer in-house finance receivables, net $ 1,813.3 $ 1,725.9 $ 1,552.9
Net bad debt expense is defined as the provision expense less recoveries.
The credit quality indicator and age analysis of Sterling Jewelers customer in-house finance receivables are shown below:
January 28, 2017 January 30, 2016 January 31, 2015
(in millions) Gross Valuation allowance Gross
Valuation allowance Gross
Valuation allowance
Performing: Current, aged 0 – 30 days $ 1,538.2 $ (47.2) $ 1,473.0 $ (45.4) $ 1,332.2 $ (41.1)Past due, aged 31 – 60 days 282.0 (9.0) 259.6 (8.3) 230.2 (7.5)Past due, aged 61 – 90 days 51.6 (2.3) 49.2 (2.2) 40.9 (1.8)
Non Performing: Past due, aged more than 90 days 80.2 (80.2) 74.1 (74.1) 62.7 (62.7)
$ 1,952.0 $ (138.7) $ 1,855.9 $ (130.0) $ 1,666.0 $ (113.1)
January 28, 2017 January 30, 2016 January 31, 2015
(as a % of the ending receivable balance) Gross Valuation allowance Gross
Valuation allowance Gross
Valuation allowance
Performing: Current, aged 0 – 30 days 78.8% 3.1% 79.4% 3.1% 80.0% 3.1%Past due, aged 31 – 60 days 14.5% 3.2% 14.0% 3.2% 13.8% 3.3%Past due, aged 61 – 90 days 2.6% 4.5% 2.6% 4.5% 2.4% 4.4%
Non Performing: Past due, aged more than 90 days 4.1% 100.0% 4.0% 100.0% 3.8% 100.0%
100.0% 7.1% 100.0% 7.0% 100.0% 6.8%
Securitized credit card receivables
The Sterling Jewelers division securitizes its credit card receivables through its Sterling Jewelers Receivables Master Note Trust. See Note 20 for additionalinformation regarding this asset-backed securitization facility.
104

Table of Contents
12 . Inventories
Signet held $574.0 million of consignment inventory at January 28, 2017 ( January 30, 2016 : $441.9 million ), which is not recorded on the balance sheet. Theprincipal terms of the consignment agreements, which can generally be terminated by either party, are such that Signet can return any or all of the inventory to therelevant suppliers without financial or commercial penalties and the supplier can adjust the inventory prices prior to sale.
The following table summarizes the details of the Company’s inventory:
(in millions)January 28,
2017 January 30,
2016
Raw materials $ 60.8 $ 81.8Finished goods 2,388.5 2,372.1
Total inventories $ 2,449.3 $ 2,453.9
Inventory reserves
(in millions) Fiscal 2017 Fiscal 2016 Fiscal 2015
Inventory reserve, beginning of period $ 43.2 $ 28.4 $ 16.3Charged to profit 57.3 87.6 44.6Utilization (1) (57.3) (72.8) (32.5)
Inventory reserve, end of period $ 43.2 $ 43.2 $ 28.4(1) Includes the impact of foreign exchange translation between opening and closing balance sheet dates.
13 . Property, plant and equipment, net
(in millions)January 28,
2017 January 30,
2016
Land and buildings $ 33.5 $ 34.7Leasehold improvements 632.4 591.7Furniture and fixtures 761.0 688.7Equipment 137.7 133.6Software 211.0 181.9Construction in progress 96.7 46.2
Total $ 1,872.3 $ 1,676.8Accumulated depreciation and amortization (1,049.4) (949.2)
Property, plant and equipment, net $ 822.9 $ 727.6
Depreciation and amortization expense for Fiscal 2017 was $175.0 million ( Fiscal 2016 : $161.4 million ; Fiscal 2015 : $140.1 million ). The expense for Fiscal2017 includes $1.3 million ( Fiscal 2016 : $0.7 million ; Fiscal 2015 : $0.8 million ) for the impairment of assets.
14 . Goodwill and intangibles
Goodwill
The following table summarizes the Company’s goodwill by reportable segment:
(in millions)Sterling Jewelers
Zale Jewelry
Piercing Pagoda UK Jewelry Other Total
Balance at January 31, 2015 $ 23.2 $ 492.4 $ — $ — $ 3.6 $ 519.2Impact of foreign exchange — (3.7) — — — (3.7)
Balance at January 30, 2016 $ 23.2 $ 488.7 $ — $ — $ 3.6 $ 515.5Impact of foreign exchange — 2.1 — — — 2.1
Balance at January 28, 2017 $ 23.2 $ 490.8 $ — $ — $ 3.6 $ 517.6
There have been no goodwill impairment losses recognized during Fiscal 2017 and Fiscal 2016 . If future economic conditions are different than those projected bymanagement, future impairment charges may be required.
105

Table of Contents
Intangibles
Intangible assets with indefinite and definite lives represent Zale trade names and favorable leases acquired, while intangible liabilities with definite lives representunfavorable leases and contract rights acquired in the Zale Acquisition. See Note 3 for additional information. No other intangible assets or liabilities wererecognized prior to the acquisition of Zale Corporation on May 29, 2014. As of January 28, 2017 , the remaining weighted-average amortization period foracquired definite-lived intangible assets and liabilities was 1.4 years and 4.8 years , respectively. The following table provides additional detail regarding thecomposition of intangible assets and liabilities:
January 28, 2017 January 30, 2016
(in millions) Balance sheet location Gross
carrying amount
Accumulated amortization
Net carrying amount
Gross carrying amount
Accumulated amortization
Net carrying amount
Definite-lived intangible assets: Trade names Intangible assets, net $ 1.4 $ (0.8) $ 0.6 $ 1.4 $ (0.5) $ 0.9Favorable leases Intangible assets, net 47.6 (36.0) 11.6 47.0 (22.3) 24.7
Total definite-lived intangible assets 49.0 (36.8) 12.2 48.4 (22.8) 25.6Indefinite-lived trade names Intangible assets, net 404.8 — 404.8 402.2 — 402.2
Total intangible assets, net $ 453.8 $ (36.8) $ 417.0 $ 450.6 $ (22.8) $ 427.8
Definite-lived intangible liabilities: Unfavorable leases Other liabilities $ (48.3) $ 38.2 $ (10.1) $ (47.7) $ 23.7 $ (24.0)Unfavorable contracts Other liabilities (65.6) 33.5 (32.1) (65.6) 28.1 (37.5)
Total intangible liabilities, net $ (113.9) $ 71.7 $ (42.2) $ (113.3) $ 51.8 $ (61.5)
Amortization expense relating to intangible assets was $13.8 million in Fiscal 2017 ( Fiscal 2016 : $13.9 million ; Fiscal 2015 : $9.6 million ). Expected futureamortization expense for intangible assets recorded at January 28, 2017 follows:
(in millions) Trade names Favorable leases Total
2018 $ 0.3 $ 9.0 $ 9.32019 0.2 2.4 2.62020 0.1 0.2 0.32021 — — —2022 — — —Thereafter — — —
Total $ 0.6 $ 11.6 $ 12.2
The unfavorable leases and unfavorable contracts are classified as liabilities and recognized over the term of the underlying lease or contract. Amortization relatingto intangible liabilities was $19.7 million in Fiscal 2017 ( Fiscal 2016 : $28.7 million ; Fiscal 2015 : $23.7 million ). Expected future amortization for intangibleliabilities recorded at January 28, 2017 follows:
(in millions)Unfavorable
leases Unfavorable
contracts Total
2018 $ (7.6) $ (5.4) $ (13.0)2019 (2.2) (5.4) (7.6)2020 (0.3) (5.4) (5.7)2021 — (5.4) (5.4)2022 — (5.4) (5.4)Thereafter — (5.1) (5.1)
Total $ (10.1) $ (32.1) $ (42.2)
106

Table of Contents
15 . Other assets
(in millions)January 28,
2017 January 30,
2016
Deferred ESP selling costs $ 86.1 $ 79.4Investments (1) 27.2 26.8Other assets (2) 51.8 48.4
Total other assets $ 165.1 $ 154.6(1) See Note 16 for additional detail.(2) Amounts adjusted to reflect the reclassification of capitalized debt issuance costs in accordance with Signet’s adoption of FASB ASU 2015-03 during the first quarter of Fiscal 2017. See Note 2 for additional
information.
In addition, other current assets include deferred direct selling costs in relation to the sale of ESP of $29.4 million as of January 28, 2017 ( January 30, 2016 : $26.4million ).
16 . Investments
Investments in debt and equity securities are held by certain insurance subsidiaries and are reported at fair value as other assets in the accompanying consolidatedbalance sheets. All investments are classified as available-for-sale and include the following:
January 28, 2017 January 30, 2016
(in millions) Cost UnrealizedGain (Loss) Fair Value Cost
UnrealizedGain (Loss) Fair Value
US Treasury securities $ 8.8 $ (0.7) $ 8.1 $ 9.2 $ (0.4) $ 8.8US government agency securities 4.6 (0.2) 4.4 4.0 — 4.0Corporate bonds and notes 11.0 (0.1) 10.9 10.8 — 10.8Corporate equity securities 3.5 0.3 3.8 3.5 (0.3) 3.2
Total investments $ 27.9 $ (0.7) $ 27.2 $ 27.5 $ (0.7) $ 26.8
Realized gains and losses on investments are determined on the specific identification basis. There were no material net realized gains or losses during Fiscal 2017and Fiscal 2016 . Investments with a carrying value of $6.6 million and $7.1 million were on deposit with various state insurance departments at January 28, 2017and January 30, 2016 , respectively, as required by law.
Investments in debt securities outstanding as of January 28, 2017 mature as follows:
(in millions) Cost Fair Value
Less than one year $ 1.8 $ 1.2Year two through year five 13.4 13.2Year six through year ten 9.2 9.0After ten years — —
Total investment in debt securities $ 24.4 $ 23.4
17 . Derivatives
Derivative transactions are used by Signet for risk management purposes to address risks inherent in Signet’s business operations and sources of financing. Themain risks arising from Signet’s operations are market risk including foreign currency risk, commodity risk, liquidity risk and interest rate risk. Signet usesderivative financial instruments to manage and mitigate certain of these risks under policies reviewed and approved by the Board of Directors. Signet does notenter into derivative transactions for speculative purposes.
Market risk
Signet generates revenues and incurs expenses in US dollars, Canadian dollars and British pounds. As a portion of UK Jewelry purchases and purchases made bythe Canadian operations of the Zale division are denominated in US dollars, Signet enters into forward foreign currency exchange contracts, foreign currencyoption contracts and foreign currency swaps to manage this exposure to the US dollar.
Signet holds a fluctuating amount of British pounds and Canadian dollars reflecting the cash generative characteristics of operations. Signet’s objective is tominimize net foreign exchange exposure to the income statement on non-US dollar denominated items through managing cash levels, non-US dollar denominatedintra-entity balances and foreign currency swaps. In order to manage the foreign exchange exposure and
107

Table of Contents
minimize the level of funds denominated in British pounds and Canadian dollars, dividends are paid regularly by subsidiaries to their immediate holdingcompanies and excess British pounds and Canadian dollars are sold in exchange for US dollars.
Signet’s policy is to minimize the impact of precious metal commodity price volatility on operating results through the use of outright forward purchases of, or byentering into options to purchase, precious metals within treasury guidelines approved by the Board of Directors. In particular, Signet undertakes some hedging ofits requirements for gold through the use of options, net zero-cost collar arrangements (a combination of call and put option contracts), forward contracts andcommodity purchasing, while fluctuations in the cost of diamonds are not hedged.
Liquidity risk
Signet’s objective is to ensure that it has access to, or the ability to generate, sufficient cash from either internal or external sources in a timely and cost-effectivemanner to meet its commitments as they become due and payable. Signet manages liquidity risks as part of its overall risk management policy. Managementproduces forecasting and budgeting information that is reviewed and monitored by the Board of Directors. Cash generated from operations and external financingare the main sources of funding, which supplement Signet’s resources in meeting liquidity requirements.
The main external sources of funding are a senior unsecured credit facility, senior unsecured notes and securitized credit card receivables, as described in Note 20 .
Interest rate risk
Signet has exposure to movements in interest rates associated with cash and borrowings. Signet may enter into various interest rate protection agreements in orderto limit the impact of movements in interest rates.
Interest rate swap (designated) — The Company entered into an interest rate swap in March 2015 with an aggregate notional amount of $300.0 million that isscheduled to mature through April 2019 . Under this contract, the Company agrees to exchange, at specified intervals, the difference between fixed contract ratesand floating rate interest amounts calculated by reference to the agreed notional amounts. This contract was entered into to reduce the consolidated interest rate riskassociated with variable rate, long-term debt. The Company designated this derivative as a cash flow hedge of the variability in expected cash outflows for interestpayments. The Company has effectively converted a portion of its variable-rate senior unsecured term loan into fixed-rate debt.
The fair value of the swap is presented within the consolidated balance sheets, and the Company recognizes any changes in the fair value as an adjustment of AOCIwithin equity to the extent the swap is effective. The ineffective portion, if any, is recognized in current period earnings. As interest expense is accrued on the debtobligation, amounts in AOCI related to the interest rate swap are reclassified into income resulting in a net interest expense on the hedged amount of the underlyingdebt obligation equal to the effective yield of the fixed rate of the swap. In the event that the interest rate swap is dedesignated prior to maturity, gains or losses inAOCI remain deferred and are reclassified into earnings in the periods in which the hedged forecasted transaction affects earnings.
Credit risk and concentrations of credit risk
Credit risk represents the loss that would be recognized at the reporting date if counterparties failed to perform as contracted. Signet does not anticipate non-performance by counterparties of its financial instruments, except for customer in-house financing receivables as disclosed in Note 11 of which no single customerrepresents a significant portion of the Company’s receivable balance. Signet does not require collateral or other security to support cash investments or financialinstruments with credit risk; however, it is Signet’s policy to only hold cash and cash equivalent investments and to transact financial instruments with financialinstitutions with a certain minimum credit rating. Management does not believe Signet is exposed to any significant concentrations of credit risk that arise fromcash and cash equivalent investments, derivatives or accounts receivable.
Commodity and foreign currency risks
The following types of derivative financial instruments are utilized by Signet to mitigate certain risk exposures related to changes in commodity prices and foreignexchange rates:
Forward foreign currency exchange contracts (designated) — These contracts, which are principally in US dollars, are entered into to limit the impact ofmovements in foreign exchange rates on forecasted foreign currency purchases. The total notional amount of these foreign currency contracts outstanding as ofJanuary 28, 2017 was $37.8 million ( January 30, 2016 : $10.7 million ). These contracts have been designated as cash flow hedges and will be settled over the next12 months ( January 30, 2016 : 6 months ).
Forward foreign currency exchange contracts (undesignated) — Foreign currency contracts not designated as cash flow hedges are used to limit the impact ofmovements in foreign exchange rates on recognized foreign currency payables and to hedge currency flows through Signet’s bank accounts to mitigate Signet’sexposure to foreign currency exchange risk in its cash and borrowings. The total notional amount of these foreign currency contracts outstanding as of January 28,2017 was $117.8 million ( January 30, 2016 : $32.0 million ).
108

Table of Contents
Commodity forward purchase contracts and net zero-cost collar arrangements (designated) — These contracts are entered into to reduce Signet’s exposure tosignificant movements in the price of the underlying precious metal raw material. The total notional amount of these commodity derivative contracts outstanding asof January 28, 2017 was for approximately 94,000 ounces of gold ( January 30, 2016 : 76,000 ounces ). These contracts have been designated as cash flow hedgesand will be settled over the next 12 months ( January 30, 2016 : 12 months ).
The bank counterparties to the derivative instruments expose Signet to credit-related losses in the event of their non-performance. However, to mitigate that risk,Signet only contracts with counterparties that meet certain minimum requirements under its counterparty risk assessment process. As of January 28, 2017 , Signetbelieves that this credit risk did not materially change the fair value of the foreign currency or commodity contracts.
The following table summarizes the fair value and presentation of derivative instruments in the consolidated balance sheets:
Fair value of derivative assets
(in millions) Balance sheet location January 28,
2017 January 30,
2016
Derivatives designated as hedging instruments: Foreign currency contracts Other current assets $ 1.4 $ 0.8Commodity contracts Other current assets — 0.6Interest rate swaps Other assets 0.4 —
1.8 1.4Derivatives not designated as hedging instruments:
Foreign currency contracts Other current assets 1.8 —Total derivative assets $ 3.6 $ 1.4
Fair value of derivative liabilities
(in millions) Balance sheet location January 28,
2017 January 30,
2016
Derivatives designated as hedging instruments: Foreign currency contracts Other current liabilities $ (0.2) $ —Commodity contracts Other current liabilities (3.4) (0.8)Interest rate swaps Other liabilities — (3.4)
(3.6) (4.2)Derivatives not designated as hedging instruments:
Foreign currency contracts Other current liabilities — (0.2)Total derivative liabilities $ (3.6) $ (4.4)
Derivatives designated as cash flow hedges
The following table summarizes the pre-tax gains (losses) recorded in AOCI for derivatives designated in cash flow hedging relationships:
(in millions)January 28,
2017 January 30,
2016
Foreign currency contracts $ 4.1 $ 1.4Commodity contracts (2.1) (3.7)Interest rate swaps 0.4 (3.4)
Gains (losses) recorded in AOCI $ 2.4 $ (5.7)
The following tables summarize the effect of derivative instruments designated as cash flow hedges in OCI and the consolidated income statements:
Foreign currency contracts
(in millions) Income statement caption Fiscal 2017 Fiscal 2016
Gains recorded in AOCI, beginning of period $ 1.4 $ 0.9Current period gains recognized in OCI 5.4 0.9Gains reclassified from AOCI to net income Cost of sales (2.7) (0.4)
Gains recorded in AOCI, end of period $ 4.1 $ 1.4
109

Table of Contents
Commodity contracts
(in millions) Income statement caption Fiscal 2017 Fiscal 2016
(Losses) gains recorded in AOCI, beginning of period $ (3.7) $ 5.7Current period gains (losses) recognized in OCI 1.8 (12.0)(Gains) losses reclassified from AOCI to net income Cost of sales (0.2) 2.6
Losses recorded in AOCI, end of period $ (2.1) $ (3.7)
Interest rate swaps
(in millions) Income statement caption Fiscal 2017 Fiscal 2016
Losses recorded in AOCI, beginning of period $ (3.4) $ —Current period gains (losses) recognized in OCI 1.6 (6.1)Losses reclassified from AOCI to net income Interest expense, net 2.2 2.7
Gains (losses) recorded in AOCI, end of period $ 0.4 $ (3.4)
There was no material ineffectiveness related to the Company’s derivative instruments designated in cash flow hedging relationships during Fiscal 2017 and Fiscal2016 . Based on current valuations, the Company expects approximately $2.3 million of net pre-tax derivative gains to be reclassified out of AOCI into earningswithin the next 12 months .
Derivatives not designated as hedging instruments
The following table presents the effects of the Company’s derivatives instruments not designated as cash flow hedges in the consolidated income statements:
Income statement caption Amount of gains (losses)recognized in net income
(in millions) Fiscal 2017 Fiscal 2016
Derivatives not designated as hedging instruments: Foreign currency contracts Other operating income, net $ 6.3 $ (4.5)
18. Fair value measurement
The estimated fair value of Signet’s financial instruments held or issued to finance Signet’s operations is summarized below. Certain estimates and judgments wererequired to develop the fair value amounts. The fair value amounts shown below are not necessarily indicative of the amounts that Signet would realize upondisposition nor do they indicate Signet’s intent or ability to dispose of the financial instrument. Assets and liabilities that are carried at fair value are required to beclassified and disclosed in one of the following three categories:
Level 1—quoted market prices in active markets for identical assets and liabilities
Level 2—observable market based inputs or unobservable inputs that are corroborated by market data
Level 3—unobservable inputs that are not corroborated by market data
Signet determines fair value based upon quoted prices when available or through the use of alternative approaches, such as discounting the expected cash flowsusing market interest rates commensurate with the credit quality and duration of the investment. The methods Signet uses to determine fair value on an instrument-specific basis are detailed below:
110
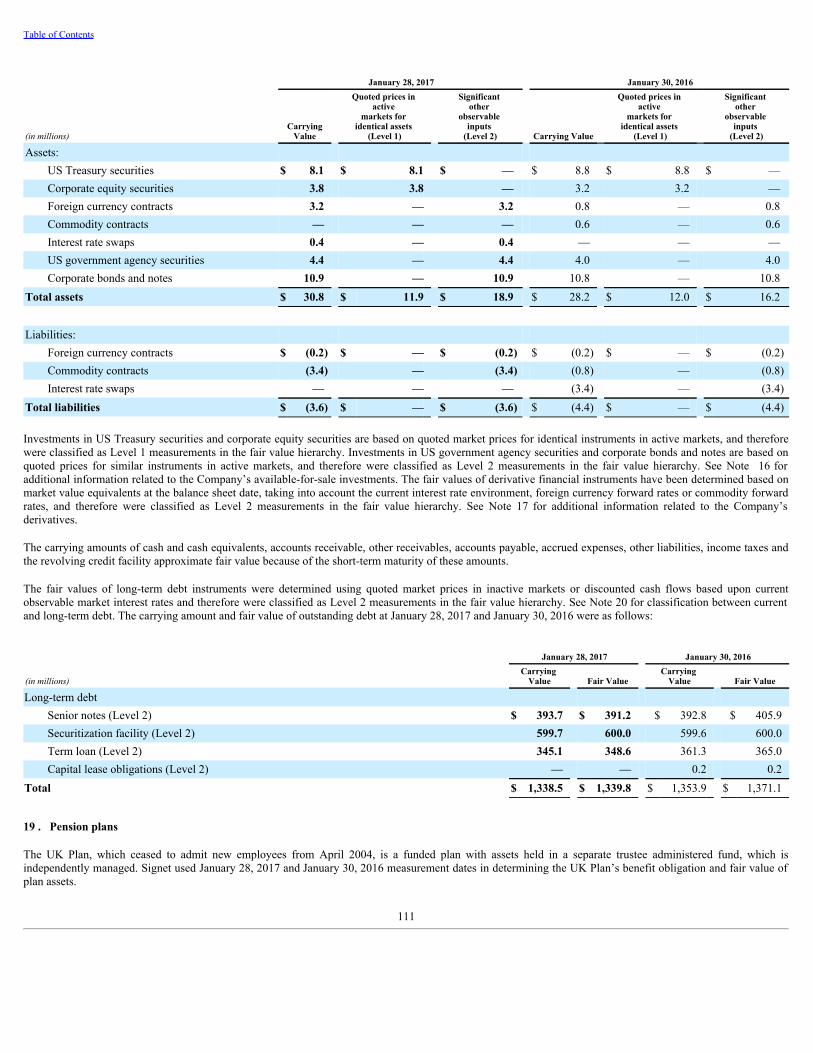
Table of Contents
January 28, 2017 January 30, 2016
(in millions)Carrying
Value
Quoted prices in active
markets for identical assets
(Level 1)
Significant other
observable inputs
(Level 2) Carrying Value
Quoted prices in active
markets for identical assets
(Level 1)
Significant other
observable inputs
(Level 2)
Assets: US Treasury securities $ 8.1 $ 8.1 $ — $ 8.8 $ 8.8 $ —Corporate equity securities 3.8 3.8 — 3.2 3.2 —Foreign currency contracts 3.2 — 3.2 0.8 — 0.8Commodity contracts — — — 0.6 — 0.6Interest rate swaps 0.4 — 0.4 — — —US government agency securities 4.4 — 4.4 4.0 — 4.0Corporate bonds and notes 10.9 — 10.9 10.8 — 10.8
Total assets $ 30.8 $ 11.9 $ 18.9 $ 28.2 $ 12.0 $ 16.2 Liabilities:
Foreign currency contracts $ (0.2) $ — $ (0.2) $ (0.2) $ — $ (0.2)Commodity contracts (3.4) — (3.4) (0.8) — (0.8)Interest rate swaps — — — (3.4) — (3.4)
Total liabilities $ (3.6) $ — $ (3.6) $ (4.4) $ — $ (4.4)
Investments in US Treasury securities and corporate equity securities are based on quoted market prices for identical instruments in active markets, and thereforewere classified as Level 1 measurements in the fair value hierarchy. Investments in US government agency securities and corporate bonds and notes are based onquoted prices for similar instruments in active markets, and therefore were classified as Level 2 measurements in the fair value hierarchy. See Note 16 foradditional information related to the Company’s available-for-sale investments. The fair values of derivative financial instruments have been determined based onmarket value equivalents at the balance sheet date, taking into account the current interest rate environment, foreign currency forward rates or commodity forwardrates, and therefore were classified as Level 2 measurements in the fair value hierarchy. See Note 17 for additional information related to the Company’sderivatives.
The carrying amounts of cash and cash equivalents, accounts receivable, other receivables, accounts payable, accrued expenses, other liabilities, income taxes andthe revolving credit facility approximate fair value because of the short-term maturity of these amounts.
The fair values of long-term debt instruments were determined using quoted market prices in inactive markets or discounted cash flows based upon currentobservable market interest rates and therefore were classified as Level 2 measurements in the fair value hierarchy. See Note 20 for classification between currentand long-term debt. The carrying amount and fair value of outstanding debt at January 28, 2017 and January 30, 2016 were as follows:
January 28, 2017 January 30, 2016
(in millions)Carrying
Value Fair Value Carrying
Value Fair Value
Long-term debt Senior notes (Level 2) $ 393.7 $ 391.2 $ 392.8 $ 405.9Securitization facility (Level 2) 599.7 600.0 599.6 600.0Term loan (Level 2) 345.1 348.6 361.3 365.0Capital lease obligations (Level 2) — — 0.2 0.2
Total $ 1,338.5 $ 1,339.8 $ 1,353.9 $ 1,371.1
19 . Pension plans
The UK Plan, which ceased to admit new employees from April 2004, is a funded plan with assets held in a separate trustee administered fund, which isindependently managed. Signet used January 28, 2017 and January 30, 2016 measurement dates in determining the UK Plan’s benefit obligation and fair value ofplan assets.
111

Table of Contents
The following tables provide information concerning the UK Plan as of and for the fiscal years ended January 28, 2017 and January 30, 2016 :
(in millions) Fiscal 2017 Fiscal 2016
Change in UK Plan assets: Fair value at beginning of year $ 266.2 $ 295.8Actual return on UK Plan assets 18.2 (4.8)Employer contributions 3.3 2.5Members’ contributions 0.6 0.7Benefits paid (9.9) (11.2)Foreign currency translation (30.8) (16.8)
Fair value at end of year $ 247.6 $ 266.2
(in millions) Fiscal 2017 Fiscal 2016
Change in benefit obligation: Benefit obligation at beginning of year $ 214.9 $ 258.8Service cost 2.0 2.6Past service cost 0.5 0.6Interest cost 7.2 7.7Members’ contributions 0.6 0.7Actuarial (gain) loss 24.1 (29.4)Benefits paid (9.9) (11.2)Foreign currency translation (23.7) (14.9)
Benefit obligation at end of year $ 215.7 $ 214.9Funded status at end of year $ 31.9 $ 51.3
(in millions)January 28,
2017 January 30,
2016
Amounts recognized in the balance sheet consist of: Non-current assets $ 31.9 $ 51.3Non-current liabilities — —
Net asset recognized $ 31.9 $ 51.3
Items in AOCI not yet recognized as income (expense) in the income statement:
(in millions)January 28,
2017 January 30,
2016 January 31,
2015
Net actuarial losses $ (55.5) $ (43.1) $ (56.7)Net prior service credits 9.2 11.1 13.3
The estimated actuarial losses and prior service credits for the UK Plan that will be amortized from AOCI into net periodic pension cost over the next fiscal yearare $2.9 million and $(1.7) million , respectively.
The accumulated benefit obligation for the UK Plan was $208.0 million and $204.2 million as of January 28, 2017 and January 30, 2016 , respectively.
112

Table of Contents
The components of net periodic pension benefit (cost) and other amounts recognized in OCI for the UK Plan are as follows:
(in millions) Fiscal 2017 Fiscal 2016 Fiscal 2015
Components of net periodic pension benefit (cost): Service cost $ (2.0) $ (2.6) $ (2.3)Interest cost (7.2) (7.7) (9.7)Expected return on UK Plan assets 10.4 11.5 14.7Amortization of unrecognized actuarial losses (1.5) (3.4) (2.0)Amortization of unrecognized net prior service credits 1.9 2.2 1.7
Net periodic pension benefit $ 1.6 $ — $ 2.4Other changes in assets and benefit obligations recognized in OCI (17.8) 14.4 (21.0)
Total recognized in net periodic pension benefit (cost) and OCI $ (16.2) $ 14.4 $ (18.6)
January 28, 2017 January 30, 2016
Assumptions used to determine benefit obligations (at the end of the year): Discount rate 2.90% 3.60%Salary increases 2.00% 2.50%
Assumptions used to determine net periodic pension costs (at the start of the year): Discount rate 3.60% 3.00%Expected return on UK Plan assets 4.20% 3.90%Salary increases 2.50% 2.50%
The discount rate is based upon published rates for high-quality fixed-income investments that produce expected cash flows that approximate the timing andamount of expected future benefit payments.
The expected return on the UK Plan assets assumption is based upon the historical return and future expected returns for each asset class, as well as the target assetallocation of the portfolio of UK Plan assets.
The UK Plan’s investment strategy is guided by an objective of achieving a return on the investments, which is consistent with the long-term return assumptionsand funding policy, to ensure the UK Plan obligations are met. The investment policy is to allocate funds to a diverse portfolio of investments, including UK andoverseas equities, diversified growth funds, UK corporate bonds, open-ended funds and commercial property. The commercial property investment is through aPooled Pensions Property Fund that provides a diversified portfolio of property assets. As of January 28, 2017 , the target allocation for the UK Plan’s assets wasbonds 53% , diversified growth funds 34% , equities 8% and property 5% . This allocation is consistent with the long-term target allocation of investmentsunderlying the UK Plan’s funding strategy.
The fair value of the assets in the UK Plan at January 28, 2017 and January 30, 2016 are required to be classified and disclosed in one of the following threecategories:
Level 1—quoted market prices in active markets for identical assets and liabilities
Level 2—observable market based inputs or unobservable inputs that are corroborated by market data
Level 3—unobservable inputs that are not corroborated by market data
113

Table of Contents
The methods Signet uses to determine fair value on an instrument-specific basis are detailed below:
Fair value measurements as of January 28, 2017 Fair value measurements as of January 30, 2016
(in millions) Total
Quoted prices in active
markets for identical assets
(Level 1)
Significant other
observable inputs
(Level 2)
Significant Unobservable
inputs (Level 3) Total
Quoted prices in active
markets for identical assets
(Level 1)
Significant other
observable inputs
(Level 2)
Significant unobservable
inputs (Level 3)
Asset category: Diversified equity securities $ 22.3 $ — $ 22.3 $ — $ 21.2 $ 11.3 $ 9.9 $ —Diversified growth funds 80.9 40.7 40.2 — 90.5 44.8 45.7 —Fixed income – government
bonds 81.0 — 81.0 — 87.1 — 87.1 —Fixed income – corporate
bonds 48.1 — 48.1 — 53.6 — 53.6 —Property 11.8 — — 11.8 13.0 — — 13.0Cash 3.5 3.5 — — 0.8 0.8 — —
Total $ 247.6 $ 44.2 $ 191.6 $ 11.8 $ 266.2 $ 56.9 $ 196.3 $ 13.0
Investments in diversified equity securities, diversified growth funds and fixed income securities are in pooled funds. Investments are valued based on unadjustedquoted prices for each fund in active markets, where possible and, therefore, classified in Level 1 of the fair value hierarchy. If unadjusted quoted prices foridentical assets are unavailable, investments are valued by the administrators of the funds. The valuation is based on the value of the underlying assets owned bythe fund, minus its liabilities, and then divided by the number of units outstanding. The unit price is based on underlying investments which are generally eithertraded in an active market or are valued based on observable inputs such as market interest rates and quoted prices for similar securities and, therefore, classified inLevel 2 of the fair value hierarchy.
The investment in property is in pooled funds valued by the administrators of the fund. The valuation is based on the value of the underlying assets owned by thefund, minus its liabilities and then divided by the number of units outstanding. The unit price is based on underlying investments which are independently valuedon a monthly basis. The investment in the property fund is subject to certain restrictions on withdrawals that could delay the receipt of funds by up to 16 months.Property investments are classified in Level 3 of the fair value hierarchy.
The table below sets forth changes in the fair value of the Level 3 investment assets in Fiscal 2017 and Fiscal 2016 :
(in millions)
Significant unobservable
inputs (Level 3)
Balance as of January 31, 2015 $ 12.3Actual return on assets 0.7
Balance as of January 30, 2016 $ 13.0Actual return on assets (1.2)
Balance as of January 28, 2017 $ 11.8
Signet contributed $3.3 million to the UK Plan in Fiscal 2017 and expects to contribute a minimum of $3.3 million to the UK Plan in Fiscal 2018 . The level ofcontributions is in accordance with an agreed upon deficit recovery plan and based on the results of the actuarial valuation as of April 5, 2015.
The following benefit payments, which reflect expected future service, as appropriate, are estimated to be paid by the UK Plan:
(in millions)Expected benefit
payments
Fiscal 2018 $ 9.7Fiscal 2019 7.3Fiscal 2020 7.6Fiscal 2021 8.0Fiscal 2022 8.2Thereafter $ 42.6
114

Table of Contents
In June 2004, Signet introduced a defined contribution plan which replaced the UK Plan for new UK employees. The contributions to this plan in Fiscal 2017 were$1.8 million ( Fiscal 2016 : $2.0 million ; Fiscal 2015 : $1.8 million ).
In the US, Signet operates a defined contribution 401(k) retirement savings plan for all eligible employees who meet minimum age and service requirements. Theassets of this plan are held in a separate trust and Signet matches 50% of up to 6% of employee elective salary deferrals, subject to statutory limitations. Signet’scontributions to this plan in Fiscal 2017 were $14.6 million ( Fiscal 2016 : $8.3 million ; Fiscal 2015 : $7.6 million ). The Company has also established twounfunded, non-qualified deferred compensation plans, one of which permits certain management and highly compensated employees to elect annually to defer allor a portion of their compensation and earn interest on the deferred amounts (“DCP”) and the other of which is frozen as to new participants and new deferrals.Beginning in April 2011, the DCP provided for a matching contribution based on each participant’s annual compensation deferral. The plan also permits employercontributions on a discretionary basis. In connection with these plans, Signet has invested in trust-owned life insurance policies and money market funds. The costrecognized in connection with the DCP in Fiscal 2017 was $4.6 million ( Fiscal 2016 : $2.9 million ; Fiscal 2015 : $2.6 million ).
The fair value of the assets in the two unfunded, non-qualified deferred compensation plans at January 28, 2017 and January 30, 2016 are required to be classifiedand disclosed. Although these plans are not required to be funded by the Company, the Company may elect to fund the plans. The value and classification of theseassets are as follows:
Fair value measurements as of January 28, 2017 Fair value measurements as of January 30, 2016
(in millions) Total
Quoted prices in active markets for
identical assets (Level 1)
Significant other
observable inputs
(Level 2) Total
Quoted prices in active markets for
identical assets (Level 1)
Significant other
observable inputs
(Level 2)
Assets: Corporate-owned life insurance plans $ 7.5 $ — $ 7.5 $ 8.3 $ — $ 8.3Money market funds 29.6 29.6 — 25.1 25.1 —
Total assets $ 37.1 $ 29.6 $ 7.5 $ 33.4 $ 25.1 $ 8.3
20 . Loans, overdrafts and long-term debt
(in millions)January 28,
2017 January 30,
2016
Debt: Senior unsecured notes due 2024, net of unamortized discount $ 398.8 $ 398.6Securitization facility 600.0 600.0Senior unsecured term loan 348.6 365.0Revolving credit facility 56.0 —Bank overdrafts 14.2 24.4Capital lease obligations — 0.2
Total debt $ 1,417.6 $ 1,388.2Less: Current portion of loans and overdrafts (91.1) (57.7)Less: Unamortized capitalized debt issuance fees (1) (8.6) (9.5)
Total long-term debt $ 1,317.9 $ 1,321.0(1) Presentation of capitalized debt issuance costs was revised during the first quarter of Fiscal 2017 upon adoption of ASU 2015-03. See Note 2 for additional information.
Revolving credit facility and term loan (the “Credit Facility”)
During the second quarter of Fiscal 2017, Signet amended and restated its Credit Facility agreement to (i) increase the borrowing capacity under the revolvingcredit facility from $400 million to $700 million and extend the maturity date to July 2021 and (ii) extend the maturity date of the term loan facility to July 2021and revise the scheduled quarterly principal repayments to align with the July 2021 maturity date. The amendment of the Credit Facility was accounted for as amodification of existing debt in accordance with ASC Topic 470-50, “Debt Modifications and Extinguishments.”
In connection with the amendment of the revolving credit facility, incremental fees of $1.4 million were incurred and capitalized. Capitalized fees associated withthe amended revolving credit facility as of January 28, 2017 total $2.6 million with the unamortized balance recorded as an asset within the consolidated balancesheets. Accumulated amortization related to these capitalized fees as of January 28, 2017 was $0.8 million ( January 30, 2016 : $0.4 million ). Amortizationrelating to these fees of $0.4 million and $0.3 million was recorded as interest expense in the consolidated income statements for Fiscal 2017 and Fiscal 2016 ,respectively. As of January 28, 2017 and January 30, 2016 , the Company had
115
Table of Contents
stand-by letters of credit outstanding of $15.3 million and $28.8 million , respectively, that reduce remaining borrowing availability. The revolving credit facilityhad a weighted average interest rate of 1.71% and 1.18% during Fiscal 2017 and Fiscal 2016 , respectively.
The senior unsecured term loan had an outstanding principal balance of $357.5 million as of the amendment date. Beginning in October 2016, the Company isrequired to make scheduled quarterly principal payments equal to the amounts per annum of the outstanding principal balance as follows: 5% in the first year, 7.5%in the second year, 10% in the third year, 12.5% in the fourth year and 15% in the fifth year after the initial payment date, with the balance due in July 2021.Excluding the impact of the interest rate swap designated as a cash flow hedge discussed in Note 17 , the term loan had a weighted average interest rate of 1.78%and 1.48% during Fiscal 2017 and Fiscal 2016 , respectively.
In connection with the amendment of the term loan facility, incremental fees of $0.7 million were incurred and capitalized. Capitalized fees associated with theamended term loan facility as of January 28, 2017 total $6.2 million with the unamortized balance recorded as a direct deduction from the outstanding liabilitywithin the consolidated balance sheets. Accumulated amortization related to these capitalized fees as of January 28, 2017 was $2.7 million ( January 30, 2016 :$1.8 million ). Amortization relating to these fees of $0.9 million and $1.0 million was recorded as interest expense in the consolidated income statements Fiscal2017 and Fiscal 2016 , respectively.
Borrowings under the Credit Facility bear interest at a rate per annum equal to an applicable margin, plus, at the Company’s option, either (a) a base rate or (b) aLIBOR rate. The Credit Facility provides that the Company may voluntarily repay outstanding loans at any time without premium or penalty other thanreimbursement of the lender’s redeployment and breakage costs in certain cases. In addition, the Credit Facility contains various customary representations andwarranties, financial reporting requirements and other affirmative and negative covenants. The Company is required to maintain at all times a leverage ratio of nogreater than 2.50 to 1.00 and a fixed charge coverage ratio of no less than 1.40 to 1.00, both determined as of the end of each fiscal quarter for the trailing twelvemonths.
On February 19, 2014, Signet entered into a definitive agreement to acquire Zale Corporation and concurrently received commitments for an $800 million 364 -dayunsecured bridge facility to finance the transaction. The bridge facility contained customary fees and incurred interest on any borrowings drawn on the facility. InMay 2014, Signet executed its Zale Acquisition financing as described in Note 3, replacing the bridge facility commitments in addition to amending its CreditFacility as outlined above, issuing senior unsecured notes and securitizing credit card receivables. No amounts were drawn on the bridge facility commitmentsprior to replacement by the issuances of long-term debt listed below. Fees of $4.0 million relating to this unsecured bridge facility were incurred and capitalizedduring Fiscal 2015. The capitalized fees of $4.0 million were fully expensed in Fiscal 2015.
Senior unsecured notes due 2024
On May 19, 2014, Signet UK Finance plc (“Signet UK Finance”), a wholly owned subsidiary of the Company, issued $400 million aggregate principal amount ofits 4.700% senior unsecured notes due in 2024 (the “Notes”). The Notes were issued under an effective registration statement previously filed with the SEC.Interest on the notes is payable semi-annually on June 15 and December 15 of each year, commencing December 15, 2014. The Notes are jointly and severallyguaranteed, on a full and unconditional basis, by the Company and by certain of the Company’s wholly owned subsidiaries (such subsidiaries, the “Guarantors”).See Note 26 for additional information. The Notes were issued pursuant to a base indenture among the Company, Signet UK Finance, the Guarantors and DeutscheBank Trust Company Americas as trustee, with the indenture containing customary covenants and events of default provisions. The Company received proceedsfrom the offering of approximately $393.9 million , which were net of underwriting discounts, commissions and offering expenses.
Capitalized fees relating to the senior unsecured notes total $7.0 million . Accumulated amortization related to these capitalized fees as of January 28, 2017 was$1.9 million ( January 30, 2016 : $1.2 million ). The remaining unamortized capitalized fees are recorded as a direct deduction from the outstanding liability withinthe consolidated balance sheets. Amortization relating to these fees of $0.7 million and $0.7 million was recorded as interest expense in the consolidated incomestatements for Fiscal 2017 and Fiscal 2016 , respectively.
Asset-backed securitization facility
The Company sold an undivided interest in certain credit card receivables to Sterling Jewelers Receivables Master Note Trust (the “Issuer”), a wholly-ownedDelaware statutory trust and a wholly-owned indirect subsidiary of the Company and issued two -year revolving asset-backed variable funding notes to unrelatedthird party conduits pursuant to a master indenture dated as of November 2, 2001, as supplemented by the Series 2014-A indenture supplement dated as of May 15,2014 among the Issuer, Sterling Jewelers Inc. (“SJI”) and Deutsche Bank Trust Company Americas, the indenture trustee. During the second quarter of Fiscal2017, Signet amended the note purchase agreement associated with the asset-backed securitization facility to extend the term of the facility by one year to May2018 with remaining terms substantially consistent with the existing agreement. The amendment was accounted for as a modification of existing debt inaccordance with ASC 470-50. In connection with the amendment of the note purchase agreement, incremental fees of $0.6 million million were incurred andcapitalized.
Under terms of the notes, the Issuer has obtained $600 million of financing from the unrelated third party commercial paper conduits sponsored by JPMorganChase Bank, N.A., which indebtedness is secured by credit card receivables originated from time to time by SJI. The credit card receivables will ultimately betransferred to the Issuer and are serviced by SJI. Signet guarantees the performance by SJI of its obligations under the agreements associated with this financingarrangement. Borrowings under the asset-backed variable funding notes bear interest at a rate per annum equal to LIBOR plus an applicable margin. Paymentsreceived from customers for balances outstanding on securitized credit card receivables are utilized to repay amounts outstanding under the facility each period,while proceeds from the facility are received for incremental credit card
116

Table of Contents
receivables originated when the receivables are pledged to the Issuer. Such payments received from customers and proceeds from the facility are reflected on agross basis in the consolidated statements of cash flows. As of January 28, 2017 and January 30, 2016 , $600.0 million remained outstanding under thesecuritization facility with a weighted average interest rate of 2.05% and 1.61% during Fiscal 2017 and Fiscal 2016 , respectively.
Capitalized fees relating to the asset-backed securitization facility total $3.4 million . Accumulated amortization related to these capitalized fees as of January 28,2017 was $3.1 million ( January 30, 2016 : $2.4 million ). Amortization relating to these fees of $0.7 million and $1.5 million was recorded as interest expense inthe consolidated income statements for Fiscal 2017 and Fiscal 2016 , respectively.
Other
As of January 28, 2017 and January 30, 2016 , the Company was in compliance with all debt covenants.
As of January 28, 2017 and January 30, 2016 , there were $14.2 million and $24.4 million in overdrafts, which represent issued and outstanding checks where nobank balances exist with the right of offset.
21 . Accrued expenses and other current liabilities
(in millions)January 28,
2017 January 30, 2016
Accrued compensation $ 105.8 $ 162.3Other liabilities 33.0 36.0Other taxes 45.1 45.1Payroll taxes 9.9 11.5Accrued expenses 284.4 243.4
Total accrued expenses and other current liabilities $ 478.2 $ 498.3
The sales returns reserve, included in accrued expenses, is as follows:
(in millions) Fiscal 2017 Fiscal 2016 Fiscal 2015
Sales return reserve, beginning of period $ 14.0 $ 15.3 $ 8.4Net adjustment (1) (1.0) (1.3) 6.9
Sales return reserve, end of period $ 13.0 $ 14.0 $ 15.3(1) Net adjustment relates to sales returns previously provided for, changes in estimate and the impact of foreign exchange translation.
Sterling Jewelers and Zale Jewelry segments provide a product lifetime diamond guarantee as long as six-month inspections are performed and certified by anauthorized store representative. Provided the customer has complied with the six -month inspection policy, the Company will replace, at no cost to the customer,any stone that chips, breaks or is lost from its original setting during normal wear. Management estimates the warranty accrual based on the lag of actual claimsexperience and the costs of such claims, inclusive of labor and material. Sterling Jewelers also provides a similar product lifetime guarantee on color gemstones.The warranty reserve for diamond and gemstone guarantee, included in accrued expenses and other current liabilities and other non-current liabilities, is as follows:
(in millions) Fiscal 2017 Fiscal 2016 Fiscal 2015
Warranty reserve, beginning of period $ 41.9 $ 44.9 $ 19.1Warranty obligations acquired — — 28.4Warranty expense (1) 11.5 10.8 7.4Utilized (2) (13.4) (13.8) (10.0)
Warranty reserve, end of period $ 40.0 $ 41.9 $ 44.9(1) Includes impact of acquisition accounting adjustment related to warranty obligations acquired in the Zale Acquisition.(2) Includes impact of foreign exchange translation.
117

Table of Contents
(in millions)January 28,
2017 January 30,
2016
Disclosed as: Current liabilities (1) $ 13.0 $ 12.3Non-current liabilities (see Note 23) 27.0 29.6
Total warranty reserve $ 40.0 $ 41.9(1) Included within accrued expenses above.
22 . Deferred revenue
Deferred revenue is comprised primarily of ESP and voucher promotions and other as follows:
(in millions)January 28,
2017 January 30,
2016
Sterling Jewelers ESP deferred revenue $ 737.4 $ 715.1Zale ESP deferred revenue 168.2 146.1Voucher promotions and other 30.3 28.2
Total deferred revenue $ 935.9 $ 889.4
Disclosed as: Current liabilities $ 276.9 $ 260.3Non-current liabilities 659.0 629.1
Total deferred revenue $ 935.9 $ 889.4
ESP deferred revenue
(in millions) Fiscal 2017 Fiscal 2016
Sterling Jewelers ESP deferred revenue, beginning of period $ 715.1 $ 668.9Plans sold 290.8 281.2Revenue recognized (268.5) (235.0)
Sterling Jewelers ESP deferred revenue, end of period $ 737.4 $ 715.1
(in millions) Fiscal 2017 Fiscal 2016
Zale ESP deferred revenue, beginning of period $ 146.1 $ 120.3Plans sold (1) 150.1 138.6Revenue recognized (128.0) (112.8)
Zale ESP deferred revenue, end of period $ 168.2 $ 146.1(1) Includes impact of foreign exchange translation.
23 . Other liabilities—non-current
(in millions)January 28,
2017 January 30,
2016
Straight-line rent $ 87.2 $ 81.2Deferred compensation 40.7 36.5Warranty reserve 27.0 29.6Lease loss reserve 1.3 3.4Other liabilities 57.5 79.8
Total other liabilities $ 213.7 $ 230.5
A lease loss reserve is recorded for the net present value of the difference between the contractual rent obligations and sublease income expected from theproperties.
118
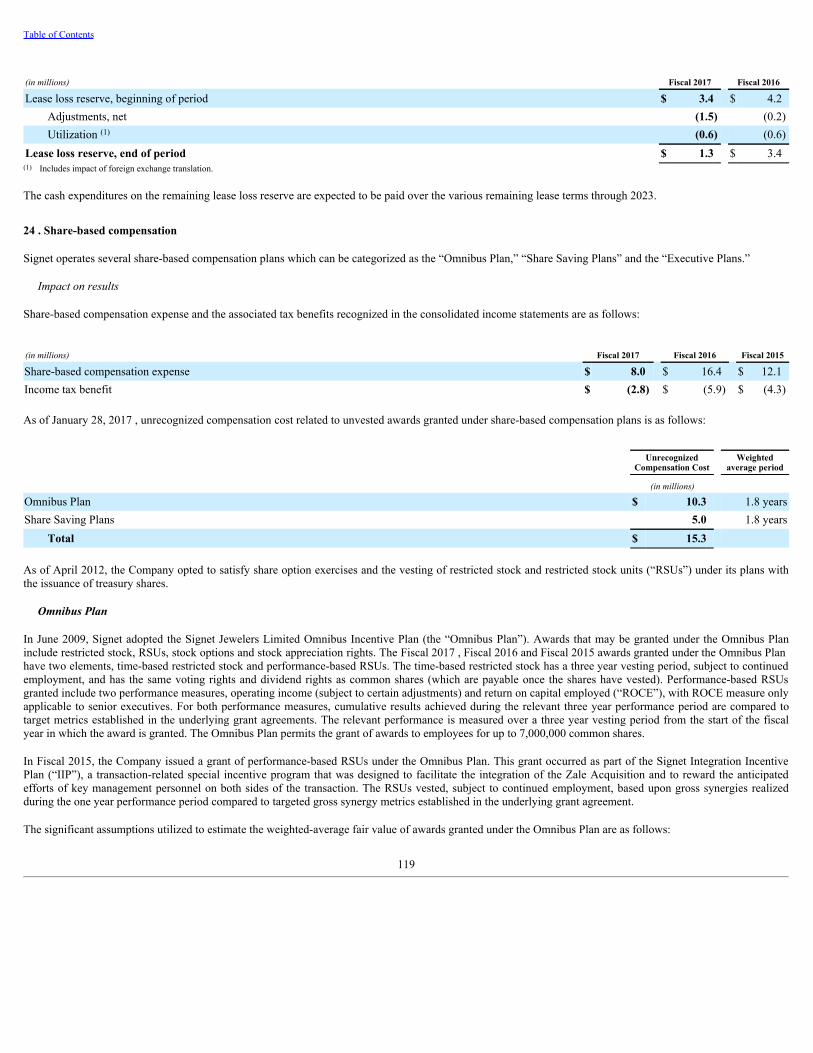
Table of Contents
(in millions) Fiscal 2017 Fiscal 2016
Lease loss reserve, beginning of period $ 3.4 $ 4.2Adjustments, net (1.5) (0.2)Utilization (1) (0.6) (0.6)
Lease loss reserve, end of period $ 1.3 $ 3.4(1) Includes impact of foreign exchange translation.
The cash expenditures on the remaining lease loss reserve are expected to be paid over the various remaining lease terms through 2023.
24 . Share-based compensation
Signet operates several share-based compensation plans which can be categorized as the “Omnibus Plan,” “Share Saving Plans” and the “Executive Plans.”
Impact on results
Share-based compensation expense and the associated tax benefits recognized in the consolidated income statements are as follows:
(in millions) Fiscal 2017 Fiscal 2016 Fiscal 2015
Share-based compensation expense $ 8.0 $ 16.4 $ 12.1Income tax benefit $ (2.8) $ (5.9) $ (4.3)
As of January 28, 2017 , unrecognized compensation cost related to unvested awards granted under share-based compensation plans is as follows:
Unrecognized
Compensation Cost Weighted
average period
(in millions) Omnibus Plan $ 10.3 1.8 yearsShare Saving Plans 5.0 1.8 years
Total $ 15.3
As of April 2012, the Company opted to satisfy share option exercises and the vesting of restricted stock and restricted stock units (“RSUs”) under its plans withthe issuance of treasury shares.
Omnibus Plan
In June 2009, Signet adopted the Signet Jewelers Limited Omnibus Incentive Plan (the “Omnibus Plan”). Awards that may be granted under the Omnibus Planinclude restricted stock, RSUs, stock options and stock appreciation rights. The Fiscal 2017 , Fiscal 2016 and Fiscal 2015 awards granted under the Omnibus Planhave two elements, time-based restricted stock and performance-based RSUs. The time-based restricted stock has a three year vesting period, subject to continuedemployment, and has the same voting rights and dividend rights as common shares (which are payable once the shares have vested). Performance-based RSUsgranted include two performance measures, operating income (subject to certain adjustments) and return on capital employed (“ROCE”), with ROCE measure onlyapplicable to senior executives. For both performance measures, cumulative results achieved during the relevant three year performance period are compared totarget metrics established in the underlying grant agreements. The relevant performance is measured over a three year vesting period from the start of the fiscalyear in which the award is granted. The Omnibus Plan permits the grant of awards to employees for up to 7,000,000 common shares.
In Fiscal 2015, the Company issued a grant of performance-based RSUs under the Omnibus Plan. This grant occurred as part of the Signet Integration IncentivePlan (“IIP”), a transaction-related special incentive program that was designed to facilitate the integration of the Zale Acquisition and to reward the anticipatedefforts of key management personnel on both sides of the transaction. The RSUs vested, subject to continued employment, based upon gross synergies realizedduring the one year performance period compared to targeted gross synergy metrics established in the underlying grant agreement.
The significant assumptions utilized to estimate the weighted-average fair value of awards granted under the Omnibus Plan are as follows:
119
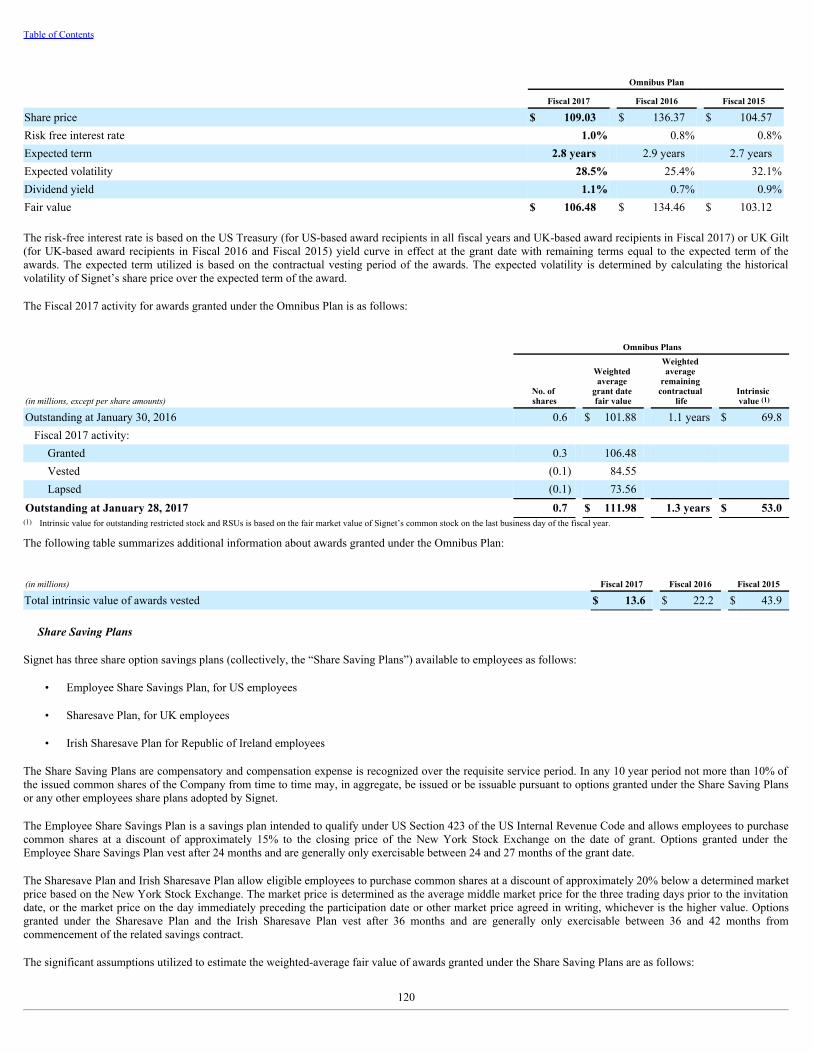
Table of Contents
Omnibus Plan
Fiscal 2017 Fiscal 2016 Fiscal 2015
Share price $ 109.03 $ 136.37 $ 104.57Risk free interest rate 1.0% 0.8% 0.8%Expected term 2.8 years 2.9 years 2.7 yearsExpected volatility 28.5% 25.4% 32.1%Dividend yield 1.1% 0.7% 0.9%Fair value $ 106.48 $ 134.46 $ 103.12
The risk-free interest rate is based on the US Treasury (for US-based award recipients in all fiscal years and UK-based award recipients in Fiscal 2017) or UK Gilt(for UK-based award recipients in Fiscal 2016 and Fiscal 2015) yield curve in effect at the grant date with remaining terms equal to the expected term of theawards. The expected term utilized is based on the contractual vesting period of the awards. The expected volatility is determined by calculating the historicalvolatility of Signet’s share price over the expected term of the award.
The Fiscal 2017 activity for awards granted under the Omnibus Plan is as follows:
Omnibus Plans
(in millions, except per share amounts)No. of shares
Weighted average
grant date fair value
Weighted average
remaining contractual
life Intrinsic value (1)
Outstanding at January 30, 2016 0.6 $ 101.88 1.1 years $ 69.8Fiscal 2017 activity:
Granted 0.3 106.48 Vested (0.1) 84.55 Lapsed (0.1) 73.56
Outstanding at January 28, 2017 0.7 $ 111.98 1.3 years $ 53.0(1) Intrinsic value for outstanding restricted stock and RSUs is based on the fair market value of Signet’s common stock on the last business day of the fiscal year.
The following table summarizes additional information about awards granted under the Omnibus Plan:
(in millions) Fiscal 2017 Fiscal 2016 Fiscal 2015
Total intrinsic value of awards vested $ 13.6 $ 22.2 $ 43.9
Share Saving Plans
Signet has three share option savings plans (collectively, the “Share Saving Plans”) available to employees as follows:
• Employee Share Savings Plan, for US employees
• Sharesave Plan, for UK employees
• Irish Sharesave Plan for Republic of Ireland employees
The Share Saving Plans are compensatory and compensation expense is recognized over the requisite service period. In any 10 year period not more than 10% ofthe issued common shares of the Company from time to time may, in aggregate, be issued or be issuable pursuant to options granted under the Share Saving Plansor any other employees share plans adopted by Signet.
The Employee Share Savings Plan is a savings plan intended to qualify under US Section 423 of the US Internal Revenue Code and allows employees to purchasecommon shares at a discount of approximately 15% to the closing price of the New York Stock Exchange on the date of grant. Options granted under theEmployee Share Savings Plan vest after 24 months and are generally only exercisable between 24 and 27 months of the grant date.
The Sharesave Plan and Irish Sharesave Plan allow eligible employees to purchase common shares at a discount of approximately 20% below a determined marketprice based on the New York Stock Exchange. The market price is determined as the average middle market price for the three trading days prior to the invitationdate, or the market price on the day immediately preceding the participation date or other market price agreed in writing, whichever is the higher value. Optionsgranted under the Sharesave Plan and the Irish Sharesave Plan vest after 36 months and are generally only exercisable between 36 and 42 months fromcommencement of the related savings contract.
The significant assumptions utilized to estimate the weighted-average fair value of awards granted under the Share Saving Plans are as follows:
120

Table of Contents
Share Saving Plans
Fiscal 2017 Fiscal 2016 Fiscal 2015
Share price $ 84.37 $ 139.18 $ 114.93Exercise price $ 67.24 $ 114.67 $ 96.67Risk free interest rate 0.6% 0.7% 0.9%Expected term 2.7 years 2.6 years 2.8 yearsExpected volatility 31.3% 27.1% 27.6%Dividend yield 1.7% 0.8% 0.8%Fair value $ 22.82 $ 34.76 $ 28.76
The risk-free interest rate is based on the US Treasury (for US-based award recipients) or UK Gilt (for UK-based award recipients) yield curve in effect at the grantdate with remaining terms equal to the expected term of the awards. The expected term utilized is based on the contractual vesting period of the awards, inclusiveof any exercise period available to award recipients after vesting. The expected volatility is determined by calculating the historical volatility of Signet’s shareprice over the expected term of the awards.
The Fiscal 2017 activity for awards granted under the Share Saving Plans is as follows:
Share Saving Plans
(in millions, except per share amounts)No. of shares
Weighted average exercise
price
Weighted average
remaining contractual
life Intrinsic value (1)
Outstanding at January 30, 2016 0.2 $ 94.07 1.9 years $ 4.9Fiscal 2017 activity:
Granted 0.2 67.24 Exercised — 48.78 Lapsed (0.1) 101.34
Outstanding at January 28, 2017 0.3 $ 74.30 2.0 years $ 3.0Exercisable at January 30, 2016 — $ — $ —Exercisable at January 28, 2017 — $ — $ —
(1) Intrinsic value for outstanding awards is based on the fair market value of Signet’s common stock on the last business day of the fiscal year.
The following table summarizes additional information about awards granted under the Share Saving Plans:
(in millions, except per share amounts) Fiscal 2017 Fiscal 2016 Fiscal 2015
Weighted average grant date fair value per share of awards granted $ 22.82 $ 34.76 $ 28.76Total intrinsic value of options exercised $ 1.5 $ 6.4 $ 11.0Cash received from share options exercised $ 1.4 $ 4.0 $ 4.3
Executive Plans
Signet operates three 2003 executive share plans (the “2003 Plans”), together referred to as the “Executive Plans.” Option awards under the Executive Plans weregenerally granted with an exercise price equal to the market price of the Company’s shares at the date of grant. No awards have been granted under the ExecutivePlans since the adoption of the Omnibus Plan in Fiscal 2010. During Fiscal 2014, the plan periods for the Executive Plans expired. As a result, no additionalawards may be granted under the Executive Plans.
The following table summarizes additional information about awards granted under the Executive Plans:
(in millions) Fiscal 2017 Fiscal 2016 Fiscal 2015
Total intrinsic value of options exercised $ 0.6 $ 3.4 $ 2.9Cash received from share options exercised $ 0.7 $ 1.0 $ 1.8
As of January 28, 2017 and January 30, 2016 , the intrinsic value of unexercised awards outstanding under the Executive Plans was $0.3 million and $1.5 million ,respectively. The outstanding awards, which are all exercisable, expire prior to the end of 2018.
121

Table of Contents
25 . Commitments and contingencies
Operating leases
Signet occupies certain properties and holds machinery and vehicles under operating leases. Rental expense for operating leases is as follows:
(in millions) Fiscal 2017 Fiscal 2016 Fiscal 2015
Minimum rentals $ 524.4 $ 525.7 $ 462.9Contingent rent 10.2 15.3 14.0Sublease income (0.6) (0.7) (0.8)
Total $ 534.0 $ 540.3 $ 476.1
The future minimum operating lease payments for operating leases having initial or non-cancelable terms in excess of one year are as follows:
(in millions) Fiscal 2018 $ 450.0Fiscal 2019 370.6Fiscal 2020 329.8Fiscal 2021 301.2Fiscal 2022 265.6Thereafter 901.1
Total $ 2,618.3
Contingent property liabilities
Approximately 26 UK property leases had been assigned by Signet at January 28, 2017 (and remained unexpired and occupied by assignees at that date) andapproximately 12 additional properties were sub-leased at that date. Should the assignees or sub-tenants fail to fulfill any obligations in respect of those leases orany other leases which have at any other time been assigned or sub-leased, Signet or one of its UK subsidiaries may be liable for those defaults. The number ofsuch claims arising to date has been small, and the liability, which is charged to the income statement as it arises, has not been material.
Capital commitments
At January 28, 2017 Signet has committed to spend $48.4 million ( January 30, 2016 : $28.9 million ) related to capital commitments. These commitmentsprincipally relate to the expansion and renovation of stores.
Legal proceedings
Employment practices
As previously reported, in March 2008, a group of private plaintiffs (the “Claimants”) filed a class action lawsuit for an unspecified amount against SJI, asubsidiary of Signet, in the US District Court for the Southern District of New York alleging that US store-level employment practices are discriminatory as tocompensation and promotional activities with respect to gender. In June 2008, the District Court referred the matter to private arbitration where the Claimantssought to proceed on a class-wide basis. The Claimants filed a motion for class certification and SJI opposed the motion. A hearing on the class certificationmotion was held in late February 2014. On February 2, 2015, the arbitrator issued a Class Determination Award in which she certified for a class-wide hearingClaimants’ disparate impact declaratory and injunctive relief class claim under Title VII, with a class period of July 22, 2004 through date of trial for theClaimants’ compensation claims and December 7, 2004 through date of trial for Claimants’ promotion claims. The arbitrator otherwise denied Claimants’ motionto certify a disparate treatment class alleged under Title VII, denied a disparate impact monetary damages class alleged under Title VII, and denied an opt-outmonetary damages class under the Equal Pay Act. On February 9, 2015, Claimants filed an Emergency Motion To Restrict Communications With The CertifiedClass And For Corrective Notice. SJI filed its opposition to Claimants’ emergency motion on February 17, 2015, and a hearing was held on February 18,2015. Claimants’ motion was granted in part and denied in part in an order issued on March 16, 2015. Claimants filed a Motion for Reconsideration RegardingTitle VII Claims for Disparate Treatment in Compensation on February 11, 2015. SJI filed its opposition to Claimants’ Motion for Reconsideration on March 4,2015. Claimants’ reply was filed on March 16, 2015. Claimants’ Motion was denied in an order issued April 27, 2015. SJI filed with the US District Court for theSouthern District of New York a Motion to Vacate the Arbitrator’s Class Certification Award on March 3, 2015. Claimants’ opposition was filed on March 23,2015 and SJI’s reply was filed on April 3, 2015. SJI’s motion was heard on May 4, 2015. On November 16, 2015, the US District Court for the Southern District ofNew York granted SJI’s Motion to Vacate the Arbitrator’s Class Certification Award in part and denied it in part. On November 25, 2015, SJI filed a Motion toStay the AAA Proceedings while SJI appeals the decision of the US District Court for the Southern District of New York to the United States Court of Appeals forthe Second Circuit. Claimants filed their opposition on December 2, 2015. On December 3, 2015, SJI filed with the United States Court of Appeals for the SecondCircuit SJI’s Notice of Appeal of the
122

Table of Contents
Southern District’s November 16, 2015 Opinion and Order. The arbitrator issued an order denying SJI’s Motion to Stay on February 22, 2016. SJI filed its Briefand Special Appendix with the Second Circuit on March 16, 2016. The matter was fully briefed and oral argument was heard by the U.S. Court of Appeals for theSecond Circuit on November 2, 2016. On April 6, 2015, Claimants filed in the AAA Claimants’ Motion for Clarification or in the Alternative Motion for Stay ofthe Effect of the Class Certification Award as to the Individual Intentional Discrimination Claims. SJI filed its opposition on May 12, 2015. Claimants’ reply wasfiled on May 22, 2015. Claimants’ motion was granted on June 15, 2015. Claimants filed Claimants’ Motion for Conditional Certification of Claimants’ Equal PayAct Claims and Authorization of Notice on March 6, 2015. SJI’s opposition was filed on May 1, 2015. Claimants filed their reply on June 5, 2015. The arbitratorheard oral argument on Claimants’ Motion on December 18, 2015 and, on February 29, 2016, issued an Equal Pay Act Collective Action Conditional CertificationAward and Order Re Claimants’ Motion For Tolling Of EPA Limitations Period, conditionally certifying Claimants’ Equal Pay Act claims as a collective action,and tolling the statute of limitations on EPA claims to October 16, 2003 to ninety days after notice issues to the putative members of the collective action. SJI filedin the AAA a Motion To Stay Arbitration Pending The District Court’s Consideration Of Respondent’s Motion To Vacate Arbitrator’s Equal Pay Act CollectiveAction Conditional Certification Award And Order Re Claimants’ Motion For Tolling Of EPA Limitations Period on March 10, 2016. SJI filed in the AAA aRenewed Motion To Stay Arbitration Pending The District Court’s Resolution Of Sterling’s Motion To Vacate Arbitrator’s Equal Pay Act Collective ActionConditional Certification Award And Order Re Claimants’ Motion For Tolling Of EPA Limitations Period on March 31, 2016. Claimants filed their opposition onApril 4, 2016. The arbitrator denied SJI’s Motion on April 5, 2016. On March 23, 2016 SJI filed with the US District Court for the Southern District of New Yorka Motion To Vacate The Arbitrator’s Equal Pay Act Collective Action Conditional Certification Award And Order Re Claimants’ Motion For Tolling Of EPALimitations Period. Claimants filed their opposition brief on April 11, 2016, SJI filed its reply on April 20, 2016, and oral argument was heard on SJI’s Motion onMay 11, 2016. SJI’s Motion was denied on May 22, 2016. On May 31, 2016, SJI filed a Notice Of Appeal of Judge Rakoff’s opinion and order to the SecondCircuit Court of Appeals. SJI’s brief was filed September 13, 2016, and Claimants’ brief was filed on December 13, 2016, and SJI filed its reply brief on January10, 2017. Claimants filed a Motion For Amended Class Determination Award on November 18, 2015, and on March 31, 2016 the arbitrator entered an orderamending the Title VII class certification award to preclude class members from requesting exclusion from the injunctive and declaratory relief class certified inthe arbitration. The arbitrator issued a Bifurcated Case Management Plan on April 5, 2016, and ordered into effect the parties’ Stipulation Regarding Notice OfEqual Pay Act Collective Action And Related Notice Administrative Procedures on April 7, 2016. SJI filed in the AAA a Motion For Protective Order on May 2,2016. Claimants’ opposition was filed on June 3, 2016. The matter was fully briefed and oral argument was heard on July 22, 2016. The motion was granted in parton January 27, 2017. Notice to EPA collective action members was issued on May 3, 2016, and the opt-in period for these notice recipients closed on August 1,2016. On January 4, 2017, the Arbitrator issued a Second Amended Bifurcated Case Management Order. At this time, 10,456 current and former employees havesubmitted consent forms to opt in to the collective action. We are awaiting a trial date in this matter, which we are anticipating to be set for calendar 2018.
Also, as previously reported, on September 23, 2008, the US Equal Employment Opportunity Commission (“EEOC”) filed a lawsuit against SJI in the US DistrictCourt for the Western District of New York. The EEOC’s lawsuit alleges that SJI engaged in intentional and disparate impact gender discrimination with respect topay and promotions of female retail store employees from January 1, 2003 to the present. The EEOC asserts claims for unspecified monetary relief and non-monetary relief against the Company on behalf of a class of female employees subjected to these alleged practices. Non-expert fact discovery closed in mid-May 2013. In September 2013, SJI made a motion for partial summary judgment on procedural grounds, which was referred to a Magistrate Judge. The MagistrateJudge heard oral arguments on the summary judgment motion in December 2013. On January 2, 2014, the Magistrate Judge issued his Report, Recommendationand Order, recommending that the Court grant SJI’s motion for partial summary judgment and dismiss the EEOC’s claims in their entirety. The EEOC filed itsobjections to the Magistrate Judge’s ruling and SJI filed its response thereto. The District Court Judge heard oral arguments on the EEOC’s objections to theMagistrate Judge’s ruling on March 7, 2014 and on March 11, 2014 entered an order dismissing the action with prejudice. On May 12, 2014, the EEOC filed itsNotice of Appeal of the District Court Judge’s dismissal of the action to United States Court of Appeals for the Second Circuit. The parties fully briefed the appealand oral argument occurred on May 5, 2015. On September 9, 2015, the United States Court of Appeals for the Second Circuit issued a decision vacating theDistrict Court’s order and remanding the case back to the District Court for further proceedings. SJI filed a Petition for Panel Rehearing and En Banc Review withthe United States Court of Appeals for the Second Circuit, which was denied on December 1, 2015. On December 4, 2015, SJI filed in the United States Court ofAppeals for the Second Circuit a Motion Of Appellee Sterling Jewelers Inc. For Stay Of Mandate Pending Petition For Writ Of Certiorari. The Motion was grantedby the Second Circuit on December 10, 2015. SJI filed a Petition For Writ Of Certiorari in the Supreme Court of the United States on April 29, 2016, which wasdenied. The case was remanded to the Western District of New York and on November 2, 2016, the Court issued a case scheduling order. On January 25, 2017, theparties filed a joint motion to extend case scheduling order deadlines. The motion was granted on January 27, 2017.
SJI denies the allegations of the Claimants and EEOC and has been defending these cases vigorously. At this point, no outcome or possible loss or range of losses,if any, arising from the litigation is able to be estimated.
Prior to the Acquisition, Zale Corporation was a defendant in three purported class action lawsuits, Tessa Hodge v. Zale Delaware, Inc., d/b/a Piercing Pagodawhich was filed on April 23, 2013 in the Superior Court of the State of California, County of San Bernardino; Naomi Tapia v. Zale Corporation which was filed onJuly 3, 2013 in the US District Court, Southern District of California; and Melissa Roberts v. Zale Delaware, Inc. which was filed on October 7, 2013 in theSuperior Court of the State of California, County of Los Angeles. All three cases include allegations that Zale Corporation violated various wage and hour laborlaws. Relief is sought on behalf of current and former Piercing Pagoda and Zale Corporation’s employees. The lawsuits seek to recover damages, penalties andattorneys’ fees as a result of the alleged violations. Without admitting
123

Table of Contents
or conceding any liability, the Company reached an agreement to settle the Hodge and Roberts matters for an immaterial amount. Final approval of the settlementwas granted on March 9, 2015 and the settlement was implemented.
On April 6, 2016, the Court conditionally certified an opt-in collective action under the Fair Labor Standards Act (“FLSA”) of all current and former employees ofZale Delaware Inc. d/b/a Zale Corporation who were designated by Zale as nonexempt and who worked in a Zale retail store in the United States at any time fromJuly 3, 2010 to the present. Additionally, the court certified an opt-out class action of the remaining claims on behalf of all current and former employees of ZaleDelaware Inc. d/b/a Zale Corporation who were designated by Zale as nonexempt, and worked in a Zale retail store in the State of California at any time from July3, 2009 to the present. On December 28, 2016, the Company participated in a mediation of all claims in the action. The mediation resulted in a settlementagreement signed by both parties. The settlement agreement is subject to court approval. The Company anticipates that the settlement will be approved on a finalbasis in 2017.
Litigation Challenging the Company’s Acquisition of Zale Corporation
Five putative stockholder class action lawsuits challenging the Company’s acquisition of Zale Corporation were filed in the Court of Chancery of the State ofDelaware: Breyer v. Zale Corp. et al., C.A. No. 9388-VCP, filed February 24, 2014; Stein v. Zale Corp. et al., C.A. No. 9408-VCP, filed March 3, 2014; Singh v.Zale Corp. et al., C.A. No. 9409-VCP, filed March 3, 2014; Smart v. Zale Corp. et al., C.A. No. 9420-VCP, filed March 6, 2014; and Pill v. Zale Corp. et al., C.A.No. 9440-VCP, filed March 12, 2014 (collectively, the “Actions”). Each of these Actions was brought by a purported former holder of Zale Corporation commonstock, both individually and on behalf of a putative class of former Zale Corporation stockholders.
The Court of Chancery consolidated the Actions on March 25, 2014 (the “Consolidated Action”), and the plaintiffs filed a consolidated amended complaint onApril 23, 2014, which named as defendants Zale Corporation, the members of the board of directors of Zale Corporation, the Company, and a merger-relatedsubsidiary of the Company, and alleged that the Zale Corporation directors breached their fiduciary duties to Zale Corporation stockholders in connection withtheir consideration and approval of the merger agreement by failing to maximize stockholder value and agreeing to an inadequate merger price and to deal termsthat deter higher bids. That complaint also alleged that the Zale Corporation directors issued a materially misleading and incomplete proxy statement regarding themerger and that Zale Corporation and the Company aided and abetted the Zale Corporation directors’ breaches of fiduciary duty. On May 23, 2014, the Court ofChancery denied plaintiffs’ motion for a preliminary injunction to prevent the consummation of the merger.
On September 30, 2014, the plaintiffs filed an amended complaint asserting substantially similar claims and allegations as the prior complaint. The amendedcomplaint added Zale Corporation’s former financial advisor, Bank of America Merrill Lynch, as a defendant for allegedly aiding and abetting the ZaleCorporation directors’ breaches of fiduciary duty. The amended complaint no longer named as defendants Zale Corporation or the Company’s merger-relatedsubsidiary. The amended complaint sought, among other things, rescission of the merger or damages, as well as attorneys’ and experts’ fees. The defendant’smotion to dismiss was heard by the Court of Chancery on May 20, 2015. On October 1, 2015, the Court dismissed the claims against the Zale Corporation directorsand the Company. On October 29, 2015, the Court dismissed the claims against Bank of America Merrill Lynch. On November 30, 2015, plaintiffs filed an appealof the October 1, 2015 and October 29, 2015 decisions of the Court of Chancery with the Supreme Court of the State of Delaware. On May 6, 2016, the SupremeCourt of the State of Delaware affirmed the Court of Chancery’s dismissal of the entirety of the amended complaint.
Appraisal Litigation
Following the consummation of the acquisition of Zale Corporation by the Company, former Zale Corporation stockholders sought appraisal pursuant to 8 Del. C.§ 262 in the Court of Chancery of the State of Delaware, in consolidated proceedings captioned Merion Capital L.P. et al. v. Zale Corp., C.A. No. 9731-VCP,TIGArbitrage Opportunity Fund I, L.P. v. Zale Corp., C.A. No. 10070-VCP,and The Gabelli ABC Fund et al. v. Zale Corp., C.A. No. 10162-VCP(the “AppraisalAction”). The total number of shares of Zale Corporation’s common stock for which appraisal had been demanded was approximately 8.8 million .
On August 12, 2015, the parties in the Appraisal Action entered into a settlement agreement (the “Settlement Agreement”). The terms of the Settlement Agreementprovided for the payment to petitioners in the Appraisal Action of $21.00 per share of Zale Corporation common stock (the consideration offered in the Company’sacquisition of Zale Corporation) plus a total sum of $34.2 million to be allocated among petitioners, which proceeds are inclusive of and in satisfaction of anystatutory interest that may have accrued on petitioners’ shares pursuant to 8 Del. C. § 262. On August 12, 2015, the Court of Chancery dismissed the AppraisalAction pursuant to the Settlement Agreement as to all former Zale Corporation stockholders who have submitted and not withdrawn a demand for appraisal. TheCompany recorded an accrual for the Settlement Agreement of $34.2 million during the second quarter of Fiscal 2016. This amount was paid to petitioners duringthe third quarter of Fiscal 2016.
Shareholder Action
On August 25, 2016, Susan Dube filed a putative class action complaint in the United States District Court for the Southern District of New York against theCompany and its Chief Executive Officer and Chief Financial Officer, purportedly on behalf of stockholders that acquired the Company’s securities betweenJanuary 7, 2016, and June 3, 2016, inclusive (Dube v. Signet Jewelers Limited, et al., Civ. No. 16-6728 (S.D.N.Y.)). On August 31, 2016, Lyubomir Spasov filed aputative class action complaint in the United States District Court for the Southern District of New York alleging identical claims against the Company and itsChief Executive Officer and Chief Financial Officer (Spasov v. Signet Jewelers Limited, et al., Civ. No. 16-06861 (S.D.N.Y.)). On September 16, 2016, the twocomplaints were consolidated under case number 16-CV-6728, and on November 21,
124

Table of Contents
2016, Susan Dube and Lyubomir Spasov were named co-lead plaintiffs. On January 30, 2017, co-lead plaintiffs filed an amended complaint purportedly on behalfof a putative class of stockholders that acquired the Company’s securities between November 25, 2014, and August 25, 2016, which alleged that defendantsviolated Sections 10(b) and 20(a) of the Securities Exchange Act of 1934 by, among other things, misrepresenting the Company’s business and earnings by failingto disclose that the Company was allegedly experiencing difficulty ensuring the safety of customer’s jewelry while in Signet’s custody for repairs, which resultedin a drop-off in customer confidence, and making misleading statements about its credit portfolio. The amended complaint alleged that as a result of the allegedmisrepresentations, the Company’s share price was artificially inflated and sought unspecified compensatory damages and costs and expenses, including attorneys’and experts’ fees. On March 1, 2017, Plaintiffs sought leave from the Court to file a second amended complaint to add additional allegations and/or claimsconcerning public reports of sexual harassment allegations raised by certain claimants in an ongoing pay and promotion gender discrimination class arbitration.The Court granted Plaintiffs’ request and the second amended complaint is due to be filed on or before April 3, 2017. Defendants’ have until May 19, 2017, toanswer or move to dismiss the second amended complaint. The Company believes that plaintiffs’ allegations are without merit and cannot estimate a range ofpotential liability, if any, at this time.
In the ordinary course of business, Signet may be subject, from time to time, to various other proceedings, lawsuits, disputes or claims incidental to its business,which the Company believes are not significant to Signet’s consolidated financial position, results of operations or cash flows.
26 . Condensed consolidating financial information
The accompanying condensed consolidating financial information has been prepared and presented pursuant to SEC Regulation S-X, Rule 3-10, “FinancialStatements of Guarantors and Issuers of Guaranteed Securities Registered or Being Registered.” We and certain of our subsidiaries have guaranteed the obligationsunder certain debt securities that have been issued by Signet UK Finance plc. The following presents the condensed consolidating financial information for: (i) theindirect Parent Company (Signet Jewelers Limited); (ii) the Issuer of the guaranteed obligations (Signet UK Finance plc); (iii) the Guarantor subsidiaries, on acombined basis; (iv) the non-guarantor subsidiaries, on a combined basis; (v) consolidating eliminations; and (vi) Signet Jewelers Limited and Subsidiaries on aconsolidated basis. Each Guarantor subsidiary is 100% owned by the Parent Company at the date of each balance sheet presented. The Guarantor subsidiaries,along with Signet Jewelers Limited, will fully and unconditionally guarantee the obligations of Signet UK Finance plc under any such debt securities. Each entityin the consolidating financial information follows the same accounting policies as described in the consolidated financial statements.
The accompanying condensed consolidating financial information has been presented on the equity method of accounting for all periods presented. Under thismethod, investments in subsidiaries are recorded at cost and adjusted for the subsidiaries’ cumulative results of operations, capital contributions and distributions,and other changes in equity. Elimination entries include consolidating and eliminating entries for investments in subsidiaries, and intra-entity activity and balances.
125

Table of Contents
Condensed Consolidating Income StatementFor the 52 week period ended January 28, 2017
(in millions)
Signet Jewelers Limited
Signet UK Finance plc
Guarantor Subsidiaries
Non- Guarantor Subsidiaries Eliminations Consolidated
Sales $ — $ — $ 6,141.9 $ 266.5 $ — $ 6,408.4Cost of sales — — (3,997.2) (50.4) — (4,047.6)
Gross margin — — 2,144.7 216.1 — 2,360.8Selling, general and administrative expenses (1.3) — (1,775.1) (103.8) — (1,880.2)Other operating income, net — — 293.8 (11.2) — 282.6
Operating (loss) income (1.3) — 663.4 101.1 — 763.2Intra-entity interest income (expense) — 18.8 (188.4) 169.6 — —Interest expense, net — (19.8) (16.6) (13.0) — (49.4)
(Loss) income before income taxes (1.3) (1.0) 458.4 257.7 — 713.8Income taxes — 0.2 (175.1) 4.3 — (170.6)Equity in income of subsidiaries 544.5 — 276.4 295.7 (1,116.6) —
Net income (loss) 543.2 (0.8) 559.7 557.7 (1,116.6) 543.2Dividends on redeemable convertible preferred shares (11.9) — — — — (11.9)
Net income (loss) attributable to common shareholders $ 531.3 $ (0.8) $ 559.7 $ 557.7 $ (1,116.6) $ 531.3
126
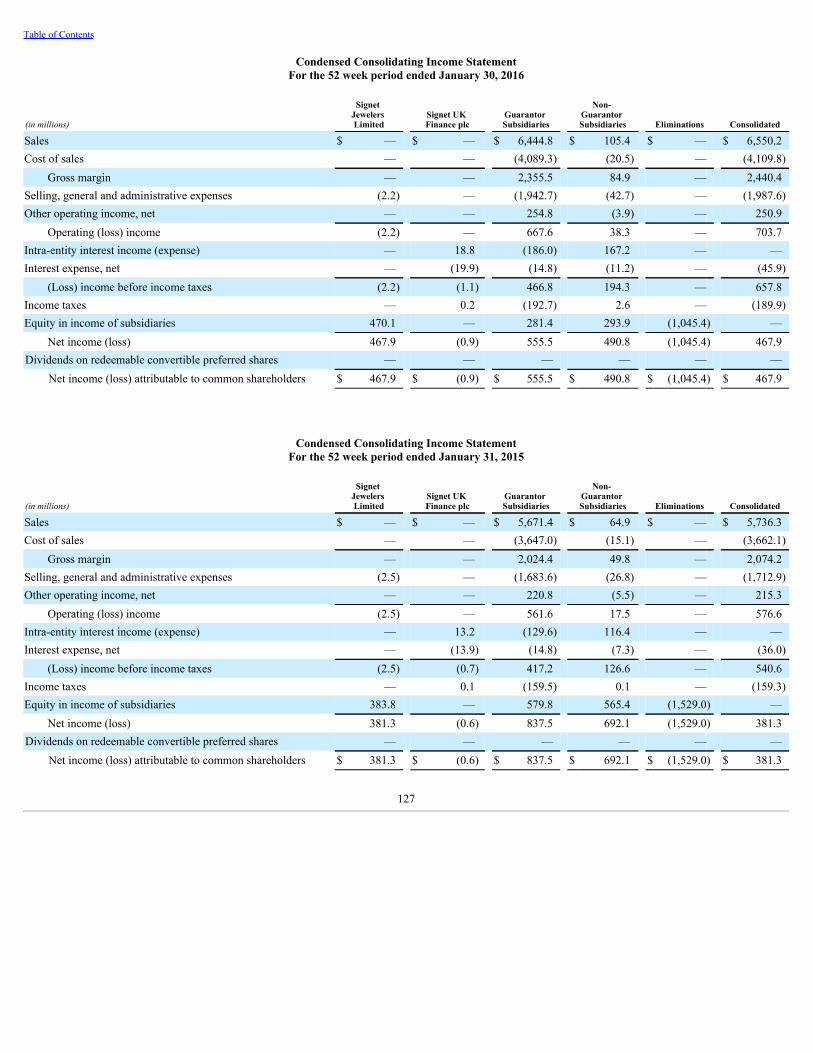
Table of Contents
Condensed Consolidating Income StatementFor the 52 week period ended January 30, 2016
(in millions)
Signet Jewelers Limited
Signet UK Finance plc
Guarantor Subsidiaries
Non- Guarantor Subsidiaries Eliminations Consolidated
Sales $ — $ — $ 6,444.8 $ 105.4 $ — $ 6,550.2Cost of sales — — (4,089.3) (20.5) — (4,109.8)
Gross margin — — 2,355.5 84.9 — 2,440.4Selling, general and administrative expenses (2.2) — (1,942.7) (42.7) — (1,987.6)Other operating income, net — — 254.8 (3.9) — 250.9
Operating (loss) income (2.2) — 667.6 38.3 — 703.7Intra-entity interest income (expense) — 18.8 (186.0) 167.2 — —Interest expense, net — (19.9) (14.8) (11.2) — (45.9)
(Loss) income before income taxes (2.2) (1.1) 466.8 194.3 — 657.8Income taxes — 0.2 (192.7) 2.6 — (189.9)Equity in income of subsidiaries 470.1 — 281.4 293.9 (1,045.4) —
Net income (loss) 467.9 (0.9) 555.5 490.8 (1,045.4) 467.9Dividends on redeemable convertible preferred shares — — — — — —
Net income (loss) attributable to common shareholders $ 467.9 $ (0.9) $ 555.5 $ 490.8 $ (1,045.4) $ 467.9
Condensed Consolidating Income StatementFor the 52 week period ended January 31, 2015
(in millions)
Signet Jewelers Limited
Signet UK Finance plc
Guarantor Subsidiaries
Non- Guarantor Subsidiaries Eliminations Consolidated
Sales $ — $ — $ 5,671.4 $ 64.9 $ — $ 5,736.3Cost of sales — — (3,647.0) (15.1) — (3,662.1)
Gross margin — — 2,024.4 49.8 — 2,074.2Selling, general and administrative expenses (2.5) — (1,683.6) (26.8) — (1,712.9)Other operating income, net — — 220.8 (5.5) — 215.3
Operating (loss) income (2.5) — 561.6 17.5 — 576.6Intra-entity interest income (expense) — 13.2 (129.6) 116.4 — —Interest expense, net — (13.9) (14.8) (7.3) — (36.0)
(Loss) income before income taxes (2.5) (0.7) 417.2 126.6 — 540.6Income taxes — 0.1 (159.5) 0.1 — (159.3)Equity in income of subsidiaries 383.8 — 579.8 565.4 (1,529.0) —
Net income (loss) 381.3 (0.6) 837.5 692.1 (1,529.0) 381.3Dividends on redeemable convertible preferred shares — — — — — —
Net income (loss) attributable to common shareholders $ 381.3 $ (0.6) $ 837.5 $ 692.1 $ (1,529.0) $ 381.3
127

Table of Contents
Condensed Consolidating Statement of Comprehensive IncomeFor the 52 week period ended January 28, 2017
(in millions)
Signet Jewelers Limited
Signet UK Finance plc
Guarantor Subsidiaries
Non- Guarantor Subsidiaries Eliminations Consolidated
Net income (loss) $ 543.2 $ (0.8) $ 559.7 $ 557.7 $ (1,116.6) $ 543.2Other comprehensive (loss) income:
Foreign currency translation adjustments (25.6) — (31.2) 5.6 25.6 (25.6)Available-for-sale securities:
Unrealized gain (loss) — — — — — —Cash flow hedges:
Unrealized gain (loss) 6.9 — 6.9 — (6.9) 6.9Reclassification adjustment for losses to net income (0.6) — (0.6) — 0.6 (0.6)
Pension plan: Actuarial gain (loss) (13.6) — (13.6) — 13.6 (13.6)Reclassification adjustment to net income for
amortization of actuarial losses 1.2 — 1.2 — (1.2) 1.2Prior service costs (0.4) — (0.4) — 0.4 (0.4)Reclassification adjustment to net income for
amortization of net prior service credits (1.5) — (1.5) — 1.5 (1.5)Total other comprehensive (loss) income (33.6) — (39.2) 5.6 33.6 (33.6)Total comprehensive income (loss) $ 509.6 $ (0.8) $ 520.5 $ 563.3 $ (1,083.0) $ 509.6
128
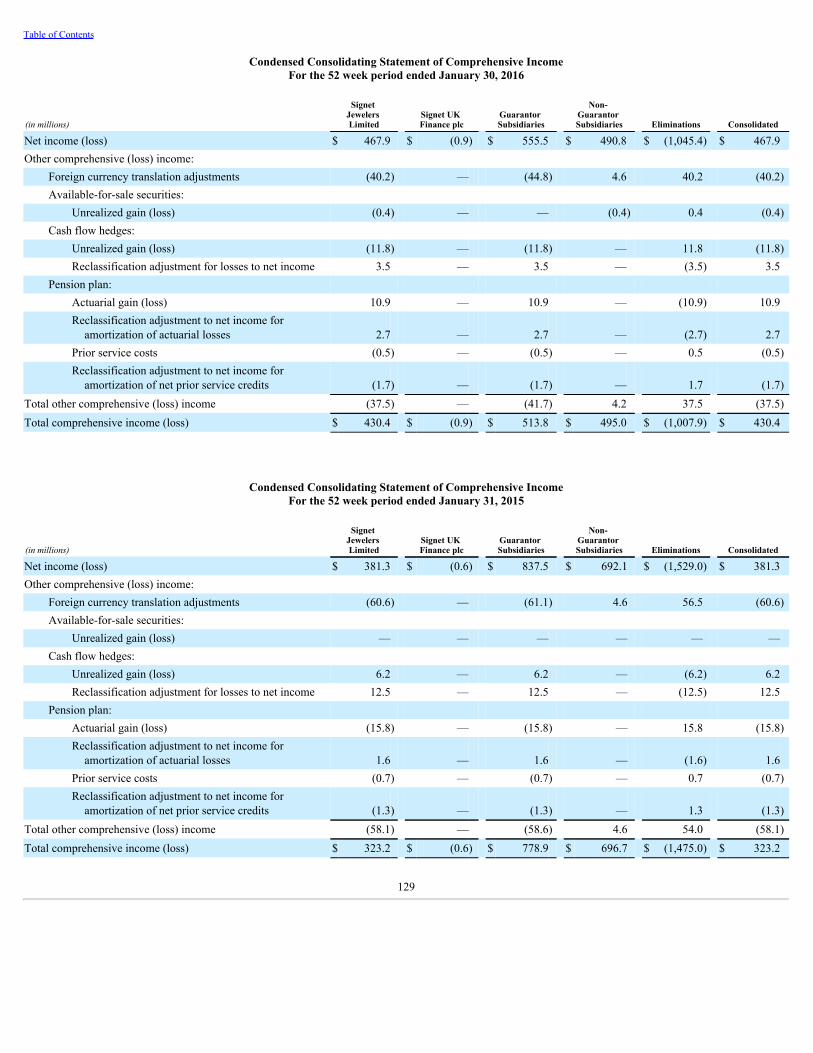
Table of Contents
Condensed Consolidating Statement of Comprehensive IncomeFor the 52 week period ended January 30, 2016
(in millions)
Signet Jewelers Limited
Signet UK Finance plc
Guarantor Subsidiaries
Non- Guarantor Subsidiaries Eliminations Consolidated
Net income (loss) $ 467.9 $ (0.9) $ 555.5 $ 490.8 $ (1,045.4) $ 467.9Other comprehensive (loss) income:
Foreign currency translation adjustments (40.2) — (44.8) 4.6 40.2 (40.2)Available-for-sale securities:
Unrealized gain (loss) (0.4) — — (0.4) 0.4 (0.4)Cash flow hedges:
Unrealized gain (loss) (11.8) — (11.8) — 11.8 (11.8)Reclassification adjustment for losses to net income 3.5 — 3.5 — (3.5) 3.5
Pension plan: Actuarial gain (loss) 10.9 — 10.9 — (10.9) 10.9Reclassification adjustment to net income for
amortization of actuarial losses 2.7 — 2.7 — (2.7) 2.7Prior service costs (0.5) — (0.5) — 0.5 (0.5)Reclassification adjustment to net income for
amortization of net prior service credits (1.7) — (1.7) — 1.7 (1.7)Total other comprehensive (loss) income (37.5) — (41.7) 4.2 37.5 (37.5)Total comprehensive income (loss) $ 430.4 $ (0.9) $ 513.8 $ 495.0 $ (1,007.9) $ 430.4
Condensed Consolidating Statement of Comprehensive IncomeFor the 52 week period ended January 31, 2015
(in millions)
Signet Jewelers Limited
Signet UK Finance plc
Guarantor Subsidiaries
Non- Guarantor Subsidiaries Eliminations Consolidated
Net income (loss) $ 381.3 $ (0.6) $ 837.5 $ 692.1 $ (1,529.0) $ 381.3Other comprehensive (loss) income:
Foreign currency translation adjustments (60.6) — (61.1) 4.6 56.5 (60.6)Available-for-sale securities:
Unrealized gain (loss) — — — — — —Cash flow hedges:
Unrealized gain (loss) 6.2 — 6.2 — (6.2) 6.2Reclassification adjustment for losses to net income 12.5 — 12.5 — (12.5) 12.5
Pension plan: Actuarial gain (loss) (15.8) — (15.8) — 15.8 (15.8)Reclassification adjustment to net income for
amortization of actuarial losses 1.6 — 1.6 — (1.6) 1.6Prior service costs (0.7) — (0.7) — 0.7 (0.7)Reclassification adjustment to net income for
amortization of net prior service credits (1.3) — (1.3) — 1.3 (1.3)Total other comprehensive (loss) income (58.1) — (58.6) 4.6 54.0 (58.1)Total comprehensive income (loss) $ 323.2 $ (0.6) $ 778.9 $ 696.7 $ (1,475.0) $ 323.2
129

Table of Contents
Condensed Consolidating Balance SheetJanuary 28, 2017
(in millions)
Signet Jewelers Limited
Signet UK Finance plc
Guarantor Subsidiaries
Non- Guarantor Subsidiaries Eliminations Consolidated
Assets Current assets:
Cash and cash equivalents $ 1.7 $ 0.1 $ 70.3 $ 26.6 $ — $ 98.7Accounts receivable, net — — 1,858.0 — — 1,858.0Intra-entity receivables, net 12.7 — 145.1 — (157.8) —Other receivables — — 71.1 24.8 — 95.9Other current assets — — 131.4 4.9 — 136.3Income taxes — — 4.4 — — 4.4Inventories — — 2,371.8 77.5 — 2,449.3
Total current assets 14.4 0.1 4,652.1 133.8 (157.8) 4,642.6Non-current assets: Property, plant and equipment, net — — 818.5 4.4 — 822.9Goodwill — — 514.0 3.6 — 517.6Intangible assets, net — — 417.0 — — 417.0Investment in subsidiaries 3,117.6 — 721.6 590.9 (4,430.1) —Intra-entity receivables, net — 402.9 — 3,647.1 (4,050.0) —Other assets — — 134.8 30.3 — 165.1Deferred tax assets — — 0.6 0.1 — 0.7Retirement benefit asset — — 31.9 — — 31.9Total assets $ 3,132.0 $ 403.0 $ 7,290.5 $ 4,410.2 $ (8,637.9) $ 6,597.8Liabilities and Shareholders’ equity Current liabilities:
Loans and overdrafts $ — $ (0.7) $ 91.8 $ — $ — $ 91.1Accounts payable — — 248.2 7.5 — 255.7Intra-entity payables, net — — — 157.8 (157.8) —Accrued expenses and other current liabilities 29.9 2.5 429.2 16.6 — 478.2Deferred revenue — — 275.5 1.4 — 276.9Income taxes — (0.2) 115.5 (13.5) — 101.8
Total current liabilities 29.9 1.6 1,160.2 169.8 (157.8) 1,203.7Non-current liabilities: Long-term debt — 394.3 323.6 600.0 — 1,317.9Intra-entity payables, net — — 4,050.0 — (4,050.0) —Other liabilities — — 208.7 5.0 — 213.7Deferred revenue — — 659.0 — — 659.0Deferred tax liabilities — — 101.4 — — 101.4Total liabilities 29.9 395.9 6,502.9 774.8 (4,207.8) 3,495.7Series A redeemable convertible preferred shares 611.9 — — — — 611.9Total shareholders’ equity 2,490.2 7.1 787.6 3,635.4 (4,430.1) 2,490.2Total liabilities, redeemable convertible preferred shares and
shareholders’ equity $ 3,132.0 $ 403.0 $ 7,290.5 $ 4,410.2 $ (8,637.9) $ 6,597.8
130

Table of Contents
Condensed Consolidating Balance SheetJanuary 30, 2016
(in millions)
Signet Jewelers Limited
Signet UK Finance plc
Guarantor Subsidiaries
Non- Guarantor Subsidiaries Eliminations Consolidated
Assets Current assets:
Cash and cash equivalents $ 1.9 $ 0.1 $ 102.0 $ 33.7 $ — $ 137.7Accounts receivable, net — — 1,753.0 3.4 — 1,756.4Intra-entity receivables, net 28.7 — — 380.1 (408.8) —Other receivables — — 68.8 15.2 — 84.0Other current assets 0.1 — 144.2 8.3 — 152.6Income taxes — 0.2 2.3 1.0 — 3.5Inventories — — 2,372.7 81.2 — 2,453.9
Total current assets 30.7 0.3 4,443.0 522.9 (408.8) 4,588.1Non-current assets: Property, plant and equipment, net — — 722.3 5.3 — 727.6Goodwill — — 511.9 3.6 — 515.5Intangible assets, net — — 427.8 — — 427.8Investment in subsidiaries 3,047.8 — 762.9 600.0 (4,410.7) —Intra-entity receivables, net — 402.6 — 3,467.4 (3,870.0) —Other assets — — 124.5 30.1 — 154.6Deferred tax assets — — — — — —Retirement benefit asset — — 51.3 — — 51.3Total assets $ 3,078.5 $ 402.9 $ 7,043.7 $ 4,629.3 $ (8,689.5) $ 6,464.9Liabilities and Shareholders’ equity Current liabilities:
Loans and overdrafts $ — $ (0.7) $ 58.4 $ — $ — $ 57.7Accounts payable — — 260.3 8.8 — 269.1Intra-entity payables, net — — 408.8 — (408.8) —Accrued expenses and other current liabilities 17.8 2.4 467.0 11.1 — 498.3Deferred revenue — — 260.3 — — 260.3Income taxes — — 68.4 (2.7) — 65.7
Total current liabilities 17.8 1.7 1,523.2 17.2 (408.8) 1,151.1Non-current liabilities: Long-term debt — 393.5 327.5 600.0 — 1,321.0Intra-entity payables, net — — 3,870.0 — (3,870.0) —Other liabilities — — 223.6 6.9 — 230.5Deferred revenue — — 629.1 — — 629.1Deferred tax liabilities — — 73.0 (0.5) — 72.5Total liabilities 17.8 395.2 6,646.4 623.6 (4,278.8) 3,404.2Series A redeemable convertible preferred shares — — — — — —Total shareholders’ equity 3,060.7 7.7 397.3 4,005.7 (4,410.7) 3,060.7Total liabilities, redeemable convertible preferred shares and
shareholders’ equity $ 3,078.5 $ 402.9 $ 7,043.7 $ 4,629.3 $ (8,689.5) $ 6,464.9
131

Table of Contents
Condensed Consolidating Statement of Cash FlowsFor the 52 week period ended January 28, 2017
(in millions)
Signet Jewelers Limited
Signet UK Finance plc
Guarantor Subsidiaries
Non- Guarantor Subsidiaries Eliminations Consolidated
Net cash provided by (used in) operating activities $ 1,057.9 $ 0.1 $ 724.8 $ 525.6 $ (1,630.1) $ 678.3Investing activities
Purchase of property, plant and equipment — — (277.9) (0.1) — (278.0)Investment in subsidiaries (610.0) — — — 610.0 —Purchase of available-for-sale securities — — — (10.4) — (10.4)Proceeds from available-for-sale securities — — — 10.0 — 10.0Acquisition of Zale Corporation, net of cash acquired — — — — — —
Net cash (used in) provided by investing activities (610.0) — (277.9) (0.5) 610.0 (278.4)Financing activities
Dividends paid on common shares (75.6) — — — — (75.6)Intra-entity dividends paid — — (730.0) (900.1) 1,630.1 —Proceeds from issuance of common shares 2.1 — 610.0 — (610.0) 2.1Proceeds from issuance of redeemable convertible preferred
shares, net of issuance costs 611.3 — — — — 611.3Excess tax benefit from exercise of share awards — — 2.4 — — 2.4Proceeds from senior notes — — — — — —Proceeds from term loan — — — — — —Repayments of term loan — — (16.4) — — (16.4)Proceeds from securitization facility — — — 2,404.1 — 2,404.1Repayment of securitization facility — — — (2,404.1) — (2,404.1)Proceeds from revolving credit facility — — 1,270.0 — — 1,270.0Repayments of revolving credit facility — — (1,214.0) — — (1,214.0)Payment of debt issuance costs — — (2.1) (0.6) — (2.7)Repurchase of common shares (1,000.0) — — — — (1,000.0)Net settlement of equity based awards (4.9) — — — — (4.9)Principal payments under capital lease obligations — — (0.2) — — (0.2)Proceeds from (repayment of) short-term borrowings — — (10.2) — — (10.2)Intra-entity activity, net 19.0 (0.1) (386.6) 367.7 — —
Net cash (used in) provided by financing activities (448.1) (0.1) (477.1) (533.0) 1,020.1 (438.2)Cash and cash equivalents at beginning of period 1.9 0.1 102.0 33.7 — 137.7Increase (decrease) in cash and cash equivalents (0.2) — (30.2) (7.9) — (38.3)Effect of exchange rate changes on cash and cash equivalents — — (1.5) 0.8 — (0.7)Cash and cash equivalents at end of period $ 1.7 $ 0.1 $ 70.3 $ 26.6 $ — $ 98.7
132

Table of Contents
Condensed Consolidating Statement of Cash FlowsFor the 52 week period ended January 30, 2016
(in millions)
Signet Jewelers Limited
Signet UK Finance plc
Guarantor Subsidiaries
Non- Guarantor Subsidiaries Eliminations Consolidated
Net cash provided by (used in) operating activities $ 98.6 $ (0.1) $ 325.7 $ 215.0 $ (195.9) $ 443.3
Investing activities Purchase of property, plant and equipment — — (225.9) (0.6) — (226.5)Investment in subsidiaries — — (0.3) — 0.3 —Purchase of available-for-sale securities — — — (6.2) — (6.2)Proceeds from available-for-sale securities — — — 4.0 — 4.0Acquisition of Zale Corporation, net of cash acquired — — — — — —
Net cash (used in) provided by investing activities — — (226.2) (2.8) 0.3 (228.7)
Financing activities Dividends paid on common shares (67.1) — — — — (67.1)Intra-entity dividends paid — — (149.3) (46.6) 195.9 —
Proceeds from issuance of redeemable convertiblepreferred shares, net of issuance costs — — — — — —
Proceeds from issuance of common shares 5.0 0.3 — — (0.3) 5.0Excess tax benefit from exercise of share awards — — 6.9 — — 6.9Proceeds from senior notes — — — — — —Proceeds from term loan — — — — — —Repayments of term loan — — (25.0) — — (25.0)
Proceeds from securitization facility — — — 2,303.9 — 2,303.9Repayment of securitization facility — — — (2,303.9) — (2,303.9)Proceeds from revolving credit facility — — 316.0 — — 316.0Repayments of revolving credit facility — — (316.0) — — (316.0)Payment of debt issuance costs — — — — — —Repurchase of common shares (130.0) — — — — (130.0)Net settlement of equity based awards (8.3) — — — — (8.3)Principal payments under capital lease obligations — — (1.0) — — (1.0)Proceeds from (repayment of) short-term borrowings — — (47.1) — — (47.1)Intra-entity activity, net 101.6 (0.2) 54.9 (156.3) — —
Net cash (used in) provided by financing activities (98.8) 0.1 (160.6) (202.9) 195.6 (266.6)Cash and cash equivalents at beginning of period 2.1 0.1 166.5 24.9 — 193.6Increase (decrease) in cash and cash equivalents (0.2) — (61.1) 9.3 — (52.0)Effect of exchange rate changes on cash and cash equivalents — — (3.4) (0.5) — (3.9)Cash and cash equivalents at end of period $ 1.9 $ 0.1 $ 102.0 $ 33.7 $ — $ 137.7
133

Table of Contents
Condensed Consolidating Statement of Cash FlowsFor the 52 week period ended January 31, 2015
(in millions)
Signet Jewelers Limited
Signet UK Finance plc
Guarantor Subsidiaries
Non- Guarantor Subsidiaries Eliminations Consolidated
Net cash provided by (used in) operating activities $ 150.5 $ 2.2 $ 166.6 $ 116.7 $ (153.0) $ 283.0
Investing activities Purchase of property, plant and equipment — — (219.8) (0.4) — (220.2)Investment in subsidiaries — — (18.9) (10.0) 28.9 —Purchase of available-for-sale securities — — — (5.7) — (5.7)Proceeds from available-for-sale securities — — — 2.5 — 2.5Acquisition of Zale Corporation, net of cash acquired — — (1,431.1) 1.9 — (1,429.2)
Net cash (used in) provided by investing activities — — (1,669.8) (11.7) 28.9 (1,652.6)
Financing activities Dividends paid on common shares (55.3) — — — — (55.3)Intra-entity dividends paid — — (953.0) — 953.0 —Proceeds from issuance of common shares 6.1 8.9 10.0 810.0 (828.9) 6.1
Proceeds from issuance of redeemable convertible preferredshares, net of issuance costs — — — — — —
Excess tax benefit from exercise of share awards — — 11.8 — — 11.8Proceeds from senior notes — 398.4 — — — 398.4Proceeds from term loan — — 400.0 — — 400.0Repayments of term loan — — (10.0) — — (10.0)Proceeds from securitization facility — — — 1,941.9 — 1,941.9Repayment of securitization facility — — — (1,341.9) — (1,341.9)Proceeds from revolving credit facility — — 260.0 — — 260.0Repayments of revolving credit facility — — (260.0) — — (260.0)Payment of debt issuance costs — (7.0) (10.7) (2.8) — (20.5)Repurchase of common shares (29.8) — — — — (29.8)Net settlement of equity based awards (18.4) — — — — (18.4)Principal payments under capital lease obligations — — (0.8) — — (0.8)Proceeds from (repayment of) short-term borrowings — — 39.4 — — 39.4Intra-entity activity, net (52.4) (402.4) 1,957.9 (1,503.1) — —
Net cash (used in) provided by financing activities (149.8) (2.1) 1,444.6 (95.9) 124.1 1,320.9Cash and cash equivalents at beginning of period 1.4 — 237.0 9.2 — 247.6Increase (decrease) in cash and cash equivalents 0.7 0.1 (58.6) 9.1 — (48.7)Effect of exchange rate changes on cash and cash equivalents — — (11.9) 6.6 — (5.3)Cash and cash equivalents at end of period $ 2.1 $ 0.1 $ 166.5 $ 24.9 $ — $ 193.6
134
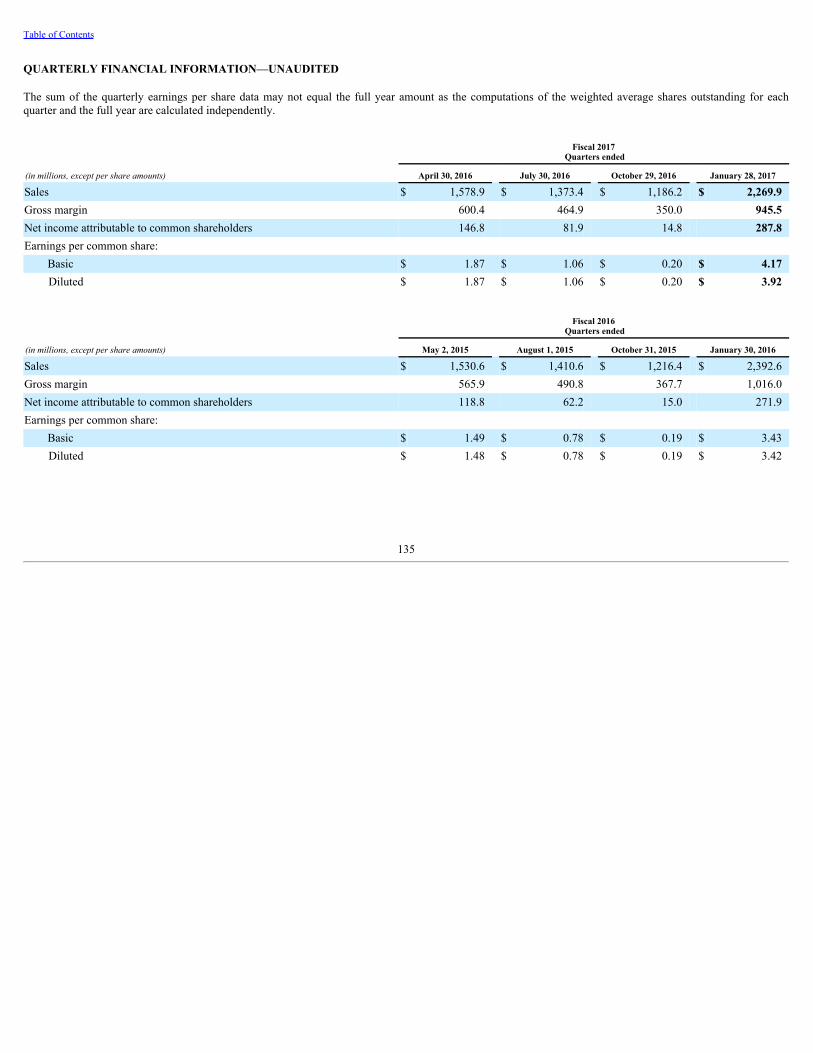
Table of Contents
QUARTERLY FINANCIAL INFORMATION—UNAUDITED
The sum of the quarterly earnings per share data may not equal the full year amount as the computations of the weighted average shares outstanding for eachquarter and the full year are calculated independently.
Fiscal 2017
Quarters ended
(in millions, except per share amounts) April 30, 2016 July 30, 2016 October 29, 2016 January 28, 2017
Sales $ 1,578.9 $ 1,373.4 $ 1,186.2 $ 2,269.9Gross margin 600.4 464.9 350.0 945.5Net income attributable to common shareholders 146.8 81.9 14.8 287.8Earnings per common share:
Basic $ 1.87 $ 1.06 $ 0.20 $ 4.17Diluted $ 1.87 $ 1.06 $ 0.20 $ 3.92
Fiscal 2016
Quarters ended
(in millions, except per share amounts) May 2, 2015 August 1, 2015 October 31, 2015 January 30, 2016
Sales $ 1,530.6 $ 1,410.6 $ 1,216.4 $ 2,392.6Gross margin 565.9 490.8 367.7 1,016.0Net income attributable to common shareholders 118.8 62.2 15.0 271.9Earnings per common share:
Basic $ 1.49 $ 0.78 $ 0.19 $ 3.43Diluted $ 1.48 $ 0.78 $ 0.19 $ 3.42
135

Table of Contents
ITEM 9. CHANGES IN AND DISAGREEMENTS WITH ACCOUNTANTS ON ACCOUNTING AND FINANCIAL DISCLOSURE
None.
ITEM 9A. CONTROLS AND PROCEDURES
The directors review the effectiveness of Signet’s system of internal controls in the financial, operational, compliance and risk management areas.
Signet’s disclosure controls and procedures are designed to help ensure that processes and procedures for information management are in place at all levels of thebusiness. The disclosure controls and procedures aim to provide reasonable assurance that any information disclosed by Signet in the reports that it files or submitsunder the Exchange Act is recorded, processed, summarized and reported within the time periods specified in the SEC’s rules and forms. The procedures are alsodesigned to ensure that information is accumulated and communicated to management, including the Chief Executive Officer and Chief Financial Officer, asappropriate to allow timely decisions to be made regarding required disclosure. Signet’s Disclosure Control Committee, which has a written charter, consists of theChief Financial Officer, Chief Governance Officer and Corporate Secretary, Chief Legal, Risk and Corporate Affairs Officer, Senior Vice President - FinancialController, Senior Vice President - Internal Audit and Enterprise Risk Management, Senior Vice President - Tax and Treasury, Vice President - Investor Relationsand Treasurer, who consult with Signet’s external advisers and auditor, as necessary. These procedures are designed to enable Signet to make timely, appropriateand accurate public disclosures. The activities and findings of the Disclosure Control Committee are reported to the Audit Committee.
Based on their evaluation of Signet’s disclosure controls and procedures, as of January 28, 2017 and in accordance with the requirements of Section 302 of theSarbanes-Oxley Act of 2002, the Chief Executive Officer and Chief Financial Officer have concluded that the disclosure controls and procedures are effective andprovide reasonable assurance that information regarding Signet is recorded, processed, summarized and reported and that the information is accumulated andcommunicated to management to allow timely decisions regarding required disclosure.
Management’s annual report on internal control over financial reporting
Signet’s management is responsible for establishing and maintaining adequate internal control over financial reporting as defined in Rule 13a-15(f) under theExchange Act.
All internal control systems, no matter how well designed, have inherent limitations. Therefore, even those systems determined to be effective can provide onlyreasonable assurance with respect to financial statement preparation and presentation.
Management conducted an evaluation of internal control over financial reporting based on the framework in Internal Control—Integrated Framework (2013) issuedby the Committee of Sponsoring Organizations of the Treadway Commission (COSO). Based on this evaluation, management determined that Signet’s internalcontrol over financial reporting was effective as of January 28, 2017 .
Our independent registered public accountants, KPMG LLP, audited the consolidated financial statements of Signet for Fiscal 2017 and have also audited theeffectiveness of internal control over financial reporting as of January 28, 2017 . An unqualified opinion has been issued thereon, the details of which are includedwithin this Annual Report on Form 10-K.
Changes in internal control over financial reporting
There were no changes in internal control over financial reporting during the quarter ended January 28, 2017 that have materially affected, or are reasonably likelyto materially affect, Signet’s internal control over financial reporting.
ITEM 9B. OTHER INFORMATION
None.
136
Table of Contents
PART III
ITEM 10. DIRECTORS, EXECUTIVE OFFICERS AND CORPORATE GOVERNANCE
Information concerning directors, executive officers and corporate governance may be found under the captions “Election of Twelve Directors,” “Board ofDirectors and Corporate Governance” and “Executive Officers of the Company” in our definitive proxy statement for our 2017 Annual Meeting of Shareholders(the “2017 Proxy Statement”), which will be filed with the SEC within 120 days after the close of our fiscal year. Such information is incorporated herein byreference. The information in the 2017 Proxy Statement set forth under the captions “Section 16(a) Beneficial Ownership Reporting Compliance” and “Report ofthe Audit Committee” is incorporated herein by reference.
ITEM 11. EXECUTIVE COMPENSATION
Information concerning executive compensation may be found under the captions “Executive Compensation,” “Report of the Compensation Committee” and“Director Compensation,” in the 2017 Proxy Statement. Such information is incorporated herein by reference.
ITEM 12. SECURITY OWNERSHIP OF CERTAIN BENEFICIAL OWNERS AND MANAGEMENT AND RELATED STOCKHOLDER MATTERS
The information in the 2017 Proxy Statement set forth under the captions “Shareholders Who Beneficially Own At Least Five Percent of the Common Shares,”“Ownership by Directors, Director Nominees and Executive Officers” and “Equity Compensation Plan Information” is incorporated herein by reference.
ITEM 13. CERTAIN RELATIONSHIPS AND RELATED TRANSACTIONS, AND DIRECTOR INDEPENDENCE
The information in the 2017 Proxy Statement set forth under the captions “Board of Directors and Corporate Governance,” “Board Committees” and “Transactionswith Related Persons” is incorporated herein by reference.
ITEM 14. PRINCIPAL ACCOUNTING FEES AND SERVICES
The information in the 2017 Proxy Statement set forth under the caption “Appointment of Independent Auditor” is incorporated herein by reference.
137
Table of Contents
PART IV
ITEM 15. EXHIBITS, FINANCIAL STATEMENT SCHEDULES
PAGE
(1) The following consolidated financial statements are included in Item 8:
Consolidated income statements for the fiscal years ended January 28, 2017, January 30, 2016 and January 31, 2015 81
Consolidated statements of comprehensive income for the fiscal years ended January 28, 2017, January 30, 2016 and January 31, 2015 82
Consolidated balance sheets as of January 28, 2017 and January 30, 2016 83
Consolidated statements of cash flows for the fiscal years ended January 28, 2017, January 30, 2016 and January 31, 2015 84
Consolidated statements of shareholders’ equity for the fiscal years ended January 28, 2017, January 30, 2016 and January 31, 2015 86
Notes to the consolidated financial statements 87
(2) The following exhibits are filed as part of this Annual Report on Form 10-K or are incorporated herein by reference.
138

Table of Contents
Number Description of Exhibits
2.1
Agreement and Plan of Merger dated February 19, 2014 by and among Signet Jewelers Limited, Carat Merger Sub, Inc. and Zale Corporation(incorporated by reference to Exhibit 2.1 of the Current Report on Form 8-K filed by Zale Corporation on February 19, 2014).
3.1
Memorandum of Association of Signet Limited and Certificate of Incorporation on Change of Name to Signet Jewelers Limited (incorporated byreference to Exhibit 3.1 to the Company’s Registration Statement on Form 8-A filed September 11, 2008 (“Form 8-A”)).
3.2
Amended and Restated Bye-laws of Signet Jewelers Limited (incorporated by reference to Exhibit 3.1 to the Company’s Quarterly Report on Form10-Q filed September 10, 2014).
4.1 Form of common share certificate of Signet Jewelers Limited (incorporated by reference to Exhibit 4.1 to Form 8-A). 4.2
Master Indenture dated as of November 2, 2001 among Sterling Jewelers Receivables Master Note Trust, as issuer, Bankers Trust Company, asTrustee, and Sterling Jewelers Inc., as Servicer (incorporated by reference to Exhibit 4.1 to the Company’s Current Report on Form 8-K filed May21, 2014).
4.3
2014-A Indenture Supplement, dated as of May 15, 2014, among Sterling Jewelers Receivables Master Note Trust, as issuer, Sterling Jewelers Inc.,as servicer, and Deutsche Bank Trust Company Americas, as indenture trustee (incorporated by reference to Exhibit 4.2 to the Company’s CurrentReport on Form 8-K filed May 21, 2014).
4.4
Second Supplemental Indenture, dated as of June 30, 2014, among Signet UK Finance plc, the guarantors party thereto, and Deutsche Bank TrustCompany Americas, as indenture trustee (incorporated by reference to Exhibit 4.1 to the Company’s Quarterly Report on Form 10-Q filedSeptember 10, 2014).
4.5
Amended and Restated Transfer and Servicing Agreement dated as of May 15, 2014, among Sterling Jewelers Receivables Corp., as transferor,Sterling Jewelers Inc., as servicer, and Sterling Jewelers Receivables Master Note Trust, as issuer (incorporated by reference to Exhibit 4.3 to theCompany’s Current Report on Form 8-K filed May 21, 2014).
4.6
Third Amended and Restated Receivables Purchase Agreement dated as of May 15, 2014 between Sterling Jewelers Inc., as seller, and SterlingJewelers Receivables Corp., as purchaser (incorporated by reference to Exhibit 4.4 to the Company’s Current Report on Form 8-K filed May 21,2014).
4.7
Administration Agreement dated as of November 2, 2001 between Sterling Jewelers Receivables Master Note Trust, as issuer, and Sterling JewelersInc., as administrator (incorporated by reference to Exhibit 4.5 to the Company’s Current Report on Form 8-K filed May 21, 2014).
4.8
Performance Undertaking dated as of May 15, 2014 by Signet Jewelers Limited, as performance guarantor, in favor of JP Morgan Chase Bank,N.A., as recipient (incorporated by reference to Exhibit 4.6 to the Company’s Current Report on Form 8-K filed May 21, 2014).
4.9
Certificate of Designation of Series A Convertible Preference Shares, Par Value $0.01 Per Share, of Signet Jewelers Limited (incorporated byreference to Exhibit 3.1 to the Company's Current Report on Form 8-K filed November 3, 2016).
10.1
Depositary Agreement dated as of September 3, 2008 between Signet Jewelers Limited and Capita IRG Trustees Limited (incorporated by referenceto Exhibit 10.4 to the Company’s Annual Report on Form 10-K filed March 30, 2010).
10.2
Second Amended and Restated Credit Agreement, dated as of July 14, 2016, by and among Signet Jewelers Limited, as Parent, Signet GroupLimited, Signet Group Treasury Services Inc. and Sterling Jewelers Inc. as borrowers, the additional borrowers from time to time party thereto, thefinancial institutions from time to time party thereto as lenders, JPMorgan Chase Bank, N.A., as administrative agent and the other parties partythereto (incorporated by reference to Exhibit 10.1 to the Company’s Current Report on Form 8-K filed July 15, 2016).
139

Table of Contents
Number Description of Exhibits
10.3†
Termination Protection Agreement between Sterling Jewelers Inc. and Mark S. Light (incorporated by reference to Exhibit 10.1 to the Company’sCurrent Form on Form 8-K filed October 20, 2015).
10.4†
Termination Protection Agreement between Sterling Jewelers Inc. and Michele Santana (incorporated by reference to Exhibit 10.2 to theCompany’s Current Form on Form 8-K filed October 20, 2015).
10.5†
Termination Protection Agreement between Sterling Jewelers Inc. and Steven J. Becker (incorporated by reference to Exhibit 10.3 to theCompany’s Current Form on Form 8-K filed October 20, 2015).
10.6†
Termination Protection Agreement between Sterling Jewelers Inc. and Edward Hrabak (incorporated by reference to Exhibit 10.4 to the Company’sCurrent Form on Form 8-K filed October 20, 2015).
10.7†
Termination Protection Agreement between Sterling Jewelers Inc. and George Murray (incorporated by reference to Exhibit 10.5 to the Company’sCurrent Form on Form 8-K filed October 20, 2015).
10.8*† Separation Agreement dated January 29, 2017 between Sterling Jewelers Inc. and Ed Hrabak. 10.9†
Rules of the Signet Group 2005 Long-Term Incentive Plan (incorporated by reference to Exhibit 4.16 to the Company’s Annual Report on Form 20-F filed May 4, 2006).
10.10†
Signet Jewelers Limited Rules of the Sharesave Scheme (incorporated by reference to Exhibit 99.3 to the Company’s Registration Statement onForm S-8 filed September 11, 2008 (File No. 333-153435)).
10.11†
Signet Jewelers Limited Rules of the Irish Sharesave Scheme (incorporated by reference to Exhibit 99.4 to the Company’s Registration Statementon Form S-8 filed September 11, 2008 (File No. 333-153435)).
10.12†
Signet Jewelers Limited US Stock Option Plan 2008 (incorporated by reference to Exhibit 99.5 to the Company’s Registration Statement on FormS-8 filed September 11, 2008 (File No. 333-153435)).
10.13†
Signet Jewelers Limited International Share Option Plan 2008 (incorporated by reference to Exhibit 99.6 to the Company’s Registration Statementon Form S-8 filed September 11, 2008 (File No. 333-153435)).
10.14†
Signet Jewelers Limited UK Approved Share Option Plan 2008 (incorporated by reference to Exhibit 99.7 to the Company’s Registration Statementon Form S-8 filed September 11, 2008 (File No. 333-153435)).
10.15†
Rules of the Signet Group plc Sharesave Scheme (incorporated by reference to Exhibit 99.8 to the Company’s Registration Statement on Form S-8filed September 11, 2008 (File No. 333-153435)).
10.16†
Rules of the Signet Group plc Sharesave Scheme (The Republic of Ireland) (incorporated by reference to Exhibit 99.9 to the Company’sRegistration Statement on Form S-8 filed September 11, 2008 (File No. 333-153435)).
10.17†
Signet Group plc International Share Option Plan 2003 (incorporated by reference to Exhibit 99.10 to the Company’s Registration Statement onForm S-8 filed September 11, 2008 (File No. 333-153435)).
10.18†
Signet Group plc UK Inland Revenue Approved Share Option Plan 2003 (incorporated by reference to Exhibit 99.11 to the Company’s RegistrationStatement on Form S-8 filed September 11, 2008 (File No. 333-153435)).
10.19†
Signet Group plc Employee Stock Savings Plan (incorporated by reference to Exhibit 99.1 to the Company’s Post-Effective Amendment No. 1 toRegistration Statement on Form S-8 filed September 11, 2008 (File No. 333-9634)).
10.20†
Signet Group plc US Share Option Plan 2003 (incorporated by reference to Exhibit 99.2 to the Company’s Post-Effective Amendment No. 1 toRegistration Statement on Form S-8 filed September 11, 2008 (File No. 333-134192)).
140

Table of Contents
Number Description of Exhibits
10.21† Signet Group plc 2000 Long-Term Incentive Plan (incorporated by reference to Exhibit 99.1 to the Company’s Post-Effective Amendment No. 1 toRegistration Statement on Form S-8 filed September 11, 2008 (File No. 333-12304)).
10.22†
Signet Group plc 1993 Executive Share Option Scheme (incorporated by reference to Exhibit 99.1 to the Company’s Post-Effective AmendmentNo. 1 to Registration Statement on Form S-8 filed September 11, 2008 (File No. 333-8964)).
10.23†
Signet Jewelers Limited Omnibus Incentive Plan (incorporated by references to Exhibit 99.1 to the Company’s Registration Statement on Form S-8filed June 15, 2009 (File No. 333-159987)).
10.24†
Form of Signet Jewelers Limited Omnibus Incentive Plan Performance Based Restricted Stock Unit Award Notice and Agreement (incorporated byreference to Exhibit 10.3 to the Company’s Quarterly Report on Form 10-Q filed May 24, 2012).
10.25†
Form of Signet Jewelers Limited Omnibus Incentive Plan Time-Based Restricted Stock Award Notice and Agreement (incorporated by reference toExhibit 10.4 to the Company’s Quarterly Report on Form 10-Q filed May 24, 2012).
10.26†
Form of Letter of Appointment of Independent Directors (incorporated by reference to Exhibit 10.28 to the Company’s Annual Report on Form 10-K filed March 22, 2012).
10.27†
Form of Deed of Indemnity for Directors (incorporated by reference to Exhibit 10.32 to the Company’s Annual Report on Form 10-K filed March30, 2010).
10.28
Voting and Support Agreement dated February 19, 2014 by and among Signet, Zale and The Z Investment Holdings, LLC (incorporated byreference to Exhibit 10.1 of the Current Report on Form 8-K filed by Zale Corporation on February 19, 2014).
10.29
Investment Agreement, dated as of August 24, 2016, by and among Signet Jewelers Limited, Green Equity Investors VI, L.P. and Green EquityInvestors Side VI, L.P. (incorporated by reference to Exhibit 10.1 to the Company’s Current Report on Form 8-K filed August 25, 2016).
10.30
Shareholders’ Agreement by and among Signet Jewelers Limited, Green Equity Investors VI, L.P., Green Equity Investors Side VI, L.P., LGPAssociates VI-A LLC and LGP Associates VI-B LLC, dated as of October 5, 2016 (incorporated by reference to Exhibit 10.1 to the Company’sCurrent Report on Form 8-K filed October 6, 2016).
10.31
Registration Rights Agreement, dated as of October 5, 2016, by and among Signet Jewelers Limited, Green Equity Investors VI, LP, Green EquityInvestors Side VI, L.P., LGP Associates VI-A LLC and LGP Associates VI-B LLC (incorporated by reference to Exhibit 10.2 to the Company’sCurrent Report on Form 8-K filed October 6, 2016).
10.32
Accelerated Share Repurchase Master Confirmation Agreement, dated as of October 5, 2016, by and among Signet Jewelers Limited and JPMorganChase Bank, National Association (incorporated by reference to Exhibit 10.4 to the Company’s Quarterly Report on Form 10-Q filed November 29,2016).
10.33
Accelerated Share Repurchase Supplemental Confirmation Agreement, dated as of October 5, 2016, by and among Signet Jewelers Limited andJPMorgan Chase Bank, National Association (incorporated by reference to Exhibit 10.5 to the Company’s Quarterly Report on Form 10-Q filedNovember 29, 2016).
12.1* Ratio of earnings to fixed charges. 21.1* Subsidiaries of Signet Jewelers Limited. 23.1* Consent of independent registered public accounting firm. 31.1* Certification of the Chief Executive Officer pursuant to Section 302 of the Sarbanes-Oxley Act of 2002. 31.2* Certification of the Chief Financial Officer pursuant to Section 302 of the Sarbanes-Oxley Act of 2002.
141

Table of Contents
Number Description of Exhibits
32.1* Certification of the Chief Executive Officer pursuant to 18 U.S.C. Section 1350, as adopted by Section 906 of the Sarbanes-Oxley Act of 2002. 32.2* Certification of the Chief Financial Officer pursuant to 18 U.S.C. Section 1350, as adopted by Section 906 of the Sarbanes-Oxley Act of 2002. 101.INS* XBRL Instance Document. 101.SCH* XBRL Taxonomy Extension Schema Document. 101.CAL* XBRL Taxonomy Extension Calculation Linkbase Document. 101.DEF* XBRL Taxonomy Extension Definition Linkbase Document. 101.LAB* XBRL Taxonomy Extension Label Linkbase Document. 101.PRE* XBRL Taxonomy Extension Presentation Linkbase Document.
* Filed herewith.† Management contract or compensatory plan or arrangement.
ITEM 16. FORM 10-K SUMMARY
None.
142
Table of Contents
SIGNATURES
Pursuant to the requirements of Section 13 or 15(d) of the Securities Exchange Act of 1934, the registrant has duly caused this report to be signed on its behalf bythe undersigned, thereunto duly authorized.
Signet Jewelers Limited
Date: March 16, 2017 By: /s/ Michele L. Santana Name: Michele L. Santana
Title: Chief Financial Officer
(Principal Financial Officer and Principal Accounting Officer)
143

Table of Contents
Pursuant to the requirements of the Securities Exchange Act of 1934, this report has been signed below by the following persons on behalf of the registrant and inthe capacities indicated, on the date set forth below.
Date Signature Title
March 16, 2017 By: /s/ Mark Light Chief Executive Officer (Principal ExecutiveOfficer and Director) Mark Light
March 16, 2017 By: /s/ Michele L. Santana Chief Financial Officer (Principal FinancialOfficer and Principal Accounting Officer) Michele L. Santana
March 16, 2017 By: /s/ H. Todd Stitzer Chairman of the Board H. Todd Stitzer
March 16, 2017 By: /s/ Dale W. Hilpert Director Dale W. Hilpert
March 16, 2017 By: /s/ Marianne Miller Parrs Director Marianne Miller Parrs
March 16, 2017 By: /s/ Thomas G. Plaskett Director Thomas G. Plaskett
March 16, 2017 By: /s/ Russell Walls Director Russell Walls
March 16, 2017 By: /s/ Virginia C. Drosos Director Virginia C. Drosos
March 16, 2017 By: /s/ Helen E. McCluskey Director Helen E. McCluskey
March 16, 2017 By: /s/ Eugenia M. Ulasewicz Director Eugenia M. Ulasewicz
March 16, 2017 By: /s/ Robert J. Stack Director Robert J. Stack
March 16, 2017 By: /s/ Jonathan Sokoloff Director Jonathan Sokoloff
March 16, 2017 By: /s/ Brian Tilzer Director Brian Tilzer
144

Exhibit 10.8
CONFIDENTIAL SEPARATION AND RELEASE AGREEMENT
This AGREEMENT (“ Separation Agreement ”) made this January 29, 2017 (the “ Effective Date ”), by and betweenSterling Jewelers Inc., a Delaware corporation (including its successors and assigns, the “ Company ”), and Ed Hrabak (the “Employee ”).
WHEREAS , the Company and Employee entered into that certain Termination Protection Agreement, effective October 15,2015 (“ TPA ”);
WHEREAS , pursuant to the terms and conditions of the Signet Jewelers Limited Omnibus Incentive Plan (the “ OmnibusPlan ”), the Employee was granted the following equity and equity-based awards, all or a portion of which are expected to remainunvested as of the Termination Date (defined below): (i) restricted shares of Signet pursuant to Time-Based Restricted Stock AwardAgreements dated as of May 8, 2014, July 16, 2014, April 27, 2015 and April 25, 2016 (together, the “ Restricted Stock Awards ”)and (ii) performance-based vesting restricted stock units of Signet pursuant to Performance-Based Restricted Stock Unit AwardAgreements dated as of May 8, 2014, July 16, 2014, April 27, 2015 and April 25, 2016 (the “ RSU Awards ” and, together with theRestricted Stock Agreements, the “ Equity Awards ”);
WHEREAS , the Employee gave notice of his intention to resign from the position of Chief Operations Officer of SignetJewelers Limited and its subsidiaries (the “ Signet Group ”);
WHEREAS , the Company desires to continue to employ the Employee and the Employee has agreed to continue to beemployed by the Company through the Termination Date; and
WHEREAS , the Employee and the Company both agree that the Employee’s employment with the Company and itssubsidiaries and affiliates will terminate effective as of the Termination Date or otherwise pursuant to the terms and conditions ofthis Separation Agreement.
NOW, THEREFORE , in consideration of such services and the mutual covenants and promises herein contained, theCompany and the Employee hereby agree as follows:
1. Resignation . The Employee acknowledges that on July 17, 2017 or, if earlier, the date on which the Employee’semployment is terminated by the Company without Cause (as defined below), as determined by the Company, or due to theEmployee’s death or Disability (as defined below) (such date, the “ Termination Date ” and such termination, a “ QualifyingTermination ”) the Employee will immediately be deemed to resign, and shall resign from and/or be removed from the Employee’sposition, Chief Operations Officer of the Signet Group, and from all offices and directorships held by the Employee in the Companyor any of its subsidiaries or affiliates. The Employee agrees to execute any documentation presented by the Company to effectuateall such resignations and/or removals

from such offices and/or directorships held by the Employee. The Employee acknowledges and agrees that until the TerminationDate the Employee will continue to perform such duties as may be assigned from time to time by the Chief Executive Officer of theSignet Group or such other officer designated by the Chief Executive Officer of the Signet Group. For purposes of the SeparationAgreement, “Cause” shall mean (A) fraud, embezzlement, gross insubordination or any act of moral turpitude or misconduct, in eachcase, on the part of the Employee; (B) conviction of or the entry of a plea of nolo contendere by the Employee for any felony; or (C)(x) a material breach by the Employee of Employee’s duties, responsibilities or obligations under this Separation Agreement, or (y)the willful failure or refusal by the Employee to perform and discharge a specific lawful directive issued to Employee by the Boardof Directors of Signet Jewelers Limited (the “ Board ”) within a reasonable period of time, not to be less than five (5) business days,following written notice thereof to the Employee by the Company or the Board. For purposes of the Separation Agreement,“Disability” shall mean any physical or mental disability that renders the Employee incapable of performing the services required ofthe Employee for any period or periods aggregating six months during any twelve- month period and for purposes of the foregoing,the Employee’s physical or mental disability shall be determined in accordance with any disability plan of or applicable to theCompany that is then in effect. For the avoidance of doubt, in the event Employee’s employment terminates other than in aQualifying Termination, the Employee will immediately be deemed to resign, and shall resign from and/or be removed from theEmployee’s position, Chief Operations Officer of the Signet Group, and from all offices and directorships held by the Employee inthe Company or any of its subsidiaries or affiliates.
2. Termination .
(a) Accrued Benefits . Employee shall be entitled to receive: (i) base salary and accrued and unused vacationthrough the date of termination of employment in accordance with the Company’s normal payroll practices, (ii) any annual bonus orlong-term incentive plan payment that has been earned by the Employee for a completed fiscal year (or with respect to a long-termincentive plan payment, a completed performance cycle) ending prior to the date of termination of employment but which remainsunpaid as of such date payable in accordance with the applicable plan, and (iii) any vested benefits to which Employee is entitledunder the employee benefit plans of the Company, payable pursuant to the terms and conditions of such benefit plans.
(b) Termination Payments . Subject to the Employee’s timely execution, delivery and non-revocation of a Release(as described in Section 2(c) below) following a Qualifying Termination on the Termination Date, and continued compliance withSections 5, 6, 7, 8 and 9 below, the Employee shall be entitled to receive the following payments and benefits:
(i) continued payment of the Employee’s annual base pay in effect on the Termination Date from theTermination Date until March 15, 2018 (the
2
“ Severance Period ”), less applicable withholding taxes, paid in accordance with the Company’s payroll practices; provided that,the first payment shall be paid as part of the first full payroll cycle following the forty-fifth (45th) day after the Termination Date andshall include payments of any amounts that would be due prior to such commencement date (such date, the “ PaymentCommencement Date ”).
(ii) a lump sum amount equal to the annual bonus the Employee would have otherwise received for fiscalyear 2018, based on actual performance, payable in a lump sum during the period commencing on the 15th of April and ending onthe 31st of May following the end of fiscal year 2018.
(iii) a taxable cash payment equal to the monthly employer contribution to the Company’s group healthcoverage premium for an active employee with the same level of coverage as Employee had on the Termination Date for theSeverance Period, with the first payment to be made on the Payment Commencement Date and the remaining payments monthlythereafter for the duration of the Severance Period.
(iv) for purposes of the Employee’s Equity Awards, on the Termination Date the vesting of such EquityAwards shall be calculated as if Employee’s employment terminated on March 15, 2018 and such termination of employment wasdue to “ Retirement ” (as such term is defined in the Equity Awards) and Employee shall remain subject to all terms and conditionsset forth in the Omnibus Plan and Equity Awards.
If the Employee participated in direct deposit as of the Termination Date, the Employee’s payments in Sections 2(b)(i)-(iii) will bedirect deposited. If the Employee did not participate in direct deposit, the Employee will be issued a live check to the Employee’slast reported home address on file with the Company. The termination payments and benefits described in this Section 2(b)(i)-(iv)will be reduced to cover any outstanding financial obligations the Employee owes to the Company as of the Termination Date, to theextent permissible under law, and without the incurrence of additional tax obligations under Section 409A of the Internal RevenueCode of 1986, as amended (the “ Code ”) and the regulations and guidance promulgated thereunder (collectively, “ Section 409A ”).
(c) The Employee’s entitlement to the payments and benefits set forth in Section 2(b) above shall be subject to andcontingent upon the Employee’s execution and delivery to the Company of a general release and waiver of claims in the formattached hereto as Exhibit A (the “ Release ”) on or after the Termination Date and such Release becoming irrevocable withintwenty-nine (29) days following the Termination Date. For the avoidance of doubt, the Employee shall forfeit the payments andbenefits set forth in Section 2(b) if the Release has not been executed, delivered to the Company and become irrevocable within suchtwenty-nine (29) day period.
3. Sole Payments and Benefits . The termination payments and benefits set forth in Section 2 shall be the sole andexclusive payments and benefits to which the Employee shall be entitled in respect of the Employee’s termination of employmentwith the Company.
3

4. No Long-Term Incentive Plan Grants or Merit Increase . The Employee acknowledges and agrees that (i) he is notentitled to any future equity award grants under the Omnibus Plan or otherwise and (ii) he is not eligible for any future meritincrease with respect to base salary.
5. Restrictive Covenants .
(a) During the term of the Employee’s employment with the Company or any of its subsidiaries or affiliates andfor all time thereafter, the Employee shall keep secret and retain in strictest confidence and not divulge, disclose, discuss, copy orotherwise use or suffer to be used in any manner, except in connection with the Business of the Company and of any of thesubsidiaries or affiliates of the Company, any trade secrets, confidential or proprietary information and documents or materialsowned, developed or possessed by or for the Company or any of the subsidiaries or affiliates of the Company pertaining to theBusiness of the Company or any of the subsidiaries or affiliates of the Company; provided that such information referred to in thisSection 5(a) shall not include information that is or has become generally known to the public or the jewelry trade without violationof this Section 5 . For purposes of the Separation Agreement, “Business” shall mean the operation of a retail jewelry business thatsells to the public jewelry, watches and associated services including through e-commerce.
(b) The Employee acknowledges that all developments, including, without limitation, inventions (patentable orotherwise), discoveries, improvements, patents, trade secrets, designs, reports, computer software, flow charts and diagrams, data,documentation, writings and applications thereof (collectively, “ Works ”) relating to the Business or planned business of theCompany or any of the subsidiaries or affiliates of the Company that, alone or jointly with others, the Employee may create, make,develop or acquire during the term of Employee’s employment with the Company or any of its subsidiaries or affiliates (collectively,the “ Developments ”) are works made for hire and shall remain the sole and exclusive property of the Company and its subsidiariesand affiliates and the Employee hereby assigns to the Company all of Employee’s right, title and interest in and to all suchDevelopments and Employee shall take any action reasonably necessary to achieve the foregoing result. Notwithstanding anyprovision of this Agreement to the contrary, “Developments” shall not include any Works that do not relate to the Business orplanned business of the Company or any of the subsidiaries or affiliates of the Company.
(c) The Employee agrees that Employee shall not, directly or indirectly, without the prior written consent of theCompany:
(i)during Employee’s employment with the Company or any of its subsidiaries or affiliates and for a period ofone year commencing upon the date of Employee’s termination of employment, solicit,entice, persuade or induce any employee, consultant, agent or
4
independent contractor of the Company or of any of the subsidiaries or affiliates of the Company to terminatehis or her employment or engagement with the Company or such subsidiary or affiliate, to become employedby any person, firm or corporation other than the Company or such subsidiary or affiliate or approach anysuch employee, consultant, agent or independent contractor for any of the foregoing purposes; or
(ii)during Employee’s employment with the Company or any of its subsidiaries or affiliates and for a period ofone year commencing upon the date of Employee’s termination of employment,directly or indirectly own, manage, control, invest or participate in any way in, consultwith or render services to or for any person or entity (other than for the Company orany of the subsidiaries or affiliates of the Company) which is materially engaged in theBusiness (“materially” meaning deriving more than 25% of its revenue from the saleof jewelry and watches per year as of the applicable date) ; provided that theEmployee shall be entitled to own up to 1% of any class of outstanding securities ofany company whose common stock is listed on a national securities exchange orincluded for trading on the NASDAQ Stock Market.
(d) The Employee acknowledges that the services to be rendered by the Employee are of a special, unique andextraordinary character and, in connection with such services, the Employee will have access to confidential information vital to theBusiness of the Company and the subsidiaries and affiliates of the Company. By reason of this, the Employee consents and agreesthat if the Employee violates any of the provisions of Section 5 hereof, the Company and the subsidiaries and affiliates of theCompany would sustain irreparable injury and that monetary damages will not provide adequate remedy to the Company and thatthe Company shall be entitled to have Section 5 specifically enforced by any court having equity jurisdiction. Nothing containedherein shall be construed as prohibiting the Company or any of the subsidiaries or affiliates of the Company from pursuing any otherremedies available to it for such breach or threatened breach, including, without limitation, the recovery of damages from theEmployee or cessation of payments and benefits hereunder without requirement for posting a bond. The Employee furtheracknowledges that: (i) the Employee will not at any time, directly or indirectly violate this Section 5 ; (ii) payment of the terminationpayments and benefits in Section 2(b) under this Separation Agreement shall not be made if the Employee violates this Section 5 ;(iii) the Company shall have no further obligation at any time to pay the termination payments and benefits in Section 2(b) under thisSeparation Agreement if the Employee violates this Section 5 ; and (iv) to the extent allowed by law, the Employee shall be requiredto return to the Company any termination payments and benefits the Company paid the Employee less two hundred fifty dollars($250.00) if the Employee violates this Section 5 .
5

6. Cooperation . The payments and benefits pursuant to Section 2(b) of this Separation Agreement are conditioned uponthe Employee’s agreement to be reasonably available to assist and otherwise advise and consult with the Company in transitioningresponsibilities to other employees of the Company. The payments and benefits pursuant to Section 2(b) of this SeparationAgreement are also conditioned upon the Employee’s full and continued cooperation in good faith with the Company, itssubsidiaries and affiliates and its legal counsel, as may be necessary or appropriate: (i) to respond truthfully to any inquiries that mayarise with respect to matters that the Employee was responsible for or involved with during the Employee’s employment with theCompany; (ii) to furnish to the Company, as reasonably requested by the Company, from time to time, the Employee’s honest andgood faith advice, information, judgment and knowledge with respect to all practices at the Company, and employees of theCompany; (iii) in connection with any defense, prosecution or investigation of any and all actual, threatened, potential or pendingcourt or administrative proceedings or other legal matters in which the Employee may be involved as a party and/or in which theCompany determines, in its sole discretion, that the Employee is a relevant witness and/or possesses relevant information; and (iv) inconnection with any and all legal matters relating to the Company, its subsidiaries and affiliates, and each of their respective past andpresent employees, managers, directors, officers, administrators, shareholders, members, agents, and attorneys, in which theEmployee may be called as an involuntary witness (by subpoena or other compulsory process) served by any third-party, including,without limitation, providing the Company with written notice of any subpoena or other compulsory process served on the Employeewithin forty-eight (48) hours of its occurrence.
In connection with the matters described in this Section 6 , the Employee agrees to notify, truthfully communicate and berepresented by, and provide requested information to, the Company’s counsel, to fully cooperate and work in good faith with suchcounsel with respect to, and in preparation for, any response to a subpoena or other compulsory process served upon the Employee,any depositions, interviews, responses, appearances or other legal matters, and to testify truthfully and honestly with respect to allmatters. For the avoidance of doubt, the Company has no obligation to provide the Employee with separate counsel in connectionwith any such matter.
The Company shall reimburse the Employee for reasonable expenses, such as travel, lodging and meal expenses, incurred bythe Employee pursuant to this Section 6 at the Company’s request, and consistent with the Company’s policies for employeeexpenses.
The Employee further acknowledges that all documents prepared by the Company pertaining to the affairs of the Company orany legal matter relating to the Company, which may be provided to the Employee or to which the Employee may be given accesspursuant to this Section 6 in connection with the Employee’s cooperation hereunder with respect to any legal matter relating to theCompany, are, and shall remain, the property of the Company at all times. Except as required by applicable law or court order, theEmployee shall not
6

disclose any information or materials received in connection with any legal matter relating to the Company.
All communications by the Company, its subsidiaries and/or affiliates, and its lawyers to the Employee and allcommunications by the Employee to the Company, its subsidiaries and/or affiliates and its lawyers, in connection with any legalmatter relating to the Company, its subsidiaries and/or affiliates, shall, to the fullest extent permitted by law, be privileged andconfidential and subject to the work product doctrine. No such communication, information, or work product shall be divulged bythe Employee to any person or entity, except at the specific direction of an authorized representative of the Company and its lawyers.
The Employee further agrees that the Employee must also: (i) complete any outstanding performance evaluations; (ii) repayany outstanding bills, advances, debts, etc., due to the Company, as of the date of Employee’s termination of employment; and (iii)cooperate with the Company in performing all transition and other matters required by the Company prior to the date of Employee’stermination of employment.
7. Return of Property and Documents . As a material provision of this Separation Agreement, and as a condition of thereceipt of the termination payments and benefits described in Sections 2(b) of this Separation Agreement, as of the date ofEmployee’s termination of employment, the Employee shall have, and represent to have, returned to the Company all Companyproperty (including, without limitation, any and all computers, phones, identification cards, card key passes, fobs, corporate creditcards, corporate phone cards, corporate motor vehicles, files, memoranda, keys and software) in the Employee’s possession and theEmployee shall not make or retain any duplicates or reproductions of such items. The Employee further agrees that, as a materialprovision of this Separation Agreement, as of the date of Employee’s termination of employment, the Employee shall have, andrepresent to have, delivered to the Company all copies of any confidential information of the Company in the Employee’spossession, custody or control, including all copies of any analyses, compilations, studies or other documents in the Employee’spossession, custody or control that contain any such confidential information (whether in electronic or paper form), and that as of thedate of Employee’s termination of employment, the Employee shall no longer possess any such Company property or confidentialinformation in any form. The Company has no obligation to pay the termination payments and benefits in Section 2(b) of thisSeparation Agreement until it is satisfied that the Employee has returned all Company property the Employee possesses or controls.
8. Confidentiality . The Employee acknowledges and agrees that the Employee will keep the terms, amount, and facts of,and any discussions leading up to, this Separation Agreement strictly and completely confidential, and that the Employee will notcommunicate or otherwise disclose to any employee of the Company (past, present, or future), or to any member of the generalpublic, the terms, amounts, copies, or fact of this Separation Agreement, except as may be required by law or compulsory process;provided, however ,
7
that the Employee may make such disclosures to Employee’s tax/financial advisors or legal counsel as long as they agree to keep theinformation confidential. If asked about any of such matters, to the extent permissible, the Employee’s response shall be thatEmployee may not discuss any of such matters, except that nothing in this Separation Agreement shall affect the Employee’s rightsto engage in activity protected by Section 7 of the National Labor Relations Act. Notwithstanding anything herein to the contrary,nothing in this Section 7 shall: (i) prohibit the Employee from making reports of possible violations of federal law or regulation toany governmental agency or entity in accordance with the provisions of and rules promulgated under Section 21F of the SecuritiesExchange Act of 1934 or Section 806 of the Sarbanes-Oxley Act of 2002, or of any other whistleblower protection provisions ofstate or federal law or regulation; or (ii) require notification or prior approval by the Company of any reporting described in clause(i).
The Employee is hereby notified, in accordance with the Defend Trade Secrets Act of 2016, 18 U.S.C. § 1833(b), that: (i) anindividual shall not be held criminally or civilly liable under any federal or state trade secret law for the disclosure of a trade secretthat is made in confidence to a federal, state, or local government official, or to an attorney, solely for the purpose of reporting orinvestigating a suspected violation of law; (ii) an individual shall not be held criminally or civilly liable under any federal or statetrade secret law for the disclosure of a trade secret that is made in a complaint or other document filed in a lawsuit or otherproceeding, if such filing is made under seal; and (iii) an individual who files a lawsuit for retaliation by an employer for reporting asuspected violation of law may disclose the trade secret to the attorney of the individual and use the trade secret information in thecourt proceeding, if the individual files any document containing the trade secret under seal and does not disclose the trade secretexcept pursuant to court order. Notwithstanding anything herein to the contrary, nothing in this Separation Agreement shall: (i)prohibit the Employee from making reports of possible violations of federal law or regulation to any governmental agency or entityin accordance with the provisions of and rules promulgated under Section 21F of the Securities Exchange Act of 1934 or Section806 of the Sarbanes-Oxley Act of 2002, or of any other whistleblower protection provisions of state or federal law or regulation; or(ii) require notification or prior approval by the Company of any reporting described in clause (i).
In the event of a breach of the confidentiality provisions set forth in this Section 8 of the Separation Agreement by theEmployee, the Company may suspend any payments or benefits due under this Separation Agreement pending the outcome oflitigation and/or arbitration regarding such claimed breach of this Separation Agreement by the Employee.
9. Non-Defamation and Non-Disparagement . The Employee shall not at any time, publicly or privately, verbally or inwriting, directly or indirectly, make or cause to be made any defaming and/or disparaging, derogatory, misleading or false statementabout the Company or its products, or any current or former directors, officers, employees, or agents of the Company, or thebusiness strategy, plans, policies, practices or operations of the
8

Company to any person or entity, including members of the investment community, press, customers, competitors, employees andadvisors of the Company. Truthful disclosure to any government agency regarding possible violations of federal law or regulation inaccordance with any whistleblower protection provisions of state or federal law or regulation shall not be deemed to violate thisparagraph.
Employee recognizes that the breach of this Section 9 will cause serious and irreparable injury to the Company. TheEmployee further acknowledges that: (i) the Employee will not at any time, directly or indirectly, violate this Section 9 regardingnon-defamation and non-disparagement; (ii) payment of the termination payments and benefits set forth in Section 2(b) of thisSeparation Agreement shall not be made if the Employee violates this Section 9 regarding non-defamation and non-disparagement;(iii) the Company shall have no further obligation at any time to pay the termination payments and benefits set forth in Section 2(b)of this Separation Agreement if the Employee violates this Section 9 regarding non-defamation and non-disparagement; and (iv) tothe extent allowed by law, the Employee shall be required to return to the Company any termination payments and benefits paid lesstwo hundred fifty dollars ($250.00) if the Employee violates this Section 9 regarding non-defamation and non-disparagement.
10. Consequences of Breach . The Employee acknowledges and agrees that the obligations and responsibilities in thisSeparation Agreement are reasonable and not unduly restrictive. The Employee further recognizes that damages incurred by theCompany as a result of the Employee’s breach of this Separation Agreement will be difficult to measure, that monetary damages willnot provide adequate relief, and that in the event of any such breach: (i) the Company shall be entitled to apply for and receive aninjunction without bond to restrain any such violation; (ii) the Company shall not be obligated to provide the termination paymentsor benefits under this Separation Agreement; (iii) the Employee shall be obligated to pay to the Company its costs and expenses inenforcing its rights; and (iv) as an alternative to (iii), the Company may withhold and retain all but two hundred fifty dollars($250.00) of the value of the termination payment and benefits under this Separation Agreement provided to the Employee. Thecovenants in this Section 10 shall not be deemed to be a penalty nor forfeiture.
11. Severability . In the event that any one or more of the provisions of this Separation Agreement are held to be invalid,illegal or unenforceable, the validity, legality and enforceability of the remainder of the Separation Agreement shall not in any waybe affected or impaired thereby.
12. Waiver . No waiver by either party of any breach by the other party of any condition or provision of this SeparationAgreement to be performed by such other party shall be deemed a waiver of any other provision or condition at the time or at anyprior or subsequent time.
9

13. Governing Law and Forum . This Separation Agreement shall be subject to, and governed by, the laws of the State ofOhio applicable to contracts made and to be performed therein, without regard to conflict of laws principles thereof. Any action toenforce any of the provisions of this Separation Agreement shall be brought in a court of the State of Ohio located in Summit Countyor in a Federal court located in Cleveland, Ohio. The parties consent to the jurisdiction of such courts and to the service of process inany manner provided by Ohio law. Each party irrevocably waives any objection which it may now or hereafter have to the laying ofthe venue of any such suit, action, or proceeding brought in such court and any claim that such suit, action, or proceeding brought insuch court has been brought in an inconvenient forum and agrees that service of process in accordance with the foregoing sentencesshall be deemed in every respect effective and valid personal service of process upon such party.
EMPLOYEE ACKNOWLEDGES THAT, BY SIGNING THIS SEPARATION AGREEMENT, HE IS WAIVING ANY RIGHTTHAT HE MAY HAVE TO A JURY TRIAL RELATED TO THIS SEPARATION AGREEMENT.
14. Withholding . The Company shall deduct or withhold, or require the Employee to remit to the Company, theminimum statutory amount to satisfy federal, state or local taxes required by law or regulation to be withheld with respect to anybenefit provided hereunder.
15. Entire Agreement . This Separation Agreement and the Release, constitute the entire agreement and understanding ofthe parties with respect to the subject matter herein and supersede all prior agreements, arrangements and understandings, whetherwritten or oral, between the parties, including the TPA, except that nothing in this Separation Agreement shall negate or limit theEmployee’s obligations under the Code of Business Conduct and Ethics. There are no restrictions, agreements, promises, warranties,covenants or undertakings between the parties with respect to the subject matter herein other than those expressly set forth herein.The Employee acknowledges and agrees that he is not relying on any representations or promises by any representative of theCompany concerning the meaning of any aspect of this Separation Agreement or the Release. This Separation Agreement and theRelease may not be altered or modified other than in a writing signed by the Employee and an authorized representative of theCompany.
16. Notices . All notices given hereunder shall be given in writing, shall specifically refer to this Separation Agreementand shall be personally delivered or sent by telecopy or other electronic facsimile transmission or by registered or certified mail,return receipt requested, at the address set forth below or at such other address as may hereafter be designated by notice given incompliance with the terms hereof:
If to the Employee: To Employee’s last address set forth on the payroll records of the Company.
10

If to the Company: Sterling Jewelers Inc.c/o Steven J. Becker
375 Ghent RoadAkron, Ohio 44333Fax: (330) 664-4379Attn: Chief Human Resources Officer
If notice is mailed, such notice shall be effective upon mailing, or if notice is personally delivered or sent by telecopyor other electronic facsimile transmission, it shall be effective upon receipt.
17. Successors and Assigns . This Separation Agreement is intended to bind and inure to the benefit of and be enforceableby the Employee, the Company and their respective heirs, successors and assigns, except that the Employee may not assign his rightsor delegate his obligations hereunder without the prior written consent of the Company.
18. Section 409A .
(a) The intent of the parties is that payments and benefit under this Separation Agreement comply with or beexempt from Section 409A and, accordingly, to the maximum extent permitted, this Separation Agreement shall be interpreted to bein compliance therewith or exempt therefrom, as applicable. If any other payments of money or other benefits due to the Employeehereunder could cause the application of an accelerated or additional tax under Section 409A of the Code, the Company may (i)adopt such amendments to the Separation Agreement, including amendments with retroactive effect, that the Company determinesnecessary or appropriate to preserve the intended tax treatment of the benefits provided by the Separation Agreement and/or (ii) takesuch other actions as the Company determines necessary or appropriate to comply with the requirements of Section 409A.
(b) A termination of employment shall not be deemed to have occurred for purposes of this Separation Agreementproviding for the payment of any amounts or benefits that are considered nonqualified deferred compensation under Section 409Aupon or following a termination of employment, unless such termination is also a “separation from service” within the meaning ofSection 409A and the payment thereof prior to a “separation from service” would violate Section 409A. For purposes of any suchprovision of this Separation Agreement relating to any such payments or benefits, references to a “termination,” “termination ofemployment” or like terms shall mean “separation from service.” If the Employee is deemed on the date of termination to be a“specified employee” within the meaning of that term under Section 409A(a)(2)(B), then, notwithstanding any other provisionherein, with regard to any payment or the provision of any benefit that is considered nonqualified deferred compensation underSection 409A payable on account of a “separation from service,” such payment or benefit shall not be made or provided prior to
11

the date which is the earlier of (A) the expiration of the six-month period measured from the date of such “separation from service”of the Employee, and (B) the date of the Employee’s death (the “ Delay Period ”). Upon the expiration of the Delay Period, allpayments and benefits delayed pursuant to this Section 18(b) (whether they would have otherwise been payable in a single lump sumor in installments in the absence of such delay) shall be paid or reimbursed to the Employee in a lump sum on the first business dayfollowing the Delay Period, and any remaining payments and benefits due under this Separation Agreement shall be paid or providedin accordance with the normal payment dates specified for them herein.
(c) (i) All expenses or other reimbursements as provided herein shall be payable in accordance with the Company’spolicies in effect from time to time, but in any event any reimbursements that are non-qualified deferred compensation subject toSection 409A of the Code shall be made on or prior to the last day of the taxable year following the taxable year in which suchexpenses were incurred by the Employee; (ii) no such reimbursement or expenses eligible for reimbursement in any taxable yearshall in any way affect the expenses eligible for reimbursement in any other taxable year; and (iii) the right to reimbursement or in-kind benefits shall not be subject to liquidation or exchanged for another benefit.
(d) For purposes of Section 409A, the Employee’s right to receive any installment payments pursuant to thisSeparation Agreement shall be treated as a right to receive a series of separate and distinct payments. Whenever a payment underthis Separation Agreement specifies a payment period with reference to a number of days (e.g., “payment shall be made within thirtydays following the date of termination”), the actual date of payment within the specified period shall be within the sole discretion ofthe Company.
(e) Nothing contained in this Separation Agreement shall constitute any representation or warranty by theCompany regarding compliance with Section 409A. The Company has no obligation to take any action to prevent the assessment ofany additional income tax, interest or penalties under Section 409A on any person and the Company, its subsidiaries and affiliates,and each of their employees and representatives shall not have any liability to the Employee with respect thereto.
19. Compliance with Board Policies . The Employee shall be subject to the written policies of the Board, including,without limitation, any policy relating to the holding of shares of Company common stock or claw back of compensation, as theyexist from time to time during the Employee’s employment with the Company.
20. Counterparts . This Separation Agreement may be executed in counterparts, each of which shall be deemed anoriginal but all of which together shall constitute one and the same instrument.
[SIGNATURE PAGE FOLLOWS]
12

13

IN WITNESS WHEREOF, the parties hereto have executed this Agreement as of the date set forth above.
STERLING JEWELERS INC.
By: /s/ Steven J. BeckerName: Steven J. BeckerTitle: Chief Human Resources Officer
EMPLOYEE
By: /s/ Ed HrabakName: Ed Hrabak

Exhibit A
RELEASE AGREEMENT
This RELEASE (“Release”) dated as of ___________, 20__ between Sterling Jewelers Inc., a Delaware corporation(the “Company”), and Ed Hrabak (the “ Employee ”).
WHEREAS, the Company and the Employee previously entered into that certain Separation Agreement dated as ofJanuary 29, 2017 (the “ Separation Agreement ”) pursuant to which the Employee’s employment with the Company shall terminateas of July 17, 2017 or, if earlier, the Employee’s termination of employment by the Company without Cause (as determined by theCompany) or due to the Employee’s death or Disability; and
NOW, THEREFORE, in consideration of the promises and mutual agreements contained herein and in the SeparationAgreement, the Company and the Employee agree as follows:
1. Capitalized terms not defined herein shall have the meaning as defined under the Separation Agreement.
2. In consideration of the Employee’s release under Paragraph 3 hereof, the Company shall pay to the Employee or providebenefits to the Employee as set forth in Section 2, as applicable, of the Separation Agreement, which is attached hereto and made apart hereof.
3. The Employee, on Employee’s own behalf and on behalf of Employee’s heirs, estate and beneficiaries, does hereby release theCompany, and in such capacities, any of its subsidiaries or affiliates, and each past or present officer, director, agent, employee,shareholder, and insurer of any such entities, from any and all claims made, to be made, or which might have been made of whatevernature, whether known or unknown, from the beginning of time, including those that arose as a consequence of Employee’semployment with the Company, or arising out of the severance of such employment relationship, or arising out of any act committedor omitted during or after the existence of such employment relationship, all up through and including the date on which this Releaseis executed, including, without limitation, any tort and/or contract claims, common law or statutory claims, claims under any local,state or federal wage and hour law, wage collection law or labor relations law, claims under any common law or other statute, claimsof age, race, sex, sexual orientation, religious, disability, national origin, ancestry, citizenship, retaliation or any other claim ofemployment discrimination, including under Title VII of the Civil Rights Acts of 1964 and 1991, as amended (42 U.S.C. §§ 2000e etseq. ), Age Discrimination in Employment Act, as amended (29 U.S.C. §§ 621, et seq. ); the Americans with Disabilities Act (42U.S.C. §§ 12101 et seq. ), the Rehabilitation Act of 1973 (29 U.S.C. 701 et seq .), the Family and Medical Leave Act (29

U.S.C. §§ 2601 et seq. ), the Employee Retirement Income Security Act of 1974, as amended (29 U.S.C. §§ 1001 et seq. ), the OhioCivil Rights Act (Ohio Rev. Code Ann. §§ 4112.01-4112.99, the Ohio Whistleblower’s Protection Statue (Ohio Rev. Code Ann. §§4113.51-4113.53), and any other law (including any state or local law or ordinance) prohibiting employment discrimination orrelating to employment, retaliation in employment, termination of employment, wages, benefits or otherwise. If any arbitrator orcourt rules that such waiver of rights to file, or have filed on Employee’s behalf, any administrative or judicial charges or complaintsis ineffective, the Employee agrees not to seek or accept any money damages or any other relief upon the filing of any suchadministrative or judicial charges or complaints. Notwithstanding the preceding sentence, nothing in this Release shall be construedto limit the Employee’s right to receive any monetary award from the Securities and Exchange Commission pursuant to Section 21Fof the Securities Exchange Act of 1934, as amended. The Employee relinquishes any right to future employment with the Companyand the Company shall have the right to refuse to re-employ the Employee, in each case without liability of the Employee or theCompany. The Employee acknowledges and agrees that even though claims and facts in addition to those now known or believed byhim to exist may subsequently be discovered, it is Employee’s intention to fully settle and release all claims he may have against theCompany and the persons and entities described above, whether known, unknown or suspected.
4. The Company and the Employee acknowledge and agree that the release contained in Paragraph 3 does not, and shall not beconstrued to, release or limit the scope of any existing obligation of the Company and/or any of its subsidiaries or affiliates (i) toindemnify the Employee for Employee’s acts as an officer or director of Company in accordance with the Certificate ofIncorporation and all agreements thereunder, (ii) to pay any amounts or benefits pursuant to Section 2 of the Separation Agreement,or (iii) with respect to the Employee’s rights as a shareholder of the Company, Signet or any of their subsidiaries.
5. Employee acknowledges that pursuant to the Release set forth in Paragraph 3 above, Employee is waiving and releasing anyrights he may have under the Age Discrimination in Employment Act of 1967 (“ADEA”) and that Employee’s waiver and release ofsuch rights is knowing and voluntary. Employee acknowledges that the consideration given for the ADEA waiver and release underthis Release is in addition to anything of value to which Employee was already entitled.
(a) Employee further acknowledges that he has been advised by this writing that:
(i) Employee should consult with an attorney prior to executing this Release and has had an opportunity to do so;
2

(ii) Employee has up to twenty-one (21) days within which to consider this ADEA waiver and release;
(iii) Employee has seven (7) days following Employee’s execution of this Release to revoke this ADEA waiver andrelease, but only by providing written notice of such revocation to the Company in accordance with the “Notice” provision inSection 15(f) of the Agreement;
(iv) the ADEA waiver and release shall not be effective until the seven (7) day revocation period has expired; and
(v) the twenty-one (21) day period set forth above shall run from the date Employee receives this Release. TheParties agree that any modifications made to this Release prior to its execution shall not restart, or otherwise affect, this twenty-oneday (21) period.
(b) It is the intention of the parties in executing this Release that this Release shall be effective as a full and finalaccord and satisfaction and release of and from all liabilities, disputes, claims and matters covered under this Release,known or unknown, suspected or unsuspected.
6. This Release shall become effective on the first (1 st ) day following the day that this Release becomes irrevocable underParagraph 5. All payments due to the Employee shall be payable in accordance with the terms of the Agreement.
[remainder of page intentionally blank]
3

IN WITNESS WHEREOF, the parties have executed this Release on the date first above written.
STERLING JEWELERS INC.
By:
Name:Title:
ED HRABAK
4

Exhibit 12.1
Computation of Ratio of Earnings to Fixed Charges and Preferred Share Dividends
(in millions, except ratios) Fiscal 2017 Fiscal 2016 Fiscal 2015 Fiscal 2014 Fiscal 2013
Earnings: Income before income taxes $ 713.8 $ 657.8 $ 540.6 $ 566.5 $ 556.9
Fixed charges (see below) 224.2 221.1 190.3 111.9 108.9
Total earnings $ 938.0 $ 878.9 $ 730.9 $ 678.4 $ 665.8
Fixed charges: Interest expense, net (1) $ 46.6 $ 42.3 $ 28.6 $ 3.6 $ 3.2
Amortization of debt discount and issuance costs (1) 2.8 3.6 7.4 0.4 0.4
Estimate of interest within rental expense (2) 174.8 175.2 154.3 107.9 105.3
Total fixed charges $ 224.2 $ 221.1 $ 190.3 $ 111.9 $ 108.9
Ratio of earnings to fixed charges 4.18 3.98 3.84 6.06 6.11
Fixed charges and preferred share dividends: Fixed charges (per above) $ 224.2 $ 221.1 $ 190.3 $ 111.9 $ 108.9
Preferred share dividends (3) 15.6 n/a n/a n/a n/a
Total fixed charges and preferred share dividends $ 239.8 $ 221.1 $ 190.3 $ 111.9 $ 108.9
Ratio of earnings to fixed charges and preferred share dividends 3.91 3.98 3.84 6.06 6.11
(1) For purposes of calculating the ratio of earnings to fixed charges, interest expense, net includes interest expense related to outstanding indebtedness, including $2.8 million for the amortization ofdebt discount and issuance costs disclosed on the consolidated statement of cash flows.
(2) Interest within rental expense is estimated to be one-third of rental expense.(3) Preferred share dividends represent the pre-tax dollars required to service the $11.9 million of preferred share dividends reflected on the consolidated income statement, including the deemed
dividend for the accretion of preferred share issuance costs. See Note 5 and Note 6 of Item 8 for additional information.n/a Not applicable as preferred shares issued in October 2016.

Exhibit 21.1
SUBSIDIARIES OF REGISTRANT
The following is a list of subsidiaries of the Company as of January 28, 2017 omitting subsidiaries which, considered in the aggregate, would not constitute asignificant subsidiary.
NAME WHERE INCORPORATED
Sterling Inc. Ohio, USA Signet Service Plans, Inc. Ohio, USA Sterling Jewelers Inc. Delaware, USA Sterling Jewelers Receivables Corp. Delaware, USA Signet US Holdings Inc. Delaware, USA Signet Group Treasury Services Inc. Delaware, USA Zale Corporation Delaware, USA Zale Delaware, Inc. Delaware, USA Zale Canada Co. Canada Signet Group Limited England Signet UK Finance plc England Signet Holdings Limited England Signet Trading Limited England Signet Bermuda Finance Limited Bermuda Signet Global Insurance Services Limited Bermuda Signet Malta Finance Limited Malta Signet Luxembourg Holdings Sarl Luxembourg Signet Luxembourg Finance Sarl Luxembourg Signet Luxembourg Sarl Luxembourg

Exhibit 23.1
Consent of Independent Registered Public Accounting Firm
The Board of DirectorsSignet Jewelers Limited:
We consent to the incorporation by reference in the registration statements (Nos. 333-159987, 333-153435, 333-09634, 333-134192, 333-12304, 333-153422 and333-08964) on Forms S-8 and (Nos. 333-195865-18 and 333-214462) on Forms S-3 of Signet Jewelers Limited of our report dated March 16, 2017, with respect tothe consolidated balance sheets of Signet Jewelers Limited and subsidiaries as of January 28, 2017 and January 30, 2016 , and the related consolidated incomestatements, statements of comprehensive income, statements of cash flows, and statements of shareholders’ equity for each of the 52 week periods endedJanuary 28, 2017 , January 30, 2016 , and January 31, 2015 , and the effectiveness of internal control over financial reporting as of January 28, 2017 , which reportappears in the January 28, 2017 annual report on Form 10‑K of Signet Jewelers Limited.
/s/ KPMG LLP
Cleveland, OhioMarch 16, 2017

Exhibit 31.1
CERTIFICATION
I, Mark Light, certify that:
1. I have reviewed this Annual Report on Form 10-K of Signet Jewelers Limited (the “Report”);
2. Based on my knowledge, this Report does not contain any untrue statement of a material fact or omit to state a material fact necessary to make thestatements made, in light of the circumstances under which such statements were made, not misleading with respect to the period covered by this Report;
3. Based on my knowledge, the financial statements, and other financial information included in this Report, fairly present in all material respects thefinancial condition, results of operations and cash flows of the company as of, and for, the periods presented in this Report;
4. The company’s other certifying officer and I are responsible for establishing and maintaining disclosure controls and procedures (as defined in ExchangeAct Rules 13a-15(e) and 15d-15(e)) and internal control over financial reporting (as defined in Exchange Act Rules 13a-15(f) and 15d-15(f)) for the companyand have:
(a) Designed such disclosure controls and procedures, or caused such disclosure controls and procedures to be designed under our supervision, toensure that material information relating to the company, including its consolidated subsidiaries, is made known to us by others within those entities,particularly during the period in which this Report is being prepared;
(b) Designed such internal control over financial reporting, or caused such internal control over financial reporting to be designed under oursupervision, to provide reasonable assurance regarding the reliability of financial reporting and the preparation of financial statements for externalpurposes in accordance with generally accepted accounting principles;
(c) Evaluated the effectiveness of the company’s disclosure controls and procedures and presented in this Report our conclusions about theeffectiveness of the disclosure controls and procedures, as of the end of the period covered by this Report based on such evaluation; and
(d) Disclosed in this Report any change in the company’s internal control over financial reporting that occurred during the company’s most recent fiscalquarter (the company’s fourth quarter in the case of an annual report) that has materially affected, or is reasonably likely to materially affect, thecompany’s internal control over financial reporting; and
5. The company’s other certifying officer and I have disclosed, based on our most recent evaluation of internal control over financial reporting, to thecompany’s auditors and the audit committee of the company’s board of directors (or persons performing the equivalent functions):
(a) All significant deficiencies and material weaknesses in the design or operation of internal control over financial reporting which are reasonablylikely to adversely affect the company’s ability to record, process, summarize and report financial information; and
(b) Any fraud, whether or not material, that involves management or other employees who have a significant role in the company’s internal controlover financial reporting.
Date: March 16, 2017
By: /s/ Mark LightName: Mark LightTitle: Chief Executive Officer
Exhibit 31.2
CERTIFICATION
I, Michele L. Santana, certify that:
1. I have reviewed this Annual Report on Form 10-K of Signet Jewelers Limited (the “Report”);
2. Based on my knowledge, this Report does not contain any untrue statement of a material fact or omit to state a material fact necessary to make thestatements made, in light of the circumstances under which such statements were made, not misleading with respect to the period covered by this Report;
3. Based on my knowledge, the financial statements, and other financial information included in this Report, fairly present in all material respects thefinancial condition, results of operations and cash flows of the company as of, and for, the periods presented in this Report;
4. The company’s other certifying officer and I are responsible for establishing and maintaining disclosure controls and procedures (as defined in ExchangeAct Rules 13a-15(e) and 15d-15(e)) and internal control over financial reporting (as defined in Exchange Act Rules 13a-15(f) and 15d-15(f)) for the companyand have:
(a) Designed such disclosure controls and procedures, or caused such disclosure controls and procedures to be designed under our supervision, toensure that material information relating to the company, including its consolidated subsidiaries, is made known to us by others within those entities,particularly during the period in which this Report is being prepared;
(b) Designed such internal control over financial reporting, or caused such internal control over financial reporting to be designed under oursupervision, to provide reasonable assurance regarding the reliability of financial reporting and the preparation of financial statements for externalpurposes in accordance with generally accepted accounting principles;
(c) Evaluated the effectiveness of the company’s disclosure controls and procedures and presented in this Report our conclusions about theeffectiveness of the disclosure controls and procedures, as of the end of the period covered by this Report based on such evaluation; and
(d) Disclosed in this Report any change in the company’s internal control over financial reporting that occurred during the company’s most recent fiscalquarter (the company’s fourth quarter in the case of an annual report) that has materially affected, or is reasonably likely to materially affect, thecompany’s internal control over financial reporting; and
5. The company’s other certifying officer and I have disclosed, based on our most recent evaluation of internal control over financial reporting, to thecompany’s auditors and the audit committee of the company’s board of directors (or persons performing the equivalent functions):
(a) All significant deficiencies and material weaknesses in the design or operation of internal control over financial reporting which are reasonablylikely to adversely affect the company’s ability to record, process, summarize and report financial information; and
(b) Any fraud, whether or not material, that involves management or other employees who have a significant role in the company’s internal controlover financial reporting.
Date: March 16, 2017
By: /s/ Michele L. SantanaName: Michele L. SantanaTitle:
Chief Financial Officer(Principal FinancialOfficerand PrincipalAccounting Officer)

Exhibit 32.1
CERTIFICATION
PURSUANT TO 18 U.S.C. SECTION 1350,
AS ADOPTED PURSUANT TO SECTION 906 OF THE SARBANES-OXLEY ACT OF 2002
I, Mark Light, as Chief Executive Officer of Signet Jewelers Limited (the “Company”), hereby certify, pursuant to 18 U.S.C. § 1350, as adopted pursuant toSection 906 of the Sarbanes-Oxley Act of 2002, that to my knowledge:
(1) the accompanying Annual Report on Form 10-K for the period ending January 28, 2017 , as filed with the US Securities and Exchange Commission (the“Report”) fully complies with the requirements of Section 13(a) or 15(d) of the Securities Exchange Act of 1934, as amended; and
(2) the information contained in the Report fairly presents, in all material respects, the financial condition and results of operations of the Company.
Date: March 16, 2017
By: /s/ Mark LightName: Mark LightTitle: Chief Executive Officer
Exhibit 32.2
CERTIFICATION
PURSUANT TO 18 U.S.C. SECTION 1350,
AS ADOPTED PURSUANT TO SECTION 906 OF THE SARBANES-OXLEY ACT OF 2002
I, Michele L. Santana, as Chief Financial Officer of Signet Jewelers Limited (the “Company”), hereby certify, pursuant to 18 U.S.C. § 1350, as adopted pursuant toSection 906 of the Sarbanes-Oxley Act of 2002, that to my knowledge:
(1) the accompanying Annual Report on Form 10-K for the period ending January 28, 2017 , as filed with the US Securities and Exchange Commission (the“Report”) fully complies with the requirements of Section 13(a) or 15(d) of the Securities Exchange Act of 1934, as amended; and
(2) the information contained in the Report fairly presents, in all material respects, the financial condition and results of operations of the Company.
Date: March 16, 2017
By: /s/ Michele L. SantanaName: Michele L. SantanaTitle:
Chief Financial Officer(Principal FinancialOfficerand PrincipalAccounting Officer)