significance of ron and mon to a modern disi engine
TRANSCRIPT

Significance of RON and MON to a modern DISI engine
Wang, C., Prakash, A., Aradi, A., Cracknell, R. & Xu, H. Author post-print (accepted) deposited by Coventry University’s Repository Original citation & hyperlink:
Wang, C, Prakash, A, Aradi, A, Cracknell, R & Xu, H 2017, 'Significance of RON and MON to a modern DISI engine' Fuel, vol 209, pp. 172-183. https://dx.doi.org/10.1016/j.fuel.2017.07.071
DOI 10.1016/j.fuel.2017.07.071 ISSN 0016-2361 ESSN 1873-7153 Publisher: Elsevier NOTICE: this is the author’s version of a work that was accepted for publication in Fuel. Changes resulting from the publishing process, such as peer review, editing, corrections, structural formatting, and other quality control mechanisms may not be reflected in this document. Changes may have been made to this work since it was submitted for publication. A definitive version was subsequently published in Fuel, Vol 209, (2017)] DOI: 10.1016/j.fuel.2017.07.071 © 2017, Elsevier. Licensed under the Creative Commons Attribution-NonCommercial-NoDerivatives 4.0 International http://creativecommons.org/licenses/by-nc-nd/4.0/ Copyright © and Moral Rights are retained by the author(s) and/ or other copyright owners. A copy can be downloaded for personal non-commercial research or study, without prior permission or charge. This item cannot be reproduced or quoted extensively from without first obtaining permission in writing from the copyright holder(s). The content must not be changed in any way or sold commercially in any format or medium without the formal permission of the copyright holders. This document is the author’s post-print version, incorporating any revisions agreed during the peer-review process. Some differences between the published version and this version may remain and you are advised to consult the published version if you wish to cite from it.

1
Significance of RON and MON to a modern DISI engine
Authors: 1,2Wang, Chongming; 3 Prakash, Arjun; 2Aradi, Allen; 4Cracknell, Roger; 1,5Xu, Hongming
1. University of Birmingham, UK; 2. Shell Global Solutions (Deutschland), Germany, 3. Shell Global
Solutions (US), USA; 4. Shell Global Solutions (UK), UK; 5. State Key Laboratory of Automotive Safety
and Energy, Tsinghua University, Beijing
Abstract: The anti-knock quality of gasoline fuels is a significant contributing factor to the indicated
thermal efficiency (ITE) of spark ignition (SI) engines. Historically, the anti-knock quality of gasoline is
characterised by two parameters, research octane number (RON) and motor octane number (MON), which
are measured in cooperative fuel research engines (CFR) using iso-octane and n-heptane as the primary
reference fuels (PRFs). However, due to significant hardware, operating condition and fuelling differences
between the CFR and the modern SI engines, the relevance of RON and MON to modern SI engines needs
to be re-assessed. In this study, six fuels were designed with independent control over RON and MON. The
other key fuel properties, such as the heat of vaporisation, the oxygen content, the lower heating value and
the stoichiometric air-fuel ratio (AFR) were kept similar for all the fuels. Among the six fuels, two fuels
represent regular- and premium-grade gasoline fuels with respect to octane quality in the North American
market. The objective of this study was to assess the significance of RON and MON to the combustion
characteristics of a modern SI engine. A single cylinder 4-stroke direct injection spark ignition (DISI)
research engine was used as the experimental tool. The engine tests were conducted at the engine speed of
1800 rpm and the engine load ranging from 4 to 20 bar IMEP. Three market representative engine
compression ratios (9.5:1, 10.5:1 and 11.5:1) were selected. In addition, the engine K value was calculated
at knock-limited engine conditions. The results showed that, under knock-free engine operating conditions
and at a fixed engine compression ratio, variation of fuel RON and MON had almost no differential impact
on ITE. Under knock-limited operating conditions, increasing MON did not increase ITE, and in contrast,
2
even led to decreased ITE especially when RON was as low as 93 and the compression ratio was high.
Under knock-limited operating conditions, when the RON of the fuel was as high as 98, changing the MON
up or down only showed combustion phasing benefits/disbenefits without obvious ITE benefit. This is
because the octane rating of the fuel was high and in order to differentiate their anti-knock quality, a higher
compression ratio than 11.5:1 was needed. The calculated engine K value shows that RON was a more
significant influential factor than MON in determining the engine thermal efficiency. RON was found to
have a higher impact on ITE at the higher MON of 88 vs. the lower MON of 83.
Keywords: RON; MON; DISI; Combustion; Indicated Thermal Efficiency

3
Definitions, Acronyms and Abbreviations
AFR Air Fuel Ratio
ATDC After Top Dead Centre
BTDC Before Top Dead Centre
°CA Crank Angle
CAD Crank Angle Degree
CFR Cooperative Fuel Research
CR Compression Ratio
COV Coefficient of Variation
DI Direct Injection
DISI Direct Injection Spark Ignition
EGR Exhaust Gas Recirculation
HOV Heat of Vaporization
KLSA Knock Limited Spark Advance
LHV Lower Heating Value
IMEP Indicated Mean Effective Pressure
ISFC Indicated Specific Fuel Consumption
ITE Indicated Thermal Efficiency
MFB Mass Fraction Burn
MFB05 Crank angle where 5% of fuel is burned
MFB50 Crank angle where 50% of fuel is burned
MFB90 Crank angle where 50% of fuel is burned
MON Motor Octane Number
NEDC New European Driving Cycle
ON Octane Number
OI Octane Index
PFI Port Fuel Injection
Pmax Peak in-cylinder pressure
PRFs Primary Reference Fuels
rpm Revolutions per Minute
RON Research Octane Number
SI Spark Ignition
TDC Top Dead Centre
vol.% Volumetric Percentage
VVT Variable Valve Timing
Indicated Thermal Efficiency
4
1. INTRODUCTION
The transportation sector is facing pressures of increased light duty mobility demand and more stringent
regulations on fuel economy and greenhouse gas emissions [1]. Even though hybrid and electric vehicles are
gaining significant support and popularity, conventional vehicles powered by internal combustion engines will
still be the main tool for light-duty transportation in the foreseeable future [2]. Therefore, improving the
efficiency of internal combustion engines via better engine design is highly relevant [3-6]. Apart from
improving the engine hardware, better fuel properties such as higher anti-knock quality can play a significant
role in impacting the engine efficiency.
Historically, the anti-knock quality of gasoline fuels is described by two parameters, research octane number
(RON) and motor octane number (MON), which are measured in standardized single cylinder naturally
aspirated carburettor SI engines designed in the year of 1929, which are known as cooperative fuel research
(CFR) engines [7-9]. Details of RON and MON test procedures are defined in the ASTM standards D2699-08
and D2700-08, respectively [10, 11].
In the past 90 years since the introduction of CFR engines, internal combustion engines have developed
significantly, driven by stringent fuel economy and emission standards [12-14]. Modern SI engines, especially
the turbo-charged downsized designs tend to operate at relatively lower temperature but higher intake manifold
pressure, resulting from the use of advanced hardware/technologies such as direct injection and charging
intercooler [15]. In addition, the physiochemical properties of the reference fuels (iso-octane and n-heptane)
used in CFR, called primary reference fuels (PRF), differ from gasoline available on the market, which consists
of hundreds of hydrocarbons that have different properties such as boiling range, ignition delay, and octane
sensitivity. Due to significant hardware and fuelling differences between the CFR and modern engines, the
relevance of RON and MON to modern SI engines needs to be re-assessed.
The impact of RON has been studied by many investigators, and it is generally accepted that higher RON is
beneficial to improving engine thermal efficiency [16-21]. However, the relevance of MON to modern
5
gasoline engines is being challenged in the recent ten years [12, 22-24]. It was found that, for some engine
types and at some operating conditions, a fuel with a low MON for a given value of RON could be beneficial
in reducing engine knock tendency [12, 22, 25-27]. To address the disconnect between CFR and modern
engines, an octane index (OI) was proposed [1]:
Equation 1: OI = RON − K × (RON − MON) = RON − K × S
where K is a weighting factor depending solely on in-cylinder temperature and pressure history experienced
by the end-gas prior to the onset of auto-ignition; S, the difference between RON and MON, is the octane
sensitivity. A higher OI indicates that the engine is more resistant to knock. If K is negative, a fuel with a high
octane sensitivity is beneficial to suppressing engine knocking [28].
The engine K value can be determined through either experiments or modelling. The experiment method relies
on the correlation of an engine/vehicle performance parameter relating to fuels’ auto-ignition properties such
as knock limited spark advance (KLSA) and acceleration time with an RON and MON de-correlated fuel
matrix. Details regarding the experiment method can be found in the literature [12, 22, 26, 28-30]. For the
modelling method, in-cylinder pressure data is required as an input, based on which the in-cylinder temperature
is calculated. The crank angle of auto-ignition for a matrix of PRFs and toluene/n-heptane mixtures using the
Livengood-Wu integral is calculated, and then the OI and K value of PRFs and toluene/n-heptane fuel mixtures
are determined through the PRF calibration curve. Details about the modelling method can be found in research
studies elsewhere [15, 27].
There are a few studies available in the literature, focusing on the K value of SI engines/vehicles. Mittal and
Heywood [21] found that K values of the vehicles produced between 1951 and 1991 became lower and even
negative due to the use of advanced cooling and breathing techniques, and the replacement of carburettors
with fuel injectors. They [31] tested fuels with various RON and MON in a single cylinder port fuel injection
(PFI) SI engine under one bar intake manifold pressure. The experimental results showed that K value was
negative. K had a strong dependence on the intake air temperature, engine speed, and intake charge pressure.

6
Based on these findings, Mittal and Heywood [31] recommended modifying the octane rating tests to better
bracket the knock limited operating conditions of modern SI engines.
Remmert et al. [27] studied the octane appetite and K value in a 4-cylinder DISI engine. Seven RON and MON
decorrelated fuels were tested at several high load conditions. The impacts of external EGR, boost pressure,
back pressure and lambda were investigated. They found that under high load conditions (approximately 20-
30 BMEP), K value was in the range of -0.26 and -1.14. Davies et al. [15] investigated K value of several
engines under high boost and EGR conditions. They found that K value was in the range of -0.86 to 0.5.
Kalghatgi [29] reported that the averaged K value at full throttle conditions was -0.38 for 37 SI engines ranging
from naturally aspirated to turbo-charged, and 1.2 L small engines to 2.4 L big engines. Orlebar et al. [30]
conducted an octane sensitivity study on the model year 2007 Pontiac Solstice. They found that there was a
clear negative correlation between charge pressure and K value.
Even though there are relevant publications available about the impact of fuel octane in spark-ignition (SI)
engines, the RON and MON of the fuel matrices used in those studies were usually correlated, making the
assessment of the individual contribution of RON and MON impossible. To address this knowledge gap, in
this study six fuels were designed with independent control over RON and MON. The significance of RON
and MON on the combustion characteristics were studied in a single cylinder DISI research engine. The
experiments were conducted at the stoichiometric AFR with the engine speed of 1800 rpm and loads ranging
from 4 and 20 bar IMEP using the fuel-specific optimum spark timing.
2. EXPERIMENTAL SYSTEMS AND METHODS
2.1. ENGINE AND INSTRUMENTATION
The experiment was conducted in an AVL single cylinder 4-stroke DISI research engine with 82 mm bore and
86 mm stroke, the setup of which is presented in Figure 1. Its combustion system features a 4-valve pent roof
cylinder head equipped with variable valve timing (VVT) systems for both intake and exhaust valves. The
7
cylinder head was equipped with a central-mounted outward opening piezo direct injector. The spark plug was
located at the centre of the combustion chamber slightly tilting towards the exhaust side. The compression
ratio (CR) of this engine was manually adjusted by placing various sized metal sheets between the cylinder
liner and the crankcase.
The engine was coupled to an electric dynamometer, which was able to maintain the engine at a constant speed
(± 1 rpm) regardless of the engine power output. The engine was controlled via an IAV FI2RE management
system. An AVL Indicom system was used for real-time combustion indication and analysis. A Siemens CATs
system was used for data acquisition and recording, and it communicated with the IAV FI2RE and the AVL
Indicom systems. The Siemens CATs system was also used for controlling air, fuel, coolant and lubricant
conditioning equipment.
A Kistler pressure transducer was used for the in-cylinder pressure measurement, and it was installed in a
sleeve on the intake and exhaust bridge. The cylinder pressure was collected via a charge amplifier (ETAS
ES630.1). The sampling resolution was 0.1 crank angle (°CA) between -30 °CA and 70 °CA after top dead
centre (ATDC), and 1 °CA in rest of the crank angles. Some key temperature and pressure measurement
locations used are briefly labelled as ‘T’ and ‘P’ in Figure 1.
The engine intake system was connected with an external air handling device, capable of delivering up to 3
bar boosted air. Air was first filtered, dried, and then delivered to a conditioning unit with a capacity of
approximately 200 L, where air pressure and temperature were precisely close-loop controlled. Temperatures
of fuel, coolant and lubricant were controlled by individual AVL conditioning systems. Fuel consumption was
measured by an AVL fuel mass flow meter.
2.2. FUEL PROPERTIES
Table 1 lists the properties of fuels in this study. All the fuels contained approximately 10 vol.% ethanol, and
they were free of detergent additives or any other performance additives. F2 and F5 denote market realistic
octane quality for a regular-grade (averaged knock index (AKI)=87) and a premium-grade (AKI=93) gasoline

8
fuels in the North American market, respectively. Fuels 1-3 and Fuels 4-6 had RON of 93 and 98, respectively.
However, Fuels 1-3 and Fuels 4-6 differed in MON with the sensitivity going from 5 to 15. Fuel 1 and Fuel 5
had the same MON but different RON, the same with Fuel 2 and F6. The other key properties such as the heat
of vaporisation, oxygen content, lower heating value, stoichiometric AFR and density were kept similar across
all fuels.
2.3. EXPERIMENTAL PROCEDURE
Table 2 lists the engine operating conditions. For each fuel at a certain engine operating condition, if the engine
was not knock-limited, spark timing was adjusted by aiming the combustion centre (MFB50) at 7.5±0.5
°ATDC, which was an approximation of the maximum brake torque (MBT) spark timing. The term ‘MFB50’
stands for the crank angle position where 50% mass fraction of the fuel is burned. When engine knock
occurred, spark timing was retarded to limit the knock intensity below the maximum tolerated intensity in
order to avoid potential engine damage. The maximum tolerated knock intensity at 1800 rpm engine speed is
2 bar cycle-based maximum in-cylinder pressure oscillation. In this case, spark timing was termed as the knock
limited spark advance (KLSA). The same valve timing and injection maps were used for all the fuels in this
study (see Table 2).
The engine was first warmed up until the coolant, lubricant, fuel, and intake air temperatures were stabilised,
which usually took 30 minutes. The engine was then run at a reference operating point (a daily checkpoint) in
order to make sure that the engine was in good condition. The main parameters for the daily check were in-
cylinder pressure, the peak in-cylinder pressure, MFB50, gaseous emissions and particulate emissions. After
the engine passed the daily check, the test was executed according to the test protocol provided in Table 2.
The maximum tolerated knock intensity at the engine speed of 1800 rpm was defined as 2 bar cycle-based
maximum in-cylinder pressure oscillation. Raw in-cylinder pressure data was filtered by a 3-30 kHz band-
pass filter, and then the filtered pressure data was rectified. The cycle-based maximum in-cylinder pressure
oscillation was defined as the maximum pressure amplitude of the filtered and rectified in-cylinder pressure
9
of that cycle. The cycle-based maximum in-cylinder pressure oscillation was calculated in real-time by AVL
Indicom combustion analyser.
During the test protocol design stage, a design of experiment was conducted for intake and exhaust valve
timings. One of the objectives was to avoid scavenging flow of air, which was achieved by carefully choosing
the valve opening and closing timings, and also the control of exhaust back pressure. In this study, valve
opening and closing timings were controlled via a variable valve timing system. The exhaust back pressure
was controlled via an air-driven valve, and the control target was to match the exhaust back pressure with the
intake manifold pressure. During the tests, three lambda values were obtained from lambda sensor, Horiba
MEXA-7100D gas analyser, calculated value from the air and fuel flow meter readings. If there were
scavenging flow of air, the lambda value calculated from the air and fuel flow meter readings would be higher
than the readings from lambda sensor and Horiba MEXA-7100D gas analyser. During the tests, these three
values matched well (±3% difference) with each other, which provided the confidence that there was
no/minimal scavenging flow of air. For each engine operating point, the in-cylinder pressure data for 200
consecutive cycles were recorded. Low-frequency data were averaged and recorded for over a period of two
minutes.
2.4. DATA PROCESSING
Net IMEP was calculated by the AVL Indicom. In the following test, Net IMEP is referred to as IMEP.
The heat release rate and mass fraction burned (MFB) were calculated and used to characterise the combustion
process. In-cylinder pressure and the corresponding cylinder volume data were used to calculate the net
apparent heat release rate based on the following equation:
Equation 2: 𝑑𝑄
𝑑𝜃=
𝛾
𝛾−1× 𝑃 ×
𝑑𝑉
𝑑𝜃+
1
𝛾−1× 𝑉 ×
𝑑𝑃
𝑑𝜃
where γ is the ratio of specific heat capacities (Cp/Cv); P, V and 𝜃 are instant in-cylinder pressure, cylinder
volume and crank angle position, respectively.
10
According to Heywood’s book [32], γ for the unburned mixture (fuel, air and burned residual) is a function of
temperature, equivalence ratio, and burned gas fraction, and it is typically in the range of 1.25 to 1.35 in spark
ignition engines. γ of the equilibrium burned mixture is a function of equivalence ratio, and it is typically in
the range of 1.18 to 1.28. In literature [33, 34], many researchers used a fixed γ (1.28-1.32) for heat releaser
rate calculation. In this study, the exponent n for the compression and expansion processes (PVn=constant)
was calculated, and the crank angle windows for n calculation were 60 to 20 ºbTDC for the compression stroke
and 50 to 80 ºaTDC for the expansion stroke. The exponent n for the compression process is comparable to
the average value of γ for the unburned mixture over the compression process [32]. Therefore, the exponent n
for the compression process is used to calculate heat release rate during the compression stroke. Because
accurately estimating the in-cylinder temperature during combustion is challenging, and also the mixture
composition inside the cylinder changes rapidly during combustion, γ for the expansion stroke has to be
estimated. The appropriate values for γ during the combustion stroke which gives the most accurate heat-
release information are not well defined [32]. In this paper, the exponent n for the expansion stroke was used
to calculate heat release rate during the expansion stroke. It has to be pointed out that the actual γ (typically
between 1.18 and 1.28) during expansion is lower than the exponent n for the expansion stroke due to heat
loss to the combustion chamber. Nevertheless, it has been found out that the exponent n for the expansion
stroke was in the range of 1.20 to 1.30; therefore, it is a reasonable estimation.
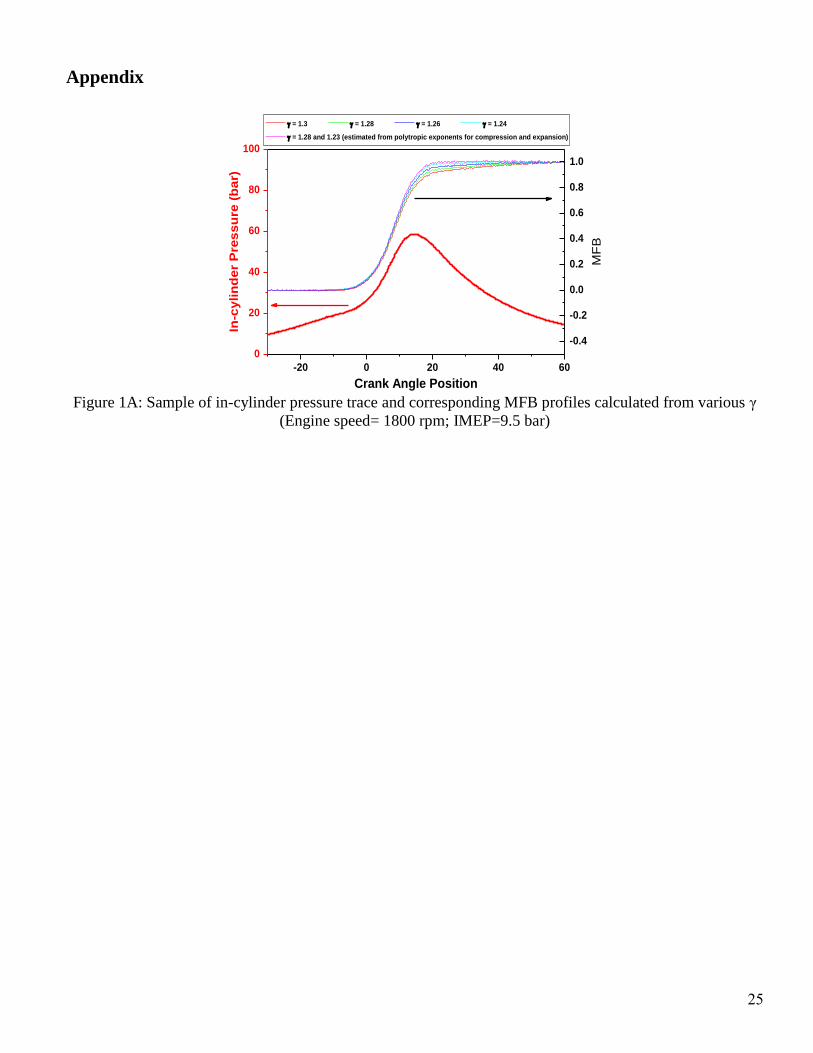
The definition of MFB is the accumulated released heat in successive crank angles ranging from the start of
combustion to a certain crank angle degree divided by the total heat released in the entire combustion process.
In the Appendix, Figure 1A shows an example of MFB calculated from differently fixed γ (ranging from 1.24
to 1.3), and γ using the polytropic exponents for the compression and expansion processes. It can be seen that
the difference in the MFB profiles calculated from various γ is limited apart from MFB90 (approximately 4
CAD difference). The relatively large difference in MFB90 is mainly because the MFB90 lies in a flat region
of the MFB profile, therefore γ have a relatively large impact on the MFB90.
11
Engine indicated thermal efficiency (ITE) is calculated by the following equation:
Equation 3: ITE =30×𝑠×IMEP×𝑉𝑆
�̇�×𝐿𝐻𝑉𝑓𝑢𝑒𝑙
where s is the engine speed (rpm); IMEP is the engine load (Pa); Vs is the engine sweep volume (m3); �̇� is
the fuel flow rate (kg/h); 𝐿𝐻𝑉𝑓𝑢𝑒𝑙 is the low heat value of the fuel (J/kg).
The averaged ITE at the 1800 rpm engine speed is defined as:
Equation 4: Averaged ITE = ∑ ITE𝑖
𝑛1
𝑛
where ITEi is the ITE at the operating point i; n is the number of operating points being tested at the engine
speed of 1800 rpm.
3. RESULTS AND DISCUSSION
There are three sections in the results and discussion. First, the impact of MON on engine combustion
characteristics is discussed by comparing two groups of fuels, each of which had the same RON but different
MON. Second, the impact of RON is discussed by comparing two groups of fuels, each of which had the same
MON but different RON. In the end, discussions about the significance and comparison of RON and MON,
and K value study are presented.
3.1. IMPACT OF MON
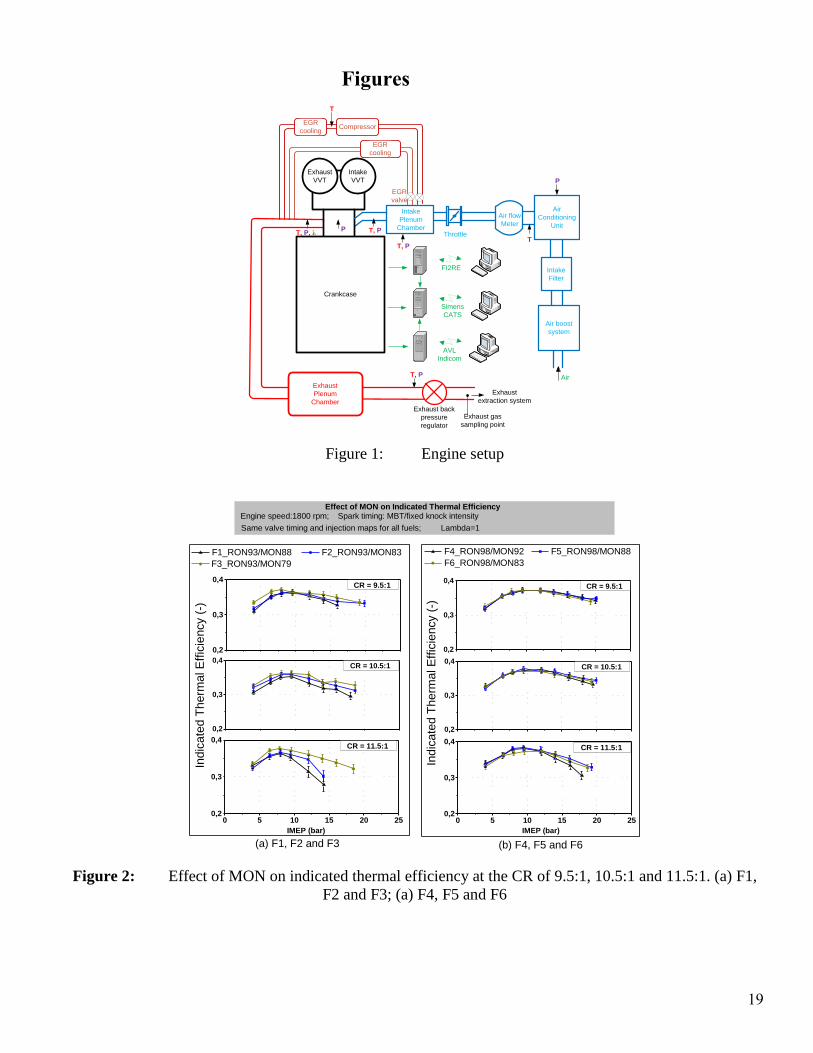
Figure 2 shows the effect of MON on ITE at the CR of 9.5:1, 10.5:1 and 11.5:1. The results of two groups of
fuels are presented, including F1-F3 with RON of 93 (low RON group) in Figure 2 (a), and F4-F6 with RON
of 98 (high RON group) in Figure 2 (b). In each group, there are three levels of MON. In the legend, RON and
MON are given for each fuel. For example, ‘F1_RON93/MON88’ means F1 fuel with an RON of 93 and a
MON of 88. In Figure 2 (a), the ITE of F1-F3 (low RON group) was hardly differentiated at the lowest CR of
9.5:1; however, F3 with MON of 79 showed statistically higher ITE than F1 with MON of 88 at the highest
CR of 11.5:1, especially at medium to high engine loads. In Figure 2 (b), the differences in ITE among F4-F6
(high RON group) are smaller than these among F1-F3 (low RON group); nevertheless, at the CR of 11.5:1,
F6 with MON of 83 led to a higher ITE than F4 with MON of 92 at the highest engine load. In both low and
high RON group, the difference between fuels increased with engine load and compression ratio. For the low
12
RON group, the ITE of fuels started to be differentiated at the compression ratio of 10.5:1; whilst for the high
RON group, the ITE of fuels started to be differentiated at the compression ratio of 11.5:1. This is because
overall the high RON group had a higher anti-knock quality than the low RON group. It is excepted that, if
the engine CR were to be increased further from 11.5:1 to 12.5:1, F6 would show a higher ITE than F4.
Overall, in both the low and high RON groups, a trend exists that lower MON resulted in a higher engine
thermal efficiency. This contradicts the notion that high MON is always a positive indicator of fuel’s anti-
knock quality. Many publications agree with the findings from this study [13, 14, 21, 22, 30]. From the
combustion perspective, in-cylinder parameters for the MON test in CFR engines deviate from those in a
modern engine. Additionally, the PRFs used in the CFR engines have an octane sensitivity of zero; whilst the
most market available fuels have a sensitivity of 5-15. PRFs have a stronger negative temperature coefficient
(NTC) behaviour than conventional gasoline. Due to the above reasons, the MON measured in the CFR engine
does not suitably characterise/predict the octane appetite of modern SI engines.
In order to develop a better understanding of the performance of these fuels, key combustion characteristics,
including spark timing, combustion phasing, peak in-cylinder pressure (Pmax) and exhaust gas temperature
are presented. Since the most distinctive differences were observed at the highest CR, only the results from
CR of 11.5:1 are presented.
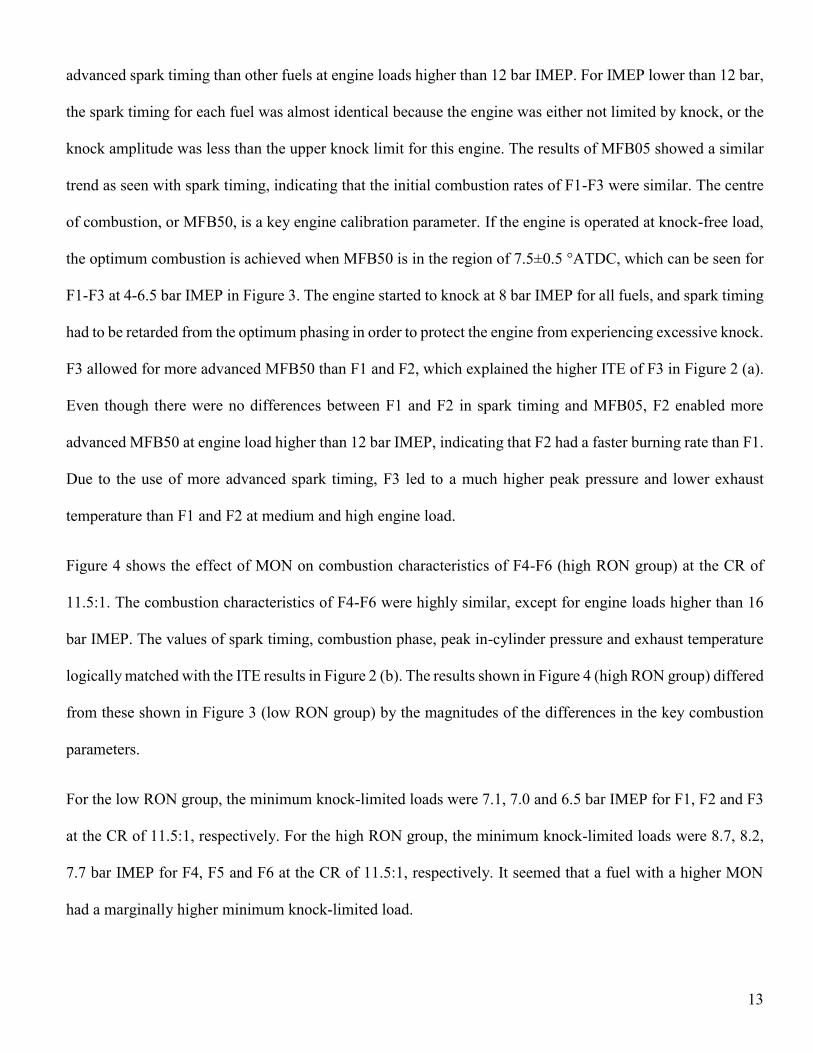
Figure 3 shows the effect of MON on combustion characteristics of F1-F3 (low RON group) at the CR of
11.5:1. The MFB’x’ in Figure 3 stands for the crank angle position where ‘x’ percent of fuel is burned. Overall,
the results in Figure 3 matched with the ITE results showed in Figure 2 (a). Since the spark timing used for
each fuel in this study was KLSA when the engine was operated at knock-limited engine load, spark timing
indirectly reflected the anti-knock quality of the fuels. In a DISI engine, the octane rating and charge cooling
effect influence the engine knock. The charge cooling effect of these fuels in this DISI engine is comparable
due to the similar heat of vaporisation of fuel and the same injection strategy; therefore, the spark timing
differences in Figure 3 is mostly due to anti-knock quality differences. From Figure 3, F3 clearly enabled more
13
advanced spark timing than other fuels at engine loads higher than 12 bar IMEP. For IMEP lower than 12 bar,
the spark timing for each fuel was almost identical because the engine was either not limited by knock, or the
knock amplitude was less than the upper knock limit for this engine. The results of MFB05 showed a similar
trend as seen with spark timing, indicating that the initial combustion rates of F1-F3 were similar. The centre
of combustion, or MFB50, is a key engine calibration parameter. If the engine is operated at knock-free load,
the optimum combustion is achieved when MFB50 is in the region of 7.5±0.5 °ATDC, which can be seen for
F1-F3 at 4-6.5 bar IMEP in Figure 3. The engine started to knock at 8 bar IMEP for all fuels, and spark timing
had to be retarded from the optimum phasing in order to protect the engine from experiencing excessive knock.
F3 allowed for more advanced MFB50 than F1 and F2, which explained the higher ITE of F3 in Figure 2 (a).
Even though there were no differences between F1 and F2 in spark timing and MFB05, F2 enabled more
advanced MFB50 at engine load higher than 12 bar IMEP, indicating that F2 had a faster burning rate than F1.
Due to the use of more advanced spark timing, F3 led to a much higher peak pressure and lower exhaust
temperature than F1 and F2 at medium and high engine load.
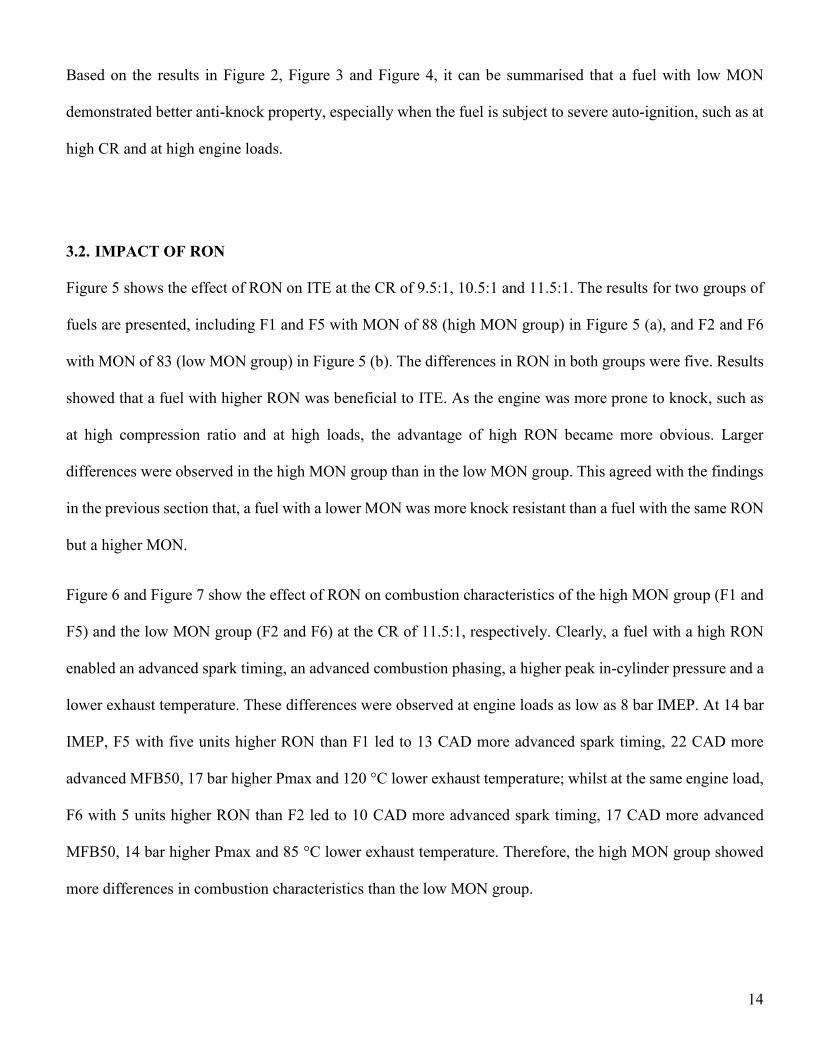
Figure 4 shows the effect of MON on combustion characteristics of F4-F6 (high RON group) at the CR of
11.5:1. The combustion characteristics of F4-F6 were highly similar, except for engine loads higher than 16
bar IMEP. The values of spark timing, combustion phase, peak in-cylinder pressure and exhaust temperature
logically matched with the ITE results in Figure 2 (b). The results shown in Figure 4 (high RON group) differed
from these shown in Figure 3 (low RON group) by the magnitudes of the differences in the key combustion
parameters.
For the low RON group, the minimum knock-limited loads were 7.1, 7.0 and 6.5 bar IMEP for F1, F2 and F3
at the CR of 11.5:1, respectively. For the high RON group, the minimum knock-limited loads were 8.7, 8.2,
7.7 bar IMEP for F4, F5 and F6 at the CR of 11.5:1, respectively. It seemed that a fuel with a higher MON
had a marginally higher minimum knock-limited load.
14
Based on the results in Figure 2, Figure 3 and Figure 4, it can be summarised that a fuel with low MON
demonstrated better anti-knock property, especially when the fuel is subject to severe auto-ignition, such as at
high CR and at high engine loads.
3.2. IMPACT OF RON
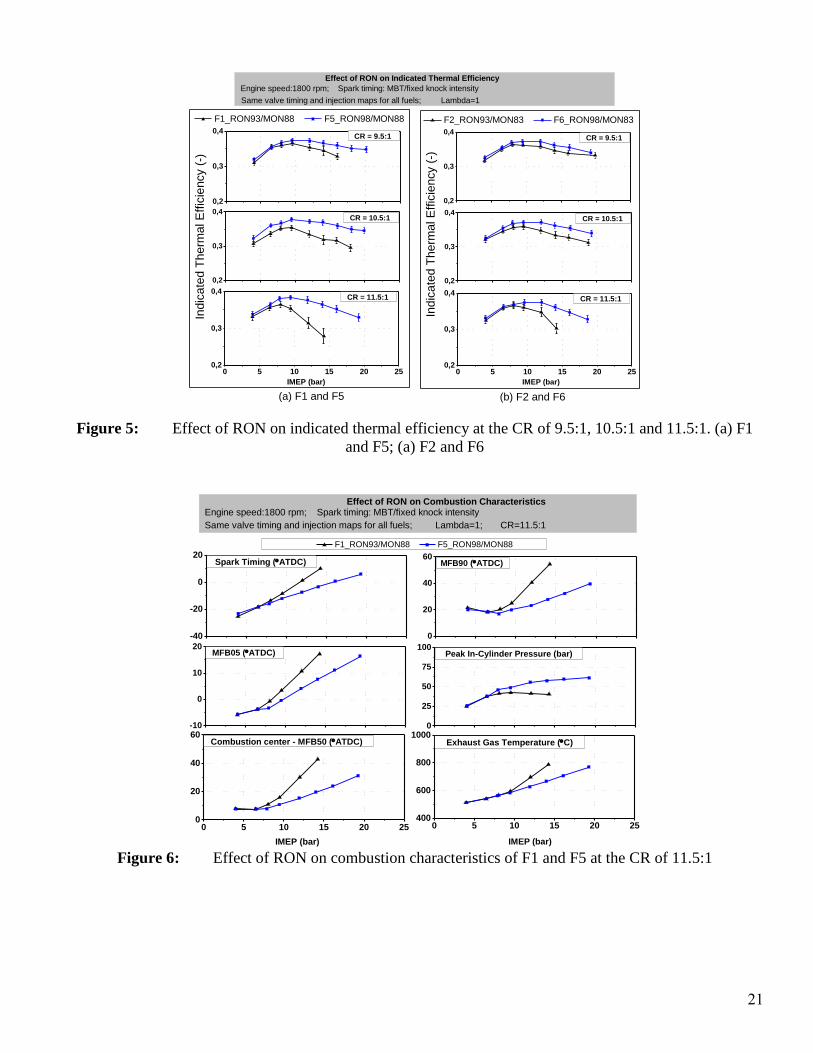
Figure 5 shows the effect of RON on ITE at the CR of 9.5:1, 10.5:1 and 11.5:1. The results for two groups of
fuels are presented, including F1 and F5 with MON of 88 (high MON group) in Figure 5 (a), and F2 and F6
with MON of 83 (low MON group) in Figure 5 (b). The differences in RON in both groups were five. Results
showed that a fuel with higher RON was beneficial to ITE. As the engine was more prone to knock, such as
at high compression ratio and at high loads, the advantage of high RON became more obvious. Larger
differences were observed in the high MON group than in the low MON group. This agreed with the findings
in the previous section that, a fuel with a lower MON was more knock resistant than a fuel with the same RON
but a higher MON.
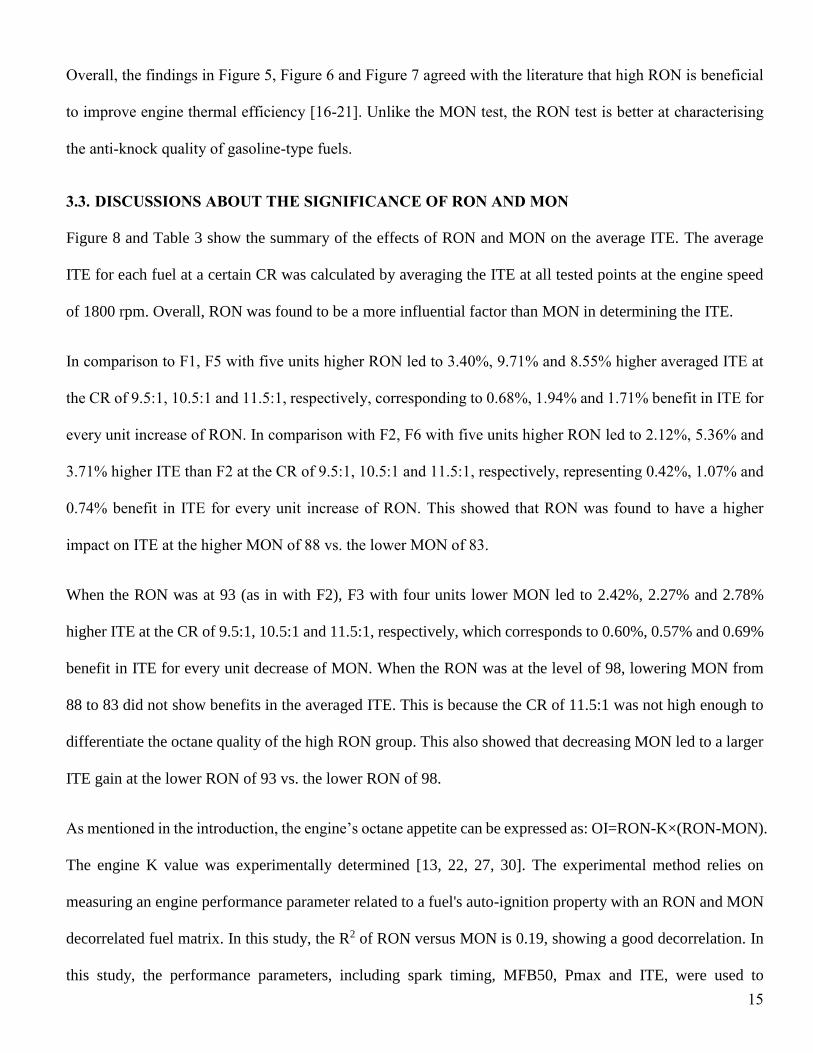
Figure 6 and Figure 7 show the effect of RON on combustion characteristics of the high MON group (F1 and
F5) and the low MON group (F2 and F6) at the CR of 11.5:1, respectively. Clearly, a fuel with a high RON
enabled an advanced spark timing, an advanced combustion phasing, a higher peak in-cylinder pressure and a
lower exhaust temperature. These differences were observed at engine loads as low as 8 bar IMEP. At 14 bar
IMEP, F5 with five units higher RON than F1 led to 13 CAD more advanced spark timing, 22 CAD more
advanced MFB50, 17 bar higher Pmax and 120 °C lower exhaust temperature; whilst at the same engine load,
F6 with 5 units higher RON than F2 led to 10 CAD more advanced spark timing, 17 CAD more advanced
MFB50, 14 bar higher Pmax and 85 °C lower exhaust temperature. Therefore, the high MON group showed
more differences in combustion characteristics than the low MON group.
15
Overall, the findings in Figure 5, Figure 6 and Figure 7 agreed with the literature that high RON is beneficial
to improve engine thermal efficiency [16-21]. Unlike the MON test, the RON test is better at characterising
the anti-knock quality of gasoline-type fuels.
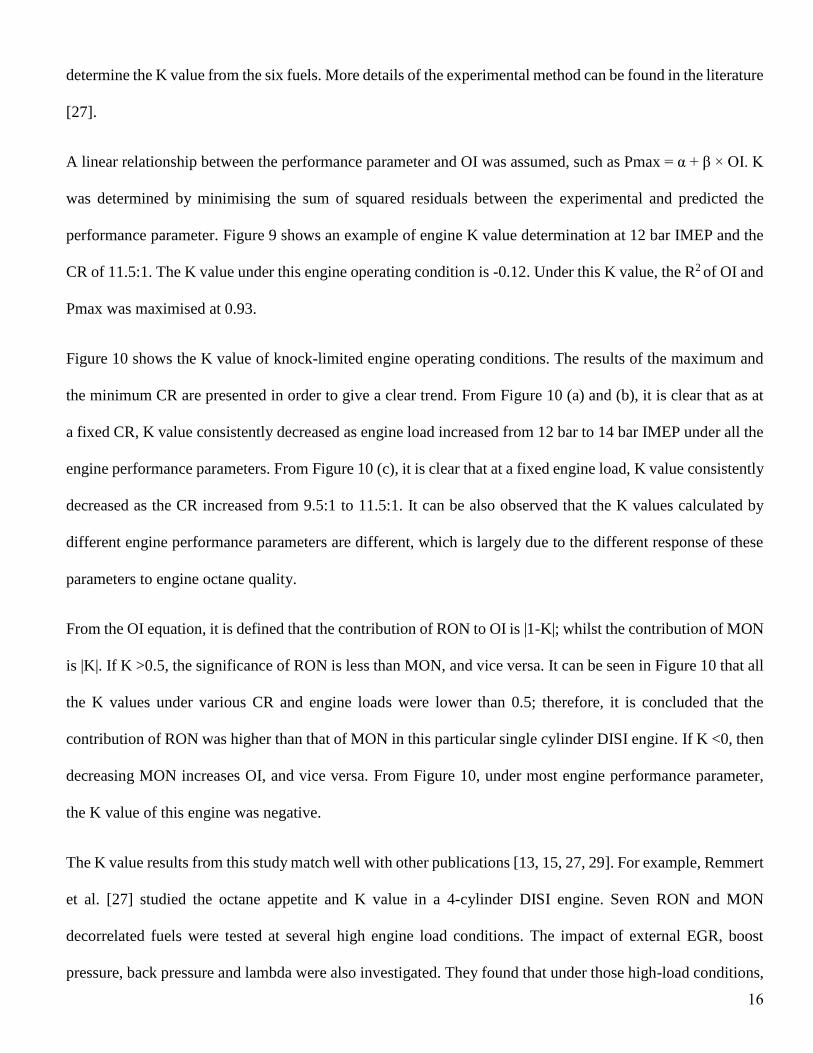
3.3. DISCUSSIONS ABOUT THE SIGNIFICANCE OF RON AND MON
Figure 8 and Table 3 show the summary of the effects of RON and MON on the average ITE. The average
ITE for each fuel at a certain CR was calculated by averaging the ITE at all tested points at the engine speed
of 1800 rpm. Overall, RON was found to be a more influential factor than MON in determining the ITE.
In comparison to F1, F5 with five units higher RON led to 3.40%, 9.71% and 8.55% higher averaged ITE at
the CR of 9.5:1, 10.5:1 and 11.5:1, respectively, corresponding to 0.68%, 1.94% and 1.71% benefit in ITE for
every unit increase of RON. In comparison with F2, F6 with five units higher RON led to 2.12%, 5.36% and
3.71% higher ITE than F2 at the CR of 9.5:1, 10.5:1 and 11.5:1, respectively, representing 0.42%, 1.07% and
0.74% benefit in ITE for every unit increase of RON. This showed that RON was found to have a higher
impact on ITE at the higher MON of 88 vs. the lower MON of 83.
When the RON was at 93 (as in with F2), F3 with four units lower MON led to 2.42%, 2.27% and 2.78%
higher ITE at the CR of 9.5:1, 10.5:1 and 11.5:1, respectively, which corresponds to 0.60%, 0.57% and 0.69%
benefit in ITE for every unit decrease of MON. When the RON was at the level of 98, lowering MON from
88 to 83 did not show benefits in the averaged ITE. This is because the CR of 11.5:1 was not high enough to
differentiate the octane quality of the high RON group. This also showed that decreasing MON led to a larger
ITE gain at the lower RON of 93 vs. the lower RON of 98.
As mentioned in the introduction, the engine’s octane appetite can be expressed as: OI=RON-K×(RON-MON).
The engine K value was experimentally determined [13, 22, 27, 30]. The experimental method relies on
measuring an engine performance parameter related to a fuel's auto-ignition property with an RON and MON
decorrelated fuel matrix. In this study, the R2 of RON versus MON is 0.19, showing a good decorrelation. In
this study, the performance parameters, including spark timing, MFB50, Pmax and ITE, were used to
16
determine the K value from the six fuels. More details of the experimental method can be found in the literature
[27].
A linear relationship between the performance parameter and OI was assumed, such as Pmax = α + β × OI. K
was determined by minimising the sum of squared residuals between the experimental and predicted the
performance parameter. Figure 9 shows an example of engine K value determination at 12 bar IMEP and the
CR of 11.5:1. The K value under this engine operating condition is -0.12. Under this K value, the R2 of OI and
Pmax was maximised at 0.93.
Figure 10 shows the K value of knock-limited engine operating conditions. The results of the maximum and
the minimum CR are presented in order to give a clear trend. From Figure 10 (a) and (b), it is clear that as at
a fixed CR, K value consistently decreased as engine load increased from 12 bar to 14 bar IMEP under all the
engine performance parameters. From Figure 10 (c), it is clear that at a fixed engine load, K value consistently
decreased as the CR increased from 9.5:1 to 11.5:1. It can be also observed that the K values calculated by
different engine performance parameters are different, which is largely due to the different response of these
parameters to engine octane quality.
From the OI equation, it is defined that the contribution of RON to OI is |1-K|; whilst the contribution of MON
is |K|. If K >0.5, the significance of RON is less than MON, and vice versa. It can be seen in Figure 10 that all
the K values under various CR and engine loads were lower than 0.5; therefore, it is concluded that the
contribution of RON was higher than that of MON in this particular single cylinder DISI engine. If K <0, then
decreasing MON increases OI, and vice versa. From Figure 10, under most engine performance parameter,
the K value of this engine was negative.
The K value results from this study match well with other publications [13, 15, 27, 29]. For example, Remmert
et al. [27] studied the octane appetite and K value in a 4-cylinder DISI engine. Seven RON and MON
decorrelated fuels were tested at several high engine load conditions. The impact of external EGR, boost
pressure, back pressure and lambda were also investigated. They found that under those high-load conditions,
17
K values were in the range of -0.26 and -1.14. Davies et al. investigated the K value of several engines under
high boost and EGR conditions and they found that K values were in the range of -0.86 to 0.5 [15]. Kalghatgi
[29] reported that the averaged K value at full throttle conditions was -0.38 for 37 SI engines ranging from
NA to turbo-charged, and 1.2 L small engines to 2.4 L big engines, and the K value varied with engine running
conditions. Kassai et al. [12]studied K value in a Nissan PFI turbocharged engine, and found that K value
became more negative with increased boost pressure and lower engine speeds.
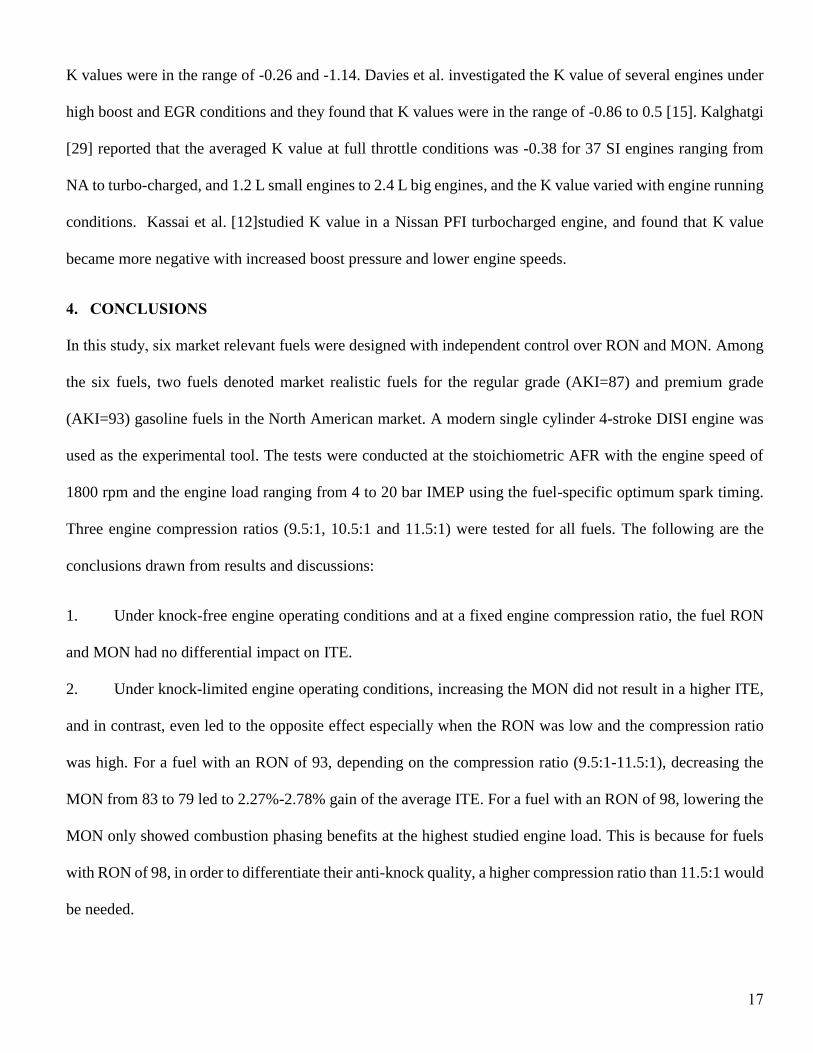
4. CONCLUSIONS
In this study, six market relevant fuels were designed with independent control over RON and MON. Among
the six fuels, two fuels denoted market realistic fuels for the regular grade (AKI=87) and premium grade
(AKI=93) gasoline fuels in the North American market. A modern single cylinder 4-stroke DISI engine was
used as the experimental tool. The tests were conducted at the stoichiometric AFR with the engine speed of
1800 rpm and the engine load ranging from 4 to 20 bar IMEP using the fuel-specific optimum spark timing.
Three engine compression ratios (9.5:1, 10.5:1 and 11.5:1) were tested for all fuels. The following are the
conclusions drawn from results and discussions:
1. Under knock-free engine operating conditions and at a fixed engine compression ratio, the fuel RON
and MON had no differential impact on ITE.
2. Under knock-limited engine operating conditions, increasing the MON did not result in a higher ITE,
and in contrast, even led to the opposite effect especially when the RON was low and the compression ratio
was high. For a fuel with an RON of 93, depending on the compression ratio (9.5:1-11.5:1), decreasing the
MON from 83 to 79 led to 2.27%-2.78% gain of the average ITE. For a fuel with an RON of 98, lowering the
MON only showed combustion phasing benefits at the highest studied engine load. This is because for fuels
with RON of 98, in order to differentiate their anti-knock quality, a higher compression ratio than 11.5:1 would
be needed.

18
3. Under knock-limited engine operating conditions, increasing the RON was beneficial to the ITE by
enabling more advanced spark timing and better combustion phasing. For a fuel with a MON of 88, depending
on the compression ratio (9.5:1-11.5:1), increasing the RON from 93 to 98 led to approximately 3.40%-9.71%
gain in the average ITE; whilst for a fuel with a MON of 83, increasing the RON from 93 to 98 led to
approximately 2.12%-3.71% gain. Therefore, RON was found to have a higher impact on ITE at the higher
MON of 88 vs. the lower MON of 83.
4. RON exhibited a first order influence on the octane quality of gasoline fuels, and MON exhibited a
secondary influence. This is supported by the results that the calculated K value of this engine was less than
0.5 under knock-limited operating condition.
5. Engine K value decreased with the increasing of engine load and CR under all the engine performance
parameters selected in this study, including spark timing, MFB50, Pmax and ITE. Under the most engine
performance parameters at knock-limited operating conditions, the K value of this engine was negative,
indicating that a low MON fuel was beneficial.
Future work: The engine K value is dependent on the thermodynamic (temperature and pressure) history of
the unburnt end gas; therefore, the K value is engine hardware and operating condition related. More K value
studies on various SI engines with different hardware architectures and engine operating conditions are needed
in order to draw further conclusions.
Acknowledgement
This work was conducted at the Shell Technology Centre Hamburg. Dr. Chongming Wang was financially
supported by the European Commission through the Marie Curie Program (PIAP-GA-2013-610897
GENFUEL). Authors would like to thank Jakob Beutelspacher and Jan-Henrik Gross for their support in fuel
blending and engine testing.
19
Figures
Figure 1: Engine setup
Figure 2: Effect of MON on indicated thermal efficiency at the CR of 9.5:1, 10.5:1 and 11.5:1. (a) F1,
F2 and F3; (a) F4, F5 and F6
Crankcase
Exhaust
VVT
Intake
VVT
Intake
Filter
Air
Air
Conditioning
Unit
Exhaust
extraction system
Exhaust back
pressure
regulator
Throttle
Air flow
Meter
Air boost
system
EGR
valve
CompressorEGR
cooling
EGR
cooling
T, P
T, P
T
T, P
Exhaust gas
sampling point
T
P
T, P, λ P
Intake
Plenum
Chamber
Simens
CATS
AVL
Indicom
FI2RE
Exhaust
Plenum
Chamber
0,2
0,3
0,4CR = 9.5:1
0,2
0,3
0,4CR = 10.5:1
Indic
ate
d T
herm
al E
ffic
iency (
-)
F1_RON93/MON88 F2_RON93/MON83
F3_RON93/MON79
Indic
ate
d T
herm
al E
ffic
iency (
-)
0,2
0,3
0,4
(b) F4, F5 and F6(a) F1, F2 and F3
CR = 9.5:1
F4_RON98/MON92 F5_RON98/MON88
F6_RON98/MON83
0,2
0,3
0,4CR = 10.5:1
0 5 10 15 20 250,2
0,3
0,4CR = 11.5:1
Engine speed:1800 rpm; Spark timing: MBT/fixed knock intensityEffect of MON on Indicated Thermal Efficiency
Same valve timing and injection maps for all fuels; Lambda=1
IMEP (bar)
0 5 10 15 20 250,2
0,3
0,4CR = 11.5:1
IMEP (bar)

20
Figure 3: Effect of MON on combustion characteristics of F1, F2 and F3 (low RON group) at the CR of
11.5:1
Figure 4: Effect of MON on combustion characteristics of F4, F5 and F6 (high RON group) at the CR
of 11.5:1
-40
-20
0
20Spark Timing (ATDC)
-10
0
10
20
30MFB05 (ATDC)
0
20
40
60
F1_RON93/MON88 F2_RON93/MON83 F3_RON93/MON79
MFB90 (ATDC)
20
40
60
Peak In-Cylinder Pressure (bar)
0 5 10 15 20 25400
600
800
1000
Engine speed:1800 rpm; Spark timing: MBT/fixed knock intensity
Effect of MON on Combustion Characteristics
Same valve timing and injection maps for all fuels; Lambda=1; CR=11.5:1
Exhaust Gas Temperature (C)
IMEP (bar)
0 5 10 15 20 250
20
40
60Combustion center - MFB50 (ATDC)
IMEP (bar)
-40
-20
0
20Spark Timing (ATDC)
-10
0
10
20
30MFB05 (ATDC)
10
20
30
40
50
F4_RON98/MON92 F5_RON98/MON88 F6_RON98/MON83
MFB90 (ATDC)
20
40
60
80
Peak In-Cylinder Pressure (bar)
0 5 10 15 20 25400
600
800
1000
Engine speed:1800 rpm; Spark timing: MBT/fixed knock intensity
Effect of MON on Combustion Characteristics
Same valve timing and injection maps for all fuels; Lambda=1; CR=11.5:1
Exhaust Gas Temperature (C)
IMEP (bar)
0 5 10 15 20 250
20
40
60Combustion center - MFB50 (ATDC)
IMEP (bar)
21
Figure 5: Effect of RON on indicated thermal efficiency at the CR of 9.5:1, 10.5:1 and 11.5:1. (a) F1
and F5; (a) F2 and F6
Figure 6: Effect of RON on combustion characteristics of F1 and F5 at the CR of 11.5:1
0,2
0,3
0,4CR = 9.5:1
0,2
0,3
0,4CR = 10.5:1
Indic
ate
d T
herm
al E
ffic
iency (
-)
F1_RON93/MON88 F5_RON98/MON88
Indic
ate
d T
herm
al E
ffic
iency (
-)0,2
0,3
0,4CR = 9.5:1
F2_RON93/MON83 F6_RON98/MON83
(a) F1 and F5
0,2
0,3
0,4CR = 10.5:1
0 5 10 15 20 250,2
0,3
0,4
(b) F2 and F6
CR = 11.5:1
Engine speed:1800 rpm; Spark timing: MBT/fixed knock intensity
Effect of RON on Indicated Thermal Efficiency
Same valve timing and injection maps for all fuels; Lambda=1
IMEP (bar)
0 5 10 15 20 250,2
0,3
0,4CR = 11.5:1
IMEP (bar)
-40
-20
0
20Spark Timing (ATDC)
F1_RON93/MON88 F5_RON98/MON88
-10
0
10
20MFB05 (ATDC)
0
20
40
60
MFB90 (ATDC)
0
25
50
75
100
Peak In-Cylinder Pressure (bar)
0 5 10 15 20 25400
600
800
1000
Engine speed:1800 rpm; Spark timing: MBT/fixed knock intensityEffect of RON on Combustion Characteristics
Same valve timing and injection maps for all fuels; Lambda=1; CR=11.5:1
Exhaust Gas Temperature (C)
IMEP (bar)
0 5 10 15 20 250
20
40
60Combustion center - MFB50 (ATDC)
IMEP (bar)

22
Figure 7: Effect of RON on combustion characteristics of F2 and F6 at the CR of 11.5:1
Figure 8: Summary of the effect of RON and MON on the averaged ITE at the CR of 9.5:1, 10.5:1 and
11.5:1
-40
-20
0
20Spark Timing (ATDC)
F2_RON93/MON83 F6_RON98/MON83
-10
0
10
20MFB05 (ATDC)
0
20
40
60
MFB90 (ATDC)
0
25
50
75
100
Peak In-Cylinder Pressure (bar)
0 5 10 15 20 25400
600
800
1000
Engine speed:1800 rpm; Spark timing: MBT/fixed knock intensityEffect of RON on Combustion Characteristics
Same valve timing and injection maps for all fuels; Lambda=1; CR=11.5:1
Exhaust Gas Temperature (C)
IMEP (bar)
0 5 10 15 20 250
20
40
60Combustion center - MFB50 (ATDC)
IMEP (bar)
F1 F5 F2 F60,32
0,34
0,36
0,38Averaged ITE (-)
RON
CR
=1
1.5
:1C
R=
9.5
:1
RON
F1 F5 F2 F60,32
0,34
0,36
0,38 Averaged ITE (-)
F1 F5 F2 F60,32
0,34
0,36
0,38
MON
MONR
ON
RO
N
R
ON
R
ON
MON
CR
=1
0.5
:1
Low RONHigh RONLow MONHigh MON
Averaged ITE (-)
F4 F5 F6 F1 F2 F30,32
0,34
0,36
0,38Averaged ITE (-)
MONRON
F4 F5 F6 F1 F2 F30,32
0,34
0,36
0,38 Averaged ITE (-)
F4 F5 F6 F1 F2 F30,32
0,34
0,36
0,38 Averaged ITE (-)

23
Figure 9: Octane Index versus Pmax (an example of engine K value determination @ 12 bar IMEP
under CR 11.5:1)
Figure 10: K value calculated by various engine performance parameters: (a) effect of engine load at the
CR of 11.5:1; (b) effect of engine load at the CR of 9.5:1; (c) effect of compression ratio (R2 for the linear
fits shown in the figure)
92 94 96 98 100 102
40
45
50
55
60
OI=RON- (-0.12)* (RON-MON)
k=-0.12
Experimental Pmax
Predicted PmaxP
ma
x (
ba
r)
Octane Index (OI)
Pmax=1.7424* OI -118.67
R2=0,93
-0,6
-0,4
-0,2
0,0
0,2
R2=0.89
R2=0.93
R2=0.86
R2=0.88R
2=0.85
R2=0.91
R2=0.81
R2=0.80
K v
alu
e
CR=11.5:1 IMEP=12 bar CR=11.5:1 IMEP=14 bar
Effect of engine load(a)
-0,6
-0,4
-0,2
0,0
0,2
R2=0.94
R2=0.98
R2=0.96
R2=0.96R
2=0.96
R2=0.97
R2=0.90
R2=0.86
(b) Effect of engine load
K v
alu
e
CR=9.5:1 IMEP=14 bar CR=9.5:1 IMEP=16 bar
ITE Spark timing MFB50 Pmax-0,6
-0,4
-0,2
0,0
0,2
R2=0.89
R2=0.98
R2=0.86
R2=0.96
R2=0.85
R2=0.97
R2=0.81
R2=0.86
(c) Effect of compression ratio
K v
alu
e
CR=9.5:1 IMEP=14 bar CR=11.5:1 IMEP=14 bar

24
Tables
Table 1: Fuel properties
F1 F2 F3 F4 F5 F6
RON - 93 93 93 98 98 98
MON - 88 83 79 92 88 83
Octane sensitivity - 5 10 14 6 10 15
Anti-knock index - 90.5 88 86 95 93 90.5
HOV kJ/kg 403 423 424 395 424 444
Oxygen content wt .% 3.92 4.1 3.3 4.0 4.5 3.5
Lower heating
value
MJ/kg 42.6 41.5 42.2 43.0 41.6 42.0
MJ/L 30.6 30.8 30.8 30.1 30.3 31.4
Stoichiometric AFR - 14.0 13.7 13.9 14.2 13.7 13.8
Density kg/m3 718.0 742.0 731.1 698.6 730.0 749.0
Table 2: Summary of engine operating conditions*
Speed IMEP
Intake valve
open/close timing @
1mm valve lift
Exhaust valve
open/close timing
@ 1mm valve lift
Injection timing
Injection
duration split
ratio
Estimated
absolute
intake
manifold
pressure**
rpm bar °ATDC °ATDC °ATDC bar
1800 4 -12.2/179.2 -204.4/7.0 -280 - ≈0.60
1800 6.5 -12.2/179.2 -204.4/7.0 -280; -240 1:1 ≈0.75
1800 8 -12.2/179.2 -204.4/7.0 -280; -240 1:1 ≈0.86
1800 9.5 -12.2/179.2 -204.4/7.0 -280; -240 1:1 ≈0.96
1800 12 -2.2/189.2 -214.3/-3.0 -280; -240; -200 1:1:1 ≈1.20
1800 14 -2.2/189.2 -214.3/-3.0 -280; -240; -200 1:1:1 ≈1.48
1800 16 12.8/204.1 -214.3/-3.0 -280; -240; -200 1:1:1 ≈1.64
1800 18 17.8/209.1 -214.3/-3.0 -280; -240; -200 1:1:1 ≈1.80
1800 20 17.8/209.1 -214.3/-3.0 -325; -285; -245; -205 1:1:1:1 ≈2.10
* To avoid a scavenging flow of air, the back pressure was set to be the same as the intake manifold pressure in case
that intake air boosting was needed. Intake air temperature was conditioned at 34°C by an air-handling device.
** The actual intake manifold pressure required for achieving a target IMEP would depend on the fuel and the engine
compression ratio.
Table 3: Averaged ITE benefit under various CR at the 1800 rpm engine speed
Averaged ITE benefit (%)
Fuel 2 as base fuel Fuel 5 as base fuel
F2 vs. F1 F2 vs. F3 F2 vs. F5 F2 vs. F6 F5 vs. F4 F5 vs. F6
CR=9.5:1 -0.44 2.42 2.94 2.12 0.12 -0.79
CR=10.5:1 -3.54 2.27 5.82 5.36 -0.81 -0.43
CR=11.5:1 -2.99 2.78 3.70 3.71 -2.16 -1.52
25
Appendix
Figure 1A: Sample of in-cylinder pressure trace and corresponding MFB profiles calculated from various γ
(Engine speed= 1800 rpm; IMEP=9.5 bar)
-20 0 20 40 60
0
20
40
60
80
100
In-c
ylin
de
r P
res
su
re (
ba
r)
Crank Angle Position
-0.4
-0.2
0.0
0.2
0.4
0.6
0.8
1.0
= 1.3 = 1.28 = 1.26 = 1.24
= 1.28 and 1.23 (estimated from polytropic exponents for compression and expansion)
MF
B
26
Reference
[1] T. Johnson, Vehicular Emissions in Review, SAE Int. J. Engines, 9 (2016) 1258-1275.
[2] US Department of Energy, Quadrennial Technology Review 2015 - Chapter 8: Advancing Clean
Transportation and Vehicle Systems and Technologies,
http://energy.gov/sites/prod/files/2015/11/f27/QTR2015-8C-Internal-Combustion-Engines.pdf, (2015).
[3] H. Xu, C. Wang, X. Ma, A.K. Sarangi, A. Weall, J. Krueger-Venus, Fuel injector deposits in direct-
injection spark-ignition engines, Progress in Energy and Combustion Science, 50 (2015) 63-80.
[4] C. Wang, R. Daniel, X. Ma, Comparison of Gasoline (ULG), 2, 5-Dimethylfuran (DMF) and Bio-Ethanol
in a DISI Miller Cycle with Late Inlet Valve Closing Time, in, SAE Technical Paper 2012-01-1147; 2012.
[5] C.M. Wang, H.M. Xu, J.M. Herreros, T. Lattimore, S.J. Shuai, Fuel Effect on Particulate Matter
Composition and Soot Oxidation in a Direct-Injection Spark Ignition (DISI) Engine, Energy & Fuels, 28
(2014) 2003-2012.
[6] C. Wang, H. Xu, T. Lattimore, Impacts of Low-Level 2-Methylfuran Content in Gasoline on DISI Engine
Combustion Behavior and Emissions, SAE Technical Paper 2013-01-1317; 2013.
[7] W.R. Leppard, The chemical origin of fuel octane sensitivity, SAE Technical Paper 902137; 1990.
[8] H. Dickinson, The Cooperative Fuel Research and Its Results, SAE Technical Paper 310019; 1929.
[9] H. Horning, The Cooperative Fuel-Research Committee Engine, SAE Technical Paper 310019; 1931.
[10] A. International, Standard test method for research octane number of spark-ignition engine fuel, ASTM
D2699-08 (2008).
[11] A. International, Standard Test Method for Motor Octane Number of Spark-Ignition Engine Fuel, ASTM
D2700-08 (2008).
[12] G. Kalghatgi, Fuel anti-knock quality-Part I: Engine studies, SAE Technical Paper 2001-01-3584. 2001.
[13] A. Prakash, R. Cracknell, V. Natarajan, D. Doyle, A. Jones, Y.S. Jo, M. Hinojosa, P. Lobato,
Understanding the Octane Appetite of Modern Vehicles, SAE Int. J. Fuels Lubr., 9 (2016) 345-357.
[14] CRC, Fuel Antiknock Quality - Engine Response to RON versus MON, Coordinating Research Council
Report No. 660, (2011).
[15] T.J. Davies, R.F. Cracknell, B. Head, K. Hobbs, T. Riley, A new method to simulate the octane appetite
of any spark ignition engine, SAE Technical Paper 2011-01-1873; 2011.
[16] S. Binjuwair, T.I. Mohamad, A. Almaleki, A. Alkudsi, I. Alshunaifi, The effects of research octane
number and fuel systems on the performance and emissions of a spark ignition engine: A study on Saudi
Arabian RON91 and RON95 with port injection and direct injection systems, Fuel, 158 (2015) 351-360.
[17] R. Daniel, H. Xu, C. Wang, D. Richardson, S. Shuai, Combustion performance of 2,5-dimethylfuran
blends using dual-injection compared to direct-injection in a SI engine, Applied Energy, 98 (2012) 59-68.
[18] C.M. Wang, H.M. Xu, R. Daniel, A. Ghafourian, J.M. Herreros, S.J. Shuai, X. Ma, Combustion
characteristics and emissions of 2-methylfuran compared to 2,5-dimethylfuran, gasoline and ethanol in a DISI
engine, Fuel, 103 (2013) 200-211.
[19] K. Nakata, D. Uchida, A. Ota, S. Utsumi, K. Kawatake, The impact of RON on SI engine thermal
efficiency, SAE Technical Paper 2007-01-2007; 2007.
[20] Y. Duchaussoy, P. Barbier, P. Schmelzle, Impact of gasoline RON and MON on a turbocharged MPI SI
engine performances, SAE Transactions, 113 (2004) 1446-1453.
[21] V. Mittal, J.B. Heywood, The shift in relevance of fuel RON and MON to knock onset in modern SI
engines over the last 70 years, SAE International Journal of Engines, 2 (2009) 1-10.
[22] G.T. Kalghatgi, K. Nakata, K. Mogi, Octane appetite studies in direct injection spark ignition (DISI)
engines, SAE Technical Paper 2005-01-0244; 2005.
[23] T. Davies, R. Cracknell, G. Lovett, L. Cruff, J. Fowler, Fuel effects in a boosted DISI engine, SAE
Technical Paper 2011-01-1985; 2011.
[24] P. Risberg, G. Kalghatgi, H.-E. Ångstrom, Auto-ignition quality of gasoline-like fuels in HCCI engines,
SAE Technical Paper 2003-01-3215; 2003.
27
[25] G. Kalghatgi, Fuel/Engine Interactions, SAE International, 2014.
[26] G.T. Kalghatgi, Fuel anti-knock quality-Part II: Vehicle Studies-how relevant is Motor Octane Number
(MON) in modern engines, SAE Technical Paper 2001-01-3585; 2001.
[27] S. Remmert, S. Campbell, R. Cracknell, A. Schuetze, A. Lewis, K. Giles, S. Akehurst, J. Turner, A.
Popplewell, R. Patel, Octane Appetite: The Relevance of a Lower Limit to the MON Specification in a
Downsized, Highly Boosted DISI Engine, SAE International Journal of Fuels and Lubricants, 7 (2014) 743-
755.
[28] G.T. Kalghatgi, R. Head, The available and required autoignition quality of gasoline-like fuels in HCCI
engines at high temperatures, SAE Technical Paper 2004-01-1969, 2004
[29] G.T. Kalghatgi, Auto-ignition quality of practical fuels and implications for fuel requirements of future
SI and HCCI engines, SAE paper 2005-01-0239. 2005.
[30] C.N. Orlebar, A. Joedicke, W. Studzinski, The effects of octane, sensitivity and K on the performance
and fuel economy of a direct injection spark ignition vehicle, SAE Technical Paper 2014-01-1216; 2014.
[31] V. Mittal, J.B. Heywood, The Relevance of Fuel RON and MON to Knock Onset in Modern SI Engines,
SAE International 2008-01-2414; 2008.
[32] J.B. Heywood, Internal combustion engine fundamentals, McGraw-Hill: New York, 1989.
[33] F. Zhang, S. Zeraati Rezaei, H. Xu, S.-J. Shuai, Experimental Investigation of Different Blends of Diesel
and Gasoline (Dieseline) in a CI Engine, SAE International 2014-01-2686; 2014.
[34] M. Dalla Nora, H. Zhao, High load performance and combustion analysis of a four-valve direct injection
gasoline engine running in the two-stroke cycle, Applied Energy, 159 (2015) 117-131.