significant achievement in the last 5 years achivements.pdf · significant achievement in the last...
TRANSCRIPT
Significant achievement in the last 5 years
Management advisories for sustaining marine fisheries of Karnataka and Goa
Marine fisheries policy for Karnataka prepared with advisories on optimum fleetsize to sustainably harvest the marine fisheries resources of Karnataka
The marine fish production in Karnataka has increased by several folds from 1,89,000 t in 1986 to 4,75,000 t in 2012. In addition, the sector has generated employment to several people. As per the Marine Fisheries Census (2010), 1,67,429 people are dependent directly or indirectly on fishing activities. The sector also generates revenue for the State through domestic and international marketing. Mechanization and modernization of crafts and gears has enabled the fishers to expand their fishing area from within the territorial waters to beyond 12 nautical miles and exploit resources available therein.
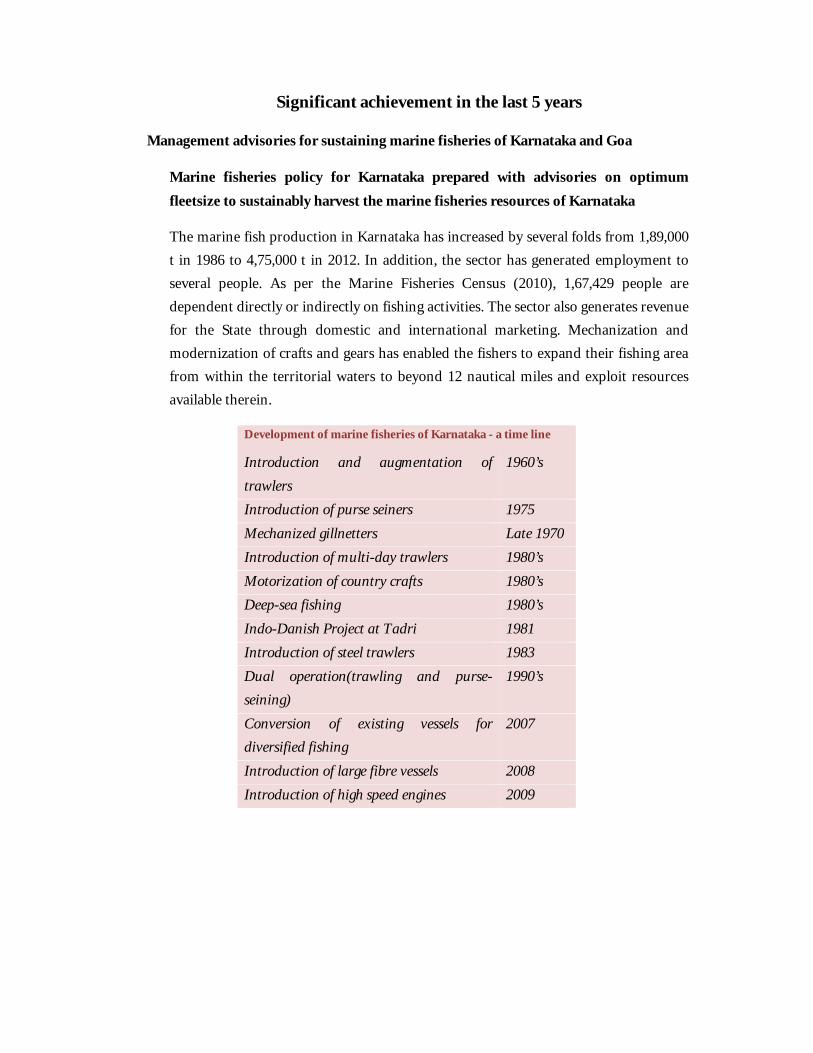
Development of marine fisheries of Karnataka - a time line
Introduction and augmentation of trawlers
1960’s
Introduction of purse seiners 1975Mechanized gillnetters Late 1970Introduction of multi-day trawlers 1980’sMotorization of country crafts 1980’sDeep-sea fishing 1980’sIndo-Danish Project at Tadri 1981Introduction of steel trawlers 1983Dual operation(trawling and purse-seining)
1990’s
Conversion of existing vessels for diversified fishing
2007
Introduction of large fibre vessels 2008Introduction of high speed engines 2009
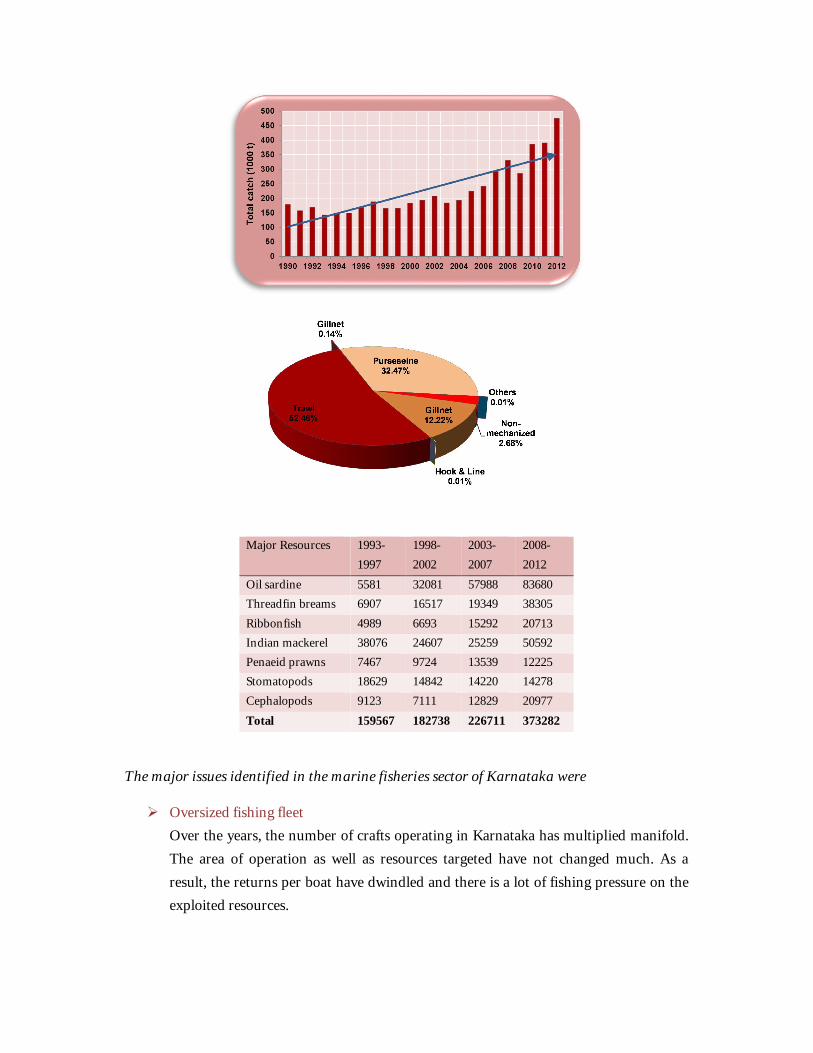
Major Resources 1993-1997
1998-2002
2003-2007
2008-2012
Oil sardine 5581 32081 57988 83680Threadfin breams 6907 16517 19349 38305Ribbonfish 4989 6693 15292 20713Indian mackerel 38076 24607 25259 50592Penaeid prawns 7467 9724 13539 12225Stomatopods 18629 14842 14220 14278Cephalopods 9123 7111 12829 20977
Total 159567 182738 226711 373282
The major issues identified in the marine fisheries sector of Karnataka were
Oversized fishing fleetOver the years, the number of crafts operating in Karnataka has multiplied manifold. The area of operation as well as resources targeted have not changed much. As a result, the returns per boat have dwindled and there is a lot of fishing pressure on the exploited resources.
OvercapitalizationThe steep increase in the cost of vessel construction, net materials, diesel prices, ice, labour, overhead charges for post-harvesting, etc., has made the fishing activity expensive. It has resulted in unhealthy competitions among the boat owners resulting in intensified targeted fishing operations using larger vessels with higher fish hold capacity, high speed engines and modern fish finding devices.
Destructive fishing methodsSeveral innovative methods such as FADs, use of small meshed gears, high opening trawl nets and illegal methods practiced is causing harm to juveniles and adults of some commercially important species. This is a cause of concern for the sustainability of these resources.
Increased landings of trash/ discardsCompetition among fishermen has resulted in extensive use of small-sized meshes (<20 mm) in cod-end of trawls in order to maximize the harvest from fishing grounds. This has led to the capture of young and undersized fishes. Large-scale destruction of young/ juveniles of commercially important fishes will result in growth overfishing and affect their stocks during the following seasons
Weak vessel-based fishing databaseMarine capture fisheries research requires data on a continual basis from different regions, seasons and depths on catch, effort and cost of fishing and fish population characteristics of discarded and landed catch to estimate optimum yields. Though it has been repeatedly impressed upon the fishing boat owners and the implementing agencies on the need for furnishing fishing logs by all vessels, very little headway has been made in this direction due to the lack of appreciation for such data.
Decline in fish stocksIndiscriminate targeted exploitation of some resources (eg. catfish brooders by purse seiners, juvenile fish exploitation by shrimp oriented trawling practices including bull-trawling in the post-monsoon months and mattabale operation practiced during the monsoon months) has resulted in over-exploitation of certain stocks, poor recruitment and growth over-fishing. The emergence of some unconventional gears in conjunction with increased effort (units and fishing hours) and reduced mesh size at the bunt/ cod end has further aggravated the problems of both growth overfishing and recruitment overfishing
Impact of climate change Climate change has a direct impact on the marine fishery of the region. The frequent occurrence of cyclones and storms has resulted in regime shifts and change in species composition and disappearance of certain species from its natural habitats.
Impact of anthropogenic activitiesChanges brought about in the environment due to anthropogenic activities other than fishing (sewage discharge, industrial effluents, oil spills etc.) also have an impact on the fishery of the region.
Quality controlThere is great demand for marine products caught from this region in the export market. However, unless strict quality measures are adhered to, the products are rejected leading to great monetary loss to the sector. Though certain measures are in practice, there is need for better handling and preservation of the catch onboard so as to fetch better returns to the fisheries sector.
Marketing infrastructureMarketing of fishes is generally at the landing centre. Though some societies and Karnataka Fisheries Federation are involved in the marketing of certain export quality fishes there is need to improve the system. Lack of sufficient cold stores at the landing centre and effective marketing systems like cold chains is affecting the sales and value of the high quality fishes landed.
Lack of support prices Fishery products are highly perishable and whenever there is a good catch, the middlemen involved in marketing generally control the price. Support prices that exist for major resources as in agriculture products should be extended to fishery products to reduce exploitation of primary stakeholders by middlemen and enable the fishers to get their due.
Lack of guidelines for mariculture activitiesFarming of marine organisms has made a good beginning in the open-sea and inshore coastal waters. Though this is the best way to supplement marine fish production to meet the increasing demand for seafood, setting up of large-scale marine farms/ enclosures will result in conflicts among fishermen and fish farmers. Absence of a legally viable licensing system and water leasing may lead to conflicts among different stakeholders.
Recommendations
The optimum fleet size was estimated following the methodology suggested by Sathianandan et al. (2008). Data for a period of three years (2010-2012) were used for this analysis. The annual catchable potential off Karnataka is 4.25 lakh t (Anon, 1991). Based on this potential, the current yield and actual registered fishing fleet along Karnataka Coast (Dept. of Fisheries, Karnataka, 2012), the optimum fleet size estimated

Strict registration and licensing system for fishing vessels.
Fishing effort reduction can be made by fixing fishing quota for existing vessels, by phasing out old units and also by increasing the duration of closed season for different categories.
The speed-length ratio (OAL and engine capacity) of the vessel should be specified. This will help in stopping overcapitalization, unhealthy competition and social issues arising from it.
Cod end mesh size of trawl nets should be a minimum of 35 mm. Manufacture of net panes below this mesh size for cod end of trawl net should be banned at the manufacturer’s level. Special incentives can be provided to fishermen adopting minimum mesh size suggested.
For gillnet the mesh size should be specified so as to avoid juvenile and spawner exploitation.
Keep Minimum Legal Size (MLS) for each species for domestic sale and export. Minimum size at maturity (MSM) can be taken as criteria.
Make the ‘logbook’ compulsory for all fishing units. Diversify the fishing activity so as to capture commercially important fishes from
deeper waters and also utilize unconventional resources. Participatory management and conservation of over-exploited as well as juveniles
of commercially important resources. Awareness program to avoid destructive fishing for juveniles and to avoid
discards. Empower fishery officials to check any vessel which is suspected to violate rules
and take legal actions. Establish cold chains and improve marketing infrastructure. Fix minimum
support price for major fish resources Though considerable information on the hydrography, plankton and upwelling is
available for the coastal waters, attempts to link these characteristics to actual fish abundance in space and time has to be made.
Marine fishery forecast on real time basis-studies on the seasonal/ periodic/ cyclic changes and/or the special phenomena occurring in the marine environment must be strengthened so as to propose measures to manage the exploited fishery.
Fish farmers/ mariculturists to be provided with license to take up marine farming activities at identified sites to avoid conflicts.
Promotion of capture based aquaculture in floating cages, pens and rafts. Formulation of a coastal water use policy.

The annual marine fish landings in Goa registered a positive trend since 1990 in spite of annual fluctualtion. The lowest catch was recorded during 1995 (3138t) and highest during 1993 (1,21,998 t) with an annual average of 73,324 t (1990-2009) (Fig.1). As in Karnataka, mechanization, motorization, innovation in crafts and gears, expansion of fishing grounds, and an overall improvement in marketing and processing of the exploited fishery resources has contributed to this general increased fish production over the years.
The major issues identified were similar to that observed in the marine fisheries of Karnataka.
Management options suggested are:
Strict registration and licensing system for fishing vessels. 2. 13% reduction of multi-day fishing trawlers from 2006 level. 3. 19% reduction of purse seiners from 2006 level. Unit reduction can be made by fixing fishing quota for existing vessels, by
phasing out old units and also by increasing closed season for different category.
The upper limit of length and capacity of the vessel should be specified and maximum period for which the vessel can be away from the shore also has to be limited. This will help in stopping overcapitalization, unhealthy competition and social issues arising from it.
Cod end mesh size of trawlers should be more than 35 mm. Encourage use of only large meshed nets by giving special incentives to fishermen adopting such management practices.
For gillnet the mesh size should be specified so as to avoid juvenile exploitation.
Keep minimum legal size for each species for domestic sale and export. MSM can be taken as criteria.

Diversify fishing activity so as to capture commercially important fishes from deeper waters and also utilize unconventional resources.
Participatory management and conservation of over-exploited as well as juvenile of commercially important resources.
Awareness program to avoid destructive fishing juvenile fishery and to avoid discards.
Make the ‘logbook’ compulsory for multi-day trawlers. Empower the fishery officials and fishery scientist to check any vessel
which is suspected as violated rules and take legal actions against the violators as per the report of the fishery officials and fishery scientists.
Establish cold chains and improve marketing infrastructure Fix minimum support price for major fish resources Though considerable information on the hydrography, plankton and upwelling is
available for the coastal waters, attempts to link these characteristics to actual fish abundance in space and time to be made.
Fishfarmers/mariculturist to be provided with license to take up marine farming activities at identified sites to avoid conflicts.
Promotion of capture based aquaculture in floating cages, pens and rafts. Formulation of a coastal water use policy.
Actions initiated:
In-situ data collection from selected crafts/gears types registered at Dakshina Kannada and Udupi districts was continued. Log sheets prepared in local languages, were given to boat crew to get continuous data. Fortnightly georeferenced samples (fish and water samples) collected were analysed for species diversity their habitats and seasonal trends.

Stock classification of major exploited species along Karnataka coast was studied for period 1990 to 2013.Of the twenty pelagic species analysed, 9 were abundant (A) one species was less abundant (LA), 8 species were declining (D), two species were depleted (DE). Amond the 15 demersal species analysed, 6 were abundant, 5 less abundant, two declining, one depleted and one species showed collapsed status. Among the three groups of molluscs studied, squids and octopus were abundant and cuttlefish less abundant. Among curstaceans, prawns and crabs were less abundant and stomatopods indicated a declining trend.
Av. 3 years 2011-13
Max1990-2013
% of Historic max
Oil Sardine 100536 119611 84.1 AOther Sardines 10178 18352 55.5 LA

Stolephorus 5348 11847 45.1 D
RIBBON FISHES 24623 29468 83.6 AHALF& FULL BEAKS
358 404 88.5 A
CARANGIDS 41555 54764 75.9 AHorse Mackerel 5412 7315 74.0 AScads 30359 43105 70.4 ALeather-jackets 687 979 70.2 AOther carangids 5096 10349 49.2 DIndian mackerel 54118 77607 69.7 ASEER FISHES 6824 8620 79.2 AS. commersoni 6276 7745 81.0 AS. guttatus 548 1148 47.7 DTUNNIES 2429 7365 33.0 D
E. affinis 1995 6410 31.1 D
Auxis. spp 246 1232 19.9 D
K. pelamis 28 58 47.7 D
T. tonggol 88 1110 7.9 DE
Other tunnies 73 267 27.2 DBILL FISHES 10 171 6.0 DEBARRACUDAS 5130 6926 74.1 APOMFRETS 2347 2861 82.0 ABlack pomfret 1474 3228 45.7 DSilver pomfret 861 1081 79.6 AChinese pomfret 13 234 5.6 DEELASMOBRANCHS 1261 1926 65.5 LASharks 728 1401 51.9 LASkates 203 295 68.8 LARays 331 513 64.5 LACatfishes 2353 2769 85.0 ALIZARD FISHES 17455 23907 73.0 APERCHES 61216 78667 77.8 ARock cods 9736 13495 72.1 ASnappers 55 329 16.7 DPig-face breams 1 70 1.9 CThreadfin breams 47702 61017 78.2 AOther perches 3721 9137 40.7 DCROAKERS 5244 6544 80.1 A
SILVERBELLIES 3839 6058 63.4 LA

BIG-JAWED JUMPER
3376 3916 86.2 A
FLAT FISHES 9291 18185 51.1 LASoles 9291 18153 51.2 LACRUSTACEANS 18791 43989 42.7 DPenaeid prawns 12165 21507 56.6 LACrabs 1944 2845 68.3 LAStomatopods 12391 25597 48.4 DCephalopods 21252 26051 81.6 ASQUIDS 15439 18901 81.7 ACUTTLEFISHES 7810 12479 62.6 LAOCTOPUS 651 841 77.4 A
Length range, mean, Lm. Lc, growth and spawning stock parameters of 40 dominant species were estimated
The food and feeding habits of 36 dominant species contributing to the fishery were analysed for the Index of Relative Importance (IRI). Seasonal variations in prey availability were studied.
The landing centre price, wholesale price and retail price of 45 finfish species were collected form Manglaore in Karnataka and Madgoan in Goa and spread sheets prepared.
Conflicts between the trawl operators and the fishing for cuttlefish using FADs escalated during 2011. Scientists based on their studies submitted a report on the exploitation of cuttlefish using FAD’s made mainly from coconut fronds; the spawning season and behavior of the cuttlefish and the vulnerability of mature spawners to get caught in areas where FAD’s are deployed. Based on the report submitted by CMFRI and discussions with all concerned and keeping in view the harmful nature of FAD fishing, the Government of Karnataka banned fishing of cuttlefish by non-conventional methods using coconut fronds (Chowri), torn nets, decaying material and other marine polluting materials/items along the Karnataka coast under the provisions of the Karnataka Marine Fisheries Act 1986, subsection (1) (B) and (C) in the notification dated 07 July 2012. This ban will go a long way in conserving the cuttlefishavailable along Karnataka Coast and is a positive step taken for the management of marine fishery resources in Karnartaka.

Interaction with fishers
Non-equilibrium production models were fitted to cephalopod catch and effort statistics to arrive at limit reference points (LRP), YMSY and fMSY. The parameter estimates, K (carrying capacity), r (intrinsic rate of population growth) and q (catchability coefficient) were 3,00,187 t, 0.1561474 per year, 2.7874050E-08 for Schaefer model. The estimated precautionary limit YMSY, was 11,718 t and the corresponding fMSY was 28,00,946 h. The current effort, fnow
expended in the trawling ground is 33,42,587 h for a trawling period of 108.8 h per MDF trip. The results suggest that the fishing effort is 32% in excess of the precautionary target, f0.1
estimated at 25,20,851 h as well as 19% above the LRP for sustaining the fishery at MSY levels. Therefore, it is recommended that trawling effort for the MDF be reduced so that the long-term catches of cephalopods correspond to the YMSY levels in the present fishing area.
Fitted Stock-recruitment curve by Ricker model Spawning Stock biomass and SMSY\\
0
10
20
30
40
50
60
70
80
90
100
0.00 0.01 0.02 0.03 0.04
R (
mill
ion
no
s)
SSB (million t)
R=aS exp(-bS) Observed
0
2
4
6
8
10
12
14
16
18
20
2001 2002 2003 2004 2005 2006 2007 2008 2009 2010 2011 2012 2013
Sp
aw
nin
g S
toc
k B
iom
ass
('0
00t
)
SSB(t)
Smsy (t)
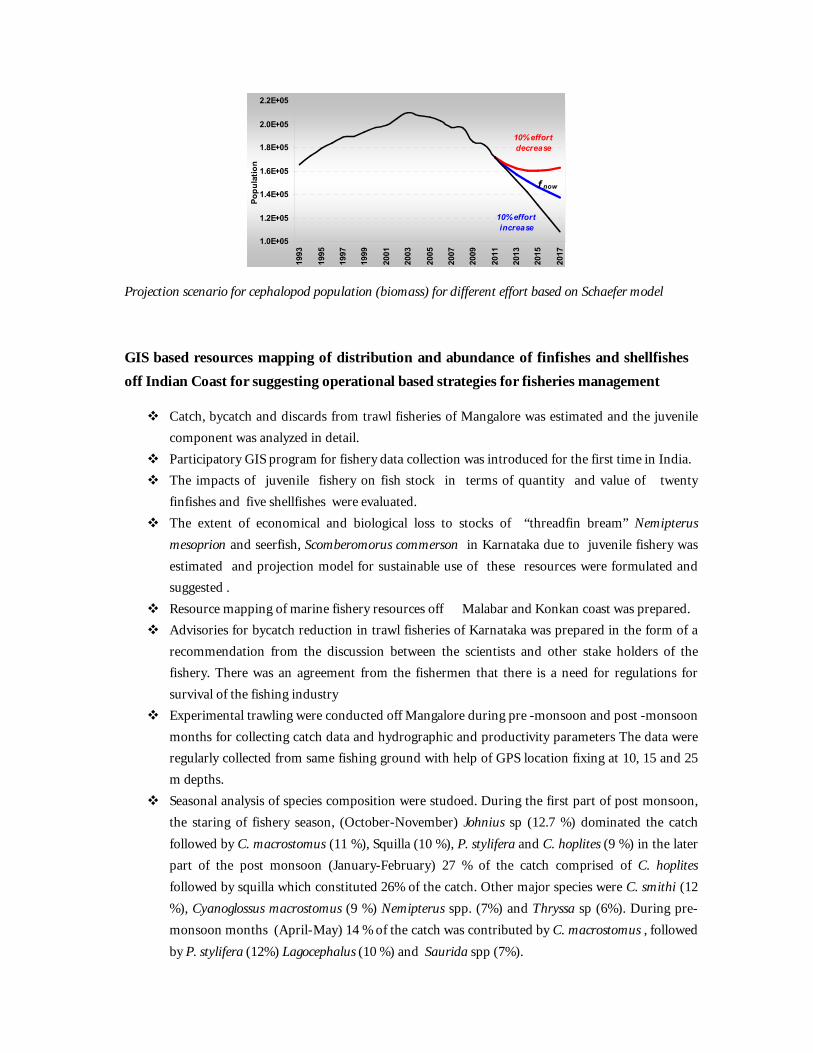
Projection scenario for cephalopod population (biomass) for different effort based on Schaefer model
GIS based resources mapping of distribution and abundance of finfishes and shellfishes off Indian Coast for suggesting operational based strategies for fisheries management
Catch, bycatch and discards from trawl fisheries of Mangalore was estimated and the juvenile component was analyzed in detail.
Participatory GIS program for fishery data collection was introduced for the first time in India. The impacts of juvenile fishery on fish stock in terms of quantity and value of twenty
finfishes and five shellfishes were evaluated. The extent of economical and biological loss to stocks of “threadfin bream” Nemipterus
mesoprion and seerfish, Scomberomorus commerson in Karnataka due to juvenile fishery wasestimated and projection model for sustainable use of these resources were formulated and suggested .
Resource mapping of marine fishery resources off Malabar and Konkan coast was prepared. Advisories for bycatch reduction in trawl fisheries of Karnataka was prepared in the form of a
recommendation from the discussion between the scientists and other stake holders of the fishery. There was an agreement from the fishermen that there is a need for regulations for survival of the fishing industry
Experimental trawling were conducted off Mangalore during pre -monsoon and post -monsoon months for collecting catch data and hydrographic and productivity parameters The data were regularly collected from same fishing ground with help of GPS location fixing at 10, 15 and 25 m depths.
Seasonal analysis of species composition were studoed. During the first part of post monsoon,the staring of fishery season, (October-November) Johnius sp (12.7 %) dominated the catch followed by C. macrostomus (11 %), Squilla (10 %), P. stylifera and C. hoplites (9 %) in the later part of the post monsoon (January-February) 27 % of the catch comprised of C. hoplitesfollowed by squilla which constituted 26% of the catch. Other major species were C. smithi (12 %), Cyanoglossus macrostomus (9 %) Nemipterus spp. (7%) and Thryssa sp (6%). During pre-monsoon months (April-May) 14 % of the catch was contributed by C. macrostomus , followed by P. stylifera (12%) Lagocephalus (10 %) and Saurida spp (7%).
10% effort increase
10% effort decrease
f now
1.0E+05
1.2E+05
1.4E+05
1.6E+05
1.8E+05
2.0E+05
2.2E+05
1993
1995
1997
1999
2001
2003
2005
2007
2009
2011
2013
2015
2017
Po
pu
lati
on

Species Diversity indices (H’ Log2) ranged from 3.67 to 4.17, highest in April and lowest in January. The evenness was in the range of 0.97-0.98.The cluster analysis showed a similarity between April and November to which January got linked. There is clearly a low level of similarity between samples J1 to J6, and the rest of the samples (<50 % similarity). Majority of the other samples have more than 60% of similarity.

All environmental parameters were assessed in different months. There was no significant difference between the environmental parameters between months
Assessment of biodiversity and ecological impact in open sea cage farming
The data were collected from the cages installed at Uppunda, Byndoor Karnataka. The GPS location of the cage site is N13°52’212 and E 74°36’647. Hydrographic parameters from the cage site and reference site were monitored during the period of study. Sediment sample was collected from the two sites dried and kept for further analysis. For fouling studies 10 panels of 10cm x 10 cm was made and is suspended from the cages in different depths. Observations after one month of exposure showed settlement of algal matter on the panel.After one month of installation of cages, observation of the wild fish aggregation showed that the fishes were aggregating around the cages and the cage was acting as FAD. The species aggregated included Terapon jarbua, Siganus canaliculatus, Caranx sps. and Sardinella longiceps. The natural entrants to the cage was also the same species. Estimated species compositions are Terapon jarbua (60%), Siganus canaliculatus (12%), Caranx sps. (12 %) and Sardinella longiceps (16 %).
Innovations in sea cage farming and development of sustainable capture based
aquaculture
One of the essential requirements for cultivating marine finfish under capture based aquaculture is the information on availability of the cultivable species in space and time. In 2011, The area selected for seed sourcing investigation was Sambhavi estuary, Mulky. The sampling was conducted during the low tide from the sea mouth to Sambhavi estuary (1 km stretch), seed survey was carried out by using cast net. the year except in monsoon months, seeds of the genera Mugil and Etroplus were available during pre-monsoon and post monsoon periods. Juveniles of Lutjanus argentimaculatus, which is found to be most preferred species for the CBA by farmers of Karnataka. In Sambavi estuary Lutjanus argentimaculatus juveniles were available only during October. Further studies on the availability of the species has to be carried out during the post monsoon months with coverage of more areas for sourcing the seed for this preferred species.
Capture based Cage culture at Uppunda, Karnataka

At Uppunda, Byndoor five cages (2.5 m x 2.5 m x 2 m, made of Netlon mesh of 30 mm and inside lined with nylon net) were stocked during January, 2010 was reared throughout the year, including the monsoon period. The cages were designed and fabricated by CMFRI with the participation of local fishermen. The fishes were harvested in 2011.
Stocking: The concept of CBA was introduced in this village by collection of Lutjanus argentimaculatus, Etroplus suratensis and Lates calcarifer fingerlings and stocking in floating cages. Even though the program was planned to stock locally available seeds, to assure good production from the demonstration cages and for encouraging the fishermen who engaged in the program, seeds of Lates calcarifer was stocked along with local seeds of redsnapper and pearl spot.
Husbandry: The red snapper and pearlspot fingerlings collected from the wild were continuously stocked by fishermen. The fishermen community was engaged in the cage setting, cage cleaning, feed sourcing, feed preparation and feeding. Feeding was done with locally available trash fish and also fish waste from fish processing areas/plants.
Lates calcarifer weighing 150-200 gram in January, 2010 were daily fed with trash fish. Seabass attained weight of 1.0-1.5 kg in one year and attained a weight of 2.3 kg by June, 2011. L. argentimaculatus was stocked continuously during December, 2009 to March, 2010, The size of the fingerlings ranged from 30-40 gms (100-120mm). The fishes were fed twice a day at the rate of 10% body weight with chopped low cost fishes. These fishes reached a weight of 1.2 kg by June, 2011.
Production and Harvest: Out of three cages continuous partial harvesting of fishes of marketable sizes was carried out during January-June, 2011.To understand and demonstrate the production potential from estuarine cages two cages were kept as demonstration cages, without carrying out any partial harvesting.
The Lutjanus sp attained an average weight of 755 ± 415 g ranging from 105 to 1,914 g. The pearlspot ranged from 37-222 g (96 ± 35g). About 255 numbers of seabass of average weight 1819 ± 540 g was harvested. The total production from the cages including seabass, red snapper and pearlspot was around ~400 kg realizing a farm gate price of ~ Rs 75,000 per cage.
Lutjanus argentimaculatus was found to be best specie in terms of growth and as well as availability of seed in Karnataka. Since seed collection techniques for of the red snapper was not perfected, seed availability the species was not sufficient to stock all the cages . To tide over the situation, CMFRI arranged and transported seabass seeds for stocking in CBA cages along with locally available seeds of red snapper.
Introduction of capture based aquaculture in Dakshina Kannada district of Karnataka.

After the successful demonstration of capture based aquaculture in Byndoor, the cage fabrication, cage installation and cage farming demonstrations were done at Netravathi Estuary at Dakshina Kannda During 2011. Fishermen from Byndoor who are engaged in the capture Based aquaculture, demonstrated the designing of the estuarine cages with the supervision of Scientists from CMFRI.
Design:
Based on the experience atByndoor, cage that are durable for continuous farming through the monsoon season were made. GI pipes of 1 inch dia. were used to make the frames of 3m X 2m frames ( top and bottom including the length of the GI bend). This is attached to 3m GI pipes from all four corners leaving 2 feet extra length at bottom, frame to avoid touching of nets to the bottom. These cages were bigger when compared to the earlier design of 2.5 m x 2.5 m x 2 m. In earlier models the best growth rate for red snapper and seabass were obtained with stocking of 800 nos. /cage. The bigger cage enabled astocking density of 1000 numbers/cage.
Netlon (mesh of 30 mm) material were attached to the GI frame to make it in required shape. Inside lining of the cages were made depending on the size of the fingerling stocked. If the fingerlings are too small, small meshed hapa was also provided in the cage which is later removed as and when the fishes grow.
PVC pipe framed with thermocol filling were helping in floatation of the cages. Additional floats made of used empty cans of 10liters (4nos) were provided at he each corner of the cage.
Feeding and cage maintenance:
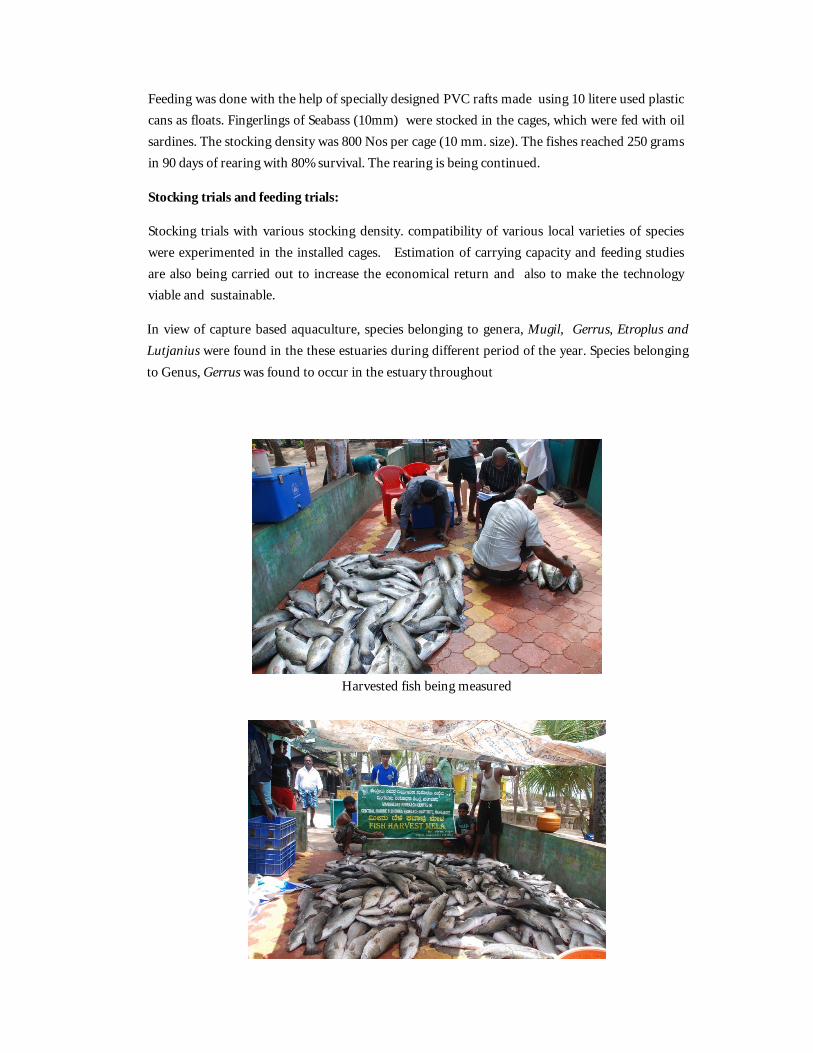
Feeding was done with the help of specially designed PVC rafts made using 10 litere used plastic cans as floats. Fingerlings of Seabass (10mm) were stocked in the cages, which were fed with oil sardines. The stocking density was 800 Nos per cage (10 mm. size). The fishes reached 250 grams in 90 days of rearing with 80% survival. The rearing is being continued.
Stocking trials and feeding trials:
Stocking trials with various stocking density. compatibility of various local varieties of species were experimented in the installed cages. Estimation of carrying capacity and feeding studies are also being carried out to increase the economical return and also to make the technology viable and sustainable.
In view of capture based aquaculture, species belonging to genera, Mugil, Gerrus, Etroplus and Lutjanius were found in the these estuaries during different period of the year. Species belonging to Genus, Gerrus was found to occur in the estuary throughout
Harvested fish being measured

Recruitment dynamics of penaeid prawns along the Indian coast
Stock recruitment studies in M.dobsoni, and M. monoceros were carried out
M.dobsoni
Peak breeding activity was noticed during February-May and a minor peak in breeding was observed in November. In some years spawning period was delayed by a month and peak activity started from March and it extended till monsoon. Secondary peak also was found to be delayed by a month, December. From this it was assumed that M. dobsoni is a continuous breeder, there are two peaks of spawning, one during post monsoon extended till November- December and the second one starting from February extended till monsoon period. Size at maturity is calculated as 64 mm for males 71 mm for females. Fecundity ranged from 35,500 eggs at 70 mm to 1,60,000 eggs at 120 mm. It was found that that, individual prawn spawns 5 times during its life time with an interval of two months between 2 successive spawning. Siize fecundity relation was found to be, Fecundity= 0.192*(Total Length in mm)^2.8473.
Monthly length-frequency of the M. dobsoni collected from Mangalore trawl landings were subjected to length cohort analysis using growth parameters asymptote length (L∞) and growth coefficient (K) 119 mm and 1.2 respectively. The natural mortality (M) derived by Srinath’s formula was 2.23. The monthly ‘Length-cohort studies’ for the period January, 2002 to December, 2006 were carried out to get monthly recruitment numbers. The number of eggs produced and the recruitment during 2002-2006 is given in table 2. Considering the findings that M. dobsini is a continuous breeder, it can be assumed that on an average 0.054% of the eggs reach recruitment stage. Recruitment during the period was fluctuating but overall trend did not show any reduction or increase. In 2006 highest recruitment was observed. (fig.1)
Linear relationship study
y = 2.5239x + 0.6717R² = 0.6948
Linearised relation s and lnR/S for Ricker model
ln (R/S)
Linear (ln (R/S))
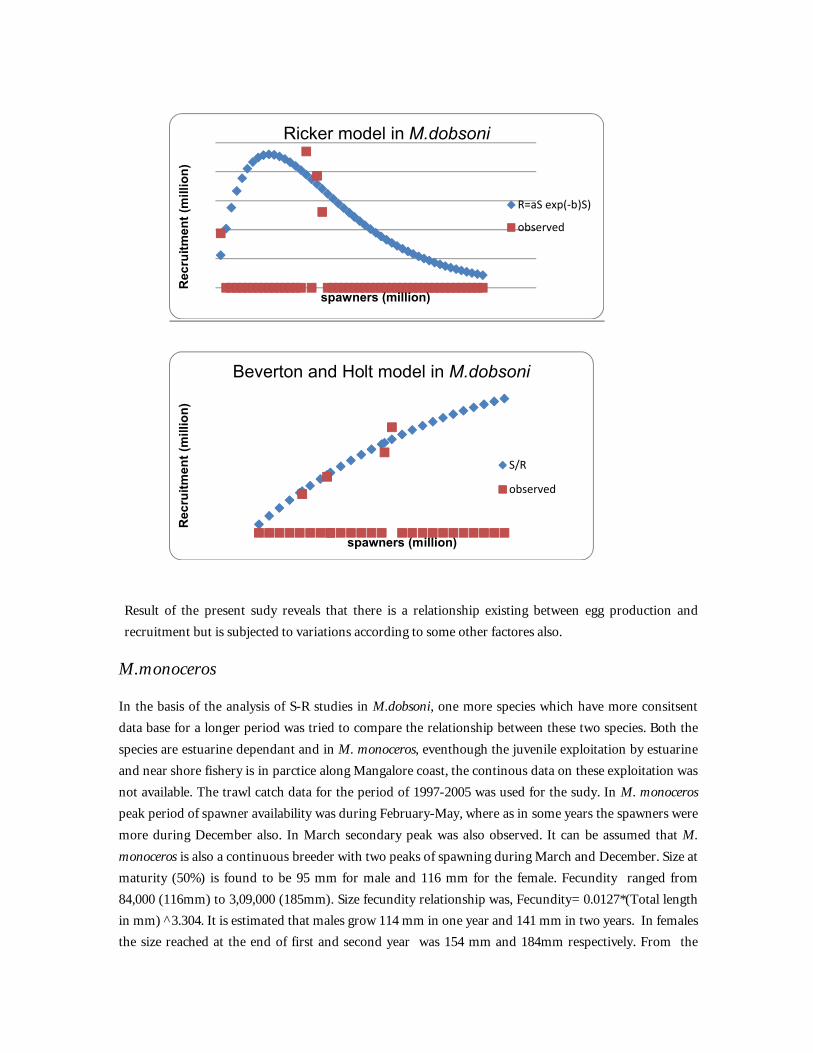
Result of the present sudy reveals that there is a relationship existing between egg production and recruitment but is subjected to variations according to some other factores also.
M.monoceros
In the basis of the analysis of S-R studies in M.dobsoni, one more species which have more consitsentdata base for a longer period was tried to compare the relationship between these two species. Both the species are estuarine dependant and in M. monoceros, eventhough the juvenile exploitation by estuarine and near shore fishery is in parctice along Mangalore coast, the continous data on these exploitation was not available. The trawl catch data for the period of 1997-2005 was used for the sudy. In M. monoceros peak period of spawner availability was during February-May, where as in some years the spawners were more during December also. In March secondary peak was also observed. It can be assumed that M. monoceros is also a continuous breeder with two peaks of spawning during March and December. Size at maturity (50%) is found to be 95 mm for male and 116 mm for the female. Fecundity ranged from 84,000 (116mm) to 3,09,000 (185mm). Size fecundity relationship was, Fecundity= 0.0127*(Total length in mm) ^3.304. It is estimated that males grow 114 mm in one year and 141 mm in two years. In females the size reached at the end of first and second year was 154 mm and 184mm respectively. From the
Rec
ruit
men
t (m
illio
n)
spawners (million)
Ricker model in M.dobsoni
R=aS exp(-b)S)
observed
Rec
ruit
men
t (m
illio
n)
spawners (million)
Beverton and Holt model in M.dobsoni
S/R
observed

trawl landings it is observed that the recruitment size of M. monoceros in the trawl is between 70 and 80 mm and by analysing growth with VBGF, it is found that the recruitment time is 5 months.
Stock- recruitment relationships “Ricker model “was tried out with the anlysed data and the results are presented below.
Technological upgradation in molluscan mariculture
Rack and Rope method: Two racks of 14 x 5 m & 12 x 6 m (142 sq. m) were fabricated in the outlet of a Fenneropenaeus indicus farm near Saligrama at 1.5 m depth (during low tide). About 450 numbers of 0.75 - 1 m coir ropes were seeded with green mussel, Perna viridis at the rate of 750 g/m by the last week of December, 2008. The green mussel, at an average size of 22 mm at seeding, attained a size of 66.63±5.35 mm by first week of June, 2009, registering a monthly growth rate of 8.2 mm. The environmental parameters, such as, dissolved oxygen, salinity and chlorophyll-a were monitored in the shrimp pond and in the biopond. The farming activity was initiated during the post-monsoon months when the prevailing hydrographic conditions in the shrimp ponds were optimal for mussels farming. Mussel seeds
y = 2.5239x + 0.6717R² = 0.6948
Linearised relation s and lnR/S for Ricker model
ln (R/S)
Linear (ln (R/S))
Rec
ruit
men
t (m
illio
n)
spawners (million)
Ricker model in M.dobsoni
R=aS exp(-b)S)
observed
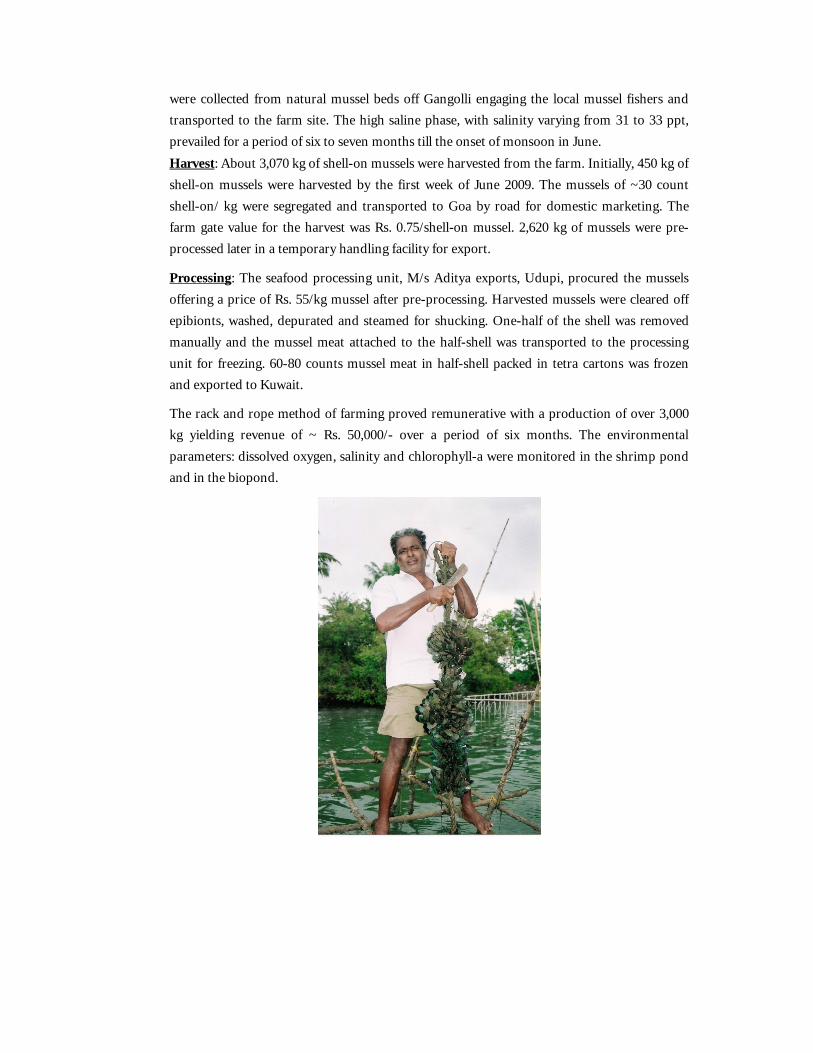
were collected from natural mussel beds off Gangolli engaging the local mussel fishers and transported to the farm site. The high saline phase, with salinity varying from 31 to 33 ppt, prevailed for a period of six to seven months till the onset of monsoon in June. Harvest: About 3,070 kg of shell-on mussels were harvested from the farm. Initially, 450 kg of shell-on mussels were harvested by the first week of June 2009. The mussels of ~30 count shell-on/ kg were segregated and transported to Goa by road for domestic marketing. The farm gate value for the harvest was Rs. 0.75/shell-on mussel. 2,620 kg of mussels were pre-processed later in a temporary handling facility for export.
Processing: The seafood processing unit, M/s Aditya exports, Udupi, procured the mussels offering a price of Rs. 55/kg mussel after pre-processing. Harvested mussels were cleared off epibionts, washed, depurated and steamed for shucking. One-half of the shell was removed manually and the mussel meat attached to the half-shell was transported to the processing unit for freezing. 60-80 counts mussel meat in half-shell packed in tetra cartons was frozen and exported to Kuwait.
The rack and rope method of farming proved remunerative with a production of over 3,000 kg yielding revenue of ~ Rs. 50,000/- over a period of six months. The environmental parameters: dissolved oxygen, salinity and chlorophyll-a were monitored in the shrimp pond and in the biopond.

October 2009-March 2010
Though the feasibility of mussel culture in the estuaries and in the inshore bays of Karnataka was established by CMFRI through location testing, farming of mussel has started only on a limited scale in the State by 2008. The harvest of cultured green mussel, from the estuarine mussel farm by a progressive farmer from Kodi Kanyan, Udupi, demonstrated the immense scope of wider adoption of less capital intensive and simple form of coastal aquaculture. The higher unit price realized, minimal operational expenditure, short period of eco-friendly farming and good demand for mussel encouraged more farmers to adopt the practice in Sita estuary during 2009-2010. Mussel farming practice was adopted by 13 shrimp farmers during 2009-2010 as a group farming activity in the estuary. MPEDA, Karwar extended financial support by providing an amount of Rs. 10,000 for four mussel-farming groups.
Six racks were fabricated at 1.5-2.5 m depth (during low tide) in Sita estuary near Saligrama by 13 fishermen. Coir ropes of 0.75-2.5 m length were seeded in batches with green mussel, Perna viridis at the rate of 750-1500 g/m. Seeding was carried out in two phases. Initially the seeding was carried out from last week of October to the first week of November 2009. The next phase commenced by January 2010.
The rack (12 x 6 m) fabricated during 2008-09 in the outlet of a Fenneropenaeus indicus farm at Saligrama was utilized for farming 150 numbers of 1m seeded ropes during 2009-2010.
Mussel seeds ranging from 46 to 50 mm in size at seeding attained 90 mm in five months, with a monthly growth rate of 8.4 mm.
Due to higher percentage edibility and superior counts attained, the mussels were harvested from the racks on alternate days and transported to Goa for marketing from the last week of March, 2010.
April 2010-June 2010
During April-June 2010, the growth rates of mussels farmed in six estuarine farms fabricated at 1.5-2.5 m depth (during low tide) in Sita estuary by 13 fishermen were monitored.
Harvest: About 5,400 kg of shell-on mussels were harvested from six estuarine farms. Initially, 5,000 kg of shell-on mussels was harvested from the last week of March 2010 from five racks. The larger mussels (~30 count shell-on/ kg) were segregated and marketed in Goa. The farm gate value for the harvest was Rs. 1.15-1.25/ shell-on mussel initially, later by June 2010 the value reached Rs. 2/ shell-on mussel.
Mortality: During May 2010, mortality was observed in a mussel farm located near the fishmeal plant in Saligrama due to the breakage in effluent pipe. On an average the mussel ropes of 0.75 - 1.0 m were weighing 9.8 kg by May. It was observed that only 83.7 % of mussels were live in the mussel ropes near the plant.
Growth: Mussels ranging from 46 to 50 mm (av. 47.5 mm) in size at seeding attained 90 mm in five months, with a monthly growth rate of 8.7 mm.
July 2010-March 2011
1) Estuarine mussel farming in Sita estuary- Rack & rope method:
Four racks were fabricated in Sita estuary at Saligrama and Sastan by fishermen groups. The rack (12 x 6 m) fabricated during 2008-09 in the outlet of a Fenneropenaeus indicus farm at Saligrama was also utilized for mussel farming during 2010-2011. 950 numbers of coir ropes and pre-used nylon ropes of 0.75-2.5 m length were seeded in batches with green mussel, Perna viridis. Seeding was carried out from last week of December 2010. Seeds were collected from subtidal mussel beds off Gangolli engaging the local mussel fishers during low tide. The cost of mussel seeds varied between Rs. 12/kg at Gangolli to Rs. 24/ kg at Someshwara. On the first week of March 2011, 260 numbers of mussel ropes were transported to Goa and suspended from racks. Two racks were fabricated inside Lates calcarifer ponds and used for integrated fish-cum-bivalve farming. Third rack was placed near the outlet of the pond and utilized for suspended bivalve farming.
The environmental parameters of the estuarine and open sea mussel farms such as temperature, salinity, pH, dissolved oxygen, chlorophyll a, total suspended solids (TSS), particulate organic matter (POM) and particulate inorganic matter (PIM) were monitored from January to March 2011.
2) Open sea mussel farming off Kaup - Raft & rope method:
Mussel raft was moored off Kaup for promoting mussel farming along with aqua-tourism.
The raft serves as a floating platform for tourist engaged in water sporting activities.
Raft fabrication: The raft (6m x 6m) was fabricated with the involvement of local fishermen and anchored at 6 m depth off Kaup Light house. GI pipes of 1” and 1.5” diameter measuring 20’ length were used for the constructing raft instead of wooden poles. 10 numbers of sealed empty oil drums, 200 l capacity were used for buoyancy. A square platform measuring 2.4m x 2.4m was constructed using marine plywood board (1/2” thick) and fixed on the raft. A cabana was fabricated using garden shade net material and fixed on the platform. The cabana frames were made of PVC pipes of 1” diameter. Cabana was connected by a 1.2m wide and 2.4m long access ramp of marine plywood board. The structure was painted and moored on 15 December, 2010. It was anchored on four sides using 2 numbers of grapnel anchors (35 kg each) and boulders. Kaup Light house is a tourist spot where private organizations conduct regular water sport activities. The raft was placed 0.6 km off Kaup Light house beach where water rides and snorkeling activities are regular.
Seeding: Mussel seeds (Perna viridis) were collected by the fishermen from subtidal beds off Kaup and seeded on nylon ropes of 24 mm thickness. 32 numbers of 3 m long ropes were seeded in batches with green mussel. Seeding was carried out from December 2010.
Mean Environmental characteristics of farm area
Parameter Kaup (SD)
Temperature (°C) 29.6 0.225Salinity (psu) 34.2 0.082pH 8.0 0.077DO (mg/l) 6.2 0.921Chla (mg/m3) 3.8 1.038TSS (mg/l) 14.8 3.021POM (mg/l) 6.8 4.199PIM (mg/l) 8.0 3.565
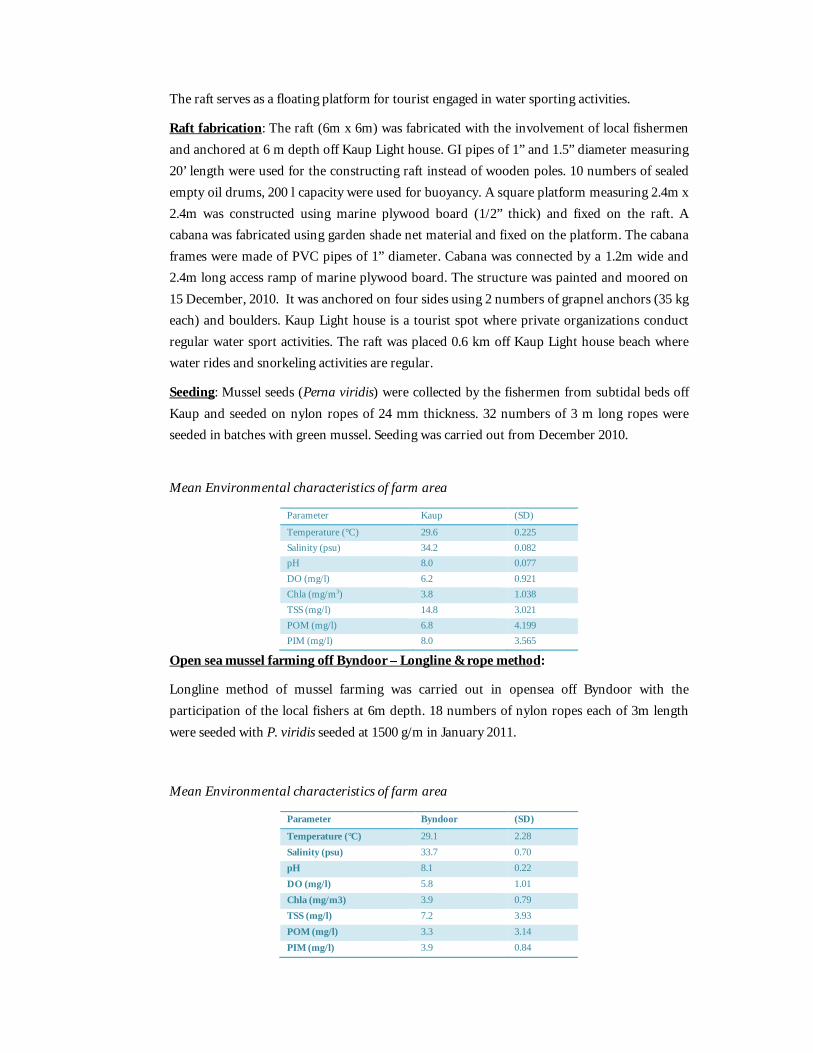
Open sea mussel farming off Byndoor – Longline & rope method:
Longline method of mussel farming was carried out in opensea off Byndoor with the participation of the local fishers at 6m depth. 18 numbers of nylon ropes each of 3m length were seeded with P. viridis seeded at 1500 g/m in January 2011.
Mean Environmental characteristics of farm area
Parameter Byndoor (SD)
Temperature (°C) 29.1 2.28
Salinity (psu) 33.7 0.70pH 8.1 0.22
DO (mg/l) 5.8 1.01
Chla (mg/m3) 3.9 0.79TSS (mg/l) 7.2 3.93
POM (mg/l) 3.3 3.14
PIM (mg/l) 3.9 0.84
July 2010-June 2011
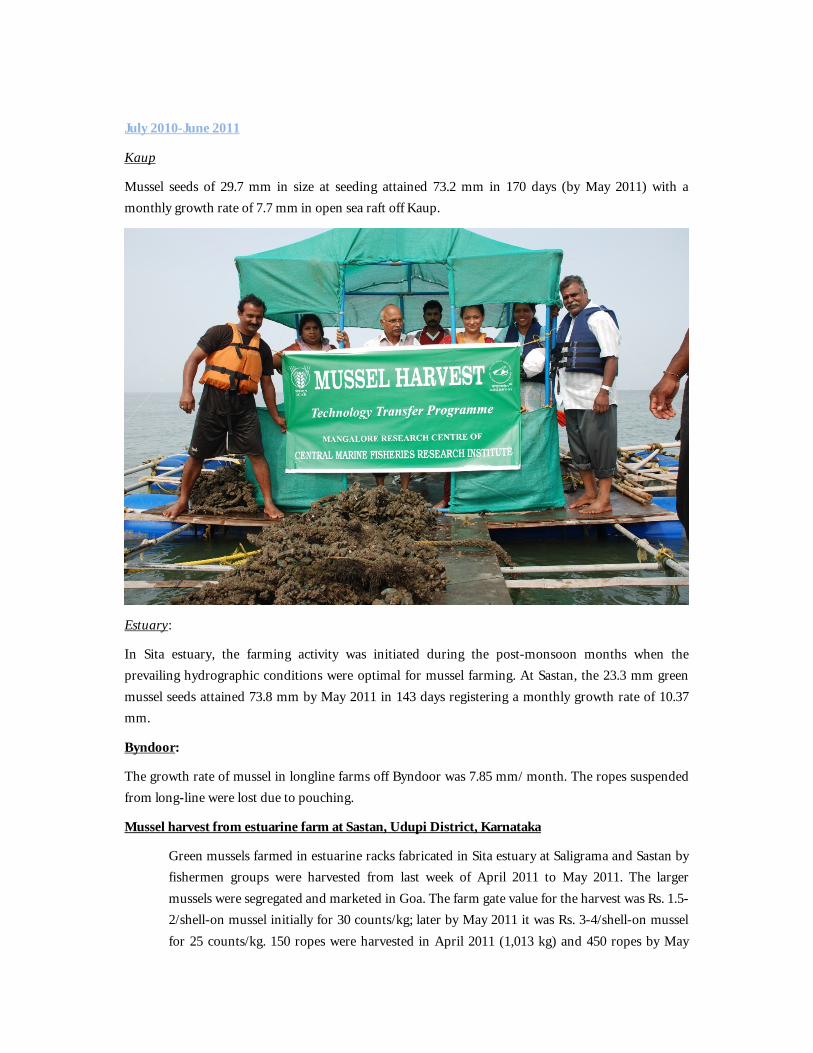
Kaup
Mussel seeds of 29.7 mm in size at seeding attained 73.2 mm in 170 days (by May 2011) with a monthly growth rate of 7.7 mm in open sea raft off Kaup.
Estuary:
In Sita estuary, the farming activity was initiated during the post-monsoon months when the prevailing hydrographic conditions were optimal for mussel farming. At Sastan, the 23.3 mm green mussel seeds attained 73.8 mm by May 2011 in 143 days registering a monthly growth rate of 10.37 mm.
Byndoor:
The growth rate of mussel in longline farms off Byndoor was 7.85 mm/ month. The ropes suspended from long-line were lost due to pouching.
Mussel harvest from estuarine farm at Sastan, Udupi District, Karnataka
Green mussels farmed in estuarine racks fabricated in Sita estuary at Saligrama and Sastan byfishermen groups were harvested from last week of April 2011 to May 2011. The larger mussels were segregated and marketed in Goa. The farm gate value for the harvest was Rs. 1.5-2/shell-on mussel initially for 30 counts/kg; later by May 2011 it was Rs. 3-4/shell-on mussel for 25 counts/kg. 150 ropes were harvested in April 2011 (1,013 kg) and 450 ropes by May
2011 (3,647 kg). The total harvest from estuarine racks was 4,660 kg. The survival in mussel ropes was estimated as 85.6% in estuarine condition.
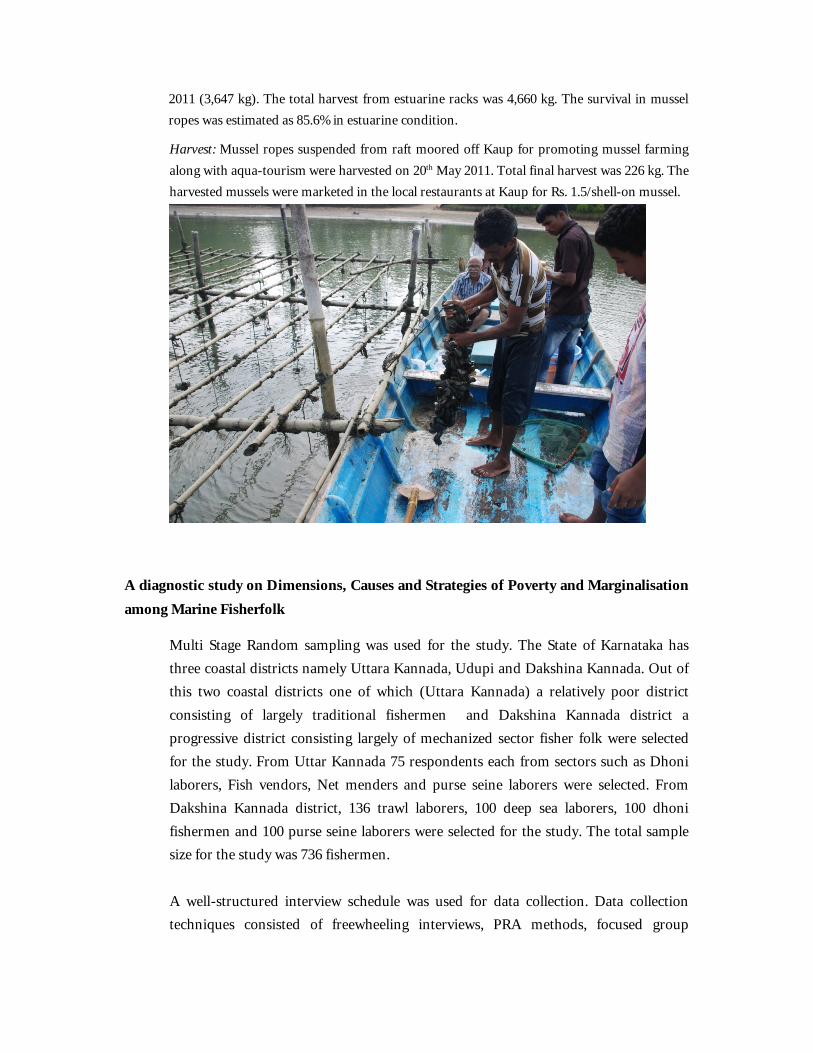
Harvest: Mussel ropes suspended from raft moored off Kaup for promoting mussel farming along with aqua-tourism were harvested on 20th May 2011. Total final harvest was 226 kg. The harvested mussels were marketed in the local restaurants at Kaup for Rs. 1.5/shell-on mussel.
A diagnostic study on Dimensions, Causes and Strategies of Poverty and Marginalisation among Marine Fisherfolk
Multi Stage Random sampling was used for the study. The State of Karnataka has three coastal districts namely Uttara Kannada, Udupi and Dakshina Kannada. Out of this two coastal districts one of which (Uttara Kannada) a relatively poor district consisting of largely traditional fishermen and Dakshina Kannada district a progressive district consisting largely of mechanized sector fisher folk were selected for the study. From Uttar Kannada 75 respondents each from sectors such as Dhoni laborers, Fish vendors, Net menders and purse seine laborers were selected. From Dakshina Kannada district, 136 trawl laborers, 100 deep sea laborers, 100 dhoni fishermen and 100 purse seine laborers were selected for the study. The total sample size for the study was 736 fishermen.
A well-structured interview schedule was used for data collection. Data collection techniques consisted of freewheeling interviews, PRA methods, focused group
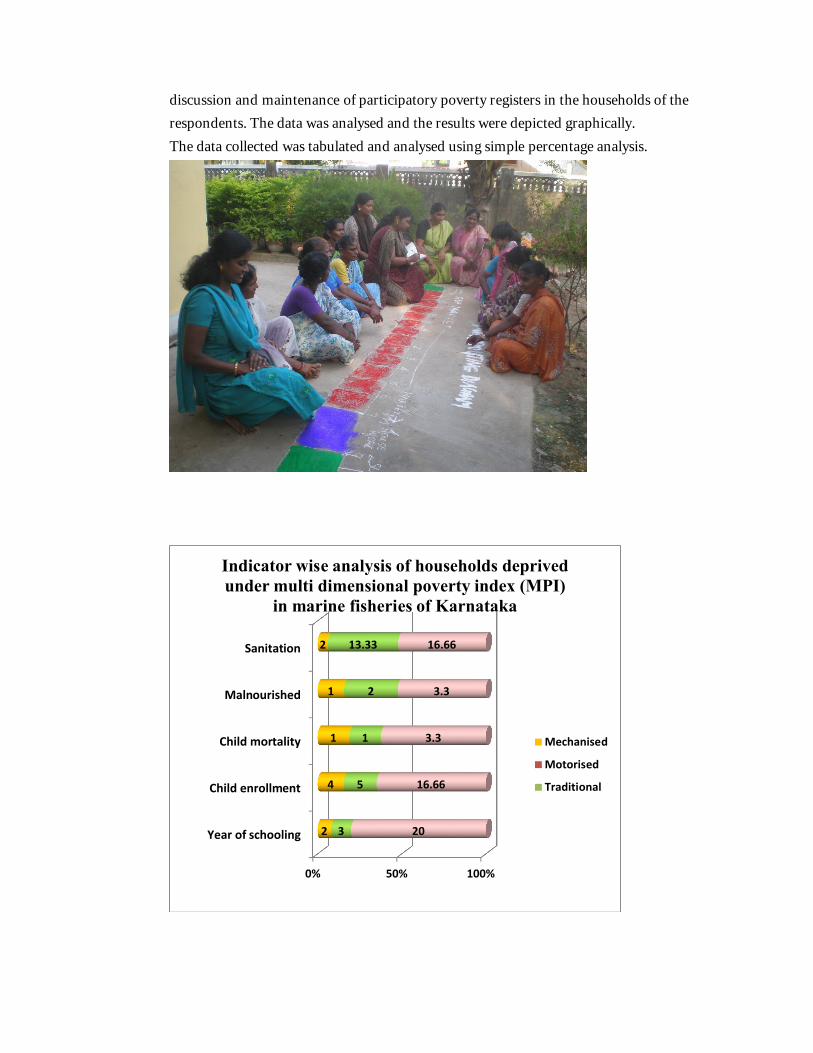
discussion and maintenance of participatory poverty registers in the households of the respondents. The data was analysed and the results were depicted graphically.The data collected was tabulated and analysed using simple percentage analysis.
0% 50% 100%
Year of schooling
Child enrollment
Child mortality
Malnourished
Sanitation
2
4
1
1
2
3
5
1
2
13.33
20
16.66
3.3
3.3
16.66
Indicator wise analysis of households deprived under multi dimensional poverty index (MPI)
in marine fisheries of Karnataka
Mechanised
Motorised
Traditional

Coping mechanisms during lean period of fishing across all sectors in Karnataka.
Economic Psychological Social
Changing roles as crew member from mechanised craft to motorised Gill netter and motorised/non motorised dhonis.
Labourers in “Kairampani” shore seine operation.
Net mending, agrarian work, painting, carpentry and electrical work
Nil Social welfare schemes for lean season exclusively is nil
SHGs assistance in the form of loans for dry fish making, fresh fish procurement, and for house repair, jewel loan, marriage of children etc.
Alternative avocations Ranking for priorities of fisher folk for fishery based micro enterprises
No. Fishery based micro enterprise
Karnataka
1. Preparation of Value Added products
*****
2. Preparation of Dry Fish products
********
3. Fish Processing Unit *********
4. Ready to eat fish ***

products5. Ready to cook fish
products6. Ornamental Fish
culture enterprise***
7. Mussel culture *********8. Clam collection *********9. Edible oyster culture *********10. Pearl culture11. Mud Crab culture *********12. Cage culture *********
Coastal Rural Indebtedness and Impact of Microfinance Coastal Rural Indebtedness and Impact of Microfinance in Marine Fisheries Sector
Multistage sampling method was followed for the study. Dakshina Kannada district. The fishing villages having maximum number of fisherwomen enrolled in microfinance instituions were selected. These villages were Bengre, Ullal, Baikampady and Hoige Bazar. There are 58,254 fisherwomen in the 3 coastal distrcits of Karnataka and fisherwomen formed 48 % of the total population. In Dakshina Kannada district, a total of 1,812 fisherwomen are enrolled in Self help groups/microfinance institions. These institutions provide the fisherwomen with credit facilities to carry out economically viable operations such as procurement of fresh fish, salting and processing of fish and drying and marketing them. The members of these microfinance instituions also availed loans for repairng of houses, purchase of gold, educational facilities of their children and for marriage purposes of their family members.
The fisherwomen in the study area preferred microfinance instituions to Institutional and non instituional sources of credit with respect to attributes such as easy approval process, diverse areas of funding, eligibility of recepients low interset rate, easy repayment schedule and provision of loan grace periods.
Level of indebtedness in Navodaya microfinance institution in Dakshina Kannada district
It was observed during the study that, the Navodaya microfinance institutions which came under the purview of Shri Kshetra Dhramasthala Rural Development Project (SKDRDP) a Dakshina Kannada based NGO, which has been awarded the Microfinance India Award, 2010 were having branches at Kateel, Baikampady, Hoige Bazar and Ullal

fishing villages in Dakshina Kannada district. The repayment for the loan taken was collected from the members at the rate of Rs. 250/week. If payment was delayed in the following week the members had to pay a penalty of Rs.10/week. The full time membership fee for joining in this microfinance institution was Rs. 150. The savings of each member is Rs. 50/week. The insurance is collected at the rate of Rs. 50/month/member. The group conducts its weekly meeting regularly, maintains attendance registers, pass books, repayment registers and maintains its account at Vijaya Bank, Mangalore.
It was observed during the study that, the repayment for the loan taken was collected from the members at the rate of Rs. 250/week. If payment was delayed in the following week the members had to pay a penalty of Rs.10/week. The full time membership fee for joining in this microfinance institution was Rs. 150. The savings of each member is Rs. 50/week. The insurance is collected at the rate of Rs. 50/month/member. The group conducts its weekly meeting regularly, maintains attendance registers, pass books, repayment registers and maintains its
Understanding threatened coral reef ecosystem of southern India and designing interventions aimed at their restoration
Under water visual survey of Netrani waters, off Murudeshawar (Karnataka) and Grande Island Goa. Quantification of corals, coral fishes, molluscs and sponges from geo referenced points in these coral reefs was done during the period.
Three sites were surveyed. Site 1: 15°21.00’ N and 73°46 .56’E. Site 2.GPS: 15°21.03’ N and 73°47 .02’E, Site 3. : GPS: 15°21.17’ N and 73°45 .98’E.

Extent of coral cover
In Site I was about 9000 sq m, in Site II was 14,000 sq m and in Site III was 2000 sq m. Site 1: Coral cover: Turbinaria sps: 31 %, Plesiastrea sps (20.4 %). Site 2: Dendrophyllia sps (51.3 %); Turbinaria sps (19.5 %).Site 3 Turbinaria sps dominated (54.5 %); Dendrophylliasps (18.2 %). The diversity indices :In line with the abundance and number, Shannon diversity indices (H’) was 1.67 in site 1, 1.40 in site 2, 1.31 in site 3. The evenness (J’) of species distribution was more in site1 (0.80), followed by site 3 (0.73), Site 2 (0.72). The cumulative curve expressed as the percentage of abundance in the sample referred to as dominance plot shows that curve for site 1, which lie on the lower side extended further and rise slowly due to the presence of more density of species. The dendrogram plotted shows that Site 1and 3 formed a group with maximum similarity of 68.19 to which Site 2 got linked.
Coral Fish Assemblage
Non-cryptic, diurnally active marine fishes in both reefs were surveyed using an adaptation of underwater visual census (UVC) technique of belt-transect (Brock, 1954).
Netrani: A total of 70 species belonging to 19 families and 3 orders were recorded in the transect in four sites When comparing the abundance, the fishes of Balistidae family dominated in all the four sites (22 %) followed by Pomacentridae (12.5 %), Caesionidae (9.7 %), Labridae (7.8 %), Acanthuridae (7.3 %), Haemulidae (6.7 %), Scaridae(6.1 %) In all the four sites the fish density was calculated per 100 sq.m. The density of fishes belonging to Balistidae was high in all the sites except for site four. In site 4 Pomacentridae family dominated. Shannon diversity indices (H’) was 2.8 in site 2, 2.6 in site 3, 2.3 in site 4 and 2.2 in site 1. For Alpha diversity study of Netrani, each site was taken as particular area and fish taxa species richness coming in the transect was represented as alpha diversity. Highest alpha diversity value was found in Site 2 (14°0072 N and 74°19.47E) and followed by Site 3 (14°0118 N and 74°19.65 E), Site 4 (14°0096 N and 74°19.81E and Site 1(14°0084 N and 74°19.60E ) respectively.

Grande Island: Nineteen species belonging to 14 families and 2 orders were observed in the transect.
When comparing the abundance, the fishes of Pomacentridae family dominated in all the three sites (49.3 %) followed Caesionidae (17 %), Chaetodontidae (10.3 %), Pomacanthidae (5.6%). Shannon diversity indices (H’) were 2.08 in site 3, 1.50 in site 2, 1.97 in site 1.
Coral Molluscs
Netrani: A total of 34 species were observed in the transect. In this, 9 species were bivalves belonging to 6 families and 3 orders and 25 species were gastropods belonging to 17 families and 6 orders. About 21% of the bivalves observed in the transect belonged to Veneridae family followed by Donacidae (19 %), Osteridae (16%), Arcidae (13.3 %) Mactridae (5.3 %) and Tridacnidae (4.0 %). In the gastropods Muricidae family was dominating (22 %) followed by Cerithiidae (12.72 %), Planaxidae (12.37 %), Trochidae (9.5 %) Cymatidae (7.07%). Diversity indices for molluscan assemblages: Shannon diversity indices was high in Site 2 (3.24) followed by Site 1 (2.94), site 3 (2.62) and site 4 (2.43). The evenness which looks at the number of each species present and visually compares the relative abundance of all species found in the area was 0.93 in all the sites except site 4 which had the value of 0.90.
Grande Island: Gastropods were represented by 6 species belonging to 4 families and 3 orders. About 81% of the species belonged to Trochidae and 14 % to Brusidae
Sponges
In Nethrani no sponges came across transect. In Grande Island Goa, 3 species of sponges occurred in the area. Sea fans and sponges were observed in an area of about 700 m (15°21.17 N and 73°47.22 E). The spicules were separated from the sponges and microphotographs taken
Hydrography
All the water quality parameters (pH, salinity, D.O, BOD, nutrients (nitrite, nitrate, phosphate, silicate), temperature and sediment analysis like texture and organic carbon were done for the two sites. In Netrani one way ANOVA showed that there is no significant difference in the parameters between seasons except for Phosphate in surface waters and silicate in bottom waters (at 1 % significant level).
Studies on the specific and infraspecific diversity of Lutjanids of the Indian seas
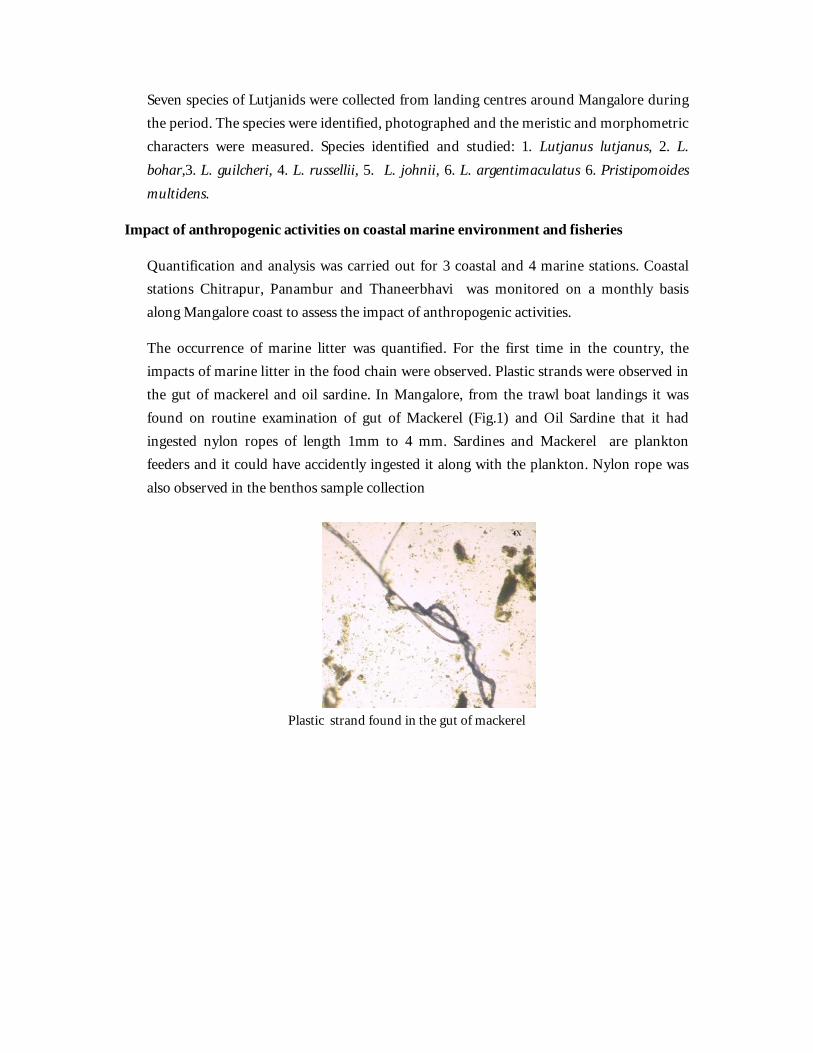
Seven species of Lutjanids were collected from landing centres around Mangalore during the period. The species were identified, photographed and the meristic and morphometric characters were measured. Species identified and studied: 1. Lutjanus lutjanus, 2. L. bohar,3. L. guilcheri, 4. L. russellii, 5. L. johnii, 6. L. argentimaculatus 6. Pristipomoides multidens.
Impact of anthropogenic activities on coastal marine environment and fisheries
Quantification and analysis was carried out for 3 coastal and 4 marine stations. Coastal stations Chitrapur, Panambur and Thaneerbhavi was monitored on a monthly basis along Mangalore coast to assess the impact of anthropogenic activities.
The occurrence of marine litter was quantified. For the first time in the country, the impacts of marine litter in the food chain were observed. Plastic strands were observed in the gut of mackerel and oil sardine. In Mangalore, from the trawl boat landings it was found on routine examination of gut of Mackerel (Fig.1) and Oil Sardine that it had ingested nylon ropes of length 1mm to 4 mm. Sardines and Mackerel are plankton feeders and it could have accidently ingested it along with the plankton. Nylon rope was also observed in the benthos sample collection
Plastic strand found in the gut of mackerel
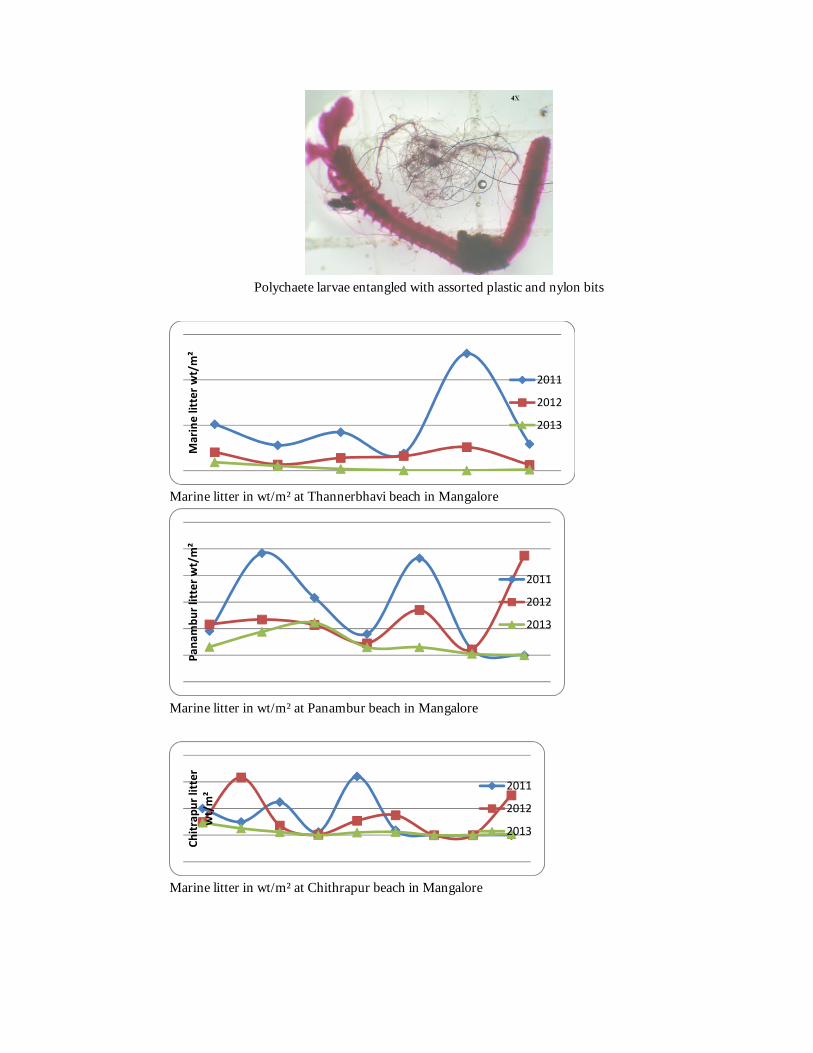
Polychaete larvae entangled with assorted plastic and nylon bits
Marine litter in wt/m² at Thannerbhavi beach in Mangalore
Marine litter in wt/m² at Panambur beach in Mangalore
Marine litter in wt/m² at Chithrapur beach in Mangalore
Mar
ine
litte
r wt/
m²
2011
2012
2013
Pana
mbu
r litt
er w
t/m
²
2011
2012
2013
Chitr
apur
litt
er
wt/
m² 2011
2012
2013
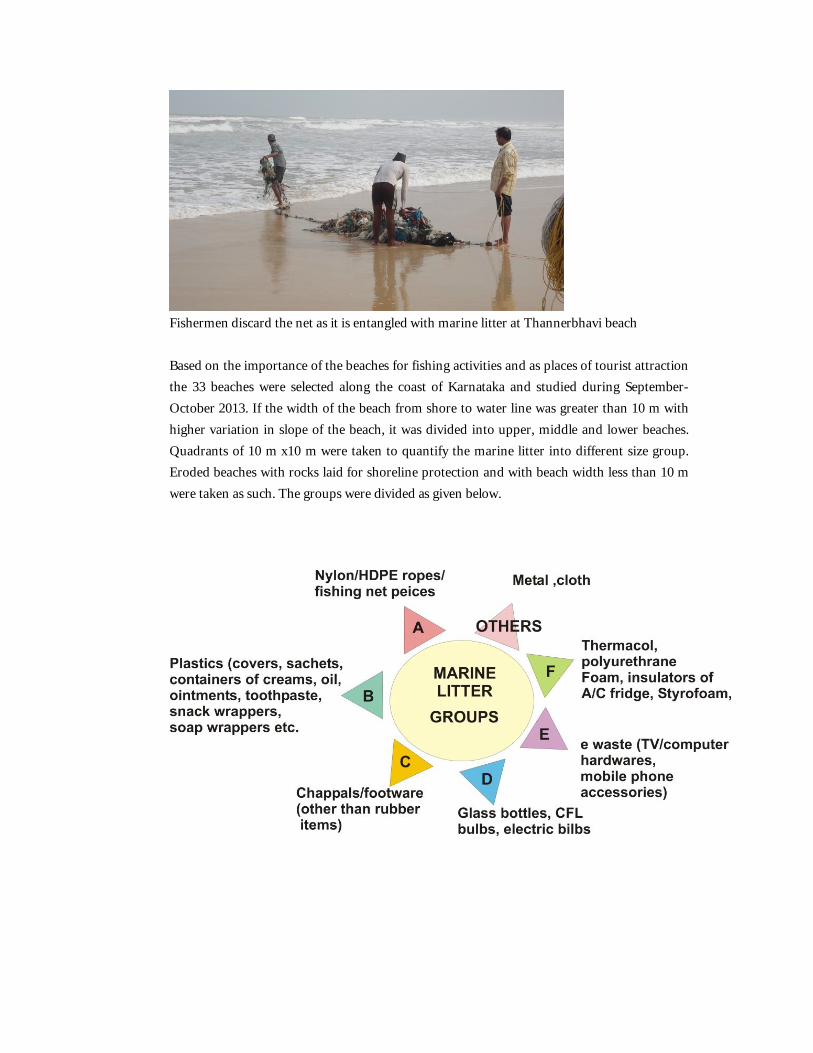
Fishermen discard the net as it is entangled with marine litter at Thannerbhavi beach
Based on the importance of the beaches for fishing activities and as places of tourist attraction the 33 beaches were selected along the coast of Karnataka and studied during September-October 2013. If the width of the beach from shore to water line was greater than 10 m with higher variation in slope of the beach, it was divided into upper, middle and lower beaches. Quadrants of 10 m x10 m were taken to quantify the marine litter into different size group. Eroded beaches with rocks laid for shoreline protection and with beach width less than 10 m were taken as such. The groups were divided as given below.
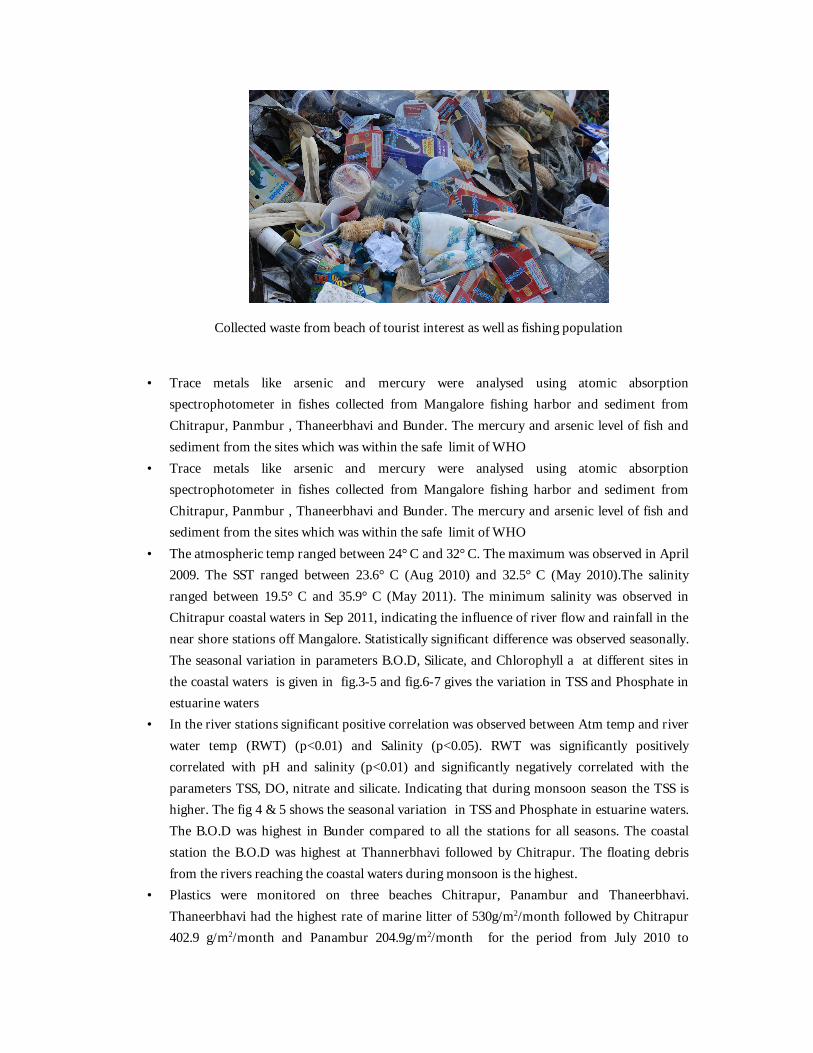
Collected waste from beach of tourist interest as well as fishing population
• Trace metals like arsenic and mercury were analysed using atomic absorption spectrophotometer in fishes collected from Mangalore fishing harbor and sediment from Chitrapur, Panmbur , Thaneerbhavi and Bunder. The mercury and arsenic level of fish and sediment from the sites which was within the safe limit of WHO
• Trace metals like arsenic and mercury were analysed using atomic absorption spectrophotometer in fishes collected from Mangalore fishing harbor and sediment from Chitrapur, Panmbur , Thaneerbhavi and Bunder. The mercury and arsenic level of fish and sediment from the sites which was within the safe limit of WHO
• The atmospheric temp ranged between 24° C and 32° C. The maximum was observed in April 2009. The SST ranged between 23.6° C (Aug 2010) and 32.5° C (May 2010).The salinity ranged between 19.5° C and 35.9° C (May 2011). The minimum salinity was observed in Chitrapur coastal waters in Sep 2011, indicating the influence of river flow and rainfall in the near shore stations off Mangalore. Statistically significant difference was observed seasonally. The seasonal variation in parameters B.O.D, Silicate, and Chlorophyll a at different sites in the coastal waters is given in fig.3-5 and fig.6-7 gives the variation in TSS and Phosphate in estuarine waters
• In the river stations significant positive correlation was observed between Atm temp and river water temp (RWT) (p<0.01) and Salinity (p<0.05). RWT was significantly positively correlated with pH and salinity (p<0.01) and significantly negatively correlated with the parameters TSS, DO, nitrate and silicate. Indicating that during monsoon season the TSS is higher. The fig 4 & 5 shows the seasonal variation in TSS and Phosphate in estuarine waters. The B.O.D was highest in Bunder compared to all the stations for all seasons. The coastal station the B.O.D was highest at Thannerbhavi followed by Chitrapur. The floating debris from the rivers reaching the coastal waters during monsoon is the highest.
• Plastics were monitored on three beaches Chitrapur, Panambur and Thaneerbhavi. Thaneerbhavi had the highest rate of marine litter of 530g/m2/month followed by Chitrapur 402.9 g/m2/month and Panambur 204.9g/m2/month for the period from July 2010 to

December 2011.The items in the marine litter was highly varied ranging from ice cream spoons, caps toothbrush, plastic straw, small bottle caps, plastic sachets, nylon ropes, plastic mats, slipper, shoes, thermocole, sponges etc. The size of the plastic debris ranged from 0.01 cm to 200 cm.
Hg ngm/gm Asngm/gm
Finfish Sardinella longiceps
Arius sp.Sillago sp.
Otolithus sp. 96.099 257.194
Johnius sp.Mackerel
CatfishTherapon sp.
Sciaenids
PomfretSoles
Crab Portunus pelagicus 9.922 38.978Portunus sanguinolentus
Cephalopods Sepia aculeata 198.051 126.449
Prawn Solenocera indica 104.345 397.625M.dobsoni
Hg and As level in sediment for the period
Sediment Hg ngm/gm As ngm/gm
Thanneerbavi 303.305 3885.558
Bunder 302.899 1726.142
Chitrapur 20.469 2152.613
Panambur 140.864 1768.101

Variation in BOD in the coastal waters Variation in silicate in coastal waters
Variation in Chlorophyll Variation in TSS in the estuarine waters
Variation in Phoshate in the estuarine water.
Sea water and plankton samples were collected from 10 meters 12° 54.24' N 74° 47.37'E and 20 meters 12° 54.60' N 74° 47.01'E depth stations off Mangalore. Quantification of the 11 hydrological parameters for the 4 stations monitored was carried out for the year 2007-12.Gut

content of oil Sardine and Mackerel was analysed for estimating the dominant feed. The difference in Ca:Sr ratio of Oil Sardine and Mackerel for the different months was estimated.
The atmospheric temperature ranged between 24.5° C (Jan 2009) and 33.4° C (Oct 2007), while the sea surface temperature ranged between 23.8° C(Aug 2008) and 32.5° C (May 2010). A minimum salinity of 19.5 (Sep 2011) was at Chitrapur and maximum of 35.9° C (May 2011) at 10 m depth surface station. The low salinity was observed in Chitrapur near shore due to the discharge from the rivers Nethravathi and Gurupur during the monsoon. The pH ranged between 7.32 (Aug 2008) at Chitrapur and 8.16 (Dec 2011) in bottom water at 20 m depth. The dissolved oxygen ranged between 1.4ml/l (Nov 2009) 20 m depth bottom and 7.3ml/l (Aug 2007) at Chitrapur. The low dissolved oxygen at the bottom water during the period could be due to upwelling. Mean chlorophyll a was 2.63 mg/m³ and a maximum of 16.585 mg/m³ was observed in 10 m depth bottom water in Oct 2011 which could be due to upwelling. The phosphate ranged between 0.06 µg-at/l and 3.94 µg-at/l. The maximum was observed in June 2011 at Chitrapur. Nitrite ranged between 0.02 and 9.99 µg-at/l (10 m bottom station Nov 2009) and Nitrate varied from below detection level to 17.52 µg-at/l (Chitrapur June 2011).
Highly significant positive correlation was observed between Atm temp and SST during the period. SST was positively correlated (P< 0.01) with salinity and pH. While it was negatively correlated with nutrients silicate (P< 0.01), phosphate (P<0.05) and Nitrate (P<0.01). This indicates that during monsoon season when the temp is less the nutrients are higher. Highly significant negative correlation was observed with silicate and salinity. Significant correlation was observed for Chlorophyll a with Silicate, Phosphate and Nitrite. The zooplankton observed during the period were Copepods, Chaetognaths, Isopods, Decapodlarvae, Lucifer, Cladocera, Cumacea, Medusa, Ctenophores, Siphonophores, polychaetes, pteropods, gastropods, bivalves, echinoderm larvae, salps and doliolids, appendicularia, radiolaria, fish eggs and fish larvae. For the period Copepods (158366 no:s/m3) were dominant and the maximum observed in Aug 2011 followed by Bivalves (145454 no:s/m3) observed in May 2010. At 10 m depth surface station the maximum zooplankton observed was copepods (155543 no:s/m3) followed by Radiolaria (86514 no:s/m3 ). At 20 m depth surface station the maximum bivalves were observed (145454 no:s/m3 followed by Radiolaria 118745 no:s/m3 . At Chitrapur maximum Copepods (158366 no:s/m3) were observed followed by Appendicularia (17233 no:s/m3). The SST was positively correlated with the abundance of Ctenophores (P<0.5), Salps and doliolids (P<0.01) and negatively correlated with the polychaetes (P<0.01). The nutrients phosphate (P<0.05), nitrite and nitrate (P<0.01) were positively correlated with the abundance of polychaetes. Chlorophyll-a was positively correlated with the abundance of polychaetes (P<0.05), Appendicularia and radiolaria (P<0.01). ANOVA showed significant difference in the abundance of polychaetes with respect to station and month. The abundance of Cladocera was positively correlated with pH and dissolved oxygen. The abundance of pteropods was positively correlated (P<0.01) with the nutrient phosphate. Gastropods,

Radiolaria and Chaetognaths (P<0.05) abundance was negatively correlated with dissolved oxygen. This could be due to the higher wind velocity during the period.
The phytoplankton observed along with the zooplankton were Coscinodiscus sp, Chaetoceros, Ceratium sp,, Noctiluca sp, Rhizosolenia sp , Trichodesmium sp Pleurosigma sp Planktoniella sp. and Cyclotella sp. The most dominant was Trichodesmium 203562 no:s/m3 (Oct 2011) in 10 m depth station followed by Coscinodiscus sp (Oct 2011) in 20 m depth. At Chitrapur the maximum was Noctiluca sp (151000 no:s/m3) followed by Coscinodiscus sp (80000 no:s/m3). A dinoflagellate bloom of high magnitude consisting of Noctiluca scintillans (Macartney) was observed along the Mangalore coast on 12.05.2011. It extended from Mangalore bar mouth area to Sasihithlu spanning a distance of about 15 kilometers and to about two kilometers towards west rendering the sea surface a greenish tinge. During the intense period of the bloom the concentration of N. scintillans was around 10.5 lakh cells/l. Chlorophyll-a was positively correlated with the abundance of Coscinodiscus sp (P<0.01), Chaetoceros sp (P<0.05)Trichodesmium sp (P<0.01) and Planktoniella sp (P<0.05).
In Mackerel gut the observed plankton were Coscinodiscus sp, Biddulphia sp, Ceratium sp.,Pleurosigma sp ,Cyclotella sp, Trichodesmium sp, Copepod, Tintinnids, Amphipods, Foraminifera Gastropods, Isopods, Cladocera, Appendicularia , Pteropod, Lucifer, Dentallium , Polychaetes Decapod larvae, Squilla larvae, Mussel larvae, fish eggs and fish larvae . In addition fish scales were also seen. The most dominant phytoplankton was Trichodesmium sp Feb 2008 followed by Coscinodiscus sp Jan 2011. In gut the dominant zooplankton was Foraminifera May 2011 followed by Copepods April 2008
In Sardine gut the observed plankton were Coscinodiscus sp, Chaetoceros sp, Biddulphia sp,Ceratium sp, Pleurosigma sp , Cyclotella sp, Trichodesmium sp, Holopedium sp, Peridinium spCopepod, Amphipods, Cladocera, Appendicularia, Decapod larvae, Lucifer, bivalves, gastropods, fish eggs and fish larvae. . The most dominant phytoplankton was Pleurosigma sp (Feb2010) followed by Coscinodiscus sp (Oct 2007). The dominant zooplankton in the gut was Copepod (March 2011) followed by bivalves (March 2010).
Mackerel catch in the gear mechanized purse seine (MPS) and out board ring seine (OBRS) was negatively correlated (P<0.05) with SST. Maximum catch of Mackerel in Mangalore was in MPS followed by that in Mechanised Trawl net (MTN). OBRS is usually operated in monsoon season in10-20 m depth. There was positive correlation of SST with Mechanised Trawl net (MTN) catch as well as the total catch (P<0.01). This is mainly due the change in depth of operation. Mackerel catch in MTN was positively correlated with salinity and Chlorophll a (P<0.01) and negatively correlated with dissolved oxygen (P<0.01). During upwelling period the DO of bottom water is less. Mackerel catch in MPS showed positive correlation with silicate. As near shore the influence of the discharge of rivers brings in more silicate during monsoon

Oil sardine catch in the gear MPS was negatively correlated with SST and silicate (P<0.05). MPS is usually operated in 10-40m depth off Mangalore.
Ribbon fish catch in the gear MTN was positively correlated with dissolved oxygen and silicate (P<0.05).
S.commersoni (Seerfish) catch in the gear MTN and total Seerfish fish catch in Mangalore was positively correlated with SST (P<0.01). In the gear OBGN the catch was negatively correlated(P<0.05) with Phosphate and nitrate.
Stolephorous (Anchovies) catch in MPS was positively correlated with Chlorophyll a and Nitrite (P<0.01). In MTN the catch was negatively correlated with dissolved oxygen (p<0.05) and positively correlated with pH(p<0.05). The maximum catch was in MTN.
The Ca: Sr ratio of otolith of oilsardine was found to be higher than that of Mackerel in Mangalore (Fig. 1). The highest ratio in oil sardine was observed in October.
Development of fisheries ecosystem restoration plans for critical marine habitats
Three sites, (i) Kudroli were mangroves are planted after partial degradation of natural ecosystem (ii) Thaneerbhavi – non mangrove site (iii) Mulki – natural mangrove site, were monitored for water and sediment quality on a monthly basis during the period.
Field visits to Mangrove areas were carried out and 10 Mangrove species were identified.
Most Mangroves are of the fringing type in linear formations along the river or estuarine banks. Increasing human population in coastal areas is resulting in increased pressure on mangrove ecosystems. Some of the human activities that have resulted in damage to mangrove ecosystem in Mangalore are
The destruction of Mangrove for the formation of buildings, prawn farms and also for timber and fuel wood.
Ca: S
r rat
io
Oil sardine
Mackerel

The disposal of seawage has taken a toll of Mangrove species in Gurupura and Nethravathi river near Mangalore. Mangrove areas are occupied by Acrostichum aureum a fresh water fern.
Plastic debris brought by Gurupura river deposited on the banks of the mangroveAcanthus ilicifolius prevents the growth of seedling.
The Mangrove specimens collected, identified during the period were Rhizophora apiculata, Rhizophora mucronata, Sonneratia caseolaris Acanthus ilicifolius, Bruguiera gymnorrhiza, Kandelia candel, Avicennia alba, Avicennia officinalis, Suaeda nudifloraand Aegiceras corniculatum
The pH maximum of 7.99 was observed in Kudroli in May. Nitrite 3.9 µg-at/l and nitrate 17.854 µg-at/l was observed to be highest in Kudroli during June and July respectively. The maximum salinity of 35.6 ppt was observed in Mulki in May. The maximum silicate of 139.45 µg-at/l was observed in the month of September in Thaneerbhavi. The phosphate 5.04 µg-at/l was highest at Kudroli and Chlorophyll a , Chlorophyll b and Chlorophyll c was also higher compared with other stations. Water temperature was significantly positively correlated with Chlorophyllla , dissolved oxygen and salinity and negatively (p<0.01) with silicate. This indicates the influence of the river discharge and tidal incursions in the sites. Atmospheric temperature was positively correlated with water temp (P<0.01) and salinity (P<0.05). Silicate was significantly negatively (p<0.01) correlated with salinity indicating thatthe river is the source for the silicate.
The variation in sediment texture at the three sites is given in fig.2. The sediment organic carbon fig. 3 was observed to be most stable during the period in Mulki, than at sites Kudroli and Thaneerbhavi. The higher average value was obtained at Kudroli probably due to the influence of city waste flowing into the river from the adjacent site

Trends in organic carbon(%) in the sediment samples at the sites
The dominant zooplankton was decapod larvae at Kudroli (38.20%), Thaneerbhavi (38.39%) and Mulki (38.42%) respectively followed by Chaetognaths at Kudroli (15.62%), Thaneerbhavi (16.11%) and Mulki (16.13%). Chaetognaths, echinoderm larvae and Medusae was significantly positively (p<0.01) correlated with Nitrite. While Penaid prawn and Lucifer (P<0.01) was significantly positively correlated with Chlorophyll a.
The phytoplankton species observed at the sites were Coscinodiscus sp. , Biddulphia sinensis, Thalassiothrix, Asterionella sp, Chaetoceros decipiens, Planktonella sol, Rhizosolenia sp., Skeletonema sp. Fragillaria sp. Cyclotella sp, Ditylum sp, Pleurosigma sp, Triceratium, Ceratium furca, Ceratium tripos, Peridinium depressum, Nitzschia sp. and Trichodesmium sp. Of this the dominant was Coscinodiscus sp at Kuduroli (69.93%), Thaneerbhavi (54.53%) and Mulki (54.5%) respectively. This was followed by Chaetoceros decipiens at Kuduroli (28.23%), Thaneerbhavi (44.04%) and Mulki (44.04%) respectively.

Benthos observed at the sites were copepods, isopods, amphipods, dentallium, cumacea, foraminifera, polychaetes, gastropods, brachyurian crab, mussel larvae, fisheggs and fish larvae. The maximum diversiy was observed in Mulki (12no:s), followed by Thannerbhavi (9no:s) and Kudroli (7 no:s). The dominant group was gastropods(38.3%) in Kudroli followed by polychaetes (35.57%). At Thaneerbhavi the dominant group was dentallium (84.93%) followed by Copepods(8.8%). At Mulki the dominant group was foraminifera (58.54%) followed by gastropods (20.16%) for the period observed from Mar-Dec2011.
The plant height, no: of leaves and no: of branches of Mangrove Rhizophora mucronata planted on 3.5.11 was monitored. The damage by trash, strong current, high waves, heavy wind, soil type, variation in fresh water exposure are some the factors which influenced the growth of seedling of Rhizophora mucronata. Fig.3shows the growth of the Mangrove propagule.
The organic carbon of the sediment varied from 0.15% to 0.69% in Kudroli, 0.06%-0.48% in Thaneerbhavi and 0.18%-0.39% in Mulki site respectively.
A pamphlet was prepared on “ Marine environment and Resources awareness campaign” to create awareness among the School children on World Environment Day and World Oceans day on 6 th and 8th June 2011 respectively. An elocution competition of high school students of Mangalore was also conducted
A rapid assessment was carried out during November 2010 along the coastal and estuarine bivalve fishing areas of the southern coastal district of Karnataka from Ullal in the North to Mulki in the South for identifying areas with different levels of habitat degradation.
The clam beds in Gurpur estuary were selected for the study, where dredging and sand mining activities are rampant in recent past. The loss in the extent of clam bed area due to dredging activities for the construction of a shipbuilding yard at Bengre was documented.
Extent of clam habitat loss: The historic extent of clam bed in 2006, was estimated as 2,03,266 m2. The mangrove patch in the study area was estimated as 53,250 m2 in 2006. In 2010-11 there was total
destruction of bivalve habitat in the dredging area. The existing mangrove coverage is about 13,479 m2
(25.3%) area, which shows that within this small area 39,770 m2 of mangrove habitat or 74.7% historic coverage is destroyed. This estuarine habitat loss is mainly due to the continuous dredging and reclamation activities in the area.
Marine Mammal survey and sighting
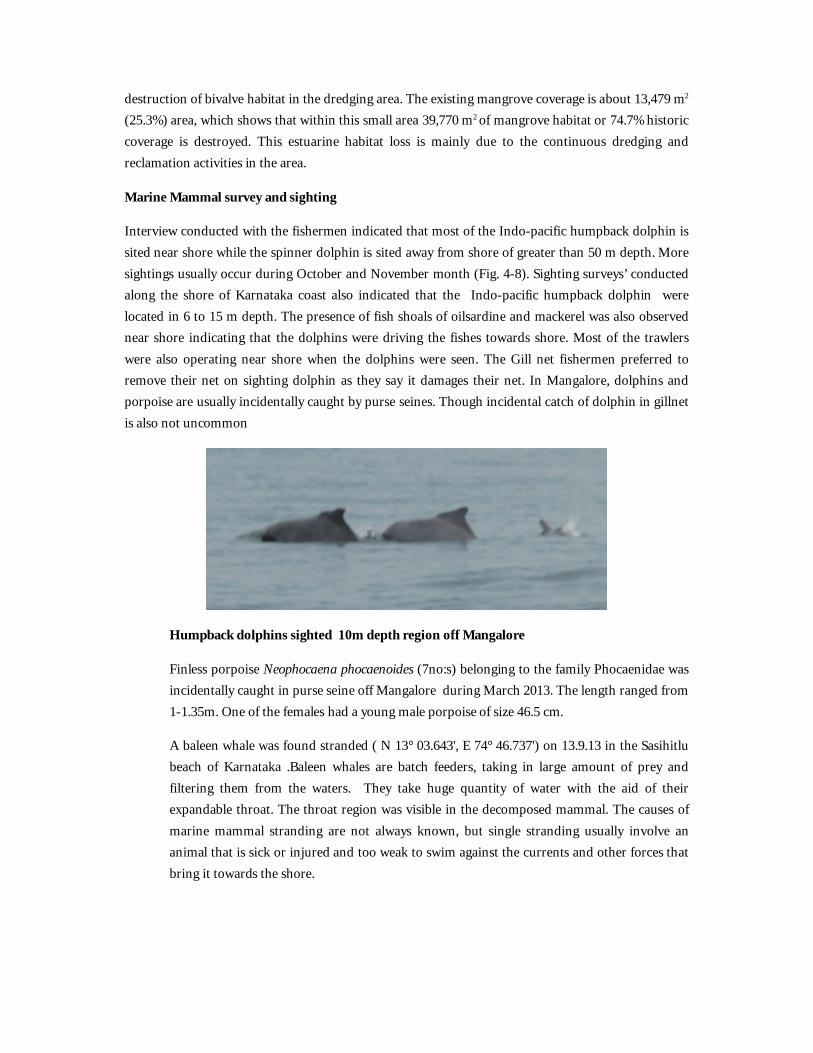
Interview conducted with the fishermen indicated that most of the Indo-pacific humpback dolphin is sited near shore while the spinner dolphin is sited away from shore of greater than 50 m depth. More sightings usually occur during October and November month (Fig. 4-8). Sighting surveys’ conducted along the shore of Karnataka coast also indicated that the Indo-pacific humpback dolphin were located in 6 to 15 m depth. The presence of fish shoals of oilsardine and mackerel was also observed near shore indicating that the dolphins were driving the fishes towards shore. Most of the trawlers were also operating near shore when the dolphins were seen. The Gill net fishermen preferred to remove their net on sighting dolphin as they say it damages their net. In Mangalore, dolphins and porpoise are usually incidentally caught by purse seines. Though incidental catch of dolphin in gillnet is also not uncommon
Humpback dolphins sighted 10m depth region off Mangalore
Finless porpoise Neophocaena phocaenoides (7no:s) belonging to the family Phocaenidae was incidentally caught in purse seine off Mangalore during March 2013. The length ranged from 1-1.35m. One of the females had a young male porpoise of size 46.5 cm.
A baleen whale was found stranded ( N 13° 03.643', E 74° 46.737') on 13.9.13 in the Sasihitlu beach of Karnataka .Baleen whales are batch feeders, taking in large amount of prey and filtering them from the waters. They take huge quantity of water with the aid of their expandable throat. The throat region was visible in the decomposed mammal. The causes of marine mammal stranding are not always known, but single stranding usually involve an animal that is sick or injured and too weak to swim against the currents and other forces that bring it towards the shore.
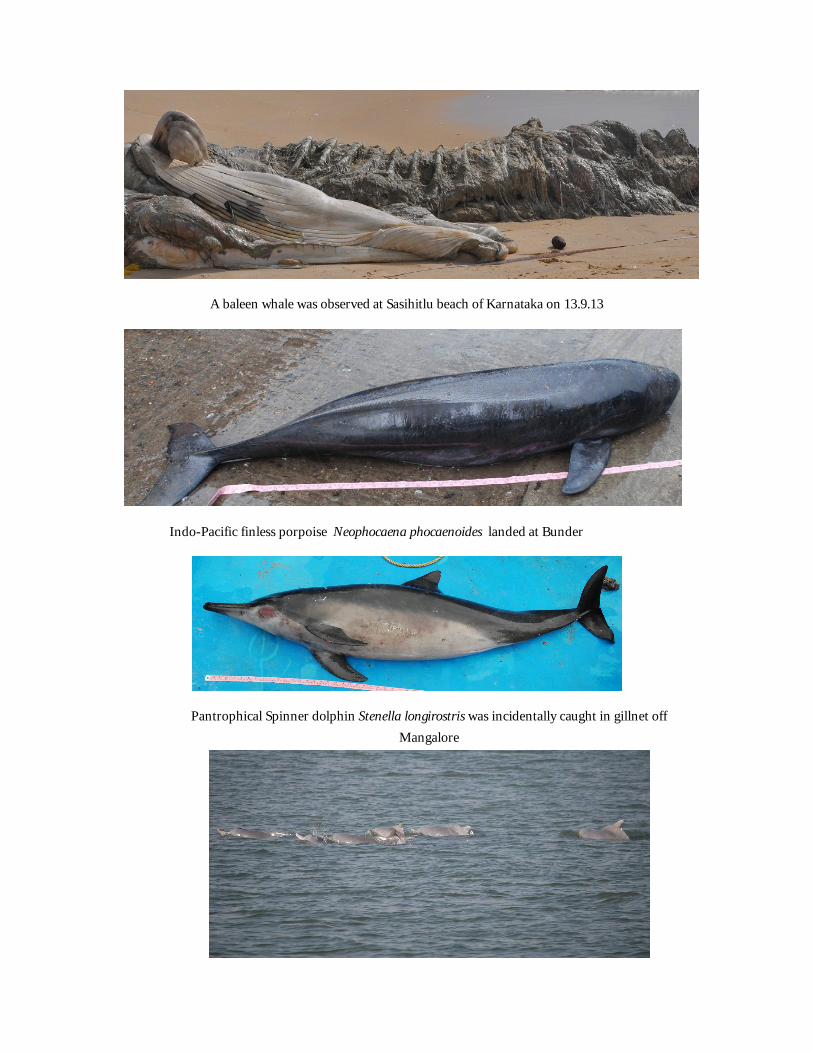
A baleen whale was observed at Sasihitlu beach of Karnataka on 13.9.13
Indo-Pacific finless porpoise Neophocaena phocaenoides landed at Bunder
Pantrophical Spinner dolphin Stenella longirostris was incidentally caught in gillnet off Mangalore
Blowhole visible in the young group of seven Indo-Pacific humpback dolphin Sousa chinensis plumbea type sighted off Mangalore
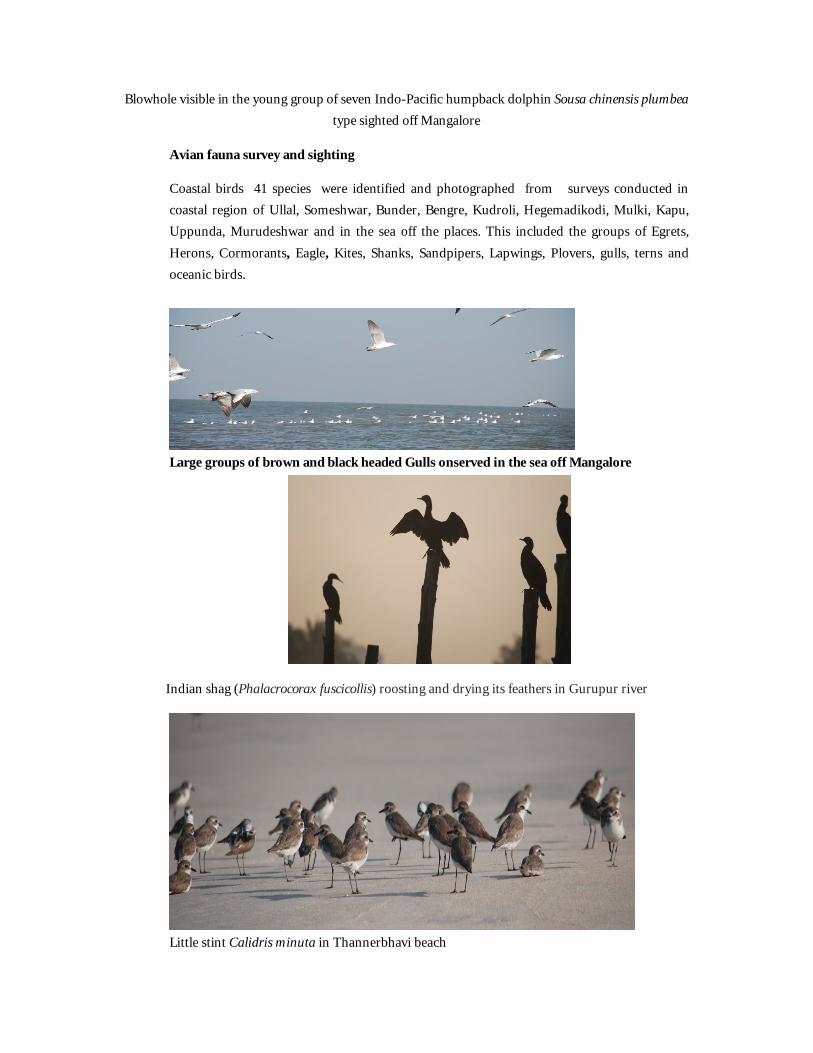
Avian fauna survey and sighting
Coastal birds 41 species were identified and photographed from surveys conducted in coastal region of Ullal, Someshwar, Bunder, Bengre, Kudroli, Hegemadikodi, Mulki, Kapu, Uppunda, Murudeshwar and in the sea off the places. This included the groups of Egrets, Herons, Cormorants, Eagle, Kites, Shanks, Sandpipers, Lapwings, Plovers, gulls, terns and oceanic birds.
Large groups of brown and black headed Gulls onserved in the sea off Mangalore
Indian shag (Phalacrocorax fuscicollis) roosting and drying its feathers in Gurupur river
Little stint Calidris minuta in Thannerbhavi beach

Rare bobbies observed off Mangalore
Economics of Marine Fisheries and Sustainable Management :Policy Issues and Interventions
Data was collected from January 2013 to December 2013 on the average operating cost, operating ratio and labour productivity of 10 units of multiday trawlers, 10 purse seiners/ month, 10 Single day trawlers and 10 gill netters/month from Mangalore Fisheries Harbour, Dakshina Kannada, and Malpe Fisheries harbor, Udupi district, Karnataka. The economic performance of the multiday trawler was found to be best at Mangalore
during the month of January, 2013 when compared to other months. The average operating cost worked out to be Rs. 37,690 per trip with a net operating income of Rs. 2, 25,100 and with a operating ratio of 0.13. The labour productivity was found to be 142.6 kg/crew/trip.
The economic performance of multiday trawlers at Malpe was found to be less when compared to Mangalore with an average operating ratio of 0.72 and a labour productivity of 700.4 kg/crew/trip.
The capital productivity of Purse-seiner at Mangalore was highest during the month of January 2013. The average operating cost of a purse seiner was found to be highest during January 2013 with an operating ratio of 0.20 and labour productivity of 82.6 kg/crew/trip.
The operating cost of motorized gill netter ranged from as low as Rs.5697/trip during December 2013 to as high as Rs.23903/trip during October 2013. The capital productivity ranged from 0.60 to 0.63.The labour productivity ranged from 17.09 in November 2013 to 65.00 in October 2013.
Remote sensing assisted bio dynamic forecasting paradigm for Indian Marine Fishery Resources
Protocols for geo referenced in situ sampling were finalized. Sampling to be done once in a month on odd or even day between 10.30 hrs and 14.30 hrs based on satellite passing over the country. Four depth stations were fixed 10, 20, 30 and 40 m depths off Mangalore.

Water, plankton and sediment samples were collected from prefixed depth stations and trawling was done parallel to the coast at 40 m depth station. Water samples were analysed for different physic-chemical parameters (turbidity, Salinity, temperature, pH, dissolved oxygen, Chlorophyll, alkalinity, nitrate, nitrite, silicate and phosphate). Phytoplankton, zooplankton and benthos collected were analysed for quantitative and qualitative abundance.Species composition, abundance of fish caught during trawling was estimated. Important biological characteristics of fishes landed in the trawling conducted at 40 m depth were analysed.
Development of fishery Management Plans (FMPs) for the bivalve fisheries of India
Clams form an important resource of the estuaries along Karnataka coast. Clam landings were estimated from important estuaries of Karnataka. The estimations were made from Netravathi, Gurupur, Mulki, Udyavara, Swarna, Sita, Coondapur, Uppunda, Venkatapur, Sharavathi, Aghanashini, Gangavali and Kali estuaries of Karnataka
Clam production in Karnataka

Species compostion of clams in Karnataka
MC: M casta; MM: M.meretrix; PM: P.malabarica; MO: Marcia opima; VC: V. Cyprinoids
The mussel landing in the Karnataka coast was estimated from Someshwara, Thaneerbavi, Surathkal, Kaup, Malpe, Gangolli, Trassi, Kanchikodi, Nagur, Byndoor, Shiroor, Bhatkal, Jali, Murudeshwara, Harwada, Belekeri and Ankola. Perna viridis was the only species represented in the catch
Mussel production in Karnataka
Development of strategies to sustain stock and fishery of large pelagics of the Indian Coast
Taxonomy, fishery, biology and distribution of major large pelagic species were studied. Resources studied included tunas, billfishes, swordfishes, seerfish, barracuda, dolphinfish, cobia and queenfishes. During the year five species of tunas (E.affinis, T.tonggol, T.albacares, A.thazard, A.rochei), two species of seerfishes (S.commerson, S.guttatus), three species of barracudas (S.baracuda, S.puntname, Sobtusata), one species of dolphinnfish (C.hippurrus), one species of cobia (R.canadum), three species of queenfishes (S.tol, S.tala, S.commersonianus) and two species of billfish (I.platypterus, M.indica) were studied.
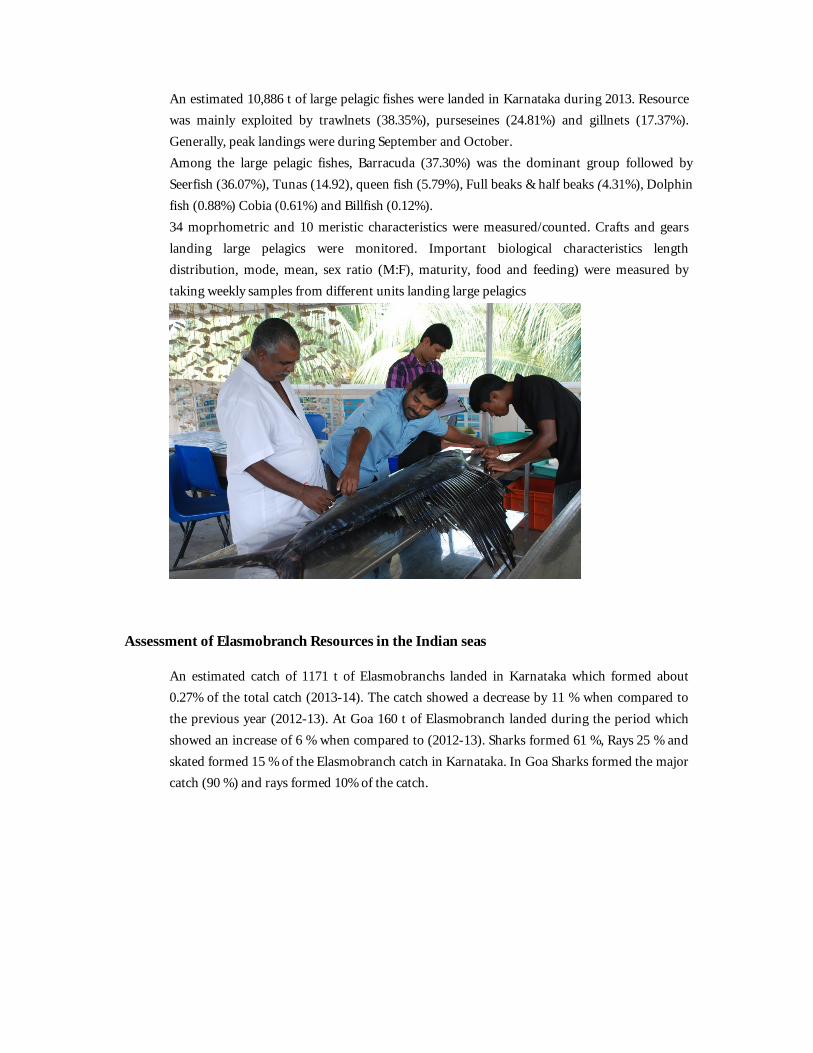
An estimated 10,886 t of large pelagic fishes were landed in Karnataka during 2013. Resource was mainly exploited by trawlnets (38.35%), purseseines (24.81%) and gillnets (17.37%). Generally, peak landings were during September and October.Among the large pelagic fishes, Barracuda (37.30%) was the dominant group followed bySeerfish (36.07%), Tunas (14.92), queen fish (5.79%), Full beaks & half beaks (4.31%), Dolphin fish (0.88%) Cobia (0.61%) and Billfish (0.12%).34 moprhometric and 10 meristic characteristics were measured/counted. Crafts and gears landing large pelagics were monitored. Important biological characteristics length distribution, mode, mean, sex ratio (M:F), maturity, food and feeding) were measured by taking weekly samples from different units landing large pelagics
Assessment of Elasmobranch Resources in the Indian seas
An estimated catch of 1171 t of Elasmobranchs landed in Karnataka which formed about 0.27% of the total catch (2013-14). The catch showed a decrease by 11 % when compared to the previous year (2012-13). At Goa 160 t of Elasmobranch landed during the period which showed an increase of 6 % when compared to (2012-13). Sharks formed 61 %, Rays 25 % and skated formed 15 % of the Elasmobranch catch in Karnataka. In Goa Sharks formed the major catch (90 %) and rays formed 10% of the catch.

Sustainable Molluscan Mariculture Practices
In Multi-trophic approach, aquaculture of organisms that extract either dissolved inorganic nutrients (seaweeds) or particulate organic matter, such as bivalves (mussel) are combined with farming of fed organisms, (finfish/ shellfish), for balancing the biological and chemical processes in the farm site. Besides environmental sustainability, it provides economic diversification and reduces the economic risk when appropriate species are chosen for farming.On Nov 30th 2012, 50 seeded ropes were transported from Saligrama (Sita estuary, Udupi District) to Karwar for farming in open-sea rafts near marine finfish cages. Earlier, mussel seeds for seeding the rope were collected from Someshwara, (Dakshina Kannada District) and transported to Saligrama. Seeding was carried out by the mussel farmers of Saligrama on 24mm PP ropes. Seeded ropes were suspended on estuarine racks in Sita estuary till

November last week and transported to Karwar. On the first week of January, the second batch consisting of 100 no of 1m ropes and 17 no of 2m ropes were transported to Karwar. Raft frame was fabricated by welding two numbers of 1.5 inch GI pipes, spaced at 0.5 m on four sides. Eight empty oil barrels of 200 l capacity were filled with compressed air was used as floats by placing between the GI pipes. The 6 x 6 m outer frame was moored at 6 m water depth using concrete blocks. Bamboo poles of 5-6 m length were fixed horizontally on the raft frame for suspending the mussel ropes. The raft was placed near the finfish cages. Mussel growth in IMTA site (Karwar) was compared with the growth rate of farmed mussel in estuarine sites at Saligrama. The mussel growth rate and environmental parameters in the farming site were monitored.
Mussel ropes were partially harvested from estuarine farms in Udupi district from first week of March to May 2013. The mussel grow-out ropes were suspended from racks, installed by fishermen groups in the previous season.
Farmed mussel production trends in Karnataka
Rock oyster, Saccostrea cucullata are widespread in marine intertidal and estuarine areas, cemented to rocky/ hard habitats. This oyster forms part of the fouling communityand they are found attached on seawalls and underwater structures. Saccostrea cucullata, distributed in the Indo-Pacific region is farmed commercially in Malaysia, Thailand, Philippines and Australia. The commercial size of exploitation of S. cucullata is 40-60 mm in shell height along the India coast.
The rock oysters of 32.8±4.03 mm in the size range of 25-38 mm were stocked in netlon trays of 50 x 50 x 10 cm @ 16 kg/sq.m during November 2013 in Mulki estuary. The salinity in the culture site varied between 32 to 34.5 psu. The growth rates and survival of the oysters in the trays were monitored (Fig. 3&4). The mean monthly growth rate recorded was 1.87mm ranging from 0.86 to 2.89 mm in different units

Growth in shell height (±SD) of Saccostrea cucullata in estuarine trays
Mean Monthly Growth Rate of Saccostrea cucullata in estuarine trays
Capacity Development for Ecosystem Based Responsible Fisheries Management In India-A Co-learning Action Research
A study was undertaken to identify the factors for migration and the push and pull factors for the same in the primary sector especially the multiday trawl laborers of Mangalore Fisheries Harbour. Four main factors of migration were identified namely lack of employment, less wages in the agricultural sector, drought incidence and lack of own land for cultivation in their native districts of Villupuram and Ramanathapuram respectively. It could be observed that the push factors for migration were the same as the main
factors for migration. Under pull factors, it could be observed that, sustained income from fisheries sector, higher wages in fisheries sector, ability to maintain families and ability to save for the families scored high among the migrants from Villupuram district.
With respect to migrants from Ramanathapuram district, it was observed that revealed that lack of employment was ranked as the foremost important factor for migration, (Rank I) followed by relatively large family size of the migrants from Ramanathapuram (Rank II). Less income from the primary sector of marine fisheries
30
35
40
45
Exp.1 Exp.2 Exp.3 Exp.4 Exp.5
Len
gth
(m
m)
Final size Initial size
0.0
0.5
1.0
1.5
2.0
2.5
3.0
Exp.1 Exp.2 Exp.3 Exp.4 Exp.5
Gro
wth
Rat
e (m
m)

in Ramanathapuram district was ranked as third in order. Fewer wages in the agricultural sector of Ramanthapuram was ranked as fourth in order of importance.
The pull factors for migration as perceived by 98 percent of migrants were, more employment opportunities and higher wages in the fisheries sector of Dakshina Kannada district. Higher wages in the fisheries sector, followed by ability to maintain their families in native districts and ability to save for their families were other pull factors enumerated by 97.00, 96.00 and 92.00 percent of the migrants respectively.
Marine Census 2010
Karnataka Marine fishery profile at a glance
Coastline (km) 300No. of landing centres 96No. of fishing villages 144No. of fisher families 30,713Fisher folk population 1,67,429Active fishermenFull time 32,037Part time 6,657Occasional 2,062No. of fishing craftsMechanized 1,045Motorized 1,211Non-mechanized 4,544Fish production (2009) (t) 4,74,981(Source: Marine Fisheries Census, 2010)
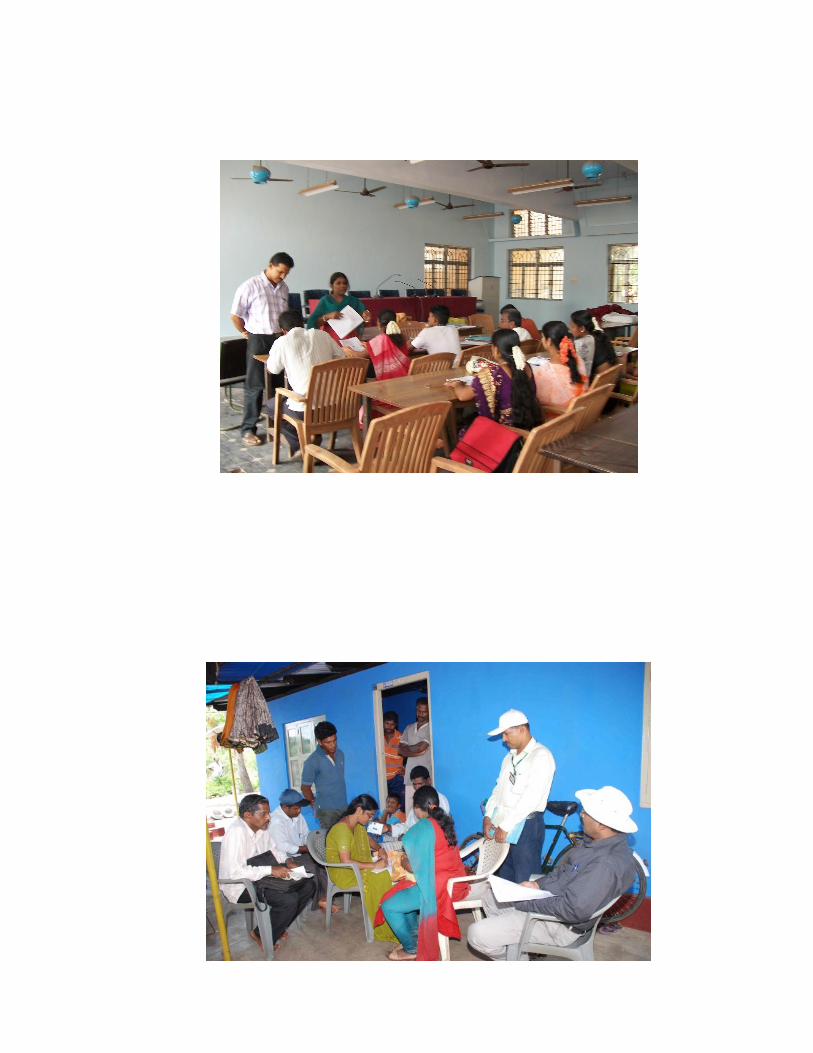
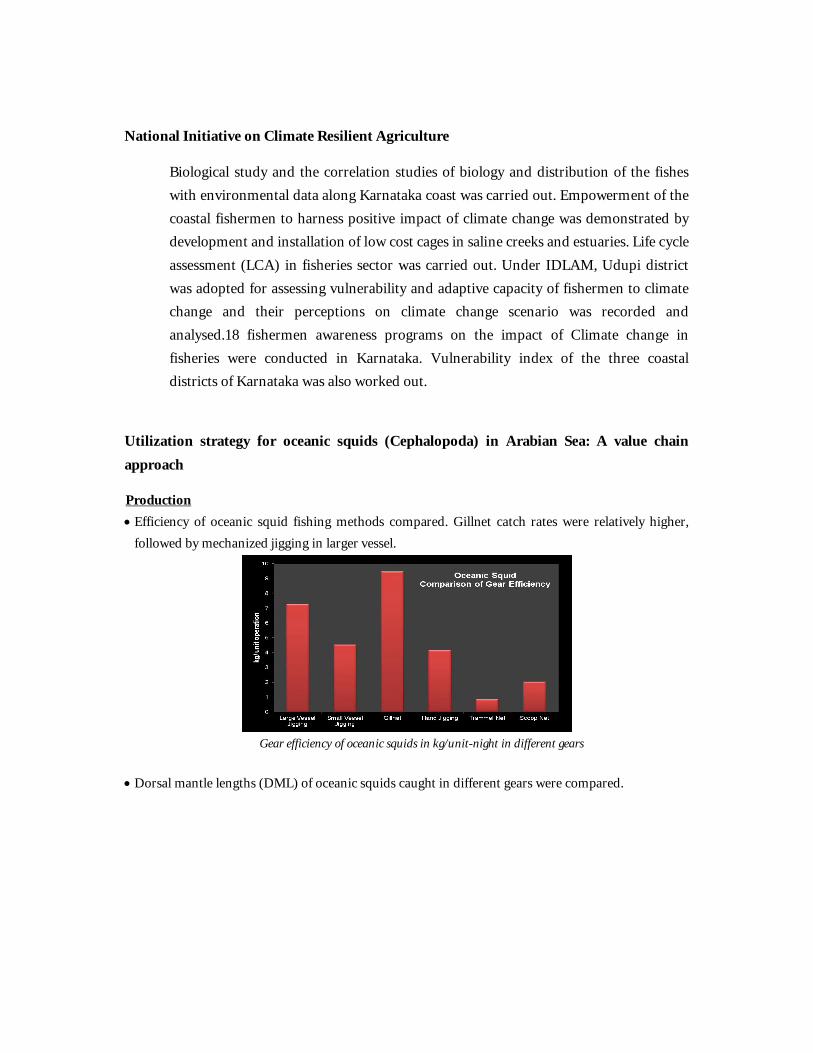
National Initiative on Climate Resilient Agriculture
Biological study and the correlation studies of biology and distribution of the fishes with environmental data along Karnataka coast was carried out. Empowerment of the coastal fishermen to harness positive impact of climate change was demonstrated by development and installation of low cost cages in saline creeks and estuaries. Life cycle assessment (LCA) in fisheries sector was carried out. Under IDLAM, Udupi district was adopted for assessing vulnerability and adaptive capacity of fishermen to climate change and their perceptions on climate change scenario was recorded and analysed.18 fishermen awareness programs on the impact of Climate change in fisheries were conducted in Karnataka. Vulnerability index of the three coastal districts of Karnataka was also worked out.
Utilization strategy for oceanic squids (Cephalopoda) in Arabian Sea: A value chain approach
Production Efficiency of oceanic squid fishing methods compared. Gillnet catch rates were relatively higher,
followed by mechanized jigging in larger vessel.
Gear efficiency of oceanic squids in kg/unit-night in different gears
Dorsal mantle lengths (DML) of oceanic squids caught in different gears were compared.
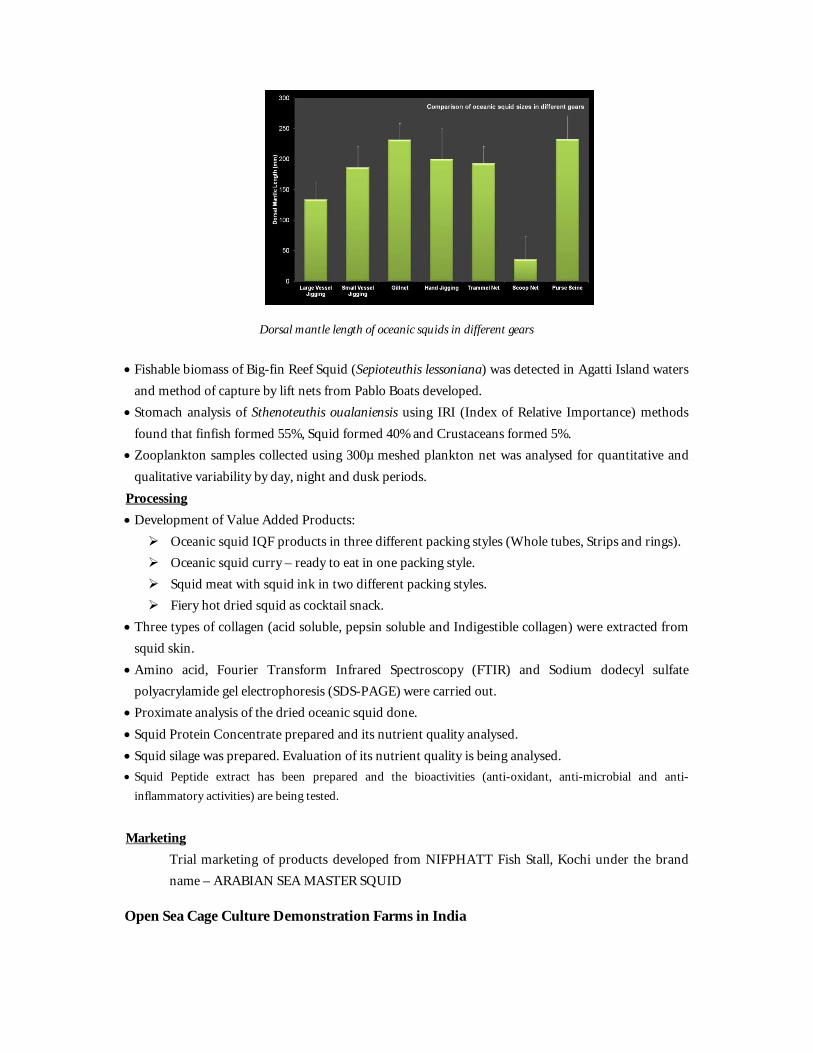
Dorsal mantle length of oceanic squids in different gears
Fishable biomass of Big-fin Reef Squid (Sepioteuthis lessoniana) was detected in Agatti Island waters and method of capture by lift nets from Pablo Boats developed.
Stomach analysis of Sthenoteuthis oualaniensis using IRI (Index of Relative Importance) methods found that finfish formed 55%, Squid formed 40% and Crustaceans formed 5%.
Zooplankton samples collected using 300µ meshed plankton net was analysed for quantitative and qualitative variability by day, night and dusk periods.
Processing Development of Value Added Products: Oceanic squid IQF products in three different packing styles (Whole tubes, Strips and rings). Oceanic squid curry – ready to eat in one packing style. Squid meat with squid ink in two different packing styles. Fiery hot dried squid as cocktail snack.
Three types of collagen (acid soluble, pepsin soluble and Indigestible collagen) were extracted from squid skin.
Amino acid, Fourier Transform Infrared Spectroscopy (FTIR) and Sodium dodecyl sulfate polyacrylamide gel electrophoresis (SDS-PAGE) were carried out.
Proximate analysis of the dried oceanic squid done. Squid Protein Concentrate prepared and its nutrient quality analysed. Squid silage was prepared. Evaluation of its nutrient quality is being analysed. Squid Peptide extract has been prepared and the bioactivities (anti-oxidant, anti-microbial and anti-
inflammatory activities) are being tested.
MarketingTrial marketing of products developed from NIFPHATT Fish Stall, Kochi under the brand name – ARABIAN SEA MASTER SQUID
Open Sea Cage Culture Demonstration Farms in India
Cage culture has been initiated along the coast of India as an alternative fish source in the present scenario of dwindling fish production. By designing and propagating this cage to rear fishes (finfishes and shellfishes) will boost the aquaculture production of the state and also empower the fishermen to increase the production and provide alternate livelihood in lean fishing period. Kundapura area in Udupi district is known for aquaculture practice for long time and shrimp farming was the main vocation of many entrepreneurs in the area. Due to the recent setbacks in shrimp farming they are looking into diversification of farming to finfishes. Many progressive shrimp farmers are interested in finfish culture and this new venture of cage culture has raised new hopes in them. Identification of the fast growing fishes , rearing the fishes in the cages and creating awareness among the fisher folks would go a long way in boosting fish production in the state.Developing offshore cage farming is not only a matter of promoting mariculture or fishery industry, but also it will create significant social-economic influences in future. With marine fish production getting stagnated due toincreasing fishing pressure on the natural fish stocks, coupled with an increasing demand for fish, it is expected that the demand will not be met from the present natural harvest. In this current scenario the only alternative is to adopt and practice location specific mariculture activities. Developing offshore cage farming is an important way to empower fishermen to take up as an alternate vocation. Developing offshore cage farming will help in expanding the space for mariculture without occupying precious land in pristine marine condition without eutrophication and pollution. Therefore, it is an eco-friendly practice. The development of offshore cage culture augments not only the income generation and employment opportunities for fishermen, but also promotes ancillary employment avenues for manufacturing off-shore cages and accessory instruments/ equipments for monitoring, grading, feeding etc.
The seabass fry (45-55 mm) were procured from Rajiv Gandhi Centre for Aquaculture (RGCA), Shirgali on 9th September, 2009 and transported to Deejay hatchery, Uttara Kannada, Karnataka..
Hatchery Rearing
Larval rearing in cement tanks has evolved through repeated trials for the seabass seeds during the past few years. The rearing of seabass was carried out in indoor facilities. The seabass juveniles of 45 mm size was stocked in cement tanks of 15 t capacity at the rate of 500 nos/ m3 and the larger juveniles were stocked at 233 nos/ m3.
Sorting Due to differential growth and highly cannibalistic nature of the species, periodic grading of uniformed sized seabass was carried out to minimise cannibalism. The grading
was done at two weeks interval. Growth was monitored regularly and growth rate is given in Fig 1.
Nursery Rearing
The advanced fingerlings with an average size of 20 g from the hatchery were stocked in floating nursery cages moored in earthern ponds. Earthen ponds proximate to the estuarine area at Byndoor, (Uttara Kannada District) was selected with depth ranging from 1 to 1.5 m. The pond was filled with water (27 to 33 ppt) during high tide directly from the Byndoor river mouth.
Cage fabrication: The net cages were fabricated using PE net webbing of 15 mm initially. Square cages of 2 x 2 x 1 m were kept afloat by hanging from HDPE frames of 3” diameter. Each square cage was fixed with a 1” diameter HDPE frame filled with sand and sealed as counterweight. The units were allowed to float in the water column of 1.2 to 1.5 m depth for facilitating easy removal of food material and water exchange in the bottom.
Stocking: The seabass fingerlings were transported from the hatchery during early morning hours by road in aerated tanks. They were transferred to the floating cages in the pond at the rate of 700 nos/ cage, with an effective stocking density of 175 nos./ cu. m. The cages were fastened to wooden poles fixed near the catwalk initially to facilitate feeding. Eventually the cages were allowed to float freely inside the pond for better water movement.
Feed & feeding: Feeding began 1 day after stocking at the rate of 8% of the body weight twice daily. The amount fed weekly followed a theoretical regime starting at 7% and declining to 5% for compounded feed and 15% to 10% wet feed mixture.
Monitoring: The net cages were checked daily after feeding and periodically cleaned to allow water circulation inside the cage. Harvesting: The seabass seeds were harvested by lifting the net cages and transported to the grow-out site in aerated tanks. Average growth of fish in pond was about 80-100 gms with a survival of 80 %.
Grow-out in floating cages
Cage Installation: Circular cages of 6m diameter was installed during the December 2009. The inner net comprising of 24 mm mesh sized net webbing was fixed to the upper cage frame. The outer predator net of 7 m diameter fabricated using 40 mm mesh size was fixed to the cage frame. The counter weight consisted of a 2.5” HDPE pipes filled with 100 kg iron chain was fixed to the predator net.
Stocking: Seabass of 160-205 mm length and weight of 80-100 g were stocked in two circular cages at a stocking density of 3,500 cage with 3.5 m net webbing in two batches.
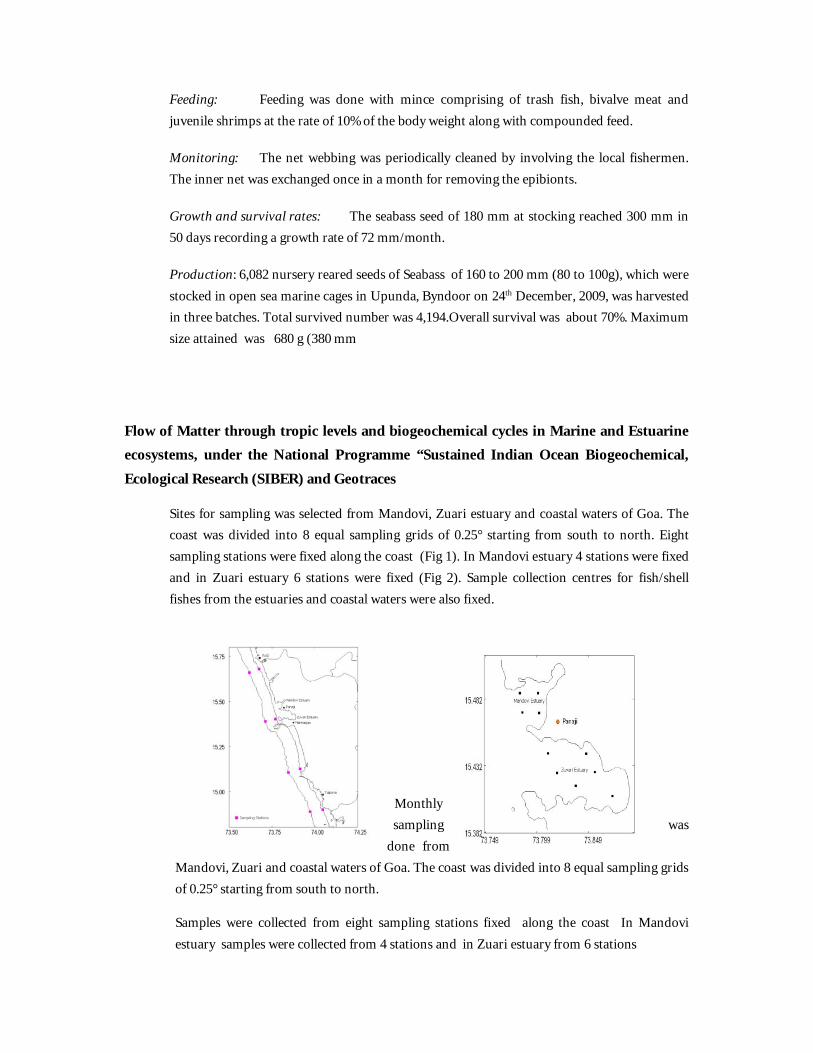
Feeding: Feeding was done with mince comprising of trash fish, bivalve meat and juvenile shrimps at the rate of 10% of the body weight along with compounded feed.
Monitoring: The net webbing was periodically cleaned by involving the local fishermen. The inner net was exchanged once in a month for removing the epibionts.
Growth and survival rates: The seabass seed of 180 mm at stocking reached 300 mm in 50 days recording a growth rate of 72 mm/month.
Production: 6,082 nursery reared seeds of Seabass of 160 to 200 mm (80 to 100g), which were stocked in open sea marine cages in Upunda, Byndoor on 24th December, 2009, was harvested in three batches. Total survived number was 4,194.Overall survival was about 70%. Maximum size attained was 680 g (380 mm
Flow of Matter through tropic levels and biogeochemical cycles in Marine and Estuarine ecosystems, under the National Programme “Sustained Indian Ocean Biogeochemical,
Ecological Research (SIBER) and Geotraces
Sites for sampling was selected from Mandovi, Zuari estuary and coastal waters of Goa. The coast was divided into 8 equal sampling grids of 0.25° starting from south to north. Eight sampling stations were fixed along the coast (Fig 1). In Mandovi estuary 4 stations were fixed and in Zuari estuary 6 stations were fixed (Fig 2). Sample collection centres for fish/shell fishes from the estuaries and coastal waters were also fixed.
Monthly sampling was
done from Mandovi, Zuari and coastal waters of Goa. The coast was divided into 8 equal sampling grids of 0.25° starting from south to north.
Samples were collected from eight sampling stations fixed along the coast In Mandovi estuary samples were collected from 4 stations and in Zuari estuary from 6 stations

Data collection on primary production, zooplankton estimation, benthos and fishes of different ecological groups were completed from Mandovi and Zuari estuary and coastal waters of Goa.
Data on L/F and other population parameters for biomass estimation for 85 species completed during the period.
The diet data was analysed using index of preponderance , volume method and percentage of occurrence. Diet matrix of 120 species of finfishes studied during the period
Preliminary non validated estimates of the biomass of six major groups completed for mandovi estuary.
Population parameters of major groups in Mandovi estuary done during the period. Further work is in progress
Satellite Telemetry studies on Migration patterns of Tunas in Indian Seas
Tagging with pop-up tags of highly migratory fishes was found to be a good method to collect data on the movement of tunas. With this aim the present project was envisaged and proposed by Indian National Centre for Ocean Information Services (INCOIS) in December 2010.INCOIS has been providing Potential Fishing Zone (PFZ) Advisories to the fishermen community. The PFZ advisory predicts the possible fishing grounds in the ocean and has limitation in predicting the availability of species types. Keeping in view of this INCOIS has planned to develop species specific forecasts for few commercially important species. The tagging data could help in incorporating more parameters so as to enhance the accuracy levels for the prediction of the probable tuna fishing grounds. It was decided to have the complete baseline information on the environmental and biological parameters related to Tuna that helps in evolving better management procedures and accurate prediction to enhance the production. In this context a collaborative program on the above aspects with four national organizations having expertise in different aspect in satellite tracking, fishery biology, stock population, deep sea surveys, etc were brought under one umbrella to get a holistic picture on the movement, stock structure, abundance and life history traits of yellowfin tuna in the Indian Ocean. The collaborating organizations were Central Marine Fisheries Research Institute (CMFRI), Fishery survey of India (FSI) and Centre for Marine Living (CMLRE).
The main objectives of this study were to:
To develop the baseline database on the environmental and biological parameters influencing the tuna migration and breeding.
To develop and improve the Tuna Fishery Forecast System (TUFFS) with better accuracy levels in predicting the probable tuna fishing grounds

The main activities assigned to CMFRI were:
Activities assigned
Tuna tagging with pop-up tags onboard commercial tuna boatsHydrographic data collection at tagging pointAnalysis of tagging dataBiology of tunaAnalysis of ichthyoplankton samples collected
Tagging with pop-up tags of these highly migratory fishes was found to be a good method to collect data on the movement of tunas. Tagging were carried out off Mangalore, Visakhapatnam and off Lakshadweep Islands
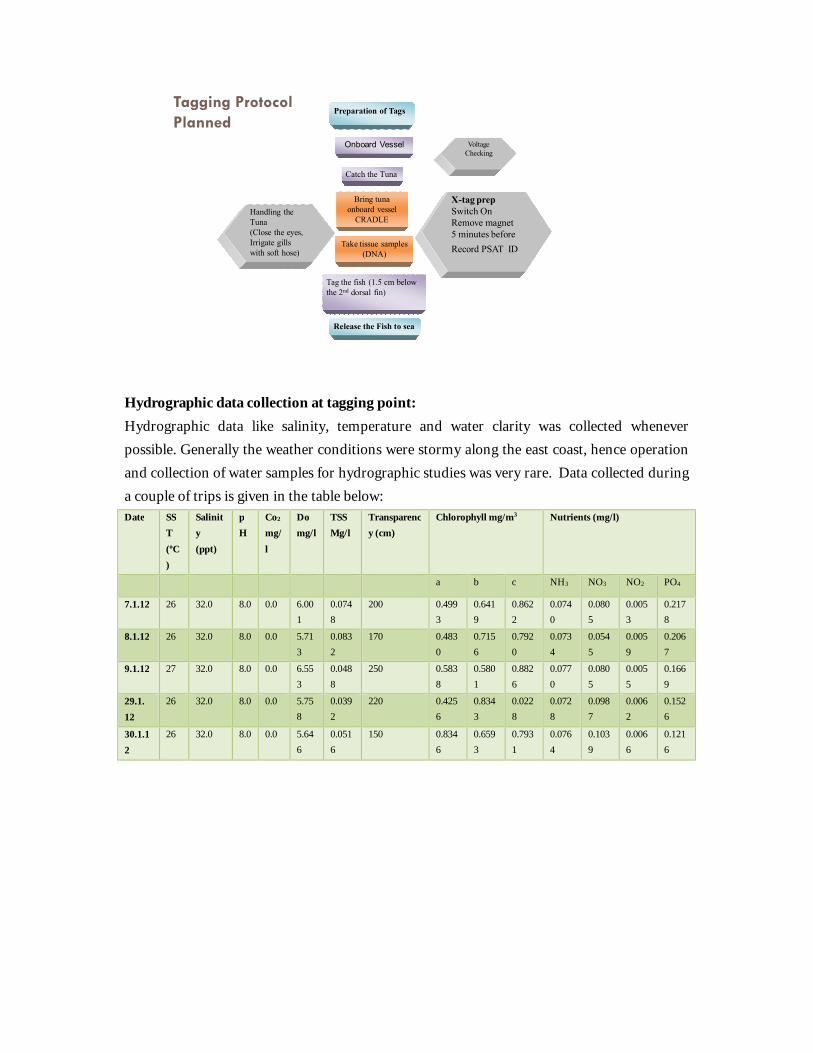
Tagging Protocol Planned
Onboard Vessel
Bring tuna onboard vessel
CRADLEHandling the Tuna(Close the eyes, Irrigate gills with soft hose)
X-tag prepSwitch On Remove magnet 5 minutes before
Record PSAT ID
Catch the Tuna
Take tissue samples (DNA)
Tag the fish (1.5 cm below the 2nd dorsal fin)
Voltage Checking
Preparation of Tags
Release the Fish to sea
Hydrographic data collection at tagging point:Hydrographic data like salinity, temperature and water clarity was collected whenever possible. Generally the weather conditions were stormy along the east coast, hence operationand collection of water samples for hydrographic studies was very rare. Data collected during a couple of trips is given in the table below:Date SS
T
(oC)
Salinity
(ppt)
pH
Co2
mg/
l
Domg/l
TSSMg/l
Transparency (cm)
Chlorophyll mg/m3 Nutrients (mg/l)
a b c NH3 NO3 NO2 PO4
7.1.12 26 32.0 8.0 0.0 6.001
0.0748
200 0.4993
0.6419
0.8622
0.0740
0.0805
0.0053
0.2178
8.1.12 26 32.0 8.0 0.0 5.713
0.0832
170 0.4830
0.7156
0.7920
0.0734
0.0545
0.0059
0.2067
9.1.12 27 32.0 8.0 0.0 6.553
0.0488
250 0.5838
0.5801
0.8826
0.0770
0.0805
0.0055
0.1669
29.1.12
26 32.0 8.0 0.0 5.758
0.0392
220 0.4256
0.8343
0.0228
0.0728
0.0987
0.0062
0.1526
30.1.12
26 32.0 8.0 0.0 5.646
0.0516
150 0.8346
0.6593
0.7931
0.0764
0.1039
0.0066
0.1216
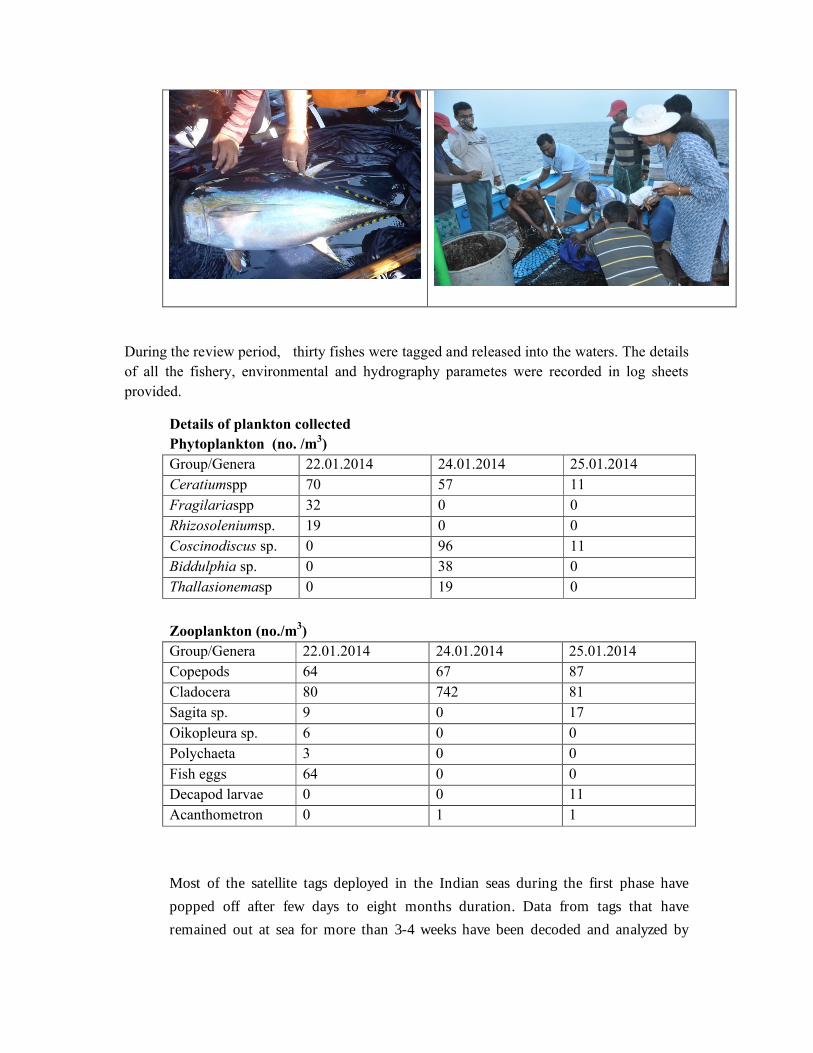
During the review period, thirty fishes were tagged and released into the waters. The details of all the fishery, environmental and hydrography parametes were recorded in log sheets provided.
Details of plankton collectedPhytoplankton (no. /m3)Group/Genera 22.01.2014 24.01.2014 25.01.2014Ceratiumspp 70 57 11Fragilariaspp 32 0 0Rhizosoleniumsp. 19 0 0Coscinodiscus sp. 0 96 11Biddulphia sp. 0 38 0Thallasionemasp 0 19 0
Zooplankton (no./m3)Group/Genera 22.01.2014 24.01.2014 25.01.2014Copepods 64 67 87Cladocera 80 742 81Sagita sp. 9 0 17Oikopleura sp. 6 0 0Polychaeta 3 0 0Fish eggs 64 0 0Decapod larvae 0 0 11Acanthometron 0 1 1
Most of the satellite tags deployed in the Indian seas during the first phase have popped off after few days to eight months duration. Data from tags that have remained out at sea for more than 3-4 weeks have been decoded and analyzed by

INCOIS. Preliminary information on the movement of tunas in the Indian seas has been obtained (fig.1). In most of the cases, tunas have remained within the Indian EEZ. Information on the number of dives made during a 24hour period, the temperature preference of the fish and the general track has been identified. A collaborative meeting is proposed to carry out detailed analysis f the data collected.
Global learning for local solutions: Reducing vulnerability of marine-dependent coastal communities
Review of literature completed Climate change and Fisheries sector Socio economic aspects of climate change and vulnerability Carbon emissions from fishery value chain Different economic assessment in relation to Climate change Adaptation and Mitigation of climate change Vulnerability assessment using different statistical methods Data entry for Kerala and Tamilnadu initiated. Initiated Vulnerability assessment-Kerala Preparation of frameworks and schematics on various topics Prepared tentative action plan and submitted
Documentation of hotspots-India
Attended joint workshop at Rhodes University, Grahams town.