silicon valley index 2015
TRANSCRIPT

PEOPLE
ECONOMY
SOCIETY
PLACE
GOVERNANCE
2015SILICON
VALLEYINDEX
SILICON VALLEY INSTITUTE for REGIONAL STUDIES
S I L I C O N V A L L E Y

2
OFFICERS
Steven Bochner – Co-Chair, Wilson Sonsini Goodrich & Rosati
Fred Diaz – Interim Co-chair, City of Fremont
Russell Hancock – President & CEO, Joint Venture Silicon Valley
Chris AugensteinSanta Clara Valley Transportation Authority
Mary BradleyCity of Fremont
Bob BrownsteinWorking Partnerships USA
Jo CoffaroHospital Council of Northern & Central California
Marc ComptonU.S. Trust, Bank of America Private Wealth Management
Leslie CrowellCounty of Santa Clara
Michael Curran
Fred DiazCity of Fremont
Jeff FredericksColliers International
Dennis JacobsSanta Clara University
Tom KleinGreenberg Traurig, LLP
James KochSanta Clara University
Stephen LevyCenter for Continuing Study of the California Economy
Rocio LunaSanta Clara County Public Health Department
Andrea MackenzieSanta Clara Valley Open Space Authority
Connie MartinezSilicon Valley Creates
Sanjay NarayanSierra Club
Dan PeddycordSanta Clara County Public Health Department
Jeff Rusterwork2future, City of San Jose
AnnaLee SaxenianUniversity of California, Berkeley
Susan SmarrKaiser Permanente Santa Clara Medical Center
Kris StadelmanNOVA
Anandi SujeerSanta Clara County Public Health Department
Michael TeitzUniversity of California, Berkeley
Lynne TrulioSan Jose State University
E. Chris WilderValley Medical Center Foundation
Michael UhlMcKinsey & Company
DIRECTORSKimberly Becker AguirreMineta San Jose International Airport
George BlumenthalUniversity of California at Santa Cruz
Dan BoxwellAccenture
Rob ChapmanElectric Power Research Institute
Marc ComptonBank of America/US Trust
Stephan EberleSVB Financial Group
Nuria FernandezSanta Clara Valley Transportation Authority
Ben FosterOptony
Josue GarciaBuilding Trades Council
Beau GoldieSanta Clara Valley Water District
Judith Maxwell GreigNotre Dame De Namur University
Paul GustafsonTDA Group
Steven HemmingerAlston & Bird
Dave HodsonSkype/Microsoft
Eric C. HouserWells Fargo & Co.
Dennis JacobsSanta Clara University
James KeeneCity of Palo Alto
Karolyn KirchgeslerTeam San Jose
Tom KleinPersistent
Matt MahanBrigade
Tom McCalmontMcCalmont Engineering
Jim McCaugheyLucile Salter Packard Children’s Hospital
Jean McCownStanford University
Dan MillerJuniper Networks
Curtis MoDLA Piper
Richard MoranMenlo College
Mairtini Ni DhomhnaillAccretive Solutions
Jim PappasHensel Phelps
Joseph ParisiTherma
The Honorable Dave PineSan Mateo County
Mo QayoumiSan Jose State University
Robert RaffoHood & Strong LLP
Bobby RamSunPower Corporation
Chad SeilerKPMG
Susan SmarrKaiser Permanente
John A. SobratoSobrato Organization
Linda ThorFoothill-DeAnza Community College District
John TortoraSharks Sports & Entertainment
Michael UhlMcKinsey & Company
Daniel YostOrrick, Herrington & Sutcliffe, LLP
SENIOR ADVISORY COUNCILJohn C. AdamsWells Fargo
Frank BenestCity of Palo Alto (Ret.)
Eric BenhamouBenhamou Global Ventures
Chris DiGiorgioAccenture (Ret.)
Harry Kellogg SVB Financial Group
Chris KellyEntrepreneur
William F. Miller Stanford University
Kim Polese ClearStreet, Inc.
INDEX ADVISORS
SILICON VALLEY INSTITUTE FOR REGIONAL STUDIES
George BlumenthalUniversity of California, Santa Cruz
William DodgeNational Association of Regional Councils
Judith GreigNotre Dame de Namur University
Dennis JacobsSanta Clara University
Stephen LevyCenter for Continuing Study of the California Economy
Mo QayoumiSan Jose State University
ADVISORY BOARD
Prepared by:
Rachel Massaro
Designed by:
Jill Minnick Jennings
JOINT VENTURE SILICON VALLEY BOARD OF DIRECTORS

3
Dear Friends:
The world’s hottest regional economy keeps getting hotter.
Anybody who has lived here long enough knows our economy cycles, and that we shouldn’t be overly despondent during a downturn or too euphoric during the booms. And yet our current pattern of growth really must be characterized as extraor-dinary. Silicon Valley was the last economy to succumb to the Great Recession, and we were the first to emerge from it. We’re poised now to blow through all the employment, venture capital and patent records that were set during the crazy dot-com period, only this time we haven’t spiked into it. We’ve arrived here through a steady five-year process of incremental growth, each year more impressive than the last.
There’s little talk of bubble this time, and with so many promising new areas of development (big data, the internet of things, security and encryption, boutique manufacturing, the sharing economy) it seems our region will keep growing for the foreseeable future.
Most striking of all is the stunning emergence of San Francisco. The City has always been a thriving microeconomy across the traditional sectors, but today it has to be said that San Francisco and Silicon Valley have become twin engines driving the region’s innovation and entrepreneurial activity. As you’ll see from the pages of this report, San Francisco’s employment growth, the amount of venture capital flowing into the companies there, and their sheer number of patents are fairly stag-gering. It raises interesting debates about whether we are one economy or two, but what is beyond debate is the pressing need to integrate the planning efforts to accommodate such explosive growth.
This kind of growth is a thing to celebrate, surely. But there are perils associated with prosperity, and anybody trying to navigate their way around the region feels it. The growth is straining our infrastructure, and putting housing out of reach for too many. Perhaps most vexing of all, the growth is uneven. Though we’re proliferating high-wage and low-wage jobs, we’re steadily losing share in the middle. It’s as if the economy has lost its spine, and this has important implications for the kind of community we become.
Documenting these developments is the purpose of our Institute. Grappling with the ensuing challenges is the purpose of the organization which houses it. We’re pleased we can provide this framework for analysis and action, and eager to take up the work before us.
Sincerely,
Russell HancockPresident & Chief Executive Officer Joint Venture Silicon Valley Silicon Valley Institute for Regional Studies
ABOUT THE 2015 SILICON VALLEY INDEX

4
The Silicon Valley Index has been telling the Silicon Valley story since 1995. Released early every year, the Index is a comprehensive report based on indicators that measure the strength of our economy and the health of our community—highlighting challenges and providing an analytical foundation for leadership and decision making.
WHAT IS AN INDICATOR? An Indicator is a quantitative measure that is of relevance to Silicon Valley’s economy and community health, that can be examined either over a period of time, or at a given point in time.
Good Indicators are bellwethers that reflect the fundamentals of long-term regional health, and represent the interests of the community. They are measurable, attainable, and outcome-oriented.
Appendix B provides detail on data sources for each indicator.
THE SILICON VALLEY INDEX ONLINEData and charts from the Silicon Valley Index are available on a dynamic and interactive website that allows users to further explore the Silicon Valley story.
For all this and more, please visit the Silicon Valley Indicators website at www.siliconvalleyindicators.org.
WHAT IS THE INDEX?
5
PROFILE OF SILICON VALLE Y ................................................................................................... 6
THE REGION’S SHARE OF C ALIFORNIA’S ECONOMIC DRIVERS ........................................ 7
2015 INDE X HIGHLIGHTS .......................................................................................................... 8
PEOPLETalent Flows and Diversity...................................................................................................................10
ECONOMYEmployment ......................................................................................................................................16
Income ............................................................................................................................................ 22
Innovation & Entrepreneurship ............................................................................................................30
Commercial Space ............................................................................................................................. 40
SOCIET YPreparing for Economic Success ........................................................................................................... 44
Early Education ................................................................................................................................ 46
Arts and Culture ............................................................................................................................... 48
Quality of Health .............................................................................................................................. 50
Safety ..............................................................................................................................................52
PL ACEEnvironment .................................................................................................................................... 54
Transportation ................................................................................................................................. 58
Land Use .......................................................................................................................................... 62
Housing ........................................................................................................................................... 64
GOVERNANCECity Finances .....................................................................................................................................70
Civic Engagement .............................................................................................................................. 72
APPENDIX A ...............................................................................................................................74
APPENDIX B ...............................................................................................................................75
ACKNOWLEDGMENTS .............................................................................................................. 86
TABLE OF CONTENTS

6
The geographical boundaries of Silicon Valley vary. Earlier, the region’s core was identified as Santa Clara County plus adjacent parts of San Mateo, Alameda and Santa Cruz counties. However, since 2009, the Silicon Valley Index has included all of San Mateo County in order to reflect the geographic expansion of the region’s driving industries and employment. Because San Francisco has emerged in recent years as a vibrant contributor to the tech economy, we have included some San Francisco data in various charts throughout the Index.
Campbell
Belmont
Brisbane
South San Francisco
ColmaDaly City
BurlingameSan
MateoFoster
City
Redwood CityAtherton
MenloPark
SantaClara
Mountain View
MonteSereno
Los AltosLos Altos
HillsCupertino
Sunnyvale
Scotts Valley
San Jose
Los Gatos
Gilroy
East Palo Alto
Palo Alto
Saratoga
Milpitas
FremontNewark
Union City
Half Moon
Bay
Morgan Hill
San Bruno
San Carlos
Portola Valley
Paci�ca
Woodside
Millbrae
Hillsborough
Adult Educational Attainment
Less than High
School
High School Grad
Some College
Bachelor’s Degree
Graduate or Professional
Degree
12% 16% 25% 26% 21%
Foreign Born 36.3%
Afric
a & Oc
eania
1%
each
Europ
e 8%
other
Asia
12%
other
Ameri
cas 9
%
India
11%
Vietn
am 1
1%
Philip
pines
11%
China
14%
Mexic
o 21
%
4% M
ultip
le an
d Oth
er2.
5% B
lack,
non-
Hisp
anic
26.5
% H
ispan
ic an
d Lat
ino
31%
Asia
n, no
n-Hi
span
ic
36%
Whi
te, n
on-H
ispan
ic
Ethnic Composition
13% 17% 25% 26% 19%
Age Distribution
25%
Unde
r 20
28%
20-3
9
28%
40-
59
14%
60-
79
4%80
and o
ver
Area:
1,854 SQUARE MILES
Population:
2.97 MILLIONJobs:
1,481,442Average Annual Earnings:
$116,033Net Foreign Immigration:
+17,693Net Domestic Migration:
-7,404
Silicon Valley is defined as the following cities: SANTA CLARA COUNTY (ALL)Campbell • Cupertino • Gilroy • Los Altos • Los Altos Hills • Los Gatos • Milpitas • Monte Sereno • Morgan Hill • Mountain View • Palo Alto • San Jose • Santa Clara • Saratoga • Sunnyvale
SAN MATEO COUNTY (ALL)Atherton • Belmont • Brisbane • Burlingame • Colma • Daly City • East Palo Alto • Foster City • Half Moon Bay • Hillsborough • Menlo Park • Millbrae • Pacifica • Portola Valley • Redwood City • San Bruno • San Carlos • San Mateo • South San Francisco • Woodside
ALAMEDA COUNTYFremont • NewarkUnion City
SANTA CRUZ COUNTYScotts Valley
*Oceania includes American Samoa, Australia, Cook Islands, Fiji, French Polynesia, Guam, Kiribati, Marshall Islands, Federated States of Micronesia, Nauru, New Caledonia, New Zealand, Northern Mariana Islands, Palau, Papua New Guinea, Samoa, Solomon Islands, Tonga, Tuvalu, Vanuatu, Wallis and Futuna. | Note: Area, Population, Jobs, and Average Annual Earnings figures are based on the city-defined Silicon Valley region; whereas Net Foreign Immigration and Domestic Migration, Adult Educational Attainment, Age Distribution, Ethnic Composition, and Foreign Born figures are based on Santa Clara and San Mateo County data only.
PROFILE OF SILICON VALLEY

7
9.6%GDP*
37.4%Venture Capital
46.9%Patent Registrations
20.1%Cleantech Venture Capital
39.7%IPOs
9.3%Jobs
26.2%M&A Activity
36.7%Angel Investment
4.4%
60.1%
8.6%
48.7%
36.3%
5.4%
4.0%
15.2%
SANFRANCISCO
SILICON VALLEY
1.19%Land Area
0.03%
2.2%7.7%Population
The Region's Share of California’s Economic Drivers
*Silicon Valley Percentage of California GDP includes San Mateo and Santa Clara counties only. Data Sources: Land Area (U.S. Census Bureau, 2010); Population (California Department of Finance, 2014); GDP (Moody’s Economy.com, 2014); Venture Capital (PricewaterhouseCoopers/National Venture Capital Association MoneyTreeTM Report, Data: Thomson Reuters, Q1-3 2014); Cleantech Venture Capital (Cleantech Group’s i3 Platform, Q1-3 3013); Patent Registrations (U.S. Patent and Trademark Office, 2013); Initial Public Offerings (Renaissance Capital, 2014); Jobs (State of California Employment Development Department Quarterly Census of Employment and Wages, and EMSI, Q2 2014); Angel Investment (CB Insights, Q1-3 2014); Mergers & Acquisitions (Factset Mergerstat, Q1-3 2014).

8
The region’s economy is thriving. Employment levels have not only reached pre-recession totals but have far exceeded them. Incomes are on the rise as unemployment and poverty rates decline. And as Silicon Valley continues to innovate and cultivate new ventures, activity in San Francisco is booming – strengthening the region’s economy and providing people and companies with more options to grow and thrive in the Bay Area. However, the issues of housing, transportation, and disparities in income and employment opportunities remain.
n JOB GROWTH IS RAPID, BUT TRENDS VARY BY WAGE AND SKILL LEVELS• Silicon Valley’s job growth rate (4.1%) is the highest it’s been since 2000, adding nearly 58,000 jobs (bringing the total to 1.48 million in Q2 2014)
and exceeding the 2013-2014 job growth rate of the Bay Area as a whole (+3.5%), San Francisco (+3%), California (+2.5%) and the nation (+1.8%). → See pages 16-17
• Employment levels in Silicon Valley and San Francisco have exceeded pre-recession totals by 7.3% and 13.1%, respectively. → See page 17
• Job growth in Silicon Valley is occurring across nearly all major areas of economic activity. Jobs in Community Infrastructure & Services grew by 40,096 (+5.7% between Q2 2013 and Q2 2014), Innovation and Information Products & Services by 18,445 (+5.3%), and Business Infrastructure & Services by 12,294 (+5.3%), while the region lost 1.1% of its Other Manufacturing jobs. → See page 18 and Appendix A (page 74)
• Despite overall rapid job growth, middle-wage/middle-skill jobs have barely recovered and represent a shrinking share of total employment. → See pages 20-21
n INCOME GAINS ACCOMPANY JOB GROWTH, BUT DISPARITIES PERSIST • Earnings in Silicon Valley and San Francisco remain much higher than the rest of the state and nation. Average annual earnings (including
wages and supplements) in Silicon Valley and San Francisco as of Q2 2014 were $116,033 and $104,881, respectively, compared to $96,663 in the 9-County Bay Area, $70,847 in California, and $61,489 in the United States. → See page 6
• Median household income and average wages increased. Median household income was $94,534 in 2013 (+1.3% since 2012) in Silicon Valley and $79,778 in San Francisco (+3.8% since 2012), and average wages outpaced inflation between 2013 and 2014. → See pages 24-25
• However, income disparities persist between workers of different skill and educational attainment levels. → See pages 26, 28
• There is a large gap between the highest and lowest earning racial/ethnic groups, which is larger in Silicon Valley ($44,037) and San Francisco ($50,069) than in California ($28,332) or the United States ($17,716). → See page 23
• Men in Silicon Valley earn up to 61% more than their female peers. This gender-income gap is more pronounced in Silicon Valley than in San Francisco, California or the United States, and is getting larger over time. → See page 29
• While poverty levels are relatively low, 29% of the region’s residents in 2012 were not self-sufficient (they did not make enough money to meet their basic needs without public assistance). → See page 27
• The share of high-income households increased, while the share of low and middle income households (<$150,000 per year) declined in 2013. Similar trends are exhibited in the state and nation, but they are much more pronounced in Silicon Valley. → See page 27
n HOUSING AND TRANSPORTATION REMAIN CRITICAL ISSUES AS THE REGION’S POPULATION AND COMMUTER RATES GROW, AND HOUSING PRICES CONTINUE TO SOAR
• The population in Silicon Valley is growing rapidly, despite declining birth rates (15% lower in 2014 than in 2008). → See pages 10, 12
• Commuter rates increased significantly by as much as 33% between 2011 and 2013. → See pages 60-61
2015 INDEX HIGHLIGHTS

9
• Public transit use per capita has grown by as much as 39% on some systems since 2010. → See pages 60-61
• Approved non-residential development in FY 2013-14 was higher than any other year over the last decade, with a net floor area equivalent to 224 football fields. → See page 63
• The region is building more housing with a higher share of multi-family, although it’s not enough to make up for the lack of building during the recession. → See page 65
• Home prices and rental rates continued to rise in 2014, with a median home sale price of $757,585 (7.5% higher than 2013) and an average rental rate of $2,333/month (11% higher than 2013) in Santa Clara and San Mateo Counties, contributing to the nearly 40% of renters who are burdened by housing costs. → See pages 64-65, 67
• More than a third of Silicon Valley young adults live with a parent. → See page 69
n THE REGION’S INNOVATION ENGINE IS GOING STRONG, WITH AN INCREASING SHARE OF INVESTMENTS IN SOFTWARE• Patent registrations in Silicon Valley and San Francisco are rising quickly, and accounted for 52% of California patent registrations in 2013.
→ See page 31
• Silicon Valley venture capital investments were higher in 2014 than they have been since 2000, and San Francisco attracted several very large venture capital deals. → See pages 32-33
• Software companies are attracting a larger share of total venture capital investment in Silicon Valley (rising from 21% in 2009 to 55% in 2014), and accounted for 56% of San Francisco Q1-3 2014 venture capital investment. → See page 33
• Silicon Valley and San Francisco account for 85% of California Angel investments. → See page 36
n SAN FRANCISCO IS A MAJOR DRIVER OF THE REGION’S ECONOMIC PROSPERITY• Employment levels in San Francisco have grown more quickly than in Silicon Valley, up 13.1% since 2007 and 15.3% since the low in 2010 (com-
pared to 7.3% and 14.4% job growth in Silicon Valley, respectively). → See page 17
• San Francisco has a young, well-educated workforce that is taking advantage of rapid job growth, with 47% of the population between ages 18 and 44 and 53% with a bachelor’s degree or higher (compared to 38% and 47% in Silicon Valley, respectively). → See pages 11, 13
• San Francisco patent registrations and per capita rates are accelerating rapidly. Patents granted to San Francisco inventors shot up 24% between 2012 and 2013 (compared to 12.7% in Silicon Valley), and the number of patents granted per capita increased by 65% between 2011 and 2013 (compared to 22% in Silicon Valley and 27% in California). → See page 31
• San Francisco venture capital is booming: → See pages 32-33
• San Francisco received 36% of California venture capital investments in Q1-3 2014 – a share that has increased exponentially from 4.1% in 2007.
• San Francisco companies received nearly the same amount of venture capital investment as all of Silicon Valley’s companies combined, with a total of $7.2 billion (compared to $7.3 billion in Silicon Valley) in Q1-3 2014.
• San Francisco venture capital deals accounted for 29% of all California deals in Q1-3 2014, compared to a 37% share in Silicon Valley.
• San Francisco had several very large venture capital deals in Q1-3 2014, including Uber’s $1.2 billion deal and three others over $200 mil-lion (Dropbox, Lyft, and AirBnB). During that same time period, Silicon Valley had only two deals over $200 million (Pure Storage and Tangome).
• San Francisco Angel investments exceeded 2013 totals in just the first three quarters of 2014 (reaching nearly $1.6 billion) and accounted for 49% of all California Angel investment during that time period (compared to a 37% share in Silicon Valley). → See pages 36-37
• Merger and acquisition activity in San Francisco is accelerating, with 7% more deals in Q1-3 2014 than in all of 2013. → See page 38
n OTHER SILICON VALLEY TRENDS OF INTEREST• Water consumption per capita remained steady through FY 2013-14, despite severe drought conditions. However, the region used more recycled
water and residential water conservation efforts in many areas approached the Governor’s 20% reduction target in late 2014. → See page 54
• The number of public safety officers increased by 17% in mid-2014 following four years of rapid decline. → See page 53
• Cumulative installed solar photovoltaic capacity increased by 33 megawatts in Q1-3 2014, putting the region on pace to exceed the 41 megawatts installed during the previous year. → See page 56

10
WHY IS THIS IMPORTANT?Silicon Valley’s most important asset is its people, who drive the economy and shape the region’s quality of life. Population growth is reported as a function of migration (immigration and emigration) and natural popula-tion change (the difference between the number of births and deaths). Delving into the diversity and makeup of the region’s people helps us understand both our assets and our challenges.
The number of science and engineering degrees awarded regionally helps to gauge how well Silicon Valley is preparing talent. A highly educated local workforce is a valuable resource for generating innovative ideas, products and services. The region has benefited significantly from the entrepreneurial spirit of people drawn to Silicon Valley from around the country and the world. Historically, immigrants have contributed con-siderably to innovation and job creation in the region, state and nation.1 Maintaining and increasing these flows, combined with efforts to inte-grate immigrants into our communities, will likely improve the region’s potential for global competitiveness.
1. Manuel Pastor, Rhonda Ortiz, Marlene Ramos, and Mirabai Auer. Immigrant Integration: Integrating New Americans and Building Sustainable Communities. University of Southern California Program for Environmental and Regional Equity (PERE) & Center for the Study of Immigrant Integration (CSII) Equity Issue Brief. December, 2012.
HOW ARE WE DOING?Silicon Valley’s population has continued to grow steadily, increasing by approximately 30,000 per year since 2011 (in Santa Clara and San Mateo Counties), despite the region’s declining birth rates. Between July 2013 and July 2014, Santa Clara County’s population grew at a rate of 1.15%, compared with 0.88% in the state as a whole. San Mateo County grew more slowly, at 0.83%. Together, the two counties grew by over 27,000 people, increasing the region’s population by 1.1% over the prior year. The entire Silicon Valley region (including Santa Clara and San Mateo Counties, Fremont, Union City, Newark and Scotts Valley) grew by nearly 42,000 people between January 2013 and January 2014.2 During that period of time, Santa Clara County was the fastest growing county in the state at 1.5% growth – nearly twice the growth rate of the state as a whole (0.9%) – and a few Silicon Valley cities (Campbell, Milpitas, Foster City, and Morgan Hill) grew three to four times faster than the state.
Natural population change (births minus deaths) in Santa Clara and San Mateo Counties was +17,196 in July 2014 – 1,890 fewer than in July 2013, primarily due to a steep decline in the birth rate (1,630 fewer than in 2013. Net migration added 10,289 residents to the two counties, including the
2. According to the California Department of Finance, Demographic Research Unit, E-1: City/County Population Estimates with Annual Percent Change, released May 1, 2014.
Components of Population ChangeSanta Clara & San Mateo Counties
Peop
le
-50,000-40,000-30,000-20,000-10,000
010,00020,00030,00040,00050,000
'14'13'12'11'10'09'08'07'06'05'04'03'02'01'00'99'98'97'96
Net ChangeNet MigrationNatural Change
Data Source: California Department of Finance | Analysis: Silicon Valley Institute for Regional Studies
POPULATION CHANGE
Santa Clara & San Mateo Counties, and California, 2013-2014
SANTA CLARA & SAN MATEO COUNTIES
CALIFORNIA
JULY 2013 JULY 2014 % CHANGE
2,595,479 2,622,964 +1.06%
38,164,011 38,499,378 +0.88%
Silicon Valley’s population continues to grow rapidly.
TALENT FLOWS AND DIVERSITYSilicon Valley’s population is growing rapidly, primarily driven by foreign immigration.
PEOPLE

11
Peop
le
Foreign & Domestic MigrationSanta Clara & San Mateo Counties
-50,000-40,000-30,000-20,000-10,000
010,00020,00030,00040,00050,000
'14'13'12'11'10'09'08'07'06'05'04'03'02'01'00'99'98'97'96
Net Migration
Net Domestic Migration
Net Foreign Immigration
Data Source: California Department of Finance | Analysis: Silicon Valley Institute for Regional Studies
NET MIGRATION FLOWS
United States
California
San Francisco
Silicon Valley
2013Santa Clara & San Mateo Counties, San Francisco, California, and the United States
23%
13%
8%
8%
13%
14%
30%
39%
26%
26%
23% 26%10% 14%26%
24% 25%11% 13%28%
65 and older45-6425-4418-2417 and under
AGE DISTRIBUTION
Data Source: United States Census Bureau, Population Division | Analysis: Silicon Valley Institute for Regional Studies
PEOP
LE
Talent Flows & Diversity
Foreign immigration remains high, while an increasing number of Silicon Valley residents are moving out of the region.
San Francisco has a much larger share of 25-44 year-olds – the core working age group – than Silicon Valley, California, or the United States.
+1.3%
+3.5%
+2.8%
+4.9%
+11.7%
+4.1%
17 AND UNDER
18-24
25-44
45-64
65 AND OLDER
TOTAL
Population Change, by Age CategorySilicon Valley, 2010-2013

12
Silicon Valley birth rates have declined 15.3% since 2008.
Santa Clara & San Mateo Counties
29,00030,00031,00032,00033,00034,00035,00036,00037,00038,00039,000
'14'13'12'11'10'09'08'07'06'05'04'03'02'01'00'99'98'97'96
Birt
hs Pe
r Yea
r
Data Source: California Department of Finance | Analysis: Silicon Valley Institute for Regional Studies
BIRTH RATE
TALENT FLOWS AND DIVERSITYPEOPLE
addition of +17,693 foreign immigrants and a loss of 7,404 residents who moved out of the region during that time period. Over the longer term, migration – particularly the domestic component of migration – has var-ied along with the cycles of job growth and loss in Silicon Valley. Foreign immigration levels rose near the end of the dot-com boom and again in 2013 and 2014. Over the 1996 to 2014 period, foreign immigration aver-aged 16,967 per year in Santa Clara and San Mateo Counties, varying between a low of 7,376 (in 2011) and a high of 28,845 (in 2001). Even larger variations exist in the number of residents moving out of the region each year, which averaged 18,988 over the entire 19-year period with a range of -48,341 (in 2001) to +2,288 (in 2011). Domestic out-migration corresponded to regional employment cycles, with an average loss of 8,589 residents per year from 1996 through 2000, 30,434 per year from 2001 through 2010, and a mere 3,373 per year from 2011 through 2014 as the region’s employment numbers began to climb. Over the 19-year period, these migration flows have had a major influence on Silicon Valley’s population composition.
Silicon Valley’s population has a higher concentration of young working-age residents than that of the nation. In Silicon Valley, 25- to 44-year olds
represent the largest portion of the region’s population, a trend mirrored in the state. In contrast, nationwide, the 25- to 44-year old age bracket represents the same proportion of the population as the 45- to 64-year old age bracket. Although age distributions in Silicon Valley, California and the U.S. are similar, Silicon Valley has a lower percentage of resi-dents under age 24 compared with the state and the nation – a difference that may become more pronounced in the near future if Silicon Valley’s birth rate continues to decline. Between 2002 and 2007, the birth rate in Silicon Valley was relatively constant (around 37,000 per year), but has exhibited a downward trend between 2007 and 2013 (-14.1%, accord-ing to data from the U.S. Department of Health and Human Services). San Francisco has a very different age distribution than the other three geographies in that a very large portion (39%) of the population is in the 25- to 44- year old category, and a relatively small portion is under age 25 (21%, compared to 31% in Silicon Valley, 35% in California, and 33% in the U.S.). These population compositions are expected to change significantly as the Baby Boomers age. Between 2010 and 2013, the share of Silicon Valley’s population over age 65 increased by nearly 12%, com-pared to an overall population increase of 4%.
Educational attainment varies across racial and ethnic groups.
13
PEOP
LE
Talent Flows & Diversity
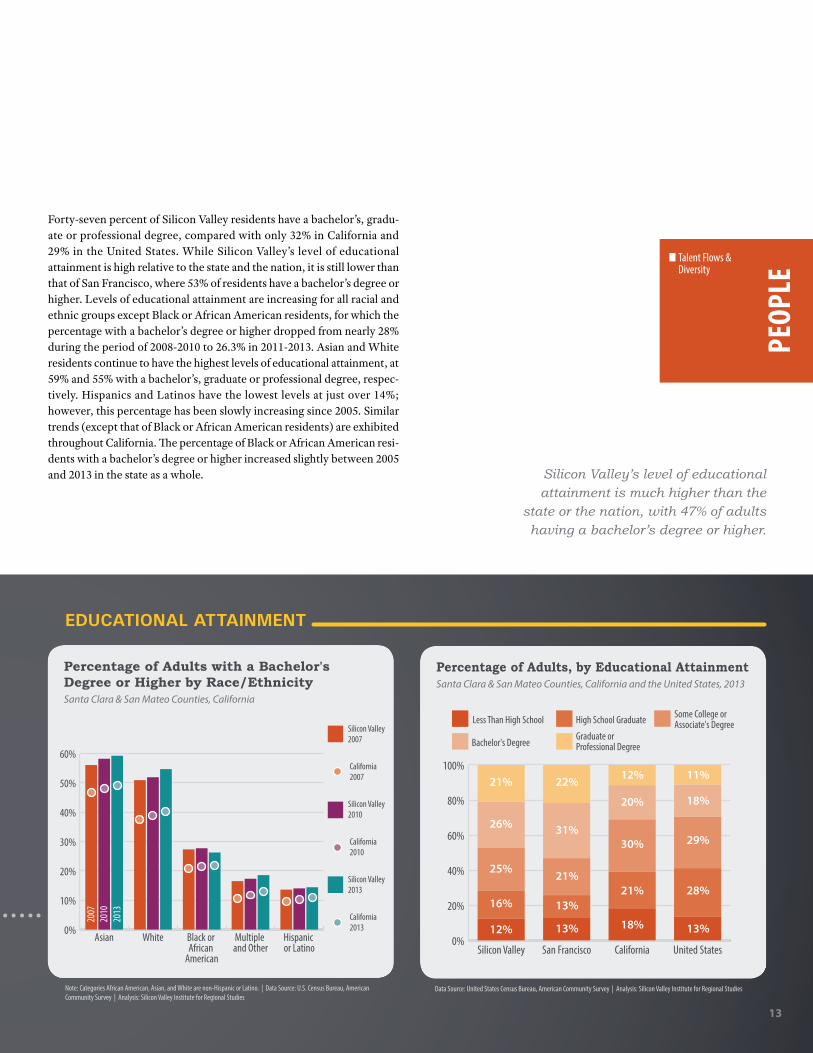
Silicon Valley’s level of educational attainment is much higher than the
state or the nation, with 47% of adults having a bachelor’s degree or higher.
Forty-seven percent of Silicon Valley residents have a bachelor’s, gradu-ate or professional degree, compared with only 32% in California and 29% in the United States. While Silicon Valley’s level of educational attainment is high relative to the state and the nation, it is still lower than that of San Francisco, where 53% of residents have a bachelor’s degree or higher. Levels of educational attainment are increasing for all racial and ethnic groups except Black or African American residents, for which the percentage with a bachelor’s degree or higher dropped from nearly 28% during the period of 2008-2010 to 26.3% in 2011-2013. Asian and White residents continue to have the highest levels of educational attainment, at 59% and 55% with a bachelor’s, graduate or professional degree, respec-tively. Hispanics and Latinos have the lowest levels at just over 14%; however, this percentage has been slowly increasing since 2005. Similar trends (except that of Black or African American residents) are exhibited throughout California. The percentage of Black or African American resi-dents with a bachelor’s degree or higher increased slightly between 2005 and 2013 in the state as a whole.
Percentage of Adults with a Bachelor's Degree or Higher by Race/EthnicitySanta Clara & San Mateo Counties, California
0%
10%
20%
30%
40%
50%
60%
Hispanic or Latino
Multiple and Other
Black or African
American
WhiteAsian
California 2013
Silicon Valley 2013
California 2010
Silicon Valley 2010
California 2007
Silicon Valley 2007
2007
2010
2013
EDUCATIONAL ATTAINMENT
Note: Categories African American, Asian, and White are non-Hispanic or Latino. | Data Source: U.S. Census Bureau, American Community Survey | Analysis: Silicon Valley Institute for Regional Studies
0%
20%
40%
60%
80%
100%
United StatesCaliforniaSan FranciscoSilicon Valley
Graduate or Professional DegreeBachelor's Degree
Some College or Associate's DegreeHigh School GraduateLess Than High School
Percentage of Adults, by Educational Attainment Santa Clara & San Mateo Counties, California and the United States, 2013
12%
16%
25%
26%
21%
13%
13%
21%
31%
22%
13%
28%
29%
18%
11%
18%
21%
30%
20%
12%
Data Source: United States Census Bureau, American Community Survey | Analysis: Silicon Valley Institute for Regional Studies
14
TALENT FLOWS AND DIVERSITYPEOPLE
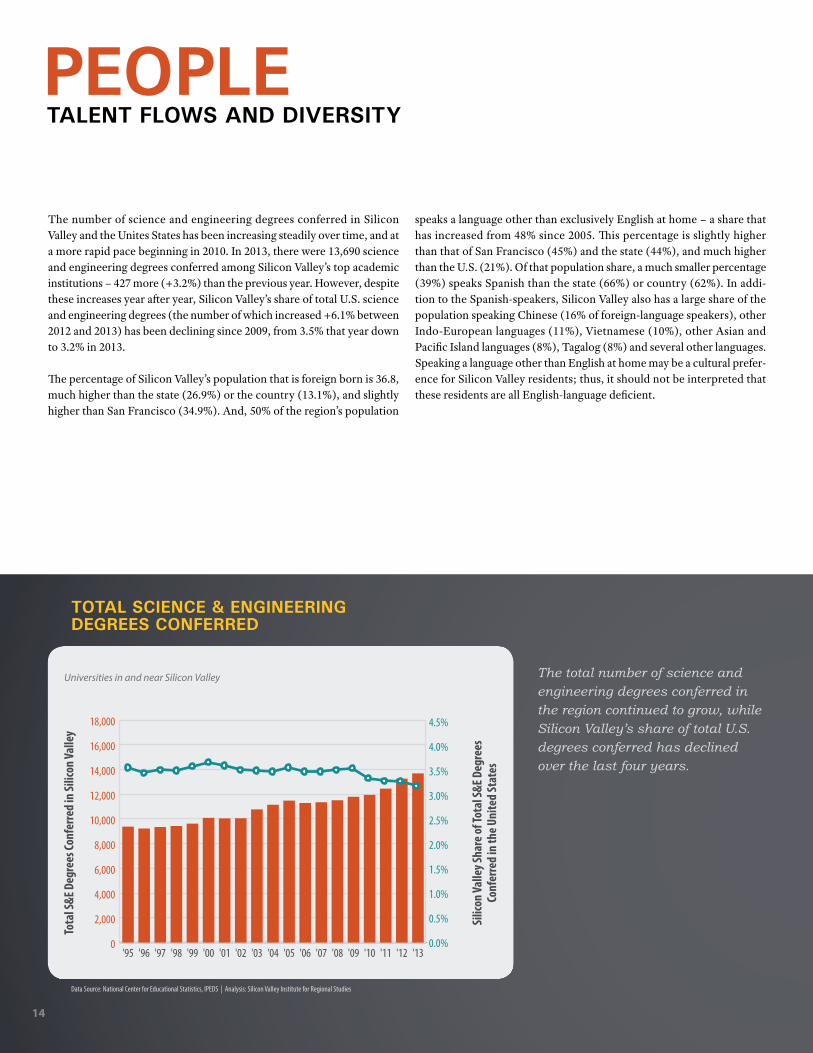
The number of science and engineering degrees conferred in Silicon Valley and the Unites States has been increasing steadily over time, and at a more rapid pace beginning in 2010. In 2013, there were 13,690 science and engineering degrees conferred among Silicon Valley’s top academic institutions – 427 more (+3.2%) than the previous year. However, despite these increases year after year, Silicon Valley’s share of total U.S. science and engineering degrees (the number of which increased +6.1% between 2012 and 2013) has been declining since 2009, from 3.5% that year down to 3.2% in 2013.
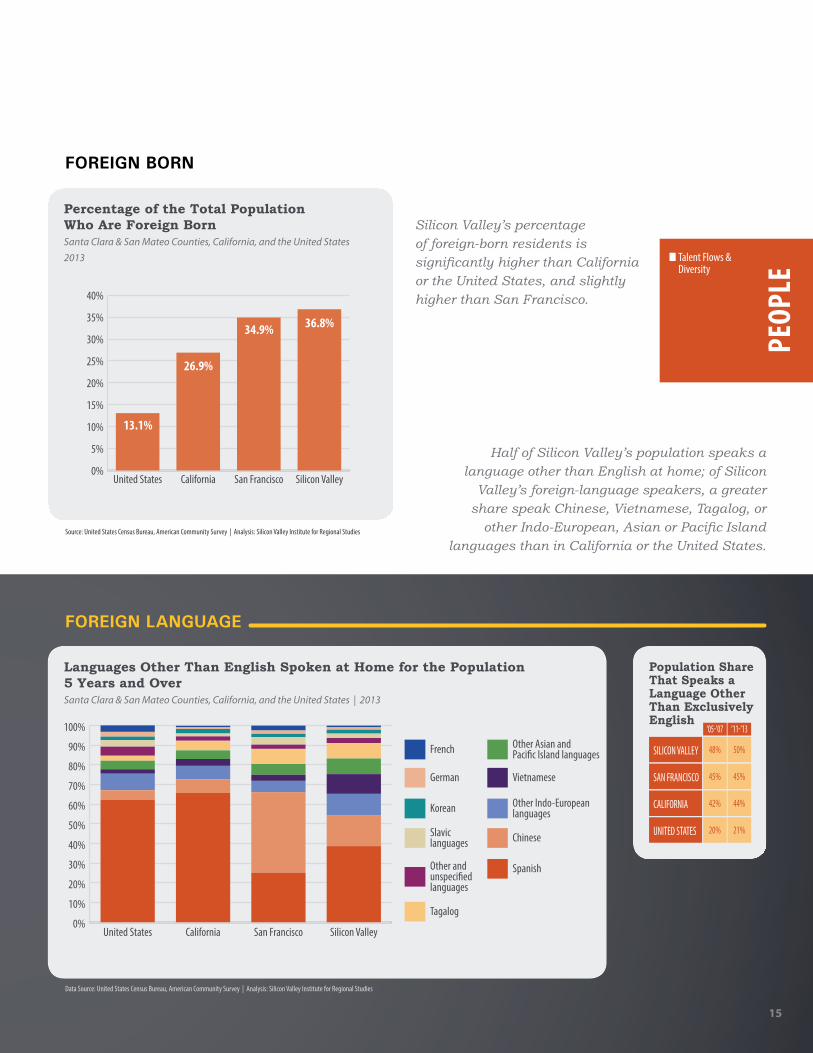
The percentage of Silicon Valley’s population that is foreign born is 36.8, much higher than the state (26.9%) or the country (13.1%), and slightly higher than San Francisco (34.9%). And, 50% of the region’s population
speaks a language other than exclusively English at home – a share that has increased from 48% since 2005. This percentage is slightly higher than that of San Francisco (45%) and the state (44%), and much higher than the U.S. (21%). Of that population share, a much smaller percentage (39%) speaks Spanish than the state (66%) or country (62%). In addi-tion to the Spanish-speakers, Silicon Valley also has a large share of the population speaking Chinese (16% of foreign-language speakers), other Indo-European languages (11%), Vietnamese (10%), other Asian and Pacific Island languages (8%), Tagalog (8%) and several other languages. Speaking a language other than English at home may be a cultural prefer-ence for Silicon Valley residents; thus, it should not be interpreted that these residents are all English-language deficient.
Universities in and near Silicon Valley
Tota
l S&E
Deg
rees
Conf
erre
d in
Silic
on Va
lley
Silic
on Va
lley S
hare
of To
tal S
&E D
egre
es
Conf
erre
d in
the U
nite
d St
ates
0
2,000
4,000
6,000
8,000
10,000
12,000
14,000
16,000
18,000
'13'12'11'10'09'08'07'06'05'04'03'02'01'00'99'98'97'96'950.0%
0.5%
1.0%
1.5%
2.0%
2.5%
3.0%
3.5%
4.0%
4.5%
Data Source: National Center for Educational Statistics, IPEDS | Analysis: Silicon Valley Institute for Regional Studies
TOTAL SCIENCE & ENGINEERING DEGREES CONFERRED
The total number of science and engineering degrees conferred in the region continued to grow, while Silicon Valley’s share of total U.S. degrees conferred has declined over the last four years.
15
Population Share That Speaks a Language Other Than Exclusively English
SILICON VALLEY 50% 48%
45%
44%
45%
42%
SAN FRANCISCO
CALIFORNIA
21% 20%UNITED STATES
‘05-’07 ‘11-’13
Languages Other Than English Spoken at Home for the Population 5 Years and OverSanta Clara & San Mateo Counties, California, and the United States | 2013
0%
10%
20%
30%
40%
50%
60%
70%
80%
90%
100%
Silicon ValleySan FranciscoCaliforniaUnited States
French
German
Korean
Slavic languages
Other and unspeci�ed languages
Tagalog
Other Asian and Paci�c Island languages
Vietnamese
Other Indo-European languages
Chinese
Spanish
Data Source: United States Census Bureau, American Community Survey | Analysis: Silicon Valley Institute for Regional Studies
FOREIGN LANGUAGE
Half of Silicon Valley’s population speaks a language other than English at home; of Silicon
Valley’s foreign-language speakers, a greater share speak Chinese, Vietnamese, Tagalog, or
other Indo-European, Asian or Pacific Island languages than in California or the United States.
PEOP
LE
Talent Flows & Diversity
Percentage of the Total Population Who Are Foreign BornSanta Clara & San Mateo Counties, California, and the United States2013
0%
5%
10%
15%
20%
25%
30%
35%
40%
Silicon ValleySan FranciscoCaliforniaUnited States
34.9% 36.8%
26.9%
13.1%
FOREIGN BORN
Source: United States Census Bureau, American Community Survey | Analysis: Silicon Valley Institute for Regional Studies
Silicon Valley’s percentage of foreign-born residents is significantly higher than California or the United States, and slightly higher than San Francisco.

16
EMPLOYMENTSilicon Valley job growth continues across nearly all major areas of economic activity.
WHY IS THIS IMPORTANT?Employment gains and losses are a core means of tracking economic health and remain central to national, state and regional conversations. Over the course of the past few decades, Silicon Valley (like many other communities) has experienced shifts in the composition of industries that underlie the local economy. Examining employment by wage and skill level allows for a higher level of granularity to help us understand the changing composition of jobs within the region. While employment by industry and by wage/skill level provides a broader picture of the region’s economy as a whole, observing the unemployment rates of the popu-lation residing in the Valley reveals the status of the immediate Silicon Valley-based workforce. The way in which the region’s industry patterns change shows how well our economy is maintaining its position in the global economy.
HOW ARE WE DOING?Job growth in Silicon Valley (including San Mateo and Santa Clara Counties, Fremont, Newark, Union City and Scotts Valley) has been accelerating since 2010, with the most rapid growth occurring between
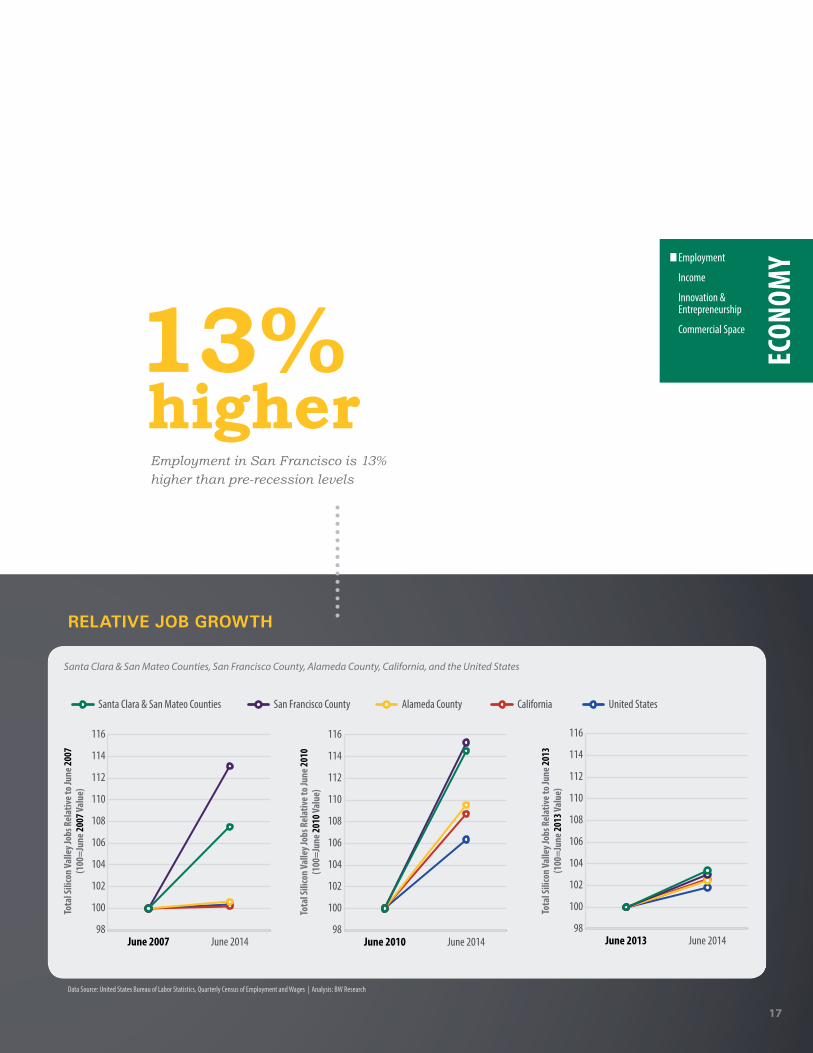
Q2 2013 and Q2 2014 at 4.1% (+57,951 jobs).1 This 4.1% growth rate is higher than the San Francisco Bay Area overall (+3.5%), San Francisco (+3%), California (+2.5%), and the United States (+1.8%). With the addition of nearly 58,000 jobs in 2014, Silicon Valley’s job total rose to 1.48 million. Employment numbers in Silicon Valley are well above pre-recession levels (up 7.3% since 2007), while the state and nation are only slightly above pre-recession levels (+0.2% and +0.4%, respectively, since 2007). And, since the low in 2010, the total number of jobs in Silicon Valley has grown by 14.4%. San Francisco job growth has been slightly more rapid (15.3% since 2010), while Alameda County, the state and the country are recovering more slowly (at 9.6%, 8.7%, and 6.4% growth, respectively, since 2010).
Between Q2 2013 and Q2 2014, Silicon Valley made strides across all major areas of economic activity except Other Manufacturing, which showed a slight drop (-1.1%). During that same period, the region saw growth in the three other major areas of economic activity: Community Infrastructure & Services (+40,096 jobs, 5.7% higher than Q2 2013), Innovation and Information Products & Services (+18,445, 5.3% higher
1. Job growth data are from BW Research using the U.S. Bureau of Labor Statistics Quarterly Census of Employment and Wages data and EMSI, and are based on the broader Silicon Valley definition including Santa Clara and San Mateo counties, plus the cities of Scotts Valley, Fremont, Newark, and Union City.
Number of Silicon Valley Jobs with Percent Change Over Prior YearSilicon Valley
Tota
l Num
ber o
f Job
s
0
250,000
500,000
750,000
1,000,000
1,250,000
1,500,000
1,750,000
Q2 2014
Q2 2013
Q2 2012
Q2 2011
Q2 2010
Q2 2009
Q2 2008
Q2 2007
Q2 2006
Q2 2005
Q2 2004
Q2 2003
Q2 2002
Q2 2001
-0.2%-8.5%
-5.3% -0.6% +0.7% +2.5% +1.9% +0.8%-6.3% -1.3% +2.5% +2.8% +3.4%
+4.1%
Note: Percent change from 2012 to 2014 is based on unsuppressed numbers. Percent change for prior years is based on QCEW data totals with suppressed industries. Percent change for 2014 was updated using Q2 reported growth. | Data Source: U.S. Bureau of Labor Statistics Quarterly Census of Employment and Wages (QCEW); EMSI | Analysis: BW Research
JOB GROWTH
The rate of job growth in Silicon Valley is more rapid than it has been for more than a decade.
ECONOMY
Continued on page 19
17
RELATIVE JOB GROWTH
Santa Clara & San Mateo Counties, San Francisco County, Alameda County, California, and the United States
Tota
l Sili
con
Valle
y Job
s Rel
ativ
e to J
une 2
007
(100
=Jun
e 200
7 Val
ue)
98
100
102
104
106
108
110
112
114
116
June 2014June 2007
Tota
l Sili
con
Valle
y Job
s Rel
ativ
e to J
une 2
010
(100
=Jun
e 201
0 Val
ue)
98
100
102
104
106
108
110
112
114
116
June 2014June 2010
Tota
l Sili
con
Valle
y Job
s Rel
ativ
e to J
une 2
013
(100
=Jun
e 201
3 Val
ue)
98
100
102
104
106
108
110
112
114
116
June 2014June 2013
United StatesCalifornia Alameda CountySan Francisco CountySanta Clara & San Mateo Counties
Data Source: United States Bureau of Labor Statistics, Quarterly Census of Employment and Wages | Analysis: BW Research
ECON
OMYEmployment
Income
Innovation & Entrepreneurship
Commercial Space
Employment in San Francisco is 13% higher than pre-recession levels
13%higher
18
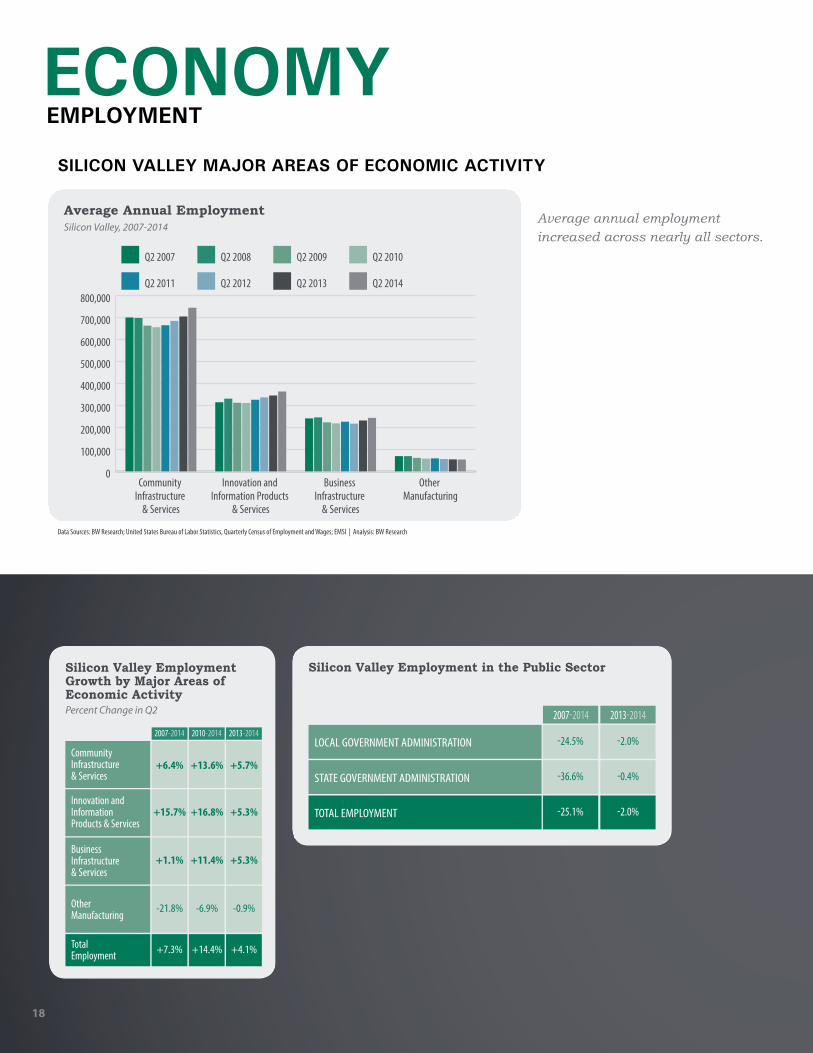
Average Annual EmploymentSilicon Valley, 2007-2014
0
100,000
200,000
300,000
400,000
500,000
600,000
700,000
800,000
Other Manufacturing
Business Infrastructure
& Services
Innovation and Information Products
& Services
Community Infrastructure
& Services
Q2 2014Q2 2013Q2 2012Q2 2011
Q2 2010Q2 2009Q2 2008Q2 2007
Data Sources: BW Research; United States Bureau of Labor Statistics, Quarterly Census of Employment and Wages; EMSI | Analysis: BW Research
SILICON VALLEY MAJOR AREAS OF ECONOMIC ACTIVITY
Silicon Valley Employment Growth by Major Areas of Economic ActivityPercent Change in Q2
2013-20142007-2014 2010-2014
Community Infrastructure & Services
Innovation and Information Products & Services
Business Infrastructure & Services
Other Manufacturing
+4.1%+7.3% +14.4%Total Employment
+5.7%+6.4% +13.6%
+5.3%+15.7% +16.8%
+5.3%+1.1% +11.4%
-0.9%-21.8% -6.9%
Silicon Valley Employment in the Public Sector
2007-2014 2013-2014
-24.5% -2.0%LOCAL GOVERNMENT ADMINISTRATION
-36.6% -0.4%STATE GOVERNMENT ADMINISTRATION
-25.1% -2.0%TOTAL EMPLOYMENT
EMPLOYMENTECONOMY
Average annual employment increased across nearly all sectors.
19
ECON
OMYEmployment
Income
Innovation & Entrepreneurship
Commercial Space
Santa Clara & San Mateo Counties, California, and the United States
Unem
ploy
men
t Rat
e
Santa Clara & San Mateo Counties
San Francisco
California
United States
‘11‘10‘09‘08‘07‘06‘05‘04‘03 ‘12 ‘13 ‘15‘140%
2%
4%
6%
8%
10%
12%
14%
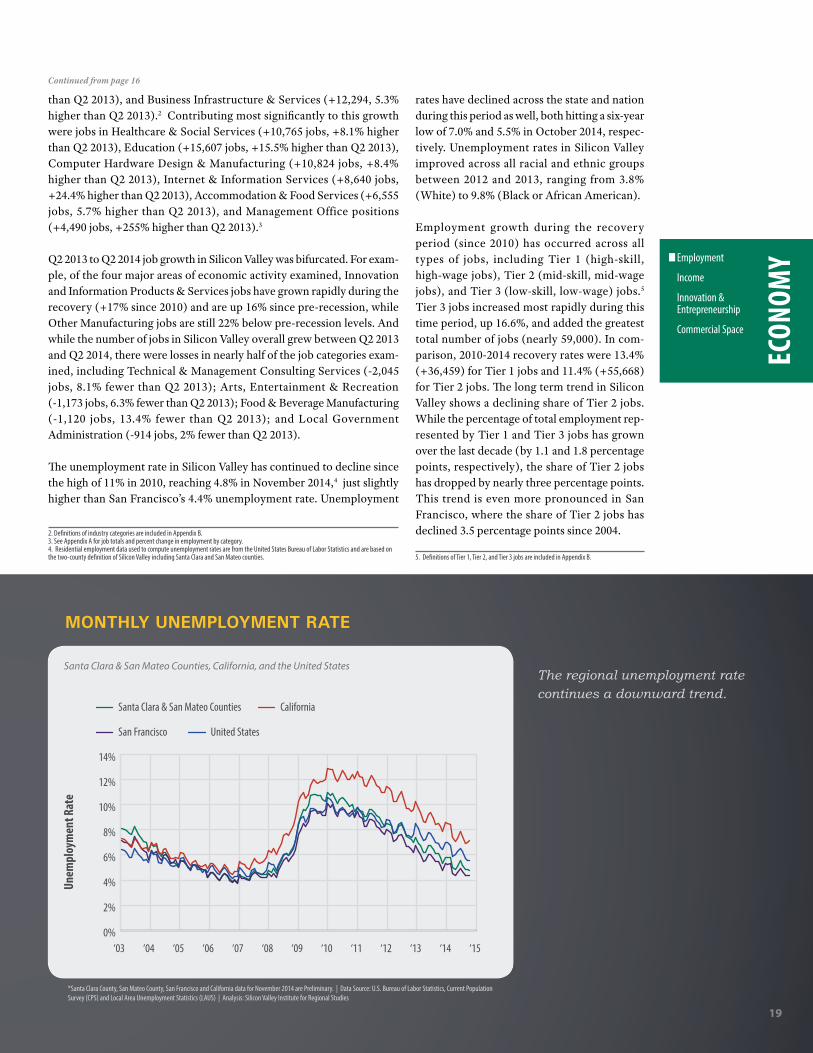
MONTHLY UNEMPLOYMENT RATE
*Santa Clara County, San Mateo County, San Francisco and California data for November 2014 are Preliminary. | Data Source: U.S. Bureau of Labor Statistics, Current Population Survey (CPS) and Local Area Unemployment Statistics (LAUS) | Analysis: Silicon Valley Institute for Regional Studies
The regional unemployment rate continues a downward trend.
rates have declined across the state and nation during this period as well, both hitting a six-year low of 7.0% and 5.5% in October 2014, respec-tively. Unemployment rates in Silicon Valley improved across all racial and ethnic groups between 2012 and 2013, ranging from 3.8% (White) to 9.8% (Black or African American).
Employment growth during the recovery period (since 2010) has occurred across all types of jobs, including Tier 1 (high-skill, high-wage jobs), Tier 2 (mid-skill, mid-wage jobs), and Tier 3 (low-skill, low-wage) jobs.5 Tier 3 jobs increased most rapidly during this time period, up 16.6%, and added the greatest total number of jobs (nearly 59,000). In com-parison, 2010-2014 recovery rates were 13.4% (+36,459) for Tier 1 jobs and 11.4% (+55,668) for Tier 2 jobs. The long term trend in Silicon Valley shows a declining share of Tier 2 jobs. While the percentage of total employment rep-resented by Tier 1 and Tier 3 jobs has grown over the last decade (by 1.1 and 1.8 percentage points, respectively), the share of Tier 2 jobs has dropped by nearly three percentage points. This trend is even more pronounced in San Francisco, where the share of Tier 2 jobs has declined 3.5 percentage points since 2004.
5. Definitions of Tier 1, Tier 2, and Tier 3 jobs are included in Appendix B.
than Q2 2013), and Business Infrastructure & Services (+12,294, 5.3% higher than Q2 2013).2 Contributing most significantly to this growth were jobs in Healthcare & Social Services (+10,765 jobs, +8.1% higher than Q2 2013), Education (+15,607 jobs, +15.5% higher than Q2 2013), Computer Hardware Design & Manufacturing (+10,824 jobs, +8.4% higher than Q2 2013), Internet & Information Services (+8,640 jobs, +24.4% higher than Q2 2013), Accommodation & Food Services (+6,555 jobs, 5.7% higher than Q2 2013), and Management Office positions (+4,490 jobs, +255% higher than Q2 2013).3
Q2 2013 to Q2 2014 job growth in Silicon Valley was bifurcated. For exam-ple, of the four major areas of economic activity examined, Innovation and Information Products & Services jobs have grown rapidly during the recovery (+17% since 2010) and are up 16% since pre-recession, while Other Manufacturing jobs are still 22% below pre-recession levels. And while the number of jobs in Silicon Valley overall grew between Q2 2013 and Q2 2014, there were losses in nearly half of the job categories exam-ined, including Technical & Management Consulting Services (-2,045 jobs, 8.1% fewer than Q2 2013); Arts, Entertainment & Recreation (-1,173 jobs, 6.3% fewer than Q2 2013); Food & Beverage Manufacturing (-1,120 jobs, 13.4% fewer than Q2 2013); and Local Government Administration (-914 jobs, 2% fewer than Q2 2013).
The unemployment rate in Silicon Valley has continued to decline since the high of 11% in 2010, reaching 4.8% in November 2014,4 just slightly higher than San Francisco’s 4.4% unemployment rate. Unemployment
2. Definitions of industry categories are included in Appendix B.3. See Appendix A for job totals and percent change in employment by category.4. Residential employment data used to compute unemployment rates are from the United States Bureau of Labor Statistics and are based on the two-county definition of Silicon Valley including Santa Clara and San Mateo counties.
Continued from page 16

20
Total Employment by TierSilicon Valley
0
100,000
200,000
300,000
400,000
500,000
600,000
700,000
'14'13'12'11'10'09'08'07'06'05'04'03'02'01
Tier 3Tier 2Tier 1
Note: Definitions of Tier 1, Tier 2, and Tier 3 jobs are included in Appendix B | Data Sources: BW Research; U.S. Bureau of Labor Statistics, Quarterly Census of Employment and Wages; California Employment Development Department; EMSI | Analysis: BW Research
EMPLOYMENT
Percent Change in Employment, by TierSilicon Valley
TIER 2
TIER 3
TOTAL
2010 - 2014
+11.4%
TIER 1 +13.4%
+16.6%
+14.4%
EMPLOYMENTECONOMY
Silicon Valley employment gains have occurred across all Tiers, but gains for Tier 3 jobs have been more rapid during the recovery.
Silicon Valley’s share of mid-skill/mid-wage jobs has declined by 4.5 percentage points since 2001.
4.5 percentage points

21
ECON
OMYEmployment
Income
Innovation & Entrepreneurship
Commercial Space
Percent of Total Employment by TierSilicon Valley
0%
10%
20%
30%
40%
50%
60%
70%
80%
90%
100%
'14'13'12'11'10'09'08'07'06'05'04'03'02'01
Tier 1 Tier 2 Tier 3
28.5
%47
.4%
24.1
%
29.6
%46
.7%
23.7
%
30.4
%46
.1%
23.5
%
30.9
%45
.8%
23.3
%
31.0
%45
.5%
23.4
%
31.1
%45
.4%
23.5
%
31.3
%45
.0%
23.8
%
31.4
%44
.6%
24.0
%
31.7
%43
.8%
24.5
%
31.8
%43
.7%
24.5
%
31.9
%43
.6%
24.6
%
32.5
%42
.9%
24.6
%
32.5
%43
.0%
24.6
%
32.7
%42
.9%
24.4
%
Note: Definitions of Tier 1, Tier 2, and Tier 3 jobs are included in Appendix B | Data Sources: BW Research; U.S. Bureau of Labor Statistics, Quarterly Census of Employment and Wages; California Employment Development Department; EMSI | Analysis: BW Research
EMPLOYMENT
The share of Silicon Valley employment in Tier 2 jobs has decreased by nearly 3% over the last decade, although year-to-year changes have been relatively small.
*Data for Two or More Races is not available for San Mateo County for 2007. | Note: Other includes the categories Some Other Race and Two or More Races | Data Source: United States Census Bureau, American Community Survey | Analysis: Silicon Valley Institute for Regional Studies
Residents Over 16 Years of Age, by Race/EthnicitySanta Clara & San Mateo Counties
0%
2%
4%
6%
8%
10%
12%
AsianWhiteOtherHispanic or Latino
Black or African American
'12 '13'11'10'09'08'07
UNEMPLOYED RESIDENTS’ SHARE OF THE WORKING AGE POPULATION
Unemployment declined across all racial and ethnic groups between 2012 and 2013, but remained much higher in 2013 than pre-recession levels.
22
WHY IS THIS IMPORTANT?Income growth is as important a measure of Silicon Valley’s economic vitality as is job growth. Considering multiple income measures together provides a clearer picture of regional prosperity and its distribution. Real per capita income rises when a region generates wealth faster than its population increases. The median household income is the income value for the household at the middle of all income values. Examining income by educational attainment, gender, race/ethnicity and occu-pational groups reveals the complexity of our income gap. The share of households living under the federal poverty limit and Self-Sufficiency Standard, as well as the percentage of public school students receiving free or reduced price meals (FRPM), are indicators of family poverty.1
HOW ARE WE DOING? This analysis includes a variety of income measures (per capita income, individual and household median income, and median wages) presented after inflation adjustment, which accounts for the rising cost of goods and services within the region. It is important to note that while nominal (unadjusted) income may exhibit an upward trend, inflation-adjusted
1. To be eligible for the FRPM program, family income must fall below 130% of the federal poverty guidelines for free meals and below 185% for reduced price meals. The federal poverty limit for Santa Clara and San Mateo Counties in 2014 ranged from $11,670 for a one-person household to $40,090+ for a household with eight or more people. The poverty limit for a family of four was $23,850.
income may not. When this happens, it is referred to as income (or wage) lag.
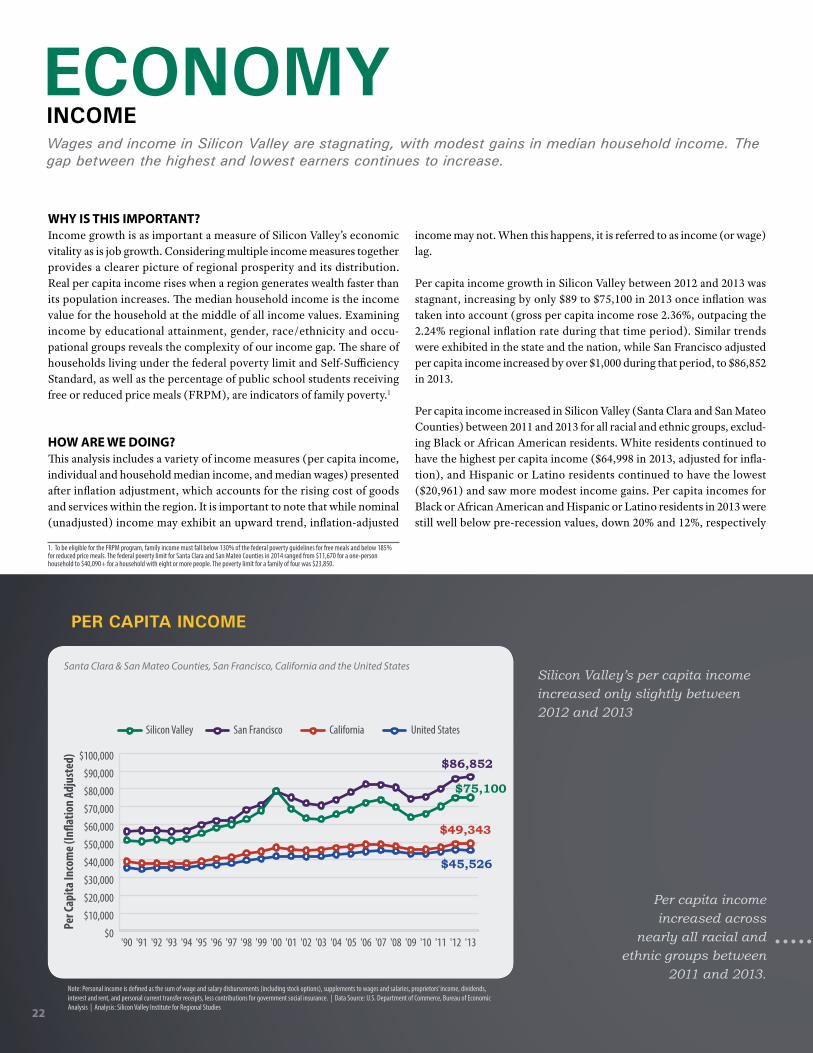
Per capita income growth in Silicon Valley between 2012 and 2013 was stagnant, increasing by only $89 to $75,100 in 2013 once inflation was taken into account (gross per capita income rose 2.36%, outpacing the 2.24% regional inflation rate during that time period). Similar trends were exhibited in the state and the nation, while San Francisco adjusted per capita income increased by over $1,000 during that period, to $86,852 in 2013.
Per capita income increased in Silicon Valley (Santa Clara and San Mateo Counties) between 2011 and 2013 for all racial and ethnic groups, exclud-ing Black or African American residents. White residents continued to have the highest per capita income ($64,998 in 2013, adjusted for infla-tion), and Hispanic or Latino residents continued to have the lowest ($20,961) and saw more modest income gains. Per capita incomes for Black or African American and Hispanic or Latino residents in 2013 were still well below pre-recession values, down 20% and 12%, respectively
Santa Clara & San Mateo Counties, San Francisco, California and the United States
Per C
apita
Inco
me (
In�a
tion
Adju
sted
)
$0
$10,000
$20,000
$30,000
$40,000
$50,000
$60,000
$70,000
$80,000
$90,000
$100,000
'13'12'11'10'09'08'07'06'05'04'03'02'01'00'99'98'97'96'95'94'93'92'91'90
California United StatesSan FranciscoSilicon Valley
$86,852
$75,100
$45,526
$49,343
Note: Personal income is defined as the sum of wage and salary disbursements (including stock options), supplements to wages and salaries, proprietors’ income, dividends, interest and rent, and personal current transfer receipts, less contributions for government social insurance. | Data Source: U.S. Department of Commerce, Bureau of Economic Analysis | Analysis: Silicon Valley Institute for Regional Studies
PER CAPITA INCOME
Silicon Valley’s per capita income increased only slightly between 2012 and 2013
INCOMEWages and income in Silicon Valley are stagnating, with modest gains in median household income. The gap between the highest and lowest earners continues to increase.
ECONOMY
Per capita income increased across
nearly all racial and ethnic groups between
2011 and 2013.

23
Santa Clara & San Mateo Counties
Per C
apita
Inco
me (
In�a
tion
Adju
sted
)
$0
$10,000
$20,000
$30,000
$40,000
$50,000
$60,000
$70,000
Hispanic or LatinoMultiple & OtherBlack or African American
AsianWhite
2007
2009
2011
2013
$64,998
$46,028
$26,466 $24,847$20,961
Note: Multiple & Other includes Native Hawaiian & Other Pacific Islander Alone, American Indian & Alaska Native alone, Some other race alone and Two or more races; Personal income is defined as the sum of wage or salary income, net self-employment income, interest, dividends, or net rental welfare payments, retirement, survivor or disability pensions; and all other income; White, Asian, Black or African American, Multiple & Other are non-Hispanic. Data Source: United States Census Bureau, American Community Survey | Analysis: Silicon Valley Institute for Regional Studies
PER CAPITA INCOME BY RACE & ETHNICITY
ECON
OMYEmployment
Income
Innovation & Entrepreneurship
Commercial Space
Percent Change in Per Capita Income | 2007-2013
WHITE
ASIAN
BLACK OR AFRICANAMERICAN
Silicon Valley San Francisco California United States
MULTIPLE & OTHER
HISPANIC OR LATINO
+0.2%
-0.8%
-20.6%
0.0%
-11.7%
+2.3%
+10.1%
-1.8%
-17.5%
+8.5%
-4.0%
-1.7%
-5.9%
-10.0%
-9.6%
-4.1%
-2.5%
-4.9%
-8.3%
-7.5%
since 2007. During that same period of time, San Francisco saw an increase of 8.5% in per capita income for Hispanic or Latino residents.
Between 2012 and 2013, median household income in Silicon Valley (Santa Clara and San Mateo Counties) narrowly kept up with the region’s rising cost of goods and services, increasing by $1,252 (+1.3%) after infla-tion-adjustment during that time period, to $94,534. In San Francisco and the U.S., median household income rose $2,920 (+3.8%) and $1,032 (+1.7%), respectively, between 2012 and 2013. At the state level, median household income remained relatively constant, up only $129 (+0.2%) during the same time period. While 2013 median household incomes in Silicon Valley, California and the U.S. were $1,000 to $3,600 (after inflation-adjustment) less than a decade prior, San Francisco’s median household income rose by 7.4% (nearly $5,500) since 2003.
Nominal Silicon Valley average wages increased 4.6% between 2013 and 2014, outpacing inflation by 1.6%. Average inflation-adjusted wages increased by $1,571 in 2014 to $100,983, continuing the upward trend since 2008 while remaining far above San Francisco ($89,085, up 2% from 2013), Alameda County ($64,395, down 1.5%), the rest of the Bay

24
Santa Clara & San Mateo Counties, San Francisco,California, and the United States
Med
ian
Hous
ehol
d In
com
e (In
�atio
n Ad
just
ed)
$0
$20,000
$40,000
$60,000
$80,000
$100,000
$120,000
20132012201120102009200820072006200520042003200220012000
CaliforniaSan FranciscoSilicon Valley United States
$94,534
$79,778
$61,320
$53,138
Note: Household income includes wage or salary income; net self-employment income; interest, dividents, or net rental or royalty income from estates and trusts; Social Security or railroad retirement income; Supplemental Security income; public assistance or welfare payments; retirement, survivor, or disability pensions; and all other income; excluding stock options. | Data Source: U.S. Census Bureau, American Community Survey | Analysis: Silicon Valley Institute for Regional Studies
MEDIAN HOUSEHOLD INCOME
Percent Change in Inflation-Adjusted Median Household Income
SILICON VALLEY
SAN FRANCISCO
CALIFORNIA
2012 - 2013
+1.3%
+3.8%
+1.7%
UNITED STATES +0.2%
Median household income increased in Silicon Valley, San Francisco, California, and the United States.
INCOMEECONOMY
Area ($55,609, down -0.8%) and the state ($58,623, up 0.5%). During the recovery period (since 2010), average wages in Silicon Valley, San Francisco, and California increased (by 9.4%, 5.2%, and 1.4%, respec-tively), outpacing inflation, while average wages in Alameda County and the Rest of the Bay Area remained 5.0% and 2.8% lower in 2014 than in 2010, respectively. These gains in average wages are highly influenced by the high-wage occupations such as Management Occupations, Business and Financial Operations Occupations, Computer and Mathematical Occupations, Architecture and Engineering Occupations, and Healthcare Practitioners and Technical Occupations. Sales and Related Occupations also contributed to gains in average wages between 2010 and 2014.
But while average wages in Silicon Valley and California increased over-all between 2010 and 2014, inflation-adjusted median wages declined by 2.5% in the two Metropolitan Statistical Areas covering Silicon Valley2 and by 2% in California during that time period. Inflation-adjusted median wages for Management, Business, Science and Arts Occupations decreased by 2.3% between 2010 and 2014 as a whole (compared to -2.0% throughout the state), with the greatest losses in wages for Arts, Design, Entertainment, Sports, and Media Occupations (down 10.6%
2. The two Metropolitan Statistical Areas (MSAs) covering Silicon Valley are the San Jose-Sunnyvale-Santa Clara MSA (including San Benito and Santa Clara Counties) and the San Francisco-San Mateo-Redwood City MSA (including Marin, San Francisco and San Mateo Counties).
since 2010). Median wages for Natural resources, construction, and maintenance occupations decreased by 8.3% since 2010, after inflation-adjustment, with the greatest losses for Farming, Fishing, and Forestry Occupations (-21.7% since 2010). And, despite a 6.2% increase in the total number of jobs, Service Occupations as a whole in the two Silicon Valley MSAs experienced the largest decline in median wages, after infla-tion adjustment, down 9% since 2010, with the greatest losses in wages for Personal Care and Service Occupations (-14.4% since 2010) and Protective Service Occupations (-12.7% since 2010).
The only job types that experienced median wage growth between 2010 and 2014 in the two Silicon Valley MSAs were Healthcare Practitioners and Technical Occupations (median wages up 9.6% to $109,308) and Healthcare Support Occupations (up 2.6% to $37,451). Between 2013 and 2014, inflation-adjusted median wages decreased across nearly all major occupational groups except Management, Business, Science, and Arts Occupations (+0.9% since 2013, compared to a 0.4% loss through-out the state), primarily due to wage gains for Life, Physical, and Social Science Occupations (+3.9%) and Healthcare Practitioners and Technical Occupations (+5.3%). While the MSA data may be highly influenced

25
ECON
OMYEmployment
Income
Innovation & Entrepreneurship
Commercial Space
Combined San Jose-Sunnyvale-Santa Clara and San Francisco-San Mateo-Redwood City MSAs
$0
$20,000
$40,000
$60,000
$80,000
$100,000
$120,000
20142013201220112010
Production, Transportation and Material Moving Occupations
Natural Resources, Construction and Maintenance Occupations
Sales and O�ce Occupations
Service Occupations
Management, Business, Science and Arts Occupations
Data Source: California Employment Development Department | Analysis: BW Research; Silicon Valley Institute for Regional Studies
MEDIAN WAGES FOR VARIOUS OCCUPATIONAL CATEGORIES
Silicon Valley, San Francisco, Alameda County, Rest of Bay Area, and California
Aver
age W
age (
In�a
tion-
Adju
sted
)
$0
$20,000
$40,000
$60,000
$80,000
$100,000
$120,000
'14'13'12'11'10'09'08'07'06'05'04'03'02'01
$100,983
$89,085
$64,395
$58,623
$55,609
Silicon Valley San Francisco Alameda County Rest of Bay Area California
Note: Rest of Bay Area includes all of the 9-County Bay Area except Silicon Valley, San Francisco, and Alameda County; 2013 to 2014 average wages were updated to reflect Q2 reported growth. | Data Sources: U.S. Bureau of Labor Statistics, Quarterly Census of Employment and Wages; EMSI | Analysis: BW Research
AVERAGE WAGES
Percent Change in Inflation-Adjusted Median Wages for Various Occupational Categories2010-2014
SILICONVALLEY MSAs
CALIFORNIA
-0.4%-2.3%MANAGEMENT, BUSINESS, SCIENCE AND ARTS OCCUPATIONS
-2.3%-9.0%SERVICE OCCUPATIONS
-0.9%-4.1%SALES AND OFFICE OCCUPATIONS
-0.8%-8.3%NATURAL RESOURCES, CONSTRUCTION AND MAINTENANCE OCCUPATIONS
-1.9%-6.2%PRODUCTION, TRANSPORTATION AND MATERIAL MOVING OCCUPATIONS
Trends in median wages between 2010 and 2014 varied
by occupational category.
Average wages in Silicon Valley remain higher than the rest of the Bay Area, and California.

26
Silicon Valley, San Francisco, Bay Area, Alameda County and California2014
Med
ian
Wag
es (I
n�at
ion
Adju
sted
)
$0
$20,000
$40,000
$60,000
$80,000
$100,000
$120,000
$140,000
CaliforniaBay AreaAlameda CountySan FranciscoSilicon Valley
Tier 3Tier 2Tier 1
Note: Definitions of Tier 1, Tier 2, and Tier 3 jobs are included in Appendix B | Data Sources: BW Research; U.S. Bureau of Labor Statistics, Quarterly Census of Employment and Wages; California Employment Development Department; EMSI | Analysis: BW Research
MEDIAN WAGES BY TIER
The gap between median wages for Tiers 1 and 3 is wider in Silicon Valley than other parts of the Bay Area and California.
INCOMEECONOMY
by trends in counties outside of Silicon Valley and San Francisco (San Benito and Marin), they may be indicative of the relative trends in Silicon Valley median wages among occupational groups.
Median wages not only vary by occupational category, but also by wage and skill level. In 2014, median wages for Tier 1 (high-skill, high-wage) jobs in Silicon Valley were $118,651, compared to $54,892 for Tier 2 (middle-skill, middle-wage), and $26,847 for Tier 3 (low-skill, low-wage). Median wages for Tier 1 jobs were higher in Silicon Valley than in San Francisco ($105,456), Alameda County ($102,648), the entire 9-County Bay Area ($109,470), and California ($93,933). In contrast, Tier 2 and Tier 3 median wages were higher in San Francisco (at $56,784 and $29,973, respectively) than in Silicon Valley or the other geographies. One stark contrast in median wages by Tier in 2014 is the gap between Tier 1 and Tier 3 wages, which is $91,804 in Silicon Valley compared to a range of $69,992 to $82,222 elsewhere in the Bay Area and in California as a whole. In Silicon Valley, median wages for Tier 1 jobs were 4.4 times the median wages for Tier 3 jobs in 2014, compared to a multiplier of 3.5-4.0 among the other geographies.
As income in Silicon Valley is, on average, relatively high compared with other parts of the state, country and world, the percentage of Silicon Valley households living below the federal poverty limit is relatively low (7.6% in Santa Clara and San Mateo Counties, compared to 9.1% in San Francisco and 13.4% in the state in 2012). And, while 10.1% of Silicon Valley residents (7.6% of households) were living in poverty in 2012, the percentage decreased slightly to 9.7% in 2013. However, despite the low poverty levels, nearly 30% of the region’s population does not make enough money to meet their basic needs without public assistance. Additionally, 37% of Silicon Valley public school students in 2012 and 2013 (and 38% in 2014) were receiving free or reduced price meals. In comparison, California’s percentage of students receiving free or reduced price meals increased by one percent to 59% in 2014, reaching a decade high.
The share of lower income (<$35,000 per year) and middle income (between $35,000 and $149,000) households in Santa Clara and San Mateo Counties declined by 0.7 (-4,821 households) and 2.2 percentage points (-15,990 households), respectively, between 2012 and 2013, while

27
Note: Income ranges are based on nominal values. Household income includes wage and salary income, net self-employment income, interest dividends, net rental or royalty income from estates and trusts, Social Security or railroad retirement income, Supplemental Security Income, public assistance or welfare payments, retirement, survivor, or disability pensions, and all other income excluding stock options. Data Source: United States Census Bureau, American Community Survey | Analysis: Silicon Valley Institute for Regional Studies
DISTRIBUTION OF HOUSEHOLDS BY INCOME RANGES
Silicon Valley California United States
Distribution of Households by Income Ranges Santa Clara & San Mateo Counties, California, and the United States
0%
10%
20%
30%
40%
50%
60%
70%
80%
90%
100%$150,000 or more$35,000 to $149,000Less than $35,000
'13'12'11'10'09'13'12'11'10'09'13'12'11'10'09
27%
55%
18%
27%
54%
19%
26%
54%
20%
26%
55%
20%
29%
52%
19%
15%
58%
28%
14%
57%
29%
14%
56%
31%
14%
56%
30%
14%
56%
31%
10%
57%
33%
10%
57%
35%
9%
56%
35%
10%
56%
34%
9%
56%
35%
The share of middle income households has declined in Silicon Valley, California and the United States.
Percentage of Households Living in Poverty and Below Self-Sufficiency Standards, 2012Santa Clara & San Mateo Counties, San Francisco, and California
0%
5%
10%
15%
20%
25%
30%
35%
40%
45%
CaliforniaSan FranciscoSilicon Valley
Below Self-Su�ciency Standard and Above Poverty Below Poverty
29.5%26.7%
17.6%
9.1%
21.9%
7.6%
24.9%
13.4%
38.3%
Note: The Self-Sufficiency Standard defines the amount of income necessary to meet basic needs without public subsidies or private/informal assistance. The federal poverty limit for Santa Clara and San Mateo Counties in 2012 ranged from $11,170 for a one-person household to $38,890+ for a household with eight or more people. The poverty limit for a family of four was $23,050. | Data Source: Center for Women’s Welfare; United States Department of Health & Human Services | Analysis: Silicon Valley Institute for Regional Studies
POVERTY AND SELF-SUFFICIENCY
Nearly 30% of Silicon Valley’s population lives below the Self-Sufficiency Standard.
ECON
OMYEmployment
Income
Innovation & Entrepreneurship
Commercial Space

28
Santa Clara & San Mateo Counties
Med
ian
Inco
me (
In�a
tion
Adju
sted
)
$0
$20,000
$40,000
$60,000
$80,000
$100,000
$120,000
Graduate or Professional Degree
Bachelor's Degree
Some College or Associate's
Degree
High School Graduate
(includes equivalency)
Less than High School
Graduate
2006
2007
2008
2009
2010
2011
2012
2013
'13'12'11'10'09'08'07'06
Note: Some College includes Less than 1 year of college; Some college, 1 or more years, no degree; Associate degree; Professional certification. The 2008 value for Graduate or Professional Degree is for San Mateo County only. | Data Source: United States Census Bureau, American Community Survey | Analysis: Silicon Valley Institute for Regional Studies
INDIVIDUAL MEDIAN INCOME BY EDUCATIONAL ATTAINMENT
Percent Change in Median Income by Educational Attainment | 2012-2013
Less than High School Graduate -1.1% +0.6% +2.3%
High School Graduate (includes equivalency) +4.9% +0.2% -0.3%
Some College or Associate's Degree -2.2% +0.4% -1.5%
Bachelor's Degree +5.2% -2.0% +0.3%
Graduate or Professional Degree +3.0% +0.9% -0.8%
San Francisco
+3.0%
+1.6%
-0.2%
+1.6%
-0.7%
Silicon Valley California United States
Changes in median income varied by level of educational attainment.
INCOMEECONOMY
the share of households earning more than $150,000 increased nearly three percentage points (+25,622 households). Similar trends were exhibited at the state and national level, but to a lesser degree.
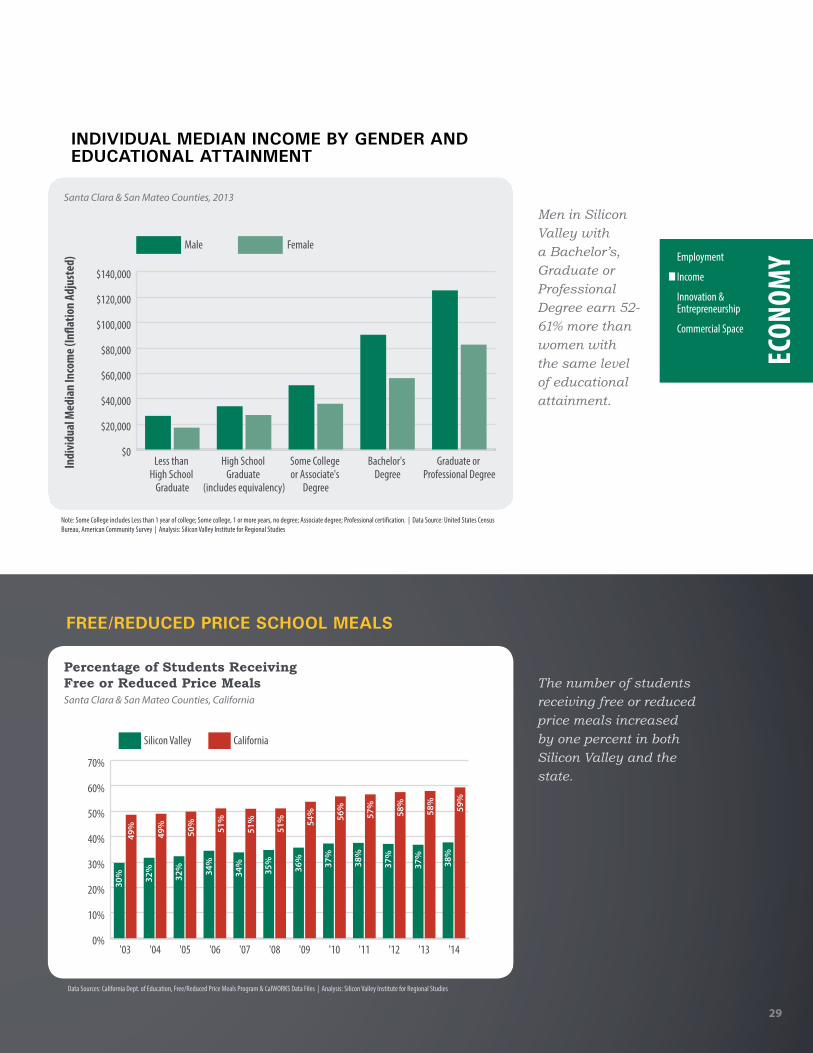
Individual (inflation adjusted) median income in Silicon Valley increased between 2012 and 2013 for residents who never graduated high school (up 3% to $22,667), those with a high school diploma (up 1.6% to $31,494), and those with a bachelor’s degree (up 1.6% to $73,123). For residents with some college or associate’s degree, and those with a gradu-ate or professional degree, individual median income declined during that same period (down 0.2% to $42,670 and down 0.7% to $105,064, respectively). In 2013, median individual income for Silicon Valley resi-dents with a graduate or professional degree was $82,000 (365%) more than for those with less than a high school diploma. This compares to a gap of $70,000 in San Francisco, $59,000 in California, and $46,000 in the United States.
However, at each educational attainment level, women in Silicon Valley tend to earn less than men. For those with a bachelor’s degree in 2013 (220,000 men and 250,000 women), individual median income for men was 61% higher than for women (compared to 20% in San Francisco, 41% in California and 48% in the United States). At the graduate or profes-sional degree level (205,000 men and 168,000 women), men earned 52% more than their female peers (compared to 42% in San Francisco, 47% in California and 49% in the United States). This gender income gap in Silicon Valley is getting larger over time across nearly all levels of educa-tional attainment. For example, the gender income gap for Silicon Valley residents with a bachelor’s degree increased by over $5,000 between 2012 and 2013, from a difference of $29,090 between male and female median incomes to a difference of $34,233.
29
ECON
OMYEmployment
Income
Innovation & Entrepreneurship
Commercial Space
Data Sources: California Dept. of Education, Free/Reduced Price Meals Program & CalWORKS Data Files | Analysis: Silicon Valley Institute for Regional Studies
FREE/REDUCED PRICE SCHOOL MEALS
Percentage of Students Receiving Free or Reduced Price MealsSanta Clara & San Mateo Counties, California
0%
10%
20%
30%
40%
50%
60%
70%
'14'13'12'11'10'09'08'07'06'05'04'03
CaliforniaSilicon Valley
30%
49%
32%
49%
32%
50%
34%
51%
34%
51%
35%
51%
36%
54%
37%
56%
38%
57%
37%
58%
37%
58%
38%
59%
The number of students receiving free or reduced price meals increased by one percent in both Silicon Valley and the state.
Men in Silicon Valley with a Bachelor’s, Graduate or Professional Degree earn 52-61% more than women with the same level of educational attainment.
Santa Clara & San Mateo Counties, 2013
$0
$20,000
$40,000
$60,000
$80,000
$100,000
$120,000
$140,000
Graduate or Professional Degree
Bachelor's Degree
Some College or Associate's
Degree
High School Graduate
(includes equivalency)
Less than High School
Graduate
Indi
vidu
al M
edia
n In
com
e (In
�atio
n Ad
just
ed)
FemaleMale
INDIVIDUAL MEDIAN INCOME BY GENDER AND EDUCATIONAL ATTAINMENT
Note: Some College includes Less than 1 year of college; Some college, 1 or more years, no degree; Associate degree; Professional certification. | Data Source: United States Census Bureau, American Community Survey | Analysis: Silicon Valley Institute for Regional Studies

30
WHY IS THIS IMPORTANT?Innovation, a driving force behind Silicon Valley’s economy, is a vital source of regional competitive advantage. It transforms novel ideas into products, processes and services that create and expand business oppor-tunities. Entrepreneurship is an important element of Silicon Valley’s innovation system. Entrepreneurs are the creative risk takers who create new value and new markets through the commercialization of novel and existing technology, products and services. A region with a thriving inno-vation habitat supports a vibrant ecosystem to start and grow businesses.
Entrepreneurship, in both new and established businesses, hinges on investment and value generated by employees. Patent registrations track the generation of new ideas, as well as the ability to disseminate and commercialize these ideas. The activity of mergers and acquisitions (M&As) and initial public offerings (IPOs) indicate that a region is culti-vating successful and potentially high-value companies. Growth in firms without employees indicates that more people are going into business for themselves.
Finally, tracking both the types of patents and areas of venture capital (VC) investment over time provides valuable insight into the region’s
longer-term direction of development. Changing business and invest-ment patterns could point to a new economic structure supporting innovation in Silicon Valley.
HOW ARE WE DOING?Labor productivity or value added per employee, declined for the third year in a row to $162,421 in 2014 from a high of $170,024 in 2011. San Francisco and California showed similar trends, while labor productivity in the U.S. increased slightly (+0.3%) between 2013 and 2014. In 2014, labor productivity in Silicon Valley, San Francisco, California, and the United States had exceeded the 2008 low by 2.1%, 1.6%, 3.4% and 6.2%, respectively.
The number of Silicon Valley patent registrations continued to rise, reaching 16,975 in 2013 (1,910 more than the previous year). The larg-est share (40%) of the patents was in Computers, Data Processing and Information Storage, with a large share (24%) in Communications as well. Silicon Valley and San Francisco’s combined share of California patent registrations increased between 2012 and 2013 to 52.3% despite Silicon Valley’s share remaining steady at 47%. The region’s combined
Value Added Per EmployeeSanta Clara & San Mateo Counties, San Francisco, California and the United States
Valu
e Add
ed Pe
r Em
ploy
ee (I
n�at
ion
Adju
sted
)
$0
$20,000
$40,000
$60,000
$80,000
$100,000
$120,000
$140,000
$160,000
$180,000
'14'13'12'11'10'09'08'07'06'05'04'03'02'01'00'99'98'97'96'95'94'93'92'91'90
United StatesCaliforniaSan FranciscoSilicon Valley
Data Source: Moody’s Economy.com | Analysis: Silicon Valley Institute for Regional Studies
VALUE ADDED
Percent Change in Value Added Per Employee
SILICON VALLEY - 3.0%- 3.7%+ 2.1%
- 2.5%
- 0.8%
- 3.7%
- 1.5%
+ 1.6%
+ 3.4%
SAN FRANCISCO
CALIFORNIA
+ 0.3%+ 0.5%+ 6.2%UNITED STATES
2008-2014 2010-2014 2013-2014
Value added per employee declined in Silicon Valley, San Francisco, and California between 2013 and 2014.
INNOVATION & ENTREPRENEURSHIPSan Francisco’s rapidly increasing share of venture capital, Angel investment, patent registrations and merger and acquisition activity is making the city a significant contributor to the region’s innovation engine.
ECONOMY
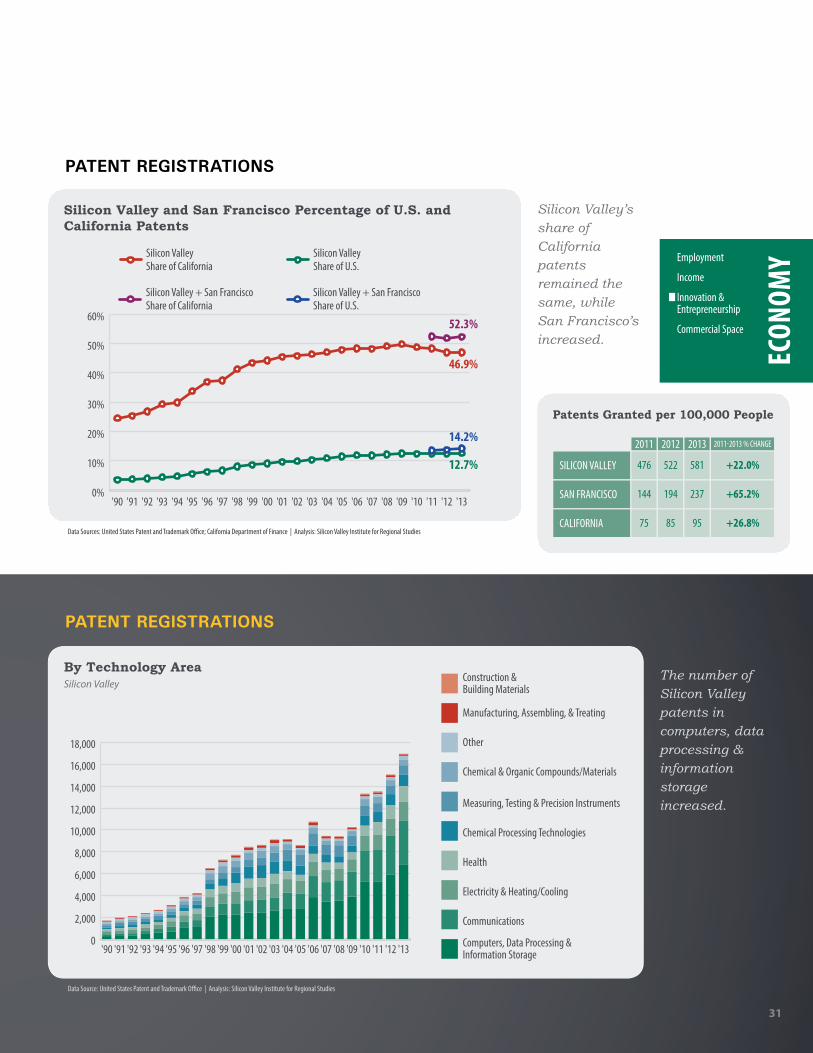
31
PATENT REGISTRATIONS
The number of Silicon Valley patents in computers, data processing & information storage increased.
ECON
OMYEmployment
Income
Innovation & Entrepreneurship
Commercial Space
By Technology AreaSilicon Valley
0
2,000
4,000
6,000
8,000
10,000
12,000
14,000
16,000
18,000
'13'12'11'10'09'08'07'06'05'04'03'02'01'00'99'98'97'96'95'94'93'92'91'90
Construction & Building Materials
Manufacturing, Assembling, & Treating
Other
Chemical & Organic Compounds/Materials
Measuring, Testing & Precision Instruments
Chemical Processing Technologies
Health
Electricity & Heating/Cooling
Communications
Computers, Data Processing & Information Storage
Data Source: United States Patent and Trademark Office | Analysis: Silicon Valley Institute for Regional Studies
Silicon Valley and San Francisco Percentage of U.S. and California Patents
0%
10%
20%
30%
40%
50%
60%
'13'12'11'10'09'08'07'06'05'04'03'02'01'00'99'98'97'96'95'94'93'92'91'90
46.9%
52.3%
12.7%
14.2%
Silicon Valley + San Francisco Share of California
Silicon Valley + San Francisco Share of U.S.
Silicon Valley Share of California
Silicon Valley Share of U.S.
PATENT REGISTRATIONS
Data Sources: United States Patent and Trademark Office; California Department of Finance | Analysis: Silicon Valley Institute for Regional Studies
Silicon Valley’s share of California patents remained the same, while San Francisco’s increased.
Patents Granted per 100,000 People
SILICON VALLEY
SAN FRANCISCO
CALIFORNIA
2011
476
144
75
2012
522
194
85
2013
581
237
95
2011-2013 % CHANGE
+22.0%
+65.2%
+26.8%

32
share of U.S. patent registrations increased from 13.8% in 2012 to 14.2% in 2013. The number of patents granted per 100,000 people in Silicon Valley (581 in 2013) remained much higher than San Francisco (237) or California as a whole (95). However, San Francisco and California increased per capita patent registrations more rapidly than Silicon Valley (at +65.2% and +26.8%, respectively, between 2011 and 2013, compared with +22.0% in Silicon Valley). Furthermore, between 2012 and 2013, San Francisco per capita patent registrations grew by 22.7% – more than twice the rate of Silicon Valley (11.1%) or California (11.8%).
Venture capital investments in Silicon Valley and San Francisco shot up in 2014, reaching $14.5 billion ($7.2 billion in San Francisco, and $7.4 billion in Silicon Valley) in the first three quarters alone – more than in any other year since 2000. The region’s share of California venture capital investments increased one and a half percentage points between 2013 and the end of the third quarter of 2014, reaching 73.7%. Meanwhile, the share of U.S. investments shot up nearly seven percentage points to 43% during the same time period. More than half (55%) of the VC invest-ments were in Software – a share that has risen steadily over the previous five years, from 21% in 2009, and is similar to the share in San Francisco
(56%). Much smaller shares went to Biotechnology (10%), Media and Entertainment (8%), Medical Devices and Equipment (8%) and several other industries. While the share of Silicon Valley venture capital invest-ments in networking and equipment companies was as high as 19% in 2002, it represented less than one percent of all Q1-3 2014 investments. Total VC investments for 2014 were highly affected by a handful of very large deals, including Uber Technologies ($1.2 billion) and five other deals over $200 million. It was also highly influenced by the increasing amount of investment into San Francisco companies, up 68% in Q3 2014 over 2013 totals.
Cleantech venture capital investments increased dramatically as well in 2014, reaching an all-time high of $3.27 billion. San Francisco also played a major role in the region’s increased investment, attracting 75% of the region’s total. Cleantech VC investments in San Francisco increased more than 300% over 2013 totals in the first three quarters of 2014. The region’s share of California and U.S. cleantech VC investments increased as well, reaching 80.2% and 53.1%, respectively, at the end of Q3. A large portion of Silicon Valley’s cleantech VC investments went into Energy Efficiency (40.6%). The share going into Solar increased for the first time
Silicon Valley venture capital investments reached a decade high, and the region’s share of U.S. investments increased dramatically in 2014.
Silicon Valley and San Francisco
Billi
ons o
f Dol
lars
(In�
atio
n Ad
just
ed)
$0
$5
$10
$15
$20
$25
$30
$35
$40
$45
'14*'13'12'11'10'09'08'07'06'05'04'03'02'01'000%
10%
20%
30%
40%
50%
60%
70%
80%
90%73.7%
43.0%
San Francisco
Silicon Valley Silicon Valley + San Francisco Share of California Total Investment
Silicon Valley + San Francisco Share of U.S. Total Investment
VENTURE CAPITAL INVESTMENT
*2014 data includes Q1-3. | Data Source: PricewaterhouseCoopers/National Venture Capital Association MoneyTreeTM Report, Data: Thomson Reuters | Analysis: Jon Haveman, Marin Economic Consulting; Silicon Valley Institute for Regional Studies
INNOVATION & ENTREPRENEURSHIPECONOMY

33
ECON
OMYEmployment
Income
Innovation & Entrepreneurship
Commercial Space
Silicon Valley
0%
10%
20%
30%
40%
50%
60%
70%
80%
90%
100%
'14*'13'12'11'10'09'08'07'06'05'04'03'02
Networking and Equipment
Telecommunications
Semiconductors
Consumer Products and Services
Computers and Peripherals
Industrial/Energy
Other*
Medical Devices and Equipment
IT Services
Biotechnology
Media and Entertainment
Software
VENTURE CAPITAL BY INDUSTRY
*2014 data includes Q1-3 | Data Source: PricewaterhouseCoopers/National Venture Capital Association MoneyTreeTM Report, Data: Thomson Reuters | Analysis: Jon Haveman, Marin Economic Consulting; Silicon Valley Institute for Regional Studies
Pure Storage Inc. $ 225.0 Computers and Peripherals
Tangome Inc. $ 200.0 Software
Palantir Technologies Inc. $ 165.1 Software
Houzz Inc. $ 165.0 Media and Entertainment
Cloudera Inc. $ 160.0 Software
Box Inc. $ 158.2 Software
Nutanix Inc. $ 145.0 Software
Proteus Digital Health Inc. $ 119.5 Biotechnology
DataStax Inc. $ 106.0 Software
Palantir Technologies Inc. $ 101.6 Software
Uber Technologies Inc. $ 1,200.0 Software
Dropbox Inc. $ 325.0 IT Services
Lyft Inc. $ 250.0 Software
AirBnB Inc. $ 200.0 Consumer Products and Services
Pinterest Inc. $ 160.0 Media and Entertainment
SunRun Inc. $ 150.0 Industrial/Energy
Lookout Inc. $ 150.0 Software
Kabam Inc. $ 120.0 Software
One Kings Lane $ 111.9 Consumer Products and Services
Thumbtack Inc. $ 100.0 Media and Entertainment
Anaplan Inc. $100.0 Software
New Relic Inc. $ 100.0 Software
Investee Company Name
SILICON VALLEYAmount
(millions) Industry Investee Company Name
SAN FRANCISCOIndustryAmount
(millions)
TOP VENTURE CAPITAL DEALS OF Q1-3 | 2014
The share of total Silicon Valley venture capital investments in software increased for the fifth year in a row.

34
Cleantech venture capital investments reached an all-time high in 2014.
Billi
ons o
f Dol
lars
Inve
sted
(In�
atio
n Ad
just
ed)
Perc
ent o
f Cal
iforn
ia &
U.S
. Tot
al In
vest
men
t
Billions of Dollars Invested, and Share of California & U.S. Total Investment Silicon Valley and San Francisco
$0.0
$0.5
$1.0
$1.5
$2.0
$2.5
$3.0
$3.5
$4.0
'14*'13'12'11'10'09'08'07'06'05'04'03'02 0.0%
12.5%
25.0%
37.5%
50.0%
62.5%
75.0%
87.5%
100.0%
80.2%
53.1%
San Francisco Total
Silicon Valley Total
Silicon Valley + San Francisco Share of U.S. Total
Silicon Valley + San Francisco Share of California Total
*2014 data is for Q1-3 | Data Source: Cleantech Group’s i3 Platform (i3.cleantech.com) | Analysis: Silicon Valley Institute for Regional Studies
VENTURE CAPITAL INVESTMENT IN CLEAN TECHNOLOGY
INNOVATION & ENTREPRENEURSHIPECONOMY
after a three-year downward trend, reaching 14.8% in 2014. And while the total number of cleantech VC investment deals in San Francisco has continued to rise each year since 2003, the number of deals in Silicon Valley has been declining since 2011 (indicating a trend toward larger amounts of capital per deal).
Angel investment totals in Silicon Valley are on pace to reach 2013 totals, while San Francisco exceeded 2013 in the first three quarters of 2014 alone. While Silicon Valley’s proportion of Series A+1 to Seed Stage Angel investment remained relatively the same in 2014, San Francisco received a much larger share of Series A+ investments. This is an indica-tor of accelerated growth in San Francisco’s startups. The region’s total share of California Angel investments remained relatively steady (at 85%) based on the first three quarters of 2014.
There were 275 U.S. Initial Public Offerings in 2014, 23 of which were Silicon Valley companies – three more than the prior year. There was a more pronounced increase in the number of IPOs in the rest of California, with 35 in 2014 (up from 23 in 2013), five of which were San Francisco companies. Other U.S. companies represented 151 of the
1. Series A+ rounds are typically led by institutional investors, such as traditional Venture Capital firms. Angels, however, may have the opportunity to participate in these rounds as follow-ons to their seed stage investment in companies.
IPOs, nine more than in 2013. For the second year in a row, there was a huge jump in the number of international companies going public on U.S. exchanges, including many from China (21%), Israel (18%), and the United Kingdom (11%), among 19 other countries. Despite increases in the number of IPOs in Silicon Valley, the region’s share of California pricings fell to 40% -- seven percentage points fewer than 2013 and 12 percentage points fewer than the recent peak (51.5% of California IPOs) in 2012. The region’s share of U.S. pricings rose very slightly, from 10.8% in 2013 to 11.0% in 2014.
Silicon Valley was on pace to reach 2013 merger and acquisition activity levels as of Q3 2014, while San Francisco exceeded the number of deals in 2013 in the first three quarters of 2014 alone. During that time period, there were 560 M&A deals involving Silicon Valley companies, and 403 involving San Francisco companies. While San Francisco increased the number of Target deals (deals in which a San Francisco company was acquired) in 2013, 2014 revealed a large portion (54%) of Acquirer Only deals (deals in which the acquiring company was located in San Francisco and the acquired company was located elsewhere). The share of Acquirer Only deals in Silicon Valley increased as well, while the number of Target

35
The number of cleantech venture capital deals in Silicon Valley declined for the third year in a row, while San Francisco deals increased in number.
Total Number of Cleantech Venture Capital DealsSilicon Valley and San Francisco
0
20
40
60
80
100
120
'14*'13'12'11'10'09'08'07'06'05'04'03'02
San FranciscoSilicon Valley
*2014 data is for Q1-3 | Data Source: Cleantech Group’s i3 Platform (i3.cleantech.com) | Analysis: Silicon Valley Institute for Regional Studies
ECON
OMYEmployment
Income
Innovation & Entrepreneurship
Commercial Space
Percentage of Total Cleantech Venture Capital Investment Silicon Valley
0%
10%
20%
30%
40%
50%
60%
70%
80%
90%
100%
'14*'13'12'11'10'09'08'07'06'05'04'03'02
Smart Grid
Geothermal
Recycling & Waste
Water & Wastewater
Air
Conventional Fuels
Fuel Cells & Hydrogen
Advanced Materials
Energy Storage
Biofuels & Biochemicals
Agriculture & Food
Other Cleantech
Transportation
Energy E�ciency
Solar
*2014 data is for Q1-3. | Data Source: Cleantech Group’s i3 Platform (i3.cleantech.com) | Analysis: Silicon Valley Institute for Regional Studies
VENTURE CAPITAL INVESTMENT IN CLEAN TECHNOLOGY, BY SEGMENT
The share of cleantech investment in the region going to solar increased in 2014, along with biofuels and biochemical, agriculture and food.

36
Silicon Valley, San Francisco, and California
Mill
ions
of D
olla
rs In
vest
ed (I
n�at
ion
Adju
sted
)
$0
$600
$1,200
$1,800
$2,400
$3,000
2014*2013201220110%
20%
40%
60%
80%
100%
San Francisco Seed Stage
San Francisco Series A+
Silicon Valley Seed Stage
Silicon Valley Series A+Silicon Valley + San Francisco Share of California Total
*2014 data is through Q3 | Data Source: CB Insights | Analysis: Silicon Valley Institute for Regional Studies
ANGEL INVESTMENT
Total angel investment in the region in the first three quarters of 2014 exceeded the 2013 total.
INNOVATION & ENTREPRENEURSHIPECONOMY
and Acquirer deals (where both the Target and Acquirer were located in Silicon Valley) decreased from 14% in 2013 to less than 10% in 2014. Despite increases in M&A activity, the region’s share of California and U.S. M&A activity remained unchanged from 2013 at 41% and 10%, respectively.
The number of businesses without employees continued to climb between 2011 and 2012, reaching over 190,000. During that time period, the region’s entrepreneurs started 2,893 more firms in Silicon Valley and 1,482 in San Francisco. In 2012, 26% of the region’s nonemployer firms were in the Professional, Scientific & Technical Services sector, whereas this sector only encompassed 14% of firms without employees nation-ally, and 17.5% statewide. This suggests that Silicon Valley is specialized in the sector.

37
Angel Investment, by StageSilicon Valley, San Francisco, and California
Silicon Valley San Francisco California
$0
$500
$1,000
$1,500
$2,000
$2,500
$3,000
$3,500
2014*201320122011$0
$500
$1,000
$1,500
$2,000
$2,500
$3,000
$3,500
2014*201320122011$0
$500
$1,000
$1,500
$2,000
$2,500
$3,000
$3,500
2014*201320122011
Mill
ions
of D
olla
rs In
vest
ed (I
n�at
ion
Adju
sted
)
Seed StageSeries A+
*2014 data is through Q3 | Data Source: CB Insights | Analysis: Silicon Valley Institute for Regional Studies
ANGEL INVESTMENT, BY STAGE
90% of Silicon Valley Angel investments in 2014 were in Series A+ rounds.
ECON
OMYEmployment
Income
Innovation & Entrepreneurship
Commercial Space
IPO pricings were up in Silicon Valley, California, and the U.S., with more international companies listed on U.S. stock exchanges.
Total Number of U.S. IPO PricingsSilicon Valley, Rest of California, Rest of the United States, and International Companies
0
50
100
150
200
250
300
'14'13'12'11'10'09'08'07
Silicon Valley
Rest of California
Rest of U.S.
International
2327
162
60 53
76
14
11
27 37
72
131512
82
1412
4326
142
2320
66
151
3523
17161
523
INITIAL PUBLIC OFFERINGS
Note: Location based on corporate address provided by IPO ETF manager Renaissance Capital. | Data Source: Renaissance CapitalAnalysis: Silicon Valley Institute for Regional Studies

38
MERGERS AND ACQUISITIONS
Num
ber o
f Dea
ls
Perc
enta
ge of
Calif
orni
a and
U.S
. Dea
ls
Number of Deals and Share of California and U.S. DealsSilicon Valley, San Francisco, California, and the United States
0
150
300
450
600
750
2014*2013201220110%
10%
20%
30%
40%
50%
San Francisco
Silicon Valley
Silicon Valley + San Francisco Percentage of Total U.S. Deals
Silicon Valley + San Francisco Percentage of Total California Deals
Silicon Valley San Francisco
Percentage of Merger & Acquisition Deals by Participation TypeSilicon Valley and San Francisco
0%
10%
20%
30%
40%
50%
60%
70%
80%
90%
100%
2014*2013201220110%
10%20%30%40%50%60%70%80%90%
100%
2014*201320122011
Acquirer & Target dealsAcquirer Only dealsTarget Only deals
13.8%
53.3%
32.9%
12.7%
55.2%
32.1%
13.9%
55.4%
30.7%
9.6%
58.6%
31.8%
8.0%
54.4%
37.6%
6.9%
53.9%
39.2%
11.4%
44.7%
43.9%
8.2%
53.8%
38.0%
*Data is through the third quarter of 2014 | Note: Deals include Acquirers and Targets | Data Source: FactSet Research Systems, Inc. | Analysis: Silicon Valley Institute for Regional Studies
*Data is through the third quarter of 2014 | Note: Deals include Acquirers and Targets | Data Source: FactSet Research Systems, Inc. | Analysis: Silicon Valley Institute for Regional Studies
INNOVATION & ENTREPRENEURSHIPECONOMY
2014Chile 1.5%Singapore 1.5%Belgium 1.5%
Norway 1.5%Germany 1.5%Colombia 1.5%
Spain 1.5%Malaysia 1.5%Denmark 1.5%
Australia 3.0%
Luxembourg 3.0%
Switzerland 3.0%
Netherlands 3.0%
Hong Kong 3.0%
Monaco 3.0%
France 3.0%
Bermuda 4.5%
Ireland 4.5%
Canada 6.1% United Kingdom 10.6 %
Israel 18.2%
China 21.2%
Note: Location based on corporate address provided by IPO ETF manager Renaissance Capital. | Data Source: Renaissance CapitalAnalysis: Silicon Valley Institute for Regional Studies
U.S. IPO PRICINGS OF INTERNATIONAL COMPANIES, BY COUNTRY
The majority of International Companies going public on U.S. exchanges in 2014 were from Israel, China, and the United Kingdom.
The share of California and U.S. M&A activity remained the same.
Silicon Valley acquired more
companies from outside the
region in 2014.

39
Relative Growth of Firms Without EmployeesSanta Clara & San Mateo Counties, Alameda County, San Francisco, California, and the United States
Inde
xed
to 20
04 (1
00=2
004 v
alue
s)
100102104106108110112114116118120
201220112010200920082007200620052004
United StatesCaliforniaSan FranciscoAlameda CountySilicon Valley
Firms Without Employees in 2012
SILICON VALLEY
ALAMEDA COUNTY
SAN FRANCISCO
190,164
120,540
86,574
CALIFORNIA 2,926,065
UNITED STATES 22,735,915
Data Source: United States Census Bureau, Nonemployer Statistics | Analysis: Silicon Valley Institute for Regional Studies
RELATIVE GROWTH OF FIRMS WITHOUT EMPLOYEES
The number of nonemployer firms in Silicon Valley continues to grow.
PERCENTAGE OF NONEMPLOYERS BY INDUSTRY, 2012
ECON
OMYEmployment
Income
Innovation & Entrepreneurship
Commercial Space
Silicon Valley, Alameda County, San Francisco County, California, and the United States
0%
10%
20%
30%
40%
50%
60%
70%
80%
90%
100%
United StatesCaliforniaAlameda CountySan FranciscoSilicon Valley
Other*
Manufacturing
Wholesale trade
Information
Transportation and warehousing
Educational services
Finance and insurance
Arts, entertainment, and recreation
Construction
Retail trade
Administrative and support and waste management and remediation services
Health care and social assistance
Other services (except public administration)
Real estate and rental and leasing
Professional, scienti�c, and technical services
*Other includes Accommodation & Food Services; Mining, Quarrying and Oil & Gas Extraction; Agriculture, Forestry, Fishing & Hunting; and Utilities. | Data Source: United States Census Bureau, Nonemployer Statistics | Analysis: Silicon Valley Institute for Regional Studies
26% of Silicon Valley nonemployer firms are in Professional, Scientific, and Technical Services.
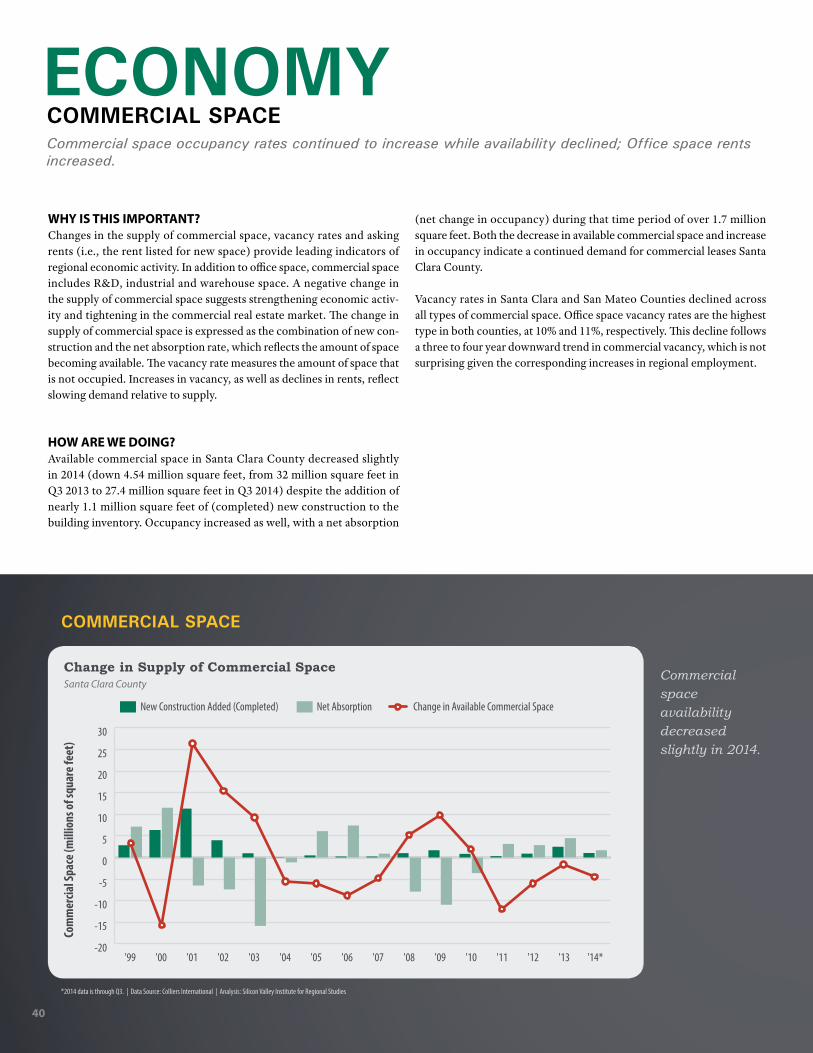
40
WHY IS THIS IMPORTANT?Changes in the supply of commercial space, vacancy rates and asking rents (i.e., the rent listed for new space) provide leading indicators of regional economic activity. In addition to office space, commercial space includes R&D, industrial and warehouse space. A negative change in the supply of commercial space suggests strengthening economic activ-ity and tightening in the commercial real estate market. The change in supply of commercial space is expressed as the combination of new con-struction and the net absorption rate, which reflects the amount of space becoming available. The vacancy rate measures the amount of space that is not occupied. Increases in vacancy, as well as declines in rents, reflect slowing demand relative to supply.
HOW ARE WE DOING?Available commercial space in Santa Clara County decreased slightly in 2014 (down 4.54 million square feet, from 32 million square feet in Q3 2013 to 27.4 million square feet in Q3 2014) despite the addition of nearly 1.1 million square feet of (completed) new construction to the building inventory. Occupancy increased as well, with a net absorption
(net change in occupancy) during that time period of over 1.7 million square feet. Both the decrease in available commercial space and increase in occupancy indicate a continued demand for commercial leases Santa Clara County.
Vacancy rates in Santa Clara and San Mateo Counties declined across all types of commercial space. Office space vacancy rates are the highest type in both counties, at 10% and 11%, respectively. This decline follows a three to four year downward trend in commercial vacancy, which is not surprising given the corresponding increases in regional employment.
COMMERCIAL SPACECommercial space occupancy rates continued to increase while availability declined; Office space rents increased.
ECONOMYCo
mm
ercia
l Spa
ce (m
illio
ns of
squa
re fe
et)
Change in Supply of Commercial SpaceSanta Clara County
-20
-15
-10
-5
0
5
10
15
20
25
30
'14*'13'12'11'10'09'08'07'06'05'04'03'02'01'00'99
Change in Available Commercial SpaceNet AbsorptionNew Construction Added (Completed)
*2014 data is through Q3. | Data Source: Colliers International | Analysis: Silicon Valley Institute for Regional Studies
Commercial space availability decreased slightly in 2014.
COMMERCIAL SPACE

41
ECON
OMYEmployment
Income
Innovation & Entrepreneurship
Commercial Space
Santa Clara County San Mateo County
Annual Rate of Commercial VacancySanta Clara & San Mateo Counties
0%
5%
10%
15%
20%
25%
'14*'13'12'11'10'09'08'07'06'05'04'03'02'01'00
10.44%
9.76%8.24%
4.96%
3.10%
11.04%
8.03%
3.74%
0%
5%
10%
15%
20%
25%
'14*'13'12'11'10'09'08'07'06
Warehouse All Commercial SpaceIndustrialR&DO�ce
*2014 data is through Q3 2014. | Data Source: Colliers International | Analysis: Silicon Valley Institute for Regional Studies
COMMERCIAL VACANCY
Vacancy rates declined among all types of commercial space, in both counties.
Available commercial space in Santa Clara County decreased despite the addition of nearly 1.1 million square feet of newly constructed building space.
1.1 million square feet
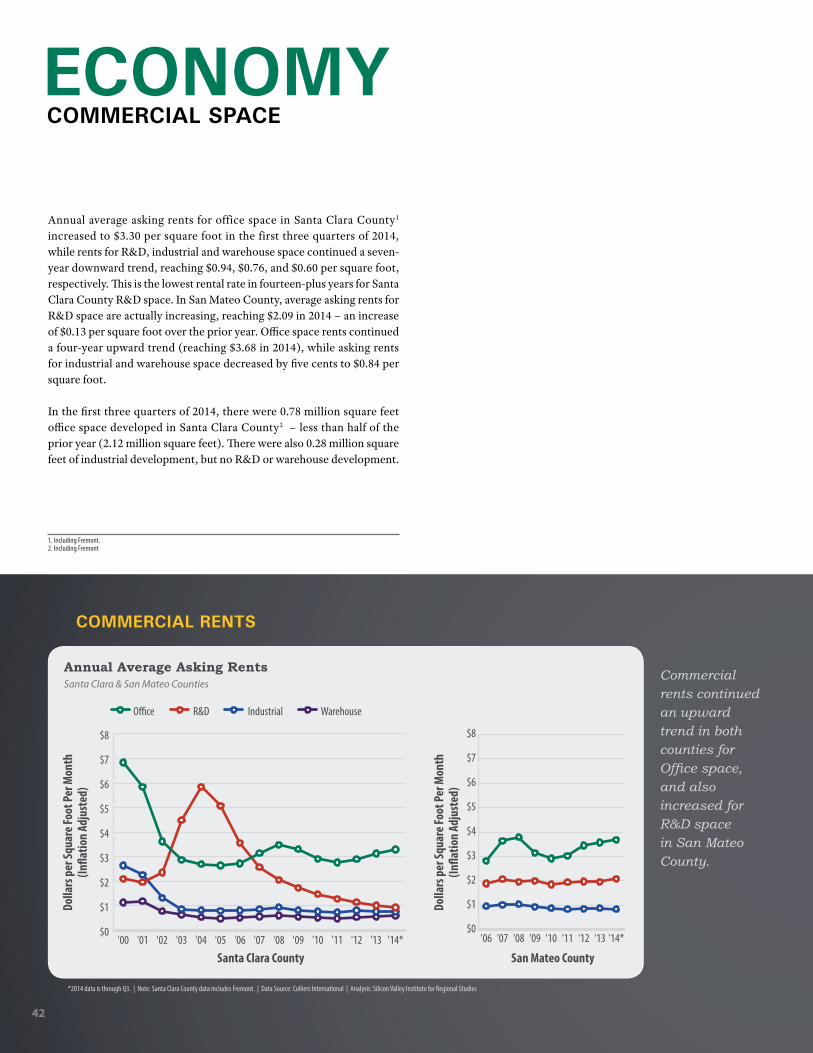
42
Santa Clara County
Annual Average Asking RentsSanta Clara & San Mateo Counties
$0
$1
$2
$3
$4
$5
$6
$7
$8
'14*'13'12'11'10'09'08'07'06'05'04'03'02'01'00
Dolla
rs p
er Sq
uare
Foot
Per M
onth
(In
�atio
n Ad
just
ed)
$0
$1
$2
$3
$4
$5
$6
$7
$8
'14*'13'12'11'10'09'08'07'06
Dolla
rs p
er Sq
uare
Foot
Per M
onth
(In
�atio
n Ad
just
ed)
San Mateo County
WarehouseIndustrialR&DO�ce
*2014 data is through Q3. | Note: Santa Clara County data includes Fremont. | Data Source: Colliers International | Analysis: Silicon Valley Institute for Regional Studies
COMMERCIAL RENTS
Commercial rents continued an upward trend in both counties for Office space, and also increased for R&D space in San Mateo County.
Annual average asking rents for office space in Santa Clara County1 increased to $3.30 per square foot in the first three quarters of 2014, while rents for R&D, industrial and warehouse space continued a seven-year downward trend, reaching $0.94, $0.76, and $0.60 per square foot, respectively. This is the lowest rental rate in fourteen-plus years for Santa Clara County R&D space. In San Mateo County, average asking rents for R&D space are actually increasing, reaching $2.09 in 2014 – an increase of $0.13 per square foot over the prior year. Office space rents continued a four-year upward trend (reaching $3.68 in 2014), while asking rents for industrial and warehouse space decreased by five cents to $0.84 per square foot.
In the first three quarters of 2014, there were 0.78 million square feet office space developed in Santa Clara County2 – less than half of the prior year (2.12 million square feet). There were also 0.28 million square feet of industrial development, but no R&D or warehouse development.
1. Including Fremont.2. Including Fremont
COMMERCIAL SPACEECONOMY
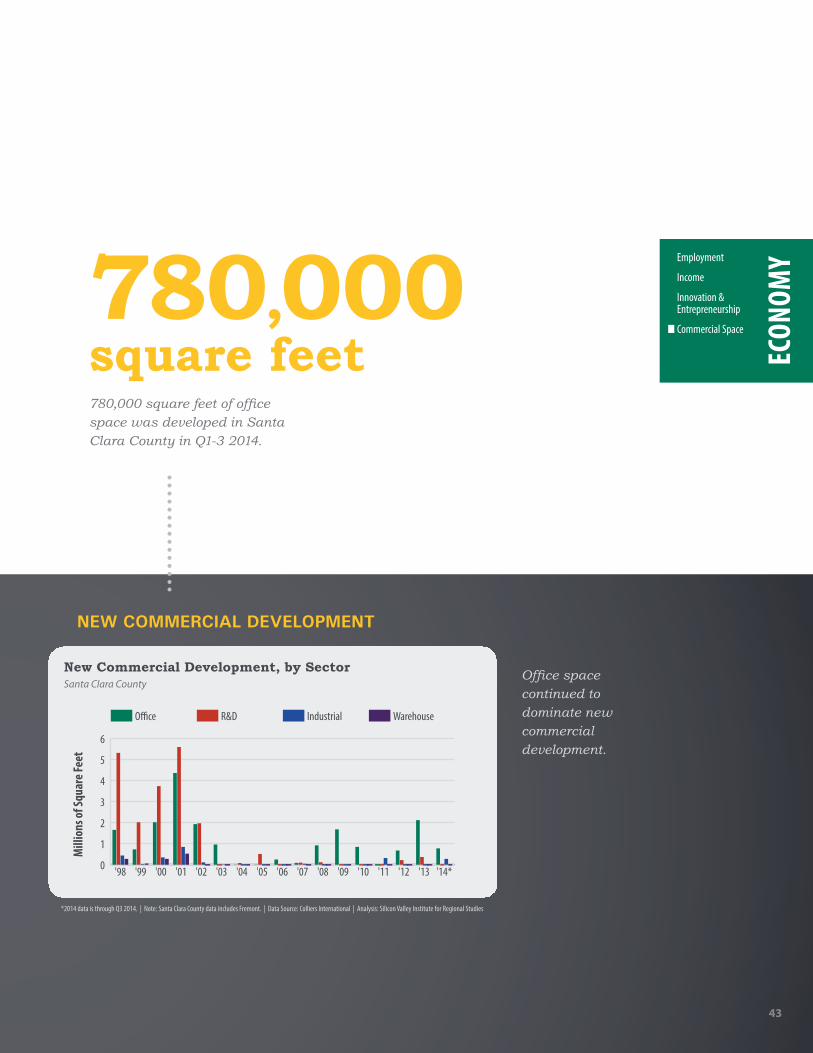
43
ECON
OMYEmployment
Income
Innovation & Entrepreneurship
Commercial Space
NEW COMMERCIAL DEVELOPMENT
New Commercial Development, by SectorSanta Clara County
Mill
ions
of Sq
uare
Feet
0
1
2
3
4
5
6
'14*'13'12'11'10'09'08'07'06'05'04'03'02'01'00'99'98
WarehouseIndustrialR&DO�ce
*2014 data is through Q3 2014. | Note: Santa Clara County data includes Fremont. | Data Source: Colliers International | Analysis: Silicon Valley Institute for Regional Studies
Office space continued to dominate new commercial development.
780,000 square feet of office space was developed in Santa Clara County in Q1-3 2014.
780,000 square feet

44
SOCIETYPREPARING FOR ECONOMIC SUCCESSWhile Silicon Valley continues to outpace the state in student achievement, success varies considerably by race/ethnicity.
WHY IS THIS IMPORTANT?The future success of Silicon Valley’s knowledge-based economy depends on younger generations’ ability to prepare for and access higher education.
High school graduation and dropout rates are an important measure of how well our region prepares its youth for future success. Preparation for postsecondary education can be measured by the proportion of Silicon Valley youth that complete high school and meet entrance requirements for the University of California (UC) or California State University (CSU). Educational achievement can also be measured by proficiency in algebra, which is correlated with later academic success. Breaking down high school dropout rates by ethnicity sheds light on the inequality of educational achievement in the region.
HOW ARE WE DOING?Graduation rates increased by one percent in the 2012-13 school year in both Silicon Valley (to 84%) and the state (to 80%), with dropout rates decreasing accordingly. Silicon Valley students are also more likely to meet UC/CSU requirements, with rates up two percent to 52% in Silicon Valley, and up one percent to 39% in the state.
High school graduation rates and the percentage of graduates who meet UC/CSU entrance requirements in Silicon Valley vary greatly between students of different races/ethnicities. While 92% of Asian students and 91% of White and Filipino students graduated from high school in 2012-13, only 72% of Hispanic students did. And while 76% of Asian graduates in 2012-13 met UC/CSU requirements, only 28% of Hispanic and 27% of African American students did.
Beginning in the 2013-14 school year, the California Department of Education stopped requiring the Algebra I California Standards Test (CST) for eight-graders, and began testing them in science. In Silicon Valley, 75% of eight-graders tested At or Above Proficient, compared to 66% throughout the state.
By Race and EthnicitySilicon Valley, 2011-2013
Perc
enta
ge of
Stud
ents
With
UC/
CSU
Requ
ired
Cour
ses
0%
10%
20%
30%
40%
50%
60%
70%
80%
Silicon Valley Total
HispanicAfricanAmerican
Paci�c Islander
American Indian
FilipinoMulti/None*
WhiteAsian
71% 74
%
54% 58
%
50% 54
%
44% 47
%
39%
33%
28% 31
%
23%
29%
23% 27
%
47% 50
%
76%
60%
51%
48%
33% 36
%
27%
28%
52%
2012 20132011
By Race and EthnicitySilicon Valley, 2011-2013
0%
10%
20%
30%
40%
50%
60%
70%
80%
90%
100%
Silicon Valley Total
HispanicAmerican Indian
AfricanAmerican
Paci�c Islander
Multi/None*
WhiteFilipinoAsian
Perc
enta
ge of
Stud
ents
Who
Gra
duat
ed in
Four
Year
s 201320122011
93%
94%
89% 91%
89%
90%
84% 88
%
77% 80
%
75% 77%
72% 74%
68%
70%
82%
83%
92%
91%
91%
89%
79%
75%
75%
72%
84%
*Multi/None includes both students of two or more races, and those who did not report their race. | Note: Graduation rates are four-year derived rates. | Data Source: California Department of Education | Analysis: Silicon Valley Institute for Regional Studies
HIGH SCHOOL GRADUATION RATES
There is a huge disparity between the shares of graduates in the highest (Asian) and lowest (African American and Hispanic) groups who meet UC/CSU requirements.
*Multi/None includes both students of two or more races, and those who did not report their race. | Data Source: California Depart-ment of Education | Analysis: Silicon Valley Institute for Regional Studies
SHARE OF GRADUATES WHO MEET UC/CSU REQUIREMENTS
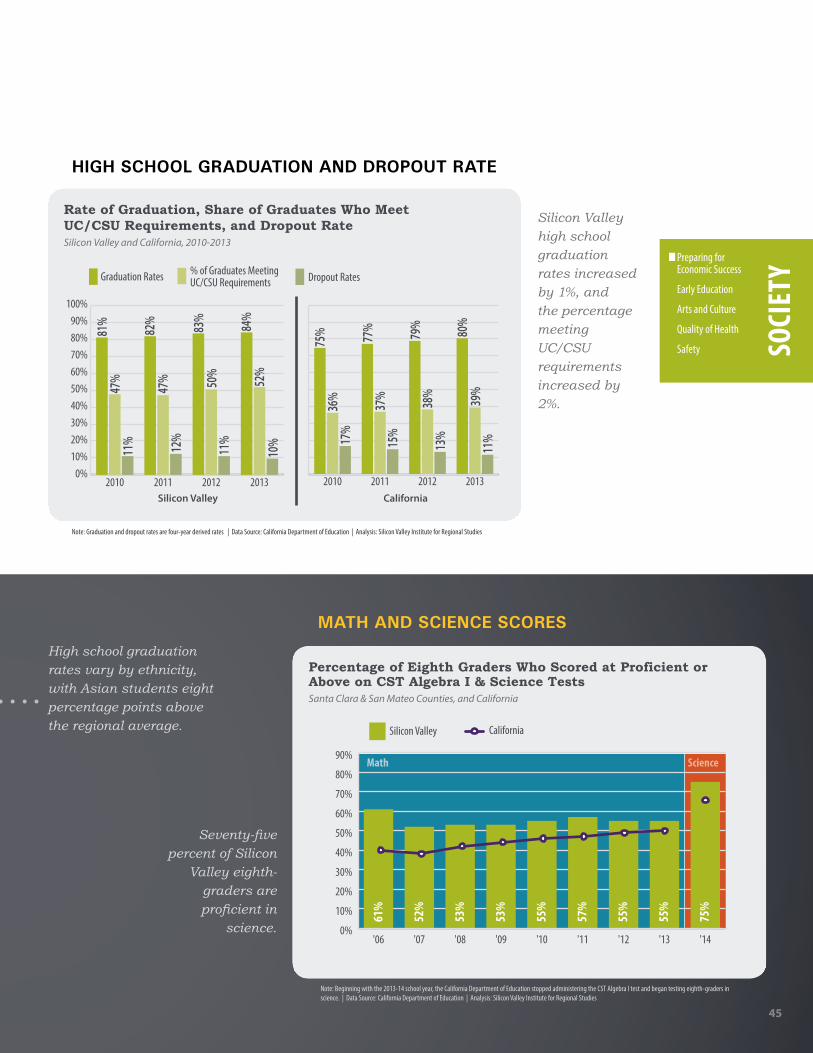
45
Note: Graduation and dropout rates are four-year derived rates | Data Source: California Department of Education | Analysis: Silicon Valley Institute for Regional Studies
HIGH SCHOOL GRADUATION AND DROPOUT RATE
Silicon Valley high school graduation rates increased by 1%, and the percentage meeting UC/CSU requirements increased by 2%.
SOCI
ETYPreparing for
Economic Success
Early Education
Arts and Culture
Quality of Health
Safety
MATH AND SCIENCE SCORES
Math Science
Percentage of Eighth Graders Who Scored at Proficient or Above on CST Algebra I & Science TestsSanta Clara & San Mateo Counties, and California
0%
10%
20%
30%
40%
50%
60%
70%
80%
90%
'14'13'12'11'10'09'08'07'06
61%
52%
53%
53%
55%
57%
55%
55%
75%
Silicon Valley California
Note: Beginning with the 2013-14 school year, the California Department of Education stopped administering the CST Algebra I test and began testing eighth-graders in science. | Data Source: California Department of Education | Analysis: Silicon Valley Institute for Regional Studies
California
2013201220112010Silicon Valley
0%10%20%30%40%50%60%70%80%90%
100%
2013201220112010
Rate of Graduation, Share of Graduates Who Meet UC/CSU Requirements, and Dropout Rate Silicon Valley and California, 2010-2013
81%
47%
11%
82%
47%
12%
83%
50%
11%
84%
52%
10%
75%
36%
17%
77%
37%
15%
79%
38%
13%
80%
39%
11%
Dropout Rates% of Graduates Meeting UC/CSU RequirementsGraduation Rates
High school graduation rates vary by ethnicity, with Asian students eight percentage points above the regional average.
Seventy-five percent of Silicon
Valley eighth-graders are proficient in
science.
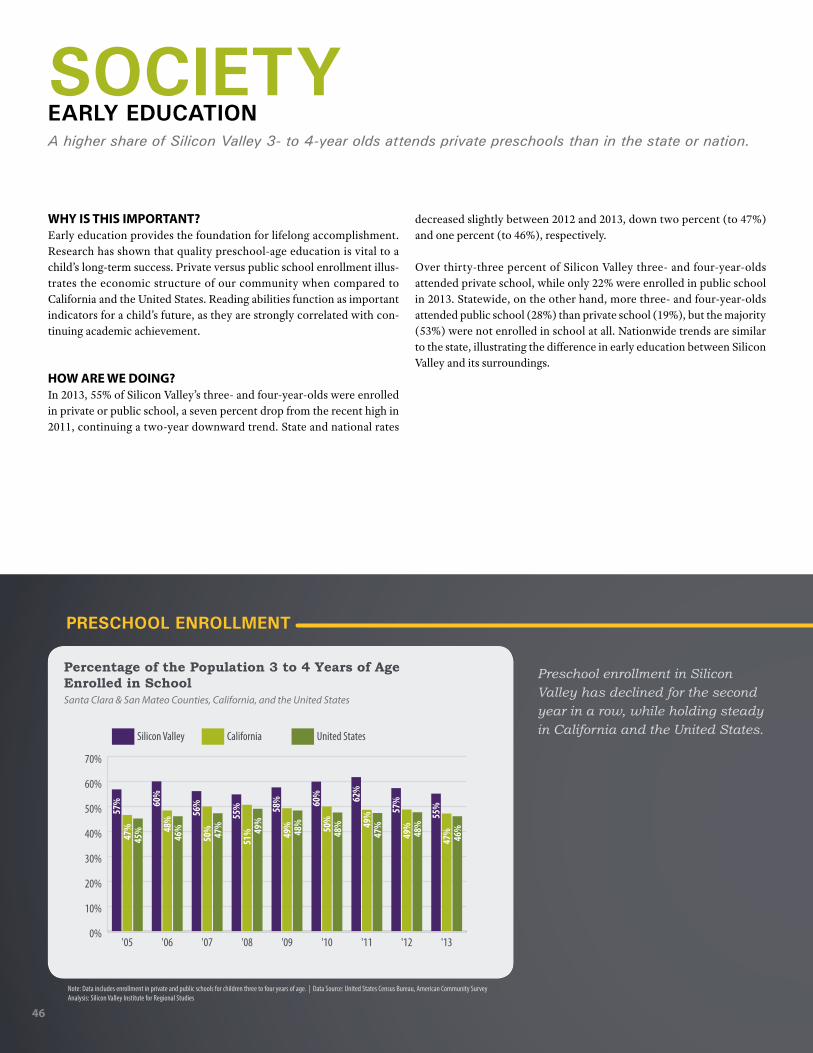
46
SOCIETYEARLY EDUCATIONA higher share of Silicon Valley 3- to 4-year olds attends private preschools than in the state or nation.
WHY IS THIS IMPORTANT?Early education provides the foundation for lifelong accomplishment. Research has shown that quality preschool-age education is vital to a child’s long-term success. Private versus public school enrollment illus-trates the economic structure of our community when compared to California and the United States. Reading abilities function as important indicators for a child’s future, as they are strongly correlated with con-tinuing academic achievement.
HOW ARE WE DOING?In 2013, 55% of Silicon Valley’s three- and four-year-olds were enrolled in private or public school, a seven percent drop from the recent high in 2011, continuing a two-year downward trend. State and national rates
decreased slightly between 2012 and 2013, down two percent (to 47%) and one percent (to 46%), respectively.
Over thirty-three percent of Silicon Valley three- and four-year-olds attended private school, while only 22% were enrolled in public school in 2013. Statewide, on the other hand, more three- and four-year-olds attended public school (28%) than private school (19%), but the majority (53%) were not enrolled in school at all. Nationwide trends are similar to the state, illustrating the difference in early education between Silicon Valley and its surroundings.
Percentage of the Population 3 to 4 Years of Age Enrolled in SchoolSanta Clara & San Mateo Counties, California, and the United States
0%
10%
20%
30%
40%
50%
60%
70%
'13'12'11'10'09'08'07'06'05
United StatesCaliforniaSilicon Valley
57% 60
%
56%
55% 58
% 60% 62
%
57%
55%
47% 48
%
50%
51% 49
% 50% 49
%
49%
47%
45%
46% 47% 49
%
48%
48%
47%
48%
46%
Note: Data includes enrollment in private and public schools for children three to four years of age. | Data Source: United States Census Bureau, American Community SurveyAnalysis: Silicon Valley Institute for Regional Studies
PRESCHOOL ENROLLMENT
Preschool enrollment in Silicon Valley has declined for the second year in a row, while holding steady in California and the United States.

47
SOCI
ETYPreparing for
Economic Success
Early Education
Arts and Culture
Quality of Health
Safety
Percentage of Population 3 to 4 Years, by School Enrollment Santa Clara & San Mateo Counties, California, and the United States2013
0%10%20%30%40%50%60%70%80%90%
100%
United StatesCaliforniaSilicon Valley
53.9%
19.4%
26.7%
52.8%
19.4%
27.7%
44.8%
33.5%
21.7%
Not EnrolledPrivate SchoolPublic School
Data Source: United States Census Bureau, American Community Survey | Analysis: Silicon Valley Institute for Regional Studies
A greater share of Silicon Valley parents enroll their children in private preschool than in the state or the nation.
33%of Silicon Valley three- and four-year-olds are enrolled in private preschools, compared to 19% in California and the United States.

48
SOCIETYARTS AND CULTUREThe San Francisco community participates more in arts and culture than the community in Silicon Valley or elsewhere.
WHY IS THIS IMPORTANT?Art and culture play an integral role in Silicon Valley’s economic and civic vibrancy. As both creative producers and employers, nonprofit arts and culture organizations are a reflection of regional diversity and quality of life. In attracting people to the area, generating business throughout the community and contributing to local revenues, these unique cultural activities have considerable local impact.
Attending events and attractions are ways in which the community par-ticipates in the arts. Spending on arts and culture activities reflects the public’s interest, as well as the amount of money for which producers of the arts must compete. The number of local arts nonprofits is indicative of a region’s ability to organize and make arts programs available to the community. And, the number of arts and culture establishments indi-cates the region’s commercial capacity, as a measure of the number of businesses and artists serving the community.
HOW ARE WE DOING?Thirty-four percent of San Francisco adults attend arts and culture events and attractions, including zoos, museums, concerts, live performing
arts, movies, and purchasing music media. This compares to 30% in San Mateo County and 26% in Santa Clara County. And while San Francisco’s residents also spend more on average than Silicon Valley residents annu-ally on arts and culture ($473), it is not a large margin over Santa Clara County ($416) or San Mateo County ($445). Among the expenditures, Silicon Valley residents tend to spend the most money on reading materi-als ($261-277 per year), followed by recorded media ($73-76 per year), photographic equipment and supplies ($56-60 per year), and relatively little on admission fees ($32-33 per year) and musical instruments ($15 per year).
There are more nonprofit arts organizations in San Francisco than in both Santa Clara and San Mateo Counties combined, with the majority in the performing arts and field service arts (e.g., arranging educational expe-riences in public schools). San Francisco had nearly 60 nonprofit arts organizations in 2010 available to organize and provide the community with access to the arts, while Santa Clara and San Mateo Counties had 17 and 15, respectively. In addition to nonprofits, a large share of San Francisco’s business establishments (6%) involve arts and culture. On the contrary, only 2% of Silicon Valley’s businesses are related to arts and culture.
Adult Population Share Attending Arts & Culture Events and Attractions, Purchasing Recoreded Mediaby Region, 2011-2013
0%
5%
10%
15%
20%
25%
30%
35%
40%
Sacra
men
to
Phila
delph
ia
Sant
a Clar
a Cou
nty
Hous
ton
Phoe
nix
Pittsb
urgh
San D
iego
Atlan
ta
Ralei
gh
Austi
n
Chica
go
San M
ateo
Coun
ty
Seat
tle
Minn
eapo
lis
Denv
er
San F
ranc
isco
Note: Data was collected between 2011 and 2013 | Data Sources: Americans for the Arts; Scarborough Research | Analysis: Silicon Valley Institute for Regional Studies
CULTURAL PARTICIPATION
Nearly 30% of San Mateo County adults attend arts and culture events and attractions or purchase recorded media.
The majority of Silicon Valley’s nonprofit arts
organizations are focused on the performing arts.

49
Nonp
ro�t
Art
s Org
aniza
tions
per
100,
000 P
eopl
e
Number of Nonprofit Arts Organizations Per 100,000 PeopleSanta Clara & San Mateo Counties, and San Francisco | 2010
0
10
20
30
40
50
60
San Francisco
Santa Clara County
San Mateo County
Visual Arts
Arts Education
Humanities & Heritage
Collections-Based
Media Arts
Other Arts
Field Service Arts
Performing Arts
Arts & Culture Share of All EstablishmentsSan Mateo & Santa Clara Counties, and San Francisco | 2010
0%
1%
2%
3%
4%
5%
6%
7%
San FranciscoSanta Clara CountySan Mateo County
2.1% 2.1%
5.8%
Data Sources: Americans for the Arts; National Center for Charitable Statistics | Analysis: Silicon Valley Creates; Silicon Valley Institute for Regional Studies
Note: Arts Establishments include businesses and artists serving the community. | Data Sources: Americans for the Arts; United States Census Bureau | Analysis: Silicon Valley Institute for Regional Studies
NON PROFIT ARTS ORGANIZATIONS ARTS & CULTURE ESTABLISHMENTS
SOCI
ETYPreparing for
Economic Success
Early Education
Arts and Culture
Quality of Health
Safety
San Mateo County residents spend more on arts and culture activities than Santa Clara County residents.
Annual Consumer Expenditures on Arts & Culture Consumptionby Region, 2011-2013
$0$50
$100$150$200$250$300$350$400$450$500
Dolla
rs p
er Pe
rson
per
Year
Reading MaterialsPhotographic Equipment
Musical InstrumentsRecorded MediaAdmission Fees
Sacra
men
to
Phila
delph
ia
Sant
a Clar
a Cou
nty
Hous
ton
Phoe
nix
Pittsb
urgh
San D
iego
Atlan
ta
Ralei
gh
Austi
n
Chica
go
San M
ateo
Coun
ty
Seat
tle
Denv
er
Minn
eapo
lis
San F
ranc
isco
CONSUMER EXPENDITURES
Note: Data was collected between 2011 and 2013. | Data Sources: Americans for the Arts; Scarborough Research | Analysis: Silicon Valley Institute for Regional Studies
Santa Clara and San Mateo County have the same
share of arts and culture establishments, while the share in San Francisco is
much higher.

50
SOCIETYQUALITY OF HEALTH2013 marked a huge jump in health insurance coverage for Silicon Valley’s unemployed residents ages 18-64.
WHY IS THIS IMPORTANT?Poverty, poor access to preventive health care, lifestyle choices and education generally correlate with poor health outcomes. Early and con-tinued access to quality, affordable health care is important to ensure that Silicon Valley’s residents are thriving. Given the high cost of healthcare, individuals with health insurance are more likely to seek routine medical care and preventive health-screenings.
Over the past two decades, obesity rates have risen dramatically in the United States. Being overweight or obese increases the risk of many dis-eases and health conditions, including Type 2 diabetes, hypertension, coronary heart disease, stroke and some types of cancers. These condi-tions decrease residents’ ability to participate in their communities, and have significant economic impacts on the nation’s health care system as well as the overall economy due to declines in productivity.
HOW ARE WE DOING?A higher percentage of Silicon Valley residents under age 18 (96%) and ages 18-64 (85%) is covered by health insurance plans than in the state (93% and 76%, respectively) or the nation as a whole (93% and 80%, respectively). In Silicon Valley, coverage rates remained the same between 2011 and 2013 for residents under age 18 (96%) and those over age 65 (99%), while increasing slightly for residents ages 18-64 (up one percentage point to 85%). Similar increases for that age group occurred throughout the state and nation. Between 2012 and 2013, health insur-ance coverage rates for unemployed Silicon Valley residents ages 18-34 jumped five percentage points to 64%, and also increased for those who were employed (up one percentage point to 88%) and not in the labor force (up two percentage points to 84%). These increases were likely influenced by the 2010 Patient Protection and Affordable Care Act (ACA, also known as Obamacare). But while the Covered California marketplace implementing the Act held open enrollment beginning in October of 2013 (at which time more than 1.3 million people signed up for health insurance coverage), coverage did not become effective until January 1, 2014. However, these increases are likely related to the Low Income Health Program (LIHP) – an early coverage expansion program
Change in the Percentage of Individuals with Health Insurance, by Age and Employment StatusSilicon Valley, 2012-2013
AGE 18-64
AGES 65+
Unemployed Employed Not In Labor Force
+5% +1% +2%
-1% 0% +1%
Percentage of Individuals with Health Insurance, by Age and Employment StatusSilicon Valley, 2013
AGE 18-64
AGES 65+
Unemployed Employed Not In Labor Force
64% 88% 84%
97% 98% 99%
Data Source: United States Census Bureau, American Community Survey | Analysis: Silicon Valley Institute for Regional Studies
Percentage of the Population with Health Insurance, By AgeSanta Clara & San Mateo Counties, California, and the United States
Under 18 Years 18-64 Years 65 Years or Over
0%10%20%30%40%50%60%70%80%90%
100%
United States
CaliforniaSilicon Valley
0%10%20%30%40%50%60%70%80%90%
100%
United States
CaliforniaSilicon Valley
0%10%20%30%40%50%60%70%80%90%
100%
United States
CaliforniaSilicon Valley
2009 2011 2013
96%
96%
96%
91%
92%
93%
91%
93%
93% 98
%99
%99
%
98%
98%
98%
99%
99%
99%
84%
84%
85%
76%
75%
76% 79
%79
%80
%
HEALTH INSURANCE COVERAGE
There was a 1% increase in health insurance coverage among both Silicon Valley and California residents ages 18-64 between 2011 and 2013.

51
Percentage of Student Population that is Overweight or Obese Santa Clara & San Mateo Counties, and California
0%
5%
10%
15%
20%
25%
30%
35%
40%
45%
CaliforniaSilicon Valley
28.7
%27
.4%
26.9
%26
.7%
26.5
%26
.0%
40.1
%39
.3%
38.3
%32
.4%
33.3
%32
.5%
31.9
%31
.2%
31.0
%30
.5%
44.4
%44
.4%
43.9
%38
.3%
'14*'13*'12*'11*'10'09'08'07'06'05
STUDENTS OVERWEIGHT OR OBESE
The percentage of Silicon Valley public school students who are
overweight or obese has declined steadily since 2005, while
remaining consistently lower than rates in the state.
Between 2012 and 2013, the share of unemployed 18- to 64-year-olds with health insurance coverage jumped up by five percentage points.
*Methodology for physical fitness testing by the California Department of Education was modified in 2011 and again in 2014; the 2011-2013 and 2014 data cannot be used for comparison purposes with each other, or with data from previous years. | Data Sources: California Department of Education, Physical Fitness Testing Research Files; kidsdata.org | Analysis: Silicon Valley Institute for Regional Studies
administered prior to ACA implementation – that enrolled over 30,000 Silicon Valley residents in Medi-Cal by the end of 2013.1
The California Department of Education physical fitness testing meth-odology was changed twice during the period of analysis - once in the 2010-2011 school year and again in the 2012-2013 school year. As such, the 2013-2014 school year data cannot be compared to the previous datasets; however, downward trends in Silicon Valley and the state are evident in both of those datasets, indicating that obesity rates are declin-ing. According to physical fitness tests administered during the 2013-14 school year, 32% of Silicon Valley students (5th, 7th and 9th graders com-bined) are overweight or obese, compared to 38% throughout the state.
1. California Department of Health Care Services, LIHP Enrollment Data, Quarter 2 of Fiscal Year 2013-2014.
SOCI
ETYPreparing for
Economic Success
Early Education
Arts and Culture
Quality of Health
Safety
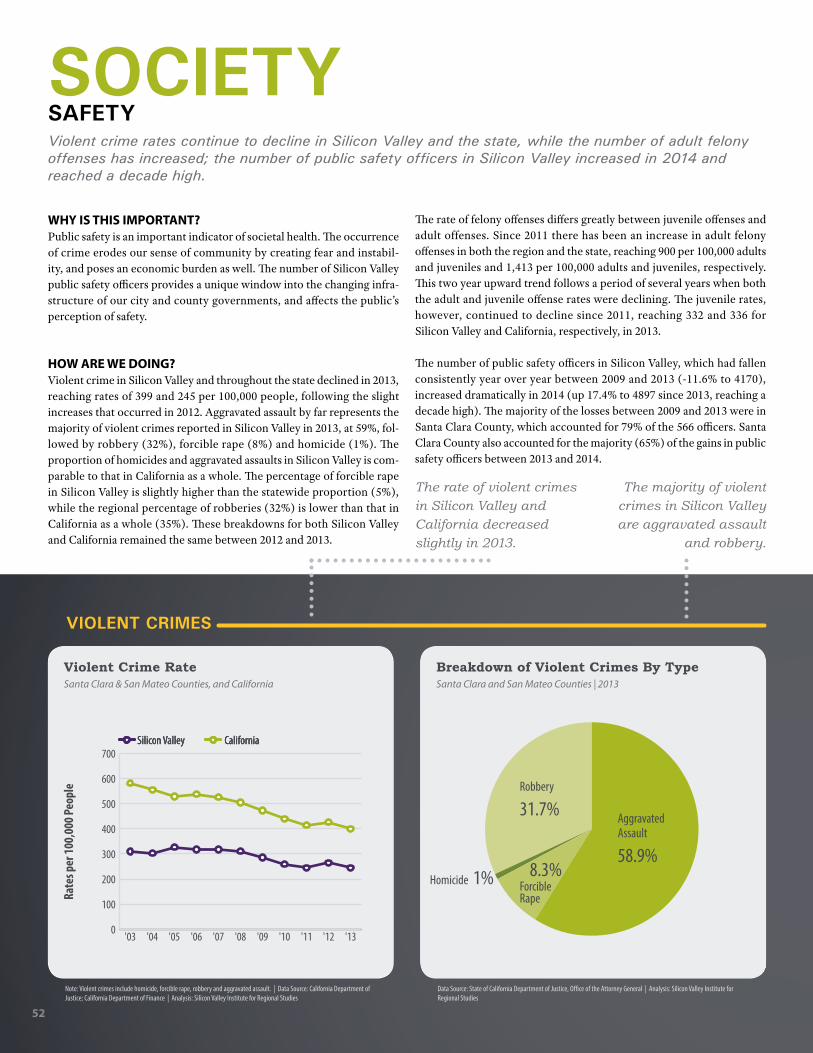
52
SOCIETYSAFETYViolent crime rates continue to decline in Silicon Valley and the state, while the number of adult felony offenses has increased; the number of public safety officers in Silicon Valley increased in 2014 and reached a decade high.
WHY IS THIS IMPORTANT?Public safety is an important indicator of societal health. The occurrence of crime erodes our sense of community by creating fear and instabil-ity, and poses an economic burden as well. The number of Silicon Valley public safety officers provides a unique window into the changing infra-structure of our city and county governments, and affects the public’s perception of safety.
HOW ARE WE DOING?Violent crime in Silicon Valley and throughout the state declined in 2013, reaching rates of 399 and 245 per 100,000 people, following the slight increases that occurred in 2012. Aggravated assault by far represents the majority of violent crimes reported in Silicon Valley in 2013, at 59%, fol-lowed by robbery (32%), forcible rape (8%) and homicide (1%). The proportion of homicides and aggravated assaults in Silicon Valley is com-parable to that in California as a whole. The percentage of forcible rape in Silicon Valley is slightly higher than the statewide proportion (5%), while the regional percentage of robberies (32%) is lower than that in California as a whole (35%). These breakdowns for both Silicon Valley and California remained the same between 2012 and 2013.
The rate of felony offenses differs greatly between juvenile offenses and adult offenses. Since 2011 there has been an increase in adult felony offenses in both the region and the state, reaching 900 per 100,000 adults and juveniles and 1,413 per 100,000 adults and juveniles, respectively. This two year upward trend follows a period of several years when both the adult and juvenile offense rates were declining. The juvenile rates, however, continued to decline since 2011, reaching 332 and 336 for Silicon Valley and California, respectively, in 2013.
The number of public safety officers in Silicon Valley, which had fallen consistently year over year between 2009 and 2013 (-11.6% to 4170), increased dramatically in 2014 (up 17.4% to 4897 since 2013, reaching a decade high). The majority of the losses between 2009 and 2013 were in Santa Clara County, which accounted for 79% of the 566 officers. Santa Clara County also accounted for the majority (65%) of the gains in public safety officers between 2013 and 2014.
Rate
s per
100,
000 P
eopl
e
Violent Crime RateSanta Clara & San Mateo Counties, and California
0
100
200
300
400
500
600
700
'13'12'11'10'09'08'07'06'05'04'03
CaliforniaSilicon Valley CaliforniaSilicon Valley CaliforniaSilicon Valley
Breakdown of Violent Crimes By TypeSanta Clara and San Mateo Counties | 2013
Forcible Rape
Robbery
31.7%
Homicide 1% 8.3%
Aggravated Assault
58.9%
Note: Violent crimes include homicide, forcible rape, robbery and aggravated assault. | Data Source: California Department of Justice; California Department of Finance | Analysis: Silicon Valley Institute for Regional Studies
Data Source: State of California Department of Justice, Office of the Attorney General | Analysis: Silicon Valley Institute for Regional Studies
VIOLENT CRIMES
The majority of violent crimes in Silicon Valley are aggravated assault
and robbery.
The rate of violent crimes in Silicon Valley and California decreased slightly in 2013.

53
SOCI
ETYPreparing for
Economic Success
Early Education
Arts and Culture
Quality of Health
Safety
Total Number of Public Safety OfficersSilicon Valley
0
1,000
2,000
3,000
4,000
5,000
'14'13'12'11'10'09'08'07'06'05'04'03
4,853 4,822 4,681 4,662 4,669 4,689 4,715 4,671 4,5414,275 4,170
4,897
Data Source: California Commission on Peace Officer Standards and Training. | Analysis: Silicon Valley Institute for Regional Studies
PUBLIC SAFETY OFFICERS
- 0.9%
- 2.8%
- 5.9%
- 2.5%
+17.4%
2009-2010
2010-2011
2011-2012
2012-2013
2013-2014
Percent Change in Silicon Valley Public Safety Officers
The total number of public safety officers in Silicon Valley increased following four-years of losses.
The felony offense rate for adults in Silicon Valley and California rose between 2011 and 2013.
Felony Offenses per 100,000 Adults & Juveniles Santa Clara & San Mateo Counties, and California
Rate
s per
100,
000 A
dults
and
Juve
nile
s
0
200
400
600
800
1,000
1,200
1,400
1,600
1,800
'13'12'11'10'09'08'07
California Adults California Juveniles Silicon Valley Adults Silicon Valley Juveniles
FELONY OFFENSES
Data Sources: California Department of Justice; United States Census Bureau | Analysis: Silicon Valley Institute for Regional Studies
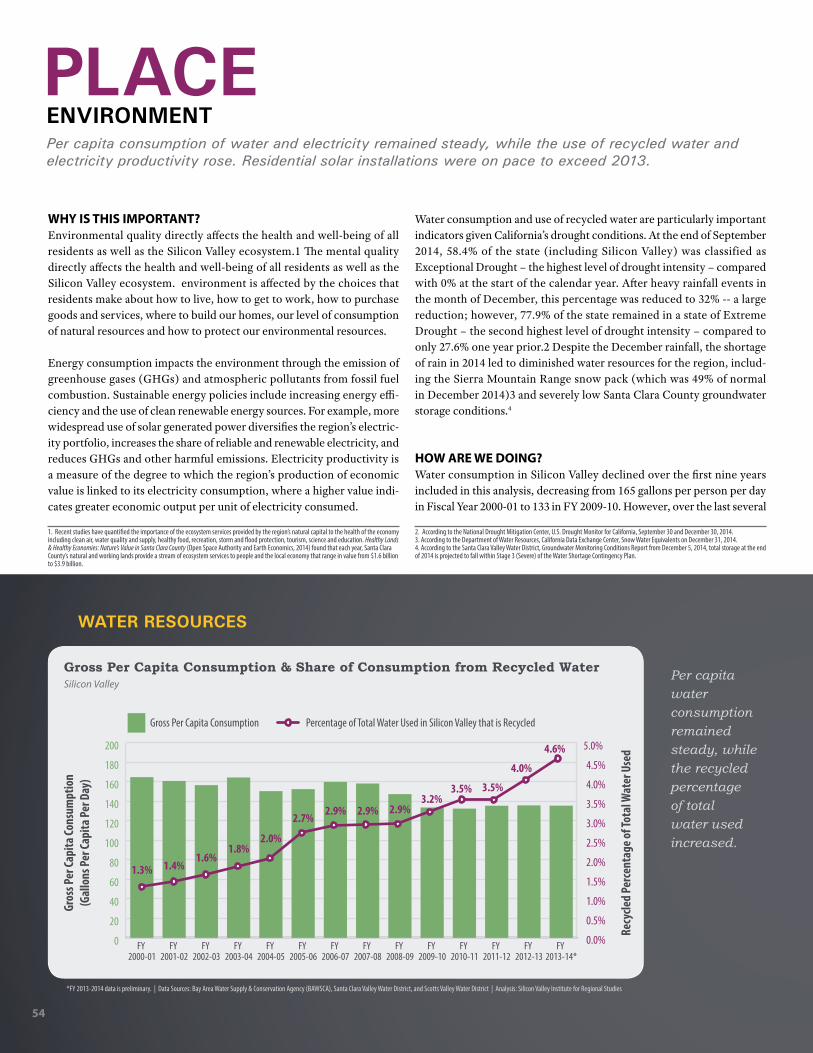
54
WHY IS THIS IMPORTANT?Environmental quality directly affects the health and well-being of all residents as well as the Silicon Valley ecosystem.1 The mental quality directly affects the health and well-being of all residents as well as the Silicon Valley ecosystem. environment is affected by the choices that residents make about how to live, how to get to work, how to purchase goods and services, where to build our homes, our level of consumption of natural resources and how to protect our environmental resources.
Energy consumption impacts the environment through the emission of greenhouse gases (GHGs) and atmospheric pollutants from fossil fuel combustion. Sustainable energy policies include increasing energy effi-ciency and the use of clean renewable energy sources. For example, more widespread use of solar generated power diversifies the region’s electric-ity portfolio, increases the share of reliable and renewable electricity, and reduces GHGs and other harmful emissions. Electricity productivity is a measure of the degree to which the region’s production of economic value is linked to its electricity consumption, where a higher value indi-cates greater economic output per unit of electricity consumed.
1. Recent studies have quantified the importance of the ecosystem services provided by the region’s natural capital to the health of the economy including clean air, water quality and supply, healthy food, recreation, storm and flood protection, tourism, science and education. Healthy Lands & Healthy Economies: Nature’s Value in Santa Clara County (Open Space Authority and Earth Economics, 2014) found that each year, Santa Clara County’s natural and working lands provide a stream of ecosystem services to people and the local economy that range in value from $1.6 billion to $3.9 billion.
Water consumption and use of recycled water are particularly important indicators given California’s drought conditions. At the end of September 2014, 58.4% of the state (including Silicon Valley) was classified as Exceptional Drought – the highest level of drought intensity – compared with 0% at the start of the calendar year. After heavy rainfall events in the month of December, this percentage was reduced to 32% -- a large reduction; however, 77.9% of the state remained in a state of Extreme Drought – the second highest level of drought intensity – compared to only 27.6% one year prior.2 Despite the December rainfall, the shortage of rain in 2014 led to diminished water resources for the region, includ-ing the Sierra Mountain Range snow pack (which was 49% of normal in December 2014)3 and severely low Santa Clara County groundwater storage conditions.4
HOW ARE WE DOING?Water consumption in Silicon Valley declined over the first nine years included in this analysis, decreasing from 165 gallons per person per day in Fiscal Year 2000-01 to 133 in FY 2009-10. However, over the last several
2. According to the National Drought Mitigation Center, U.S. Drought Monitor for California, September 30 and December 30, 2014.3. According to the Department of Water Resources, California Data Exchange Center, Snow Water Equivalents on December 31, 2014.4. According to the Santa Clara Valley Water District, Groundwater Monitoring Conditions Report from December 5, 2014, total storage at the end of 2014 is projected to fall within Stage 3 (Severe) of the Water Shortage Contingency Plan.
Gros
s Per
Capi
ta Co
nsum
ptio
n (G
allo
ns Pe
r Cap
ita Pe
r Day
)
Recy
cled
Perc
enta
ge of
Tota
l Wat
er U
sed
Gross Per Capita Consumption & Share of Consumption from Recycled WaterSilicon Valley
0
20
40
60
80
100
120
140
160
180
200
FY 2013-14*
FY 2012-13
FY 2011-12
FY 2010-11
FY 2009-10
FY 2008-09
FY 2007-08
FY 2006-07
FY 2005-06
FY 2004-05
FY 2003-04
FY 2002-03
FY 2001-02
FY 2000-01
0.0%
0.5%
1.0%
1.5%
2.0%
2.5%
3.0%
3.5%
4.0%
4.5%
5.0%
1.3% 1.4%1.6%
1.8%2.0%
2.7%2.9% 2.9% 2.9%
3.2%3.5% 3.5%
4.0%
4.6%
Gross Per Capita Consumption Percentage of Total Water Used in Silicon Valley that is Recycled
*FY 2013-2014 data is preliminary. | Data Sources: Bay Area Water Supply & Conservation Agency (BAWSCA), Santa Clara Valley Water District, and Scotts Valley Water District | Analysis: Silicon Valley Institute for Regional Studies
Per capita water consumption remained steady, while the recycled percentage of total water used increased.
WATER RESOURCES
ENVIRONMENTPer capita consumption of water and electricity remained steady, while the use of recycled water and electricity productivity rose. Residential solar installations were on pace to exceed 2013.
PLACE

55
PLAC
E
Environment
Transportation
Land Use
Housing
Santa Clara & San Mateo Counties, Rest of California
Elec
trici
ty Co
nsum
ptio
n pe
r Cap
ita (k
Wh
per p
erso
n)
01,0002,0003,0004,0005,0006,0007,0008,0009,000
10,000
'13'12'11'10'09'08'07'06'05'04'03'02'01'00'99'98
Rest of CaliforniaSan FranciscoSilicon Valley
Santa Clara & San Mateo Counties, Rest of California
02,0004,0006,0008,000
10,00012,00014,00016,00018,00020,000
'13'12'11'10'09'08'07'06'05'04'03'02'01'00'99'98
Elec
trici
ty P
rodu
ctiv
ity (I
n�at
ion
Adju
sted
Dol
lars
of
GDP
Rela
tive t
o Con
sum
ptio
n of
Meg
awat
thou
rs) Rest of CaliforniaSan FranciscoSilicon Valley
ELECTRICITY CONSUMPTION PER CAPITA
ELECTRICITY PRODUCTIVITY
Data Sources: Moody’s Economy.com; California Energy Commission; State of California, Department of Finance | Analysis: Silicon Valley Institute for Regional Studies
Data Source: Moody’s Economy.com; California Energy Commission; State of California, Department of Finance | Analysis: Silicon Valley Institute for Regional Studies
Silicon Valley’s electricity consumption increased slightly between 2012 and 2013.
Silicon Valley and San Francisco electricity productivity continued to rise.
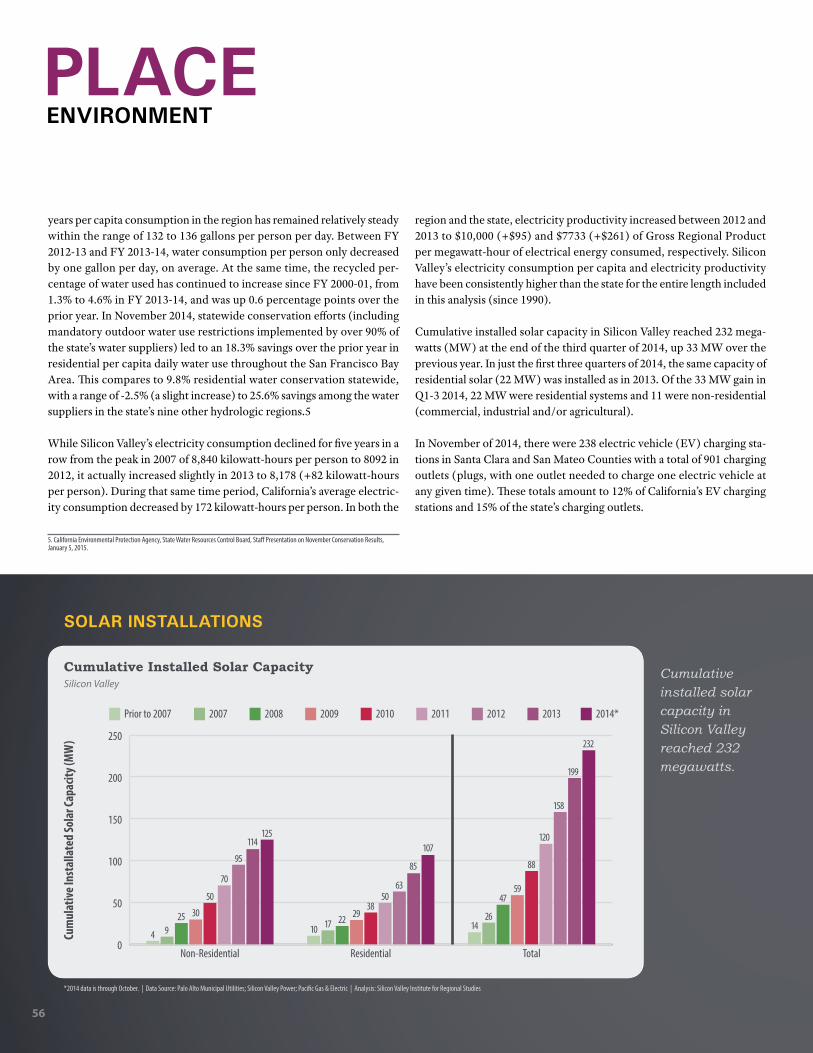
56
ENVIRONMENTPLACE
years per capita consumption in the region has remained relatively steady within the range of 132 to 136 gallons per person per day. Between FY 2012-13 and FY 2013-14, water consumption per person only decreased by one gallon per day, on average. At the same time, the recycled per-centage of water used has continued to increase since FY 2000-01, from 1.3% to 4.6% in FY 2013-14, and was up 0.6 percentage points over the prior year. In November 2014, statewide conservation efforts (including mandatory outdoor water use restrictions implemented by over 90% of the state’s water suppliers) led to an 18.3% savings over the prior year in residential per capita daily water use throughout the San Francisco Bay Area. This compares to 9.8% residential water conservation statewide, with a range of -2.5% (a slight increase) to 25.6% savings among the water suppliers in the state’s nine other hydrologic regions.5
While Silicon Valley’s electricity consumption declined for five years in a row from the peak in 2007 of 8,840 kilowatt-hours per person to 8092 in 2012, it actually increased slightly in 2013 to 8,178 (+82 kilowatt-hours per person). During that same time period, California’s average electric-ity consumption decreased by 172 kilowatt-hours per person. In both the
5. California Environmental Protection Agency, State Water Resources Control Board, Staff Presentation on November Conservation Results, January 5, 2015.
region and the state, electricity productivity increased between 2012 and 2013 to $10,000 (+$95) and $7733 (+$261) of Gross Regional Product per megawatt-hour of electrical energy consumed, respectively. Silicon Valley’s electricity consumption per capita and electricity productivity have been consistently higher than the state for the entire length included in this analysis (since 1990).
Cumulative installed solar capacity in Silicon Valley reached 232 mega-watts (MW) at the end of the third quarter of 2014, up 33 MW over the previous year. In just the first three quarters of 2014, the same capacity of residential solar (22 MW) was installed as in 2013. Of the 33 MW gain in Q1-3 2014, 22 MW were residential systems and 11 were non-residential (commercial, industrial and/or agricultural).
In November of 2014, there were 238 electric vehicle (EV) charging sta-tions in Santa Clara and San Mateo Counties with a total of 901 charging outlets (plugs, with one outlet needed to charge one electric vehicle at any given time). These totals amount to 12% of California’s EV charging stations and 15% of the state’s charging outlets.
Cum
ulat
ive I
nsta
llate
d So
lar C
apac
ity (M
W)
Cumulative Installed Solar CapacitySilicon Valley
0
50
100
150
200
250
TotalResidentialNon-Residential
114125
95
70
50
302594
85
6350
3829221710
232
199
158
120
88
5947
2614
107
2014*2013201220112010200920082007Prior to 2007
*2014 data is through October. | Data Source: Palo Alto Municipal Utilities; Silicon Valley Power; Pacific Gas & Electric | Analysis: Silicon Valley Institute for Regional Studies
SOLAR INSTALLATIONS
Cumulative installed solar capacity in Silicon Valley reached 232 megawatts.

57
PLAC
E
Environment
Transportation
Land Use
Housing
Electric Vehicle Charging Stations and OutletsSanta Clara & San Mateo Counties, and California2014
SANTA CLARA COUNTY
OUTLETSSTATIONS
169 605
69 296
238 901
12.2% 15.4%
SAN MATEO COUNTY
TOTAL
SHARE OF CALIFORNIA
Note: Data is as of November 14, 2014, and include public stations only. | Data Source: United States Department of Energy, Alternative Fuels Data Center | Analysis: Silicon Valley Institute for Regional Studies
of California’s EV charging outlets are in Silicon Valley.
15%Over

58
WHY IS THIS IMPORTANT?Adequate highway capacity and increasing alternatives to driving alone are important for the mobility of people and goods as the economy expands. Public transportation investments along with improving auto-mobile fuel efficiency are important for meeting air quality and carbon emission reduction goals.
HOW ARE WE DOING?Vehicle Miles Traveled per person (VMT) in Silicon Valley decreased slightly from 9147 in 2012 to 8,963 in 2013. VMT decreased steadily between 2001 and 2010, and then increased slightly in 2011-2012 prior to this decrease. Gas prices have exhibited an opposite trend, having increased steadily for more than a decade prior to 2008. Between 2012 and 2013, gas prices decreased from an average of $4.25 to $4.00 per gal-lon, marking the first decrease since 2009.
Between 2003 and 2013, the percentage of Silicon Valley residents who drive alone to work has declined from 78% in 2003 to 74% in 2013. During that same time period, there was a 10% decrease in Silicon Valley VMT.
The share of residents who use public transportation increased by two percentage points (from 4.3% in 2003 to 6.1% in 2013), while there were only slight changes in the share of the population carpooling, walking, working at home or using other means of transportation (taxicab, motor-cycle, bicycle and other means not identified separately within the data distribution).
Between 2011 and 2013, the number of residents commuting to another county within the region has increased significantly. While a portion of this increase can be accounted for by public transportation and large corporate shuttles (rather than solely private automobiles), any increase in commuting within the region adds to the growing traffic congestion issue. Between 2011 and 2013, the number of residents commuting from San Francisco to Alameda County increased by 33%. The number of San Francisco residents commuting to Santa Clara and San Mateo Counties increased as well, rising 23% and 27%, respectively, between 2011 and 2013. Overall, the total number of residents commuting among San Francisco, Alameda, Santa Clara and San Mateo Counties increased by 16% over the two-year period.
Vehicle Miles Traveled Per Capita and Gas PricesSanta Clara & San Mateo Counties
Vehi
cle M
iles o
f Tra
vel p
er Ca
pita
Gas P
rice p
er G
allo
n (In
�atio
n Ad
just
ed)
0
2,000
4,000
6,000
8,000
10,000
12,000
'13'12'11'10'09'08'07'06'05'04'03'02'01'00'99'98'97'96'95$0
$1
$2
$3
$4
$5
$6
Note: Gas prices are average annual regular retail gas prices for California, adjusted to 2014 using the Bay Area Consumer Price Index. | Data Sources: California Department of Transportation; California Department of Finance; California Energy Almanac; U.S. Energy Information Administration | Analysis: Silicon Valley Institute for Regional Studies
VEHICLE MILES TRAVELED PER CAPITA AND GAS PRICES
Percent Change
VMT PER CAPITA
GAS PRICES
2011-2012 2012-2013
+0.3% -2.0%
+1.5%
2010-2011
+5.5%
+22.1% -5.8%
Vehicle Miles Traveled and gas prices declined in Silicon Valley between 2012 and 2013.
TRANSPORTATIONVehicle Miles Traveled and gas prices decreased; Caltrain and VTA Express Bus ridership continued to rise; a smaller share of Silicon Valley commuters are driving alone, but commuting within the region has increased considerably, creating more traffic congestion.
PLACE

59
PLAC
E
Environment
Transportation
Land Use
Housing
Nearly three-quarters of the workforce drives to work alone, while other commuters are finding alternative forms of transportation.
Percentage of WorkersSanta Clara & San Mateo Counties
0%
20%
40%
60%
80%
100%Walked
Other Means
Worked at Home
Public Transportation
Carpooled
Drove Alone
20132003
2%2%4%4%
10%
78%
2%3%
4%6%
11%
74%
Note: Other Means includes taxicab, motorcycle, bicycle and other means not identified separately within the data distribution. | Data Source: United States Census Bureau, American Community Survey | Analysis: Silicon Valley Institute for Regional Studies
MEANS OF COMMUTE
of Silicon Valley workers telecommute from home.
4%

60
Commuting between counties is common in Silicon Valley, adding to traffic congestion.
COMMUTE PATTERNS
San Mateo
Number of Residents Who Commute to Another County Within the Region | 2013
San Francisco
Santa Clara
Alameda
24,624
15,898
52,514
57,876
11,202
36,600
87,384
74,274
35,702
44,890
87,133
26,673
Data Source: United States Census Bureau, American Community Survey PUMS | Analysis: Silicon Valley Institute for Regional Studies
TRANSPORTATIONPLACE
Change in Per Capita Transit Use | 2010-2014San Mateo & Santa Clara Counties
ALL SERVICE
EXPRESS BUS SERVICE
SAM TRANS
2010 PER CAPITA
RIDERSHIPTRANSPORTATION
SYSTEM2014 PER
CAPITA RIDERSHIP
PERCENTCHANGE
16.69
0.38
5.57
CALTRAIN
ALTAMONT CORRIDOR EXPRESS (ACE)
4.79
0.27
TOTAL 27.32
16.62
0.53
4.89
6.52
0.43
28.45
-0.4%
+39.5%
-12.2%
+36.1%
+59.3%
+4.1%
SANTA CLARA VALLEY TRANSPORTATION AUTHORITY (VTA)
Overall, transit ridership (number of rides per capita) increased by 1.7% between FY 2012-13 and FY 2013-14, continuing a three-year upward trend. Compared to a high point in 2002, the number of rides per person in Silicon Valley is down 15% due to declines in bus and light rail rid-ership. However, since 2010, Silicon Valley per capita transit ridership has increased by four percent, and ridership on the region’s trains and express busses has surged. Per capita Caltrain ridership has increased by over 36%, and ACE train and VTA Express Bus ridership have increased by 59% and 39%, respectively, since 2010. Comparatively, overall Bay Area Rapid Transit (BART) ridership1 has increased by 11% over the same period of time.
1. Including all BART service territories, normalized to Santa Clara and San Mateo County population growth for comparison to changes in Silicon Valley per capita ridership.

61
Transit use was up 1.7%; Caltrain, VTA and ACE ridership has risen quickly in recent years.
Percent Change in the Number of Residents who Commute to Another County within the Region
2011-2013
+23.2%+26.8%+32.7%+15.5%+5.1%-7.4%
+7.1%+17.7%+12.4%+25.3%+16.9%+15.8%
2012-2013
+4.8%+15.6%+0.2%
+10.3%+6.8%-0.8%
+2.9%+51.6%+0.3%+8.1%+4.4%-1.8%
2011-2012DestinationOrigin
+17.6%Santa ClaraSan MateoSan FranciscoAlameda
San FranciscoSanta ClaraSan Mateo
AlamedaSan Mateo
San FranciscoSanta ClaraAlameda
San MateoSan FranciscoAlameda
Santa Clara
+9.7%+32.5%+4.8%-1.6%-6.6%
+4.1%-22.3%
+12.1%+16.0%+11.9%+17.9%
PLAC
E
Environment
Transportation
Land Use
Housing
Num
ber o
f Rid
es p
er Ca
pita
Number of Rides per Capita on Regional Transportation SystemsSanta Clara & San Mateo Counties
+1.7%
0
5
10
15
20
25
30
35
40
'14'13'12'11'10'09'08'07'06'05'04'03'02
TRANSIT USE
Note: Transit data is in fiscal years. | Data Source: Altamont Corridor Express, Caltrain, SamTrans, Santa Clara Valley Transportation Authority, California Department of Finance | Analysis: Silicon Valley Institute for Regional Studies

62
WHY IS THIS IMPORTANT?By directing growth to already developed areas, local jurisdictions can reinvest in existing neighborhoods, increase access to transportation systems, and preserve the character of adjacent rural communities while reducing vehicle miles traveled and associated greenhouse gas emissions. Focusing new commercial and residential developments near rail stations and major bus corridors reinforces the creation of compact, walking dis-tance, mixed-use communities linked by transit. This helps to reduce traffic congestion on freeways, preserve open space near urbanized areas, and improve energy efficiency. By creating mixed-use communities, Silicon Valley gives workers alternatives to driving and increases access to workplaces.
HOW ARE WE DOING?Average residential density in Silicon Valley increased to 21 dwelling units per acre in FY 2013-14, one more per acre than the prior year. The share of new housing units within walking distance of major rail or bus stations increased to 61% (6,384 units) from 57% (2,476 units) the prior year. Net non-residential development approvals near transit increased slightly (+815,137 square feet over FY 2012-13, reaching 3.8 million square feet), while the amount of approved development that is not near transit skyrocketed in FY 2013-14 to more than 10.6 million
square feet. After planned demolition, this amounts to a net increase of 12.9 million square feet (3.8 near transit and 9.1 not near transit)– a floor area equivalent to 224 football fields. This amount of net non-residential development is far more than any other year over the last decade, and is 2.6 million square feet more than the last peak in 2004. Furthermore, between planning approvals and building permits issued in FY 2013-14, Silicon Valley can expect a net increase of over 23 million square feet of non-residential development over the next few years.
Approved non-residential development projects are spread throughout Silicon Valley, with pockets of significant development planned in cities such as South San Francisco, Foster City, Santa Clara, Sunnyvale and San Jose. The planned development includes commercial space (5.8 million square feet), office space (8.4 million square feet), light industrial (1.4 million square feet) and institutional development such as churches and schools (126,716 square feet) among the 17 cities that participated in this portion of the annual Land Use Survey. The project types range from an indoor tennis facility in Burlingame to a ten-acre warehouse distribu-tion center in Gilroy, and everything in between. More than half of the planned development is office space. This is a positive sign for the growth and expansion of Silicon Valley’s business establishments, but may add to increased traffic congestion issues within the region.
Aver
age D
welli
ng U
nits
per
Acr
e
Average Units per Acre of Newly Approved Residential DevelopmentSilicon Valley
0
5
10
15
20
25
'14'13'12'11'10'09'08'07'06'05'04'03'02'01'00'99'98
7
10
11
10
12
10
13
21
23
21
20 21
16
15 16
2120
RESIDENTIAL DENSITY
Note: Beginning in 2008, the Land Use Survey expanded its geographic definition of Silicon Valley to include cities northward along the U.S. 101 corridor (Brisbane, Burlingame, Millbrae, San Bruno and South San Francisco). In 2014, the Survey expanded to include all Silicon Valley cities (adding Colma, Daly City, Half Moon Bay and Pacifica). | Data Source: City Planning and Housing Departments of Silicon Valley | Analysis: Silicon Valley Institute for Regional Studies
Residential density increased to 21 dwelling units per acre.
LAND USEResidential density increased, while non-residential development approvals skyrocketed.
PLACE
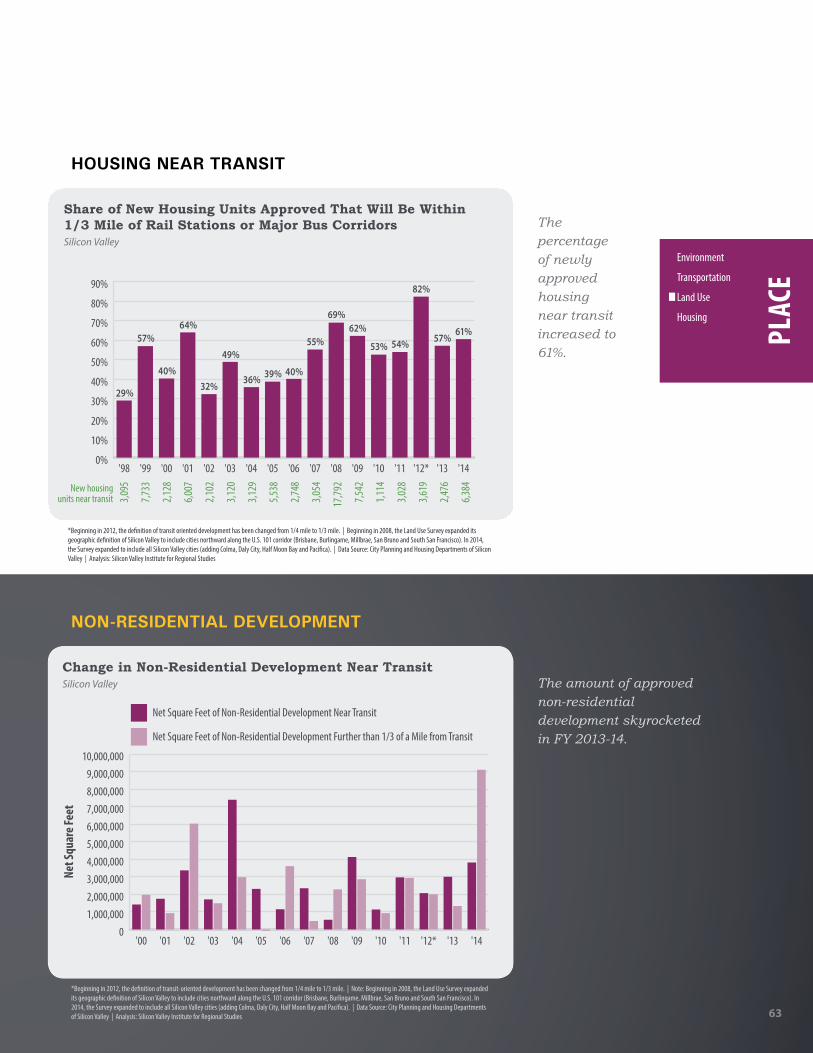
63
PLAC
E
Environment
Transportation
Land Use
Housing
Net S
quar
e Fee
t
Change in Non-Residential Development Near TransitSilicon Valley
01,000,0002,000,0003,000,0004,000,0005,000,0006,000,0007,000,0008,000,0009,000,000
10,000,000
'14'13'12*'11'10'09'08'07'06'05'04'03'02'01'00
Net Square Feet of Non-Residential Development Further than 1/3 of a Mile from Transit
Net Square Feet of Non-Residential Development Near Transit
Share of New Housing Units Approved That Will Be Within 1/3 Mile of Rail Stations or Major Bus Corridors Silicon Valley
0%
10%
20%
30%
40%
50%
60%
70%
80%
90%
'14'13'12*'11'10'09'08'07'06'05'04'03'02'01'00'99'98
2,476
6,384
3,619
3,028
1,114
7,542
17,79
2
3,054
2,748
5,538
3,129
3,120
2,102
6,007
2,128
7,733
3,095New housing
units near transit
40%
57%64%
32%
49%
36% 39% 40%
55%
69%62%
53% 54%
82%
61%57%
29%
*Beginning in 2012, the definition of transit-oriented development has been changed from 1/4 mile to 1/3 mile. | Note: Beginning in 2008, the Land Use Survey expanded its geographic definition of Silicon Valley to include cities northward along the U.S. 101 corridor (Brisbane, Burlingame, Millbrae, San Bruno and South San Francisco). In 2014, the Survey expanded to include all Silicon Valley cities (adding Colma, Daly City, Half Moon Bay and Pacifica). | Data Source: City Planning and Housing Departments of Silicon Valley | Analysis: Silicon Valley Institute for Regional Studies
*Beginning in 2012, the definition of transit oriented development has been changed from 1/4 mile to 1/3 mile. | Beginning in 2008, the Land Use Survey expanded its geographic definition of Silicon Valley to include cities northward along the U.S. 101 corridor (Brisbane, Burlingame, Millbrae, San Bruno and South San Francisco). In 2014, the Survey expanded to include all Silicon Valley cities (adding Colma, Daly City, Half Moon Bay and Pacifica). | Data Source: City Planning and Housing Departments of Silicon Valley | Analysis: Silicon Valley Institute for Regional Studies
NON-RESIDENTIAL DEVELOPMENT
HOUSING NEAR TRANSIT
The amount of approved non-residential development skyrocketed in FY 2013-14.
The percentage of newly approved housing near transit increased to 61%.

64
WHY IS THIS IMPORTANT?The housing market impacts a region’s economy and quality of life. An inadequate supply of new housing negatively affects prospects for job growth. A lack of affordable housing results in longer commutes, dimin-ished productivity, curtailment of family time and increased traffic congestion. It also restricts the ability of crucial service providers—such as teachers, registered nurses and police officers—to live near the com-munities in which they work. Additionally, high housing costs can limit families’ ability to pay for basic needs, such as food, health care, and clothing. As a region’s attractiveness increases, home sales, average home prices and rental rates tend to increase. Higher levels of new housing and attention to increasing housing affordability are critical to the economy and quality of life in Silicon Valley. The region’s current high housing costs combined with recent decreases in funding for affordable housing makes the need to preserve and pursue affordable housing even more pressing.1
1. Mohsen, Raania, Kevin Zwick, and Shannon McDonald. Affordable Housing Funding Landscape & Local Best Practices. Cities Association of Santa Clara County and Housing Trust Silicon Valley. December 2, 2013.
Med
ian
Sale
Pric
e (In
�atio
n Ad
just
ed)
Num
ber o
f Hom
es So
ld
Median Sale Price and Number of Homes Sold San Mateo and Santa Clara Counties, and California
$0
$100,000
$200,000
$300,000
$400,000
$500,000
$600,000
$700,000
$800,000
$900,000
'14*'13'12'11'10'09'08'07'06'05'04'03'02'01'00'99'98
Silicon Valley Number of Homes SoldCalifornia Median Sale PriceSilicon Valley Median Sale PriceCalifornia Number of Homes Sold / 100
0
10,000
20,000
30,000
40,000
50,000
60,000
70,000
80,000
90,000
*Median sale prices and forecasted annual home sales are based on 2014 data through October. | Data Source: Zillow Real Estate Research | Analysis: Silicon Valley Institute for Regional Studies
TRENDS IN HOME SALES
HOW ARE WE DOING?Silicon Valley home prices shot up between 2011 and 2014, while the number of homes sold has dropped. The highest home prices in Silicon Valley were in 2007, at a median sale price of $837,265. Similarly, California’s peak prices were in 2006 at $546,549. Since then, home prices decreased to a low in 2011, and have been increasing rapidly ever since. In 2014, Silicon Valley’s median home price was $757,585 (up $52,801 over the 2013 median), more than $360,000 higher than the median price throughout the state. While the number of homes sold in Silicon Valley and the state remained relatively constant between 2008/2009 and 2013, they dropped between 2013 and 2014. There were 18,035 homes sold in Silicon Valley in 2014, 3,344 less than the prior year.
The number of residential units included in building permits in Silicon Valley (Santa Clara and San Mateo Counties) is estimated at 12,553 for 2014, 3,495 more than the prior year. Multi-family units represented 85% of all units permitted, up from 76% in 2013. Residential building in Silicon Valley has increased significantly year after year since the low of 1,746 in 2009, only 48% of which were multi-family units. A continued
Median home prices continued an upward trend in Silicon Valley and the state, as the total number of homes sold declined.
HOUSINGHome prices are increasing and it is becoming more difficult for first-time homebuyers to afford a median-priced home; income gains were slightly more than rental rate increases, and the housing burden on renters remained steady in the short-term while trending up since 2008; more multi-family and affordable housing is being built.
PLACE

65
PLAC
E
Environment
Transportation
Land Use
Housing
Tota
l Num
ber o
f Uni
ts in
Re
siden
tial B
uild
ing
Perm
its
Mul
ti-Fa
mily
Perc
enta
ge of
Tota
l Uni
ts
Single Family and Multi-Family Units Included in Residential Building Permits Issued Santa Clara & San Mateo Counties
0
3,000
6,000
9,000
12,000
15,000
'14*'13'12'11'10'09'08'07'06'05'04'03'02'01'000%
20%
40%
60%
80%
100%
Single Family Multi-Family Multi-Family % of Total
*2014 estimate based on data through November. | Data Source: Construction Industry Research Board and California Homebuilding Foundation | Analysis: Center for Continu-ing Study of the California Economy; Silicon Valley Institute for Regional Studies
RESIDENTIAL BUILDING
An upward trend continued for the number of multi-family percentage of total residential units permitted.
Apartment Rental Rates at Turnover Compared to Median Household IncomeSanta Clara & San Mateo Counties
Aver
age R
ent (
In�a
tion
Adju
sted
)
Med
ian
Hous
ehol
d In
com
e (In
�atio
n Ad
just
ed)
0
500
1,000
1,500
2,000
2,500
2014*201320122011201020092008200720062005200420032002$0
$25,000
$50,000
$75,000
$100,000
$125,000
California Average Rent U.S. Average RentSilicon Valley Average Rent Silicon Valley Median Household Income
RENTAL AFFORDABILITY
*Estimate based on Quarters 1-3, 2014. | Data Sources: RealFacts; United States Census Bureau, American Community Survey. Analysis: Silicon Valley Institute for Regional Studies
Average rents continued a four-year upward trend.

66
trend toward more residential development and share of multi-family units will be needed in order to house the region’s growing population.
The average apartment rental rates in Silicon Valley are consistently higher than the state and the nation, and have been rising rapidly since 2010. In 2014, Silicon Valley rents were $645/month higher than California’s, and $1,198/month higher than average rents in the United States. Average rental rates in Silicon Valley continued the upward trend that began in 2010 (reaching $2,333/month in 20142), increasing by 8.7% ($171/month, amounting to $2,052 total) between 2012 and 2013. During the same time period, median income rose by 3.6% ($3,203 per year, or $267/month) in Silicon Valley, indicating that while income gains exceeded rental rate increases by nearly $100/month, the rate of increase (3.6% increase in median household income compared to an 8.7% rental rate increase) was much slower and therefore inadequate in offsetting the increased rental rates. Additionally, housing costs are considered bur-densome if they are higher than 30% of gross income.3 As such, it is not possible for the $267 per month (pre-tax) income gain to fully offset the rental rate increase.
2. Including apartment sizes ranging from studios to three-bedrooms.3. According to the U.S. Department of Housing and Urban Development, housing costs greater than 30% of household income pose moderate to severe financial burdens.
Income gains would need to have been approximately 50% greater to accommodate home price increases between 2012 and 2013. During that time period, Silicon Valley median home prices increased by $104,000, amounting to a mortgage payment increase of nearly $400 per month (over $4,700 per year) for first-time homebuyers.4 This increase is $1,500 more than the median household income gains that year, indicating the difficulty that existing Silicon Valley residents faced when trying to pur-chase homes in the area.
Silicon Valley’s cities approved more 1,296 affordable housing units for development in FY 2013-14, more than any other year since 2009. This increase amounts to 12 affordable housing units for every 100 units approved for new residential development across the region.
The share of Silicon Valley renters with a significant housing burden (as defined by housing costs more than 35% of income) remained constant between 2012 and 2013 at 40%. This compares to 45% of California rent-ers, and 39% of those across the country. But while the housing burden did not decrease for renters, it did for homeowners. Between 2012 and
4. Based on estimated mortgage payments at the average 30-Year Fixed Rates, assuming first-time homeowners put 20% as a down payment, and not accounting for inflation between 2012 and 2013.
Affordable Units as a Percentage of Total Approved New Residential UnitsSilicon Valley
0%
5%
10%
15%
20%
25%
30%
35%
'14'13'12'11'10'09'08'07'06'05'04'03'02'01'00'99'98
351
1,29683260
494
1,273
1,40457
1
781
859
1,147
1,507
1,826
2,816
1,659
1,900
1,589New a�ordable
housing units
15%
14%
32%
30%
28%
24%
13%
6% 11%
10%
5% 11%
23%
5% 2% 8% 12%
Note: Beginning in 2008, the Land Use Survey expanded its geographic definition of Silicon Valley to include cities northward along the U.S. 101 corridor (Brisbane, Burlin-game, Millbrae, San Bruno and South San Francisco). In 2014, the Survey expanded to include all Silicon Valley cities (adding Colma, Daly City, Half Moon Bay and Pacifica).Data Source: City Planning and Housing Departments of Silicon Valley | Analysis: Silicon Valley Institute for Regional Studies
BUILDING AFFORDABLE HOUSING
New affordable housing development increased to 12%.
HOUSINGPLACE

67
2013, the share of homeowners with housing costs greater than 35% of their income continued a five-year downward trend, decreasing nearly eight percentage points to 30%. The most recent peak housing burden for homeowners was in 2008, when 41% of homeowners were spending more than 35% of their income in housing costs. But whereas the greatest share of Silicon Valley homeowners burdened by housing costs was in 2007 and 2008, the share of renters burdened by housing costs has risen by 5.4 percentage points since then. PL
ACE
Environment
Transportation
Land Use
Housing
PERCENT OF HOUSEHOLDS WITH HOUSING COSTS GREATER THAN 35% OF INCOME
The share of Silicon Valley renters burdened by housing costs remained constant, while the share of homeowners burdened declined between 2012 and 2013.
Santa Clara & San Mateo Counties, California, and the United States
0%5%
10%15%20%25%30%35%40%45%50%
United StatesCaliforniaSilicon Valley
0%5%
10%15%20%25%30%35%40%45%50%
United StatesCaliforniaSilicon Valley
2002
2003
2004
2005
2006
2007
2008
2009
2010
2011
2012
2013
2002
2003
2004
2005
2006
2007
2008
2009
2010
2011
2012
2013
Renters
Owners
Data Source: United States Census Bureau, American Community Survey | Analysis: Silicon Valley Institute for Regional Studies
of Silicon Valley renters were burdened by housing costs in 2013.
39.5%
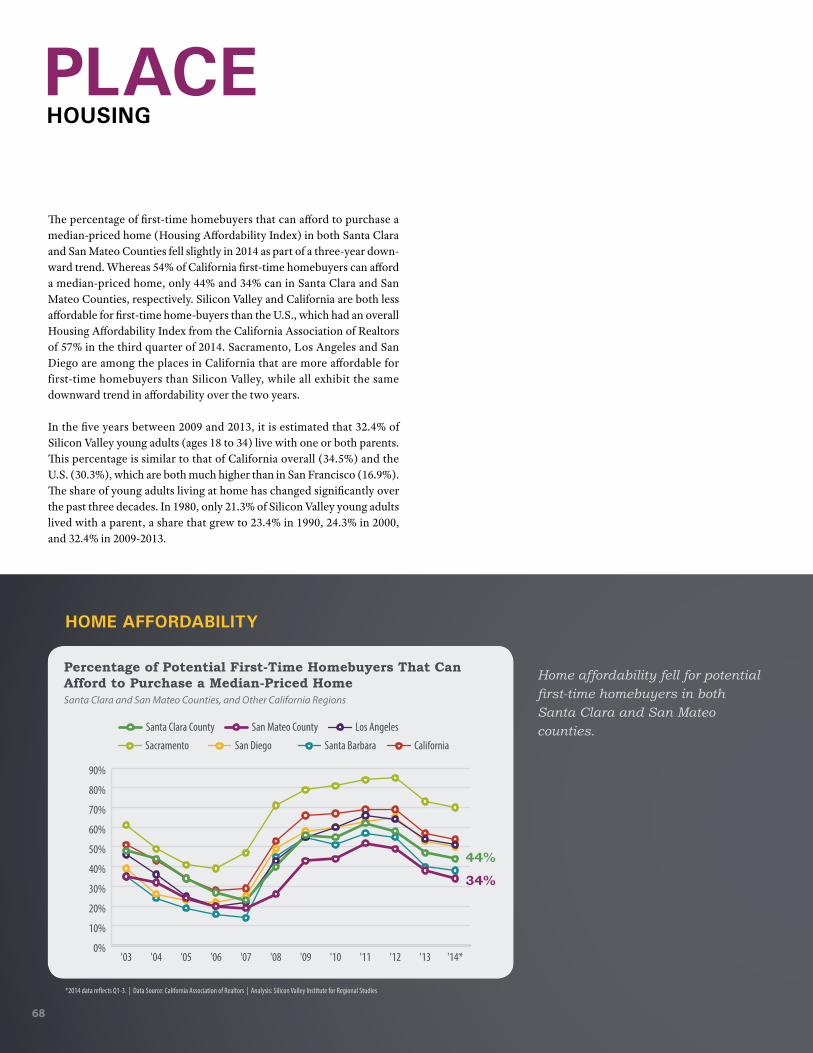
68
The percentage of first-time homebuyers that can afford to purchase a median-priced home (Housing Affordability Index) in both Santa Clara and San Mateo Counties fell slightly in 2014 as part of a three-year down-ward trend. Whereas 54% of California first-time homebuyers can afford a median-priced home, only 44% and 34% can in Santa Clara and San Mateo Counties, respectively. Silicon Valley and California are both less affordable for first-time home-buyers than the U.S., which had an overall Housing Affordability Index from the California Association of Realtors of 57% in the third quarter of 2014. Sacramento, Los Angeles and San Diego are among the places in California that are more affordable for first-time homebuyers than Silicon Valley, while all exhibit the same downward trend in affordability over the two years.
In the five years between 2009 and 2013, it is estimated that 32.4% of Silicon Valley young adults (ages 18 to 34) live with one or both parents. This percentage is similar to that of California overall (34.5%) and the U.S. (30.3%), which are both much higher than in San Francisco (16.9%). The share of young adults living at home has changed significantly over the past three decades. In 1980, only 21.3% of Silicon Valley young adults lived with a parent, a share that grew to 23.4% in 1990, 24.3% in 2000, and 32.4% in 2009-2013.
HOUSINGPLACE
Percentage of Potential First-Time Homebuyers That Can Afford to Purchase a Median-Priced HomeSanta Clara and San Mateo Counties, and Other California Regions
0%
10%
20%
30%
40%
50%
60%
70%
80%
90%
'14*'13'12'11'10'09'08'07'06'05'04'03
44%
34%
CaliforniaSanta BarbaraSan DiegoSacramento
Los AngelesSan Mateo CountySanta Clara County
*2014 data reflects Q1-3. | Data Source: California Association of Realtors | Analysis: Silicon Valley Institute for Regional Studies
HOME AFFORDABILITY
Home affordability fell for potential first-time homebuyers in both Santa Clara and San Mateo counties.

69
Percent of Population Age 18 to 34 Living With a Parent Who is the Householder Santa Clara & San Mateo Counties, San Francisco, California and the United States
0%
5%
10%
15%
20%
25%
30%
35%
40%
2009-2013200019901980
United StatesCaliforniaSan FranciscoSilicon Valley
21.3%
19.8%
20.2% 22
.9%
23.4%
20.9% 21
.8% 24.2%
24.3%
17.4%
24.6%
23.2%
32.4%
16.9%
34.5%
30.3%
Data Source: United States Census Bureau, Census Explorer | Analysis: Silicon Valley Institute for Regional Studies
YOUNG ADULTS LIVING WITH A PARENT
PLAC
E
Environment
Transportation
Land Use
Housing
of Silicon Valley young adults live with a parent.
one thirdMore than

70
WHY IS THIS IMPORTANT?Many factors influence local government’s ability to govern effectively, including the availability and management of resources. To maintain ser-vice levels and respond to a changing environment, local government revenue must be reliable.
Property tax revenue is the most stable source of city government rev-enue, fluctuating much less over time than other sources of revenue, such as sales and other taxes. Since property tax revenue represents less than a quarter of all revenue, other revenue streams are critical in determining the overall volatility of local government funding.
HOW ARE WE DOING?City budgets have gotten tighter since the recession, with both revenues and expenses trending downward between Fiscal Years (FY) 2007-08 and 2008-09, respectively, through FY 2012-13. Between FY 2007-08 and FY 2012-13, total revenue for all of Silicon Valley’s cities combined decreased from $6 billion to $5.34 billion, a loss of $678 million ($24.3 million of which was lost between FY 2011-12 and FY 2012-13). Over that same
period of time, revenues became more dependent on Charges for Services (up from 45.7% of total revenue to 47.7%), and less dependent on property tax (down from 21.5% to 18.5%) and investment income (down from 1.4% to 0.4%). Revenues from Charges for Services for all Silicon Valley cities totaled $2.55 billion in FY 2013-14, $97.5 million more than the previous fiscal year. Fiscal year 2012-13 marked the second year in which Silicon Valley’s revenues exceed expenses (by $103.4 mil-lion). And after six straight years to the contrary, the State of California revenues exceeded expenses (by $9.9 billion) in FY 20-12-13.
Revenues by Source, and ExpensesSilicon Valley
FY 2012-13FY 2011-12FY 2010-11FY 2009-10FY 2008-09FY 2007-08FY 2006-07
Billi
ons o
f Dol
lars
, In�
atio
n Ad
just
ed
-$8
-$6
-$4
-$2
0
$2
$4
$6
$8
23.9%
26.4%
35.3%
4.6%9.7%
24.1%
26.0%
35.3%
5.3%9.3%
26.9%
25.5%
35.5%
3.5%8.7%
27.4%
27.4%
35.0%
2.0%8.2%
26.0%
21.3%
42.0%
1.6%9.1%
21.5%
21.5%
45.7%
1.4%9.8%
18.6%22.9%
47.7%
0.4%10.4%
Revenues
Expenses
Investment Earnings
Sales Tax
Property Tax
Other Revenues
Charges for Services
Expenses
CITY FINANCES
City budgets tightened, and revenues continued to become more dependent on Charges for Services.
Data Source: Silicon Valley Cities, Audited Annual Financial Reports | Analysis: Silicon Valley Institute for Regional Studies
CITY FINANCESCity budgets continued to tighten, while revenues became more dependent on Charges for Services; California revenues exceeded expenses.
GOVERNANCE

71
GOVE
RN.City Finances
Civic Engagement
Silic
on Va
lley
(Mill
ions
of D
olla
rs, I
n�at
ion
Adju
sted
)
$-500$-400$-300$-200$-100
$0$100$200$300$400$500
FY 2012-13FY 2011-12FY 2010-11FY 2009-10FY 2008-09FY 2007-08FY 2006-07
Revenues Minus ExpensesSilicon Valley and California
$-50$-40$-30$-20$-10$0$10$20$30$40$50
Calif
orni
a (B
illio
ns of
Dol
lars
, In�
atio
n Ad
just
ed)
Silicon Valley California
Expenses Minus Revenues was positive in Silicon Valley, and also in California for the first time since 2008.
Data Source: Silicon Valley Cities, Audited Annual Financial Reports; California State Auditor | Analysis: Silicon Valley Institute for Regional Studies
Silicon Valley city revenue totaled $5.34 billion in FY 2012-13.
$5.34billion
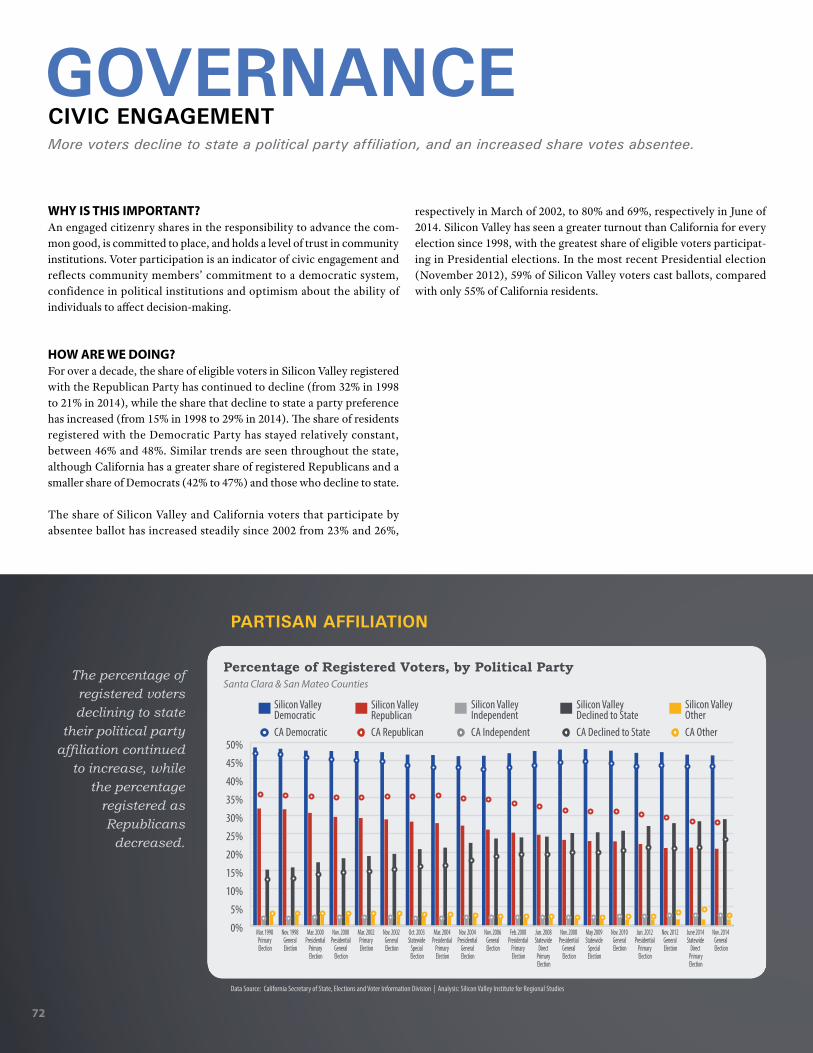
72
WHY IS THIS IMPORTANT?An engaged citizenry shares in the responsibility to advance the com-mon good, is committed to place, and holds a level of trust in community institutions. Voter participation is an indicator of civic engagement and reflects community members’ commitment to a democratic system, confidence in political institutions and optimism about the ability of individuals to affect decision-making.
HOW ARE WE DOING?For over a decade, the share of eligible voters in Silicon Valley registered with the Republican Party has continued to decline (from 32% in 1998 to 21% in 2014), while the share that decline to state a party preference has increased (from 15% in 1998 to 29% in 2014). The share of residents registered with the Democratic Party has stayed relatively constant, between 46% and 48%. Similar trends are seen throughout the state, although California has a greater share of registered Republicans and a smaller share of Democrats (42% to 47%) and those who decline to state.
The share of Silicon Valley and California voters that participate by absentee ballot has increased steadily since 2002 from 23% and 26%,
respectively in March of 2002, to 80% and 69%, respectively in June of 2014. Silicon Valley has seen a greater turnout than California for every election since 1998, with the greatest share of eligible voters participat-ing in Presidential elections. In the most recent Presidential election (November 2012), 59% of Silicon Valley voters cast ballots, compared with only 55% of California residents.
Nov. 2012 General Election
June 2014 Statewide
Direct PrimaryElection
Nov. 2014 General Election
Jun. 2012 Presidential
Primary Election
Nov. 2010 General Election
May 2009 Statewide
Special Election
Nov. 2008 Presidential
General Election
Jun. 2008 Statewide
Direct Primary Election
Feb. 2008 Presidential
Primary Election
Nov. 2006 General Election
Nov. 2004 Presidential
General Election
Mar. 2004 Presidential
Primary Election
Oct. 2003 Statewide
Special Election
Nov. 2002 General Election
Mar. 2002 Primary Election
Nov. 2000 Presidential
General Election
Mar. 2000 Presidential
Primary Election
Nov. 1998 General Election
Mar. 1998 Primary Election
0%
5%
10%
15%
20%
25%
30%
35%
40%
45%
50%
Percentage of Registered Voters, by Political PartySanta Clara & San Mateo Counties
Silicon Valley Other
Silicon Valley Declined to State
Silicon Valley Independent
Silicon Valley Republican
Silicon Valley Democratic
CA OtherCA Declined to StateCA IndependentCA RepublicanCA Democratic
Data Source: California Secretary of State, Elections and Voter Information Division | Analysis: Silicon Valley Institute for Regional Studies
PARTISAN AFFILIATION
The percentage of registered voters declining to state
their political party affiliation continued
to increase, while the percentage
registered as Republicans
decreased.
CIVIC ENGAGEMENTMore voters decline to state a political party affiliation, and an increased share votes absentee.
GOVERNANCE

73
0%
20%
40%
60%
80%
100%
Percentage of Eligible Voters Who Casted Ballots and Absentee Ballots in General Elections
Nov. 2012 General Election
Jun. 2014 Statewide
Direct Primary Election
Jun. 2012 Presidential
Primary Election
Nov. 2010 General Election
May 2009 Statewide
Special Election
Nov. 2008 Presidential
General Election
Jun. 2008 Statewide
Direct Primary Election
Feb. 2008 Presidential
Primary Election
Nov. 2006 General Election
Nov. 2004 Presidential
General Election
Mar. 2004 Presidential
Primary Election
Oct. 2003 Statewide
Special Election
Nov. 2002 General Election
Mar. 2002 Primary Election
Nov. 2000 Presidential
General Election
Mar. 2000 Presidential
Primary Election
Nov. 1998 General Election
Mar. 1998 Primary Election
Casted Ballots: Voted Absentee:Silicon Valley California Silicon Valley California
Data Source: California Secretary of State, Elections Division | Analysis: Silicon Valley Institute for Regional Studies
VOTER PARTICIPATION
Absentee voting rates continued to rise in both Silicon Valley and California.
GOVE
RN.City Finances
Civic Engagement
of Silicon Valley voters participated by absentee ballot in the June 2014 primary election.
80%
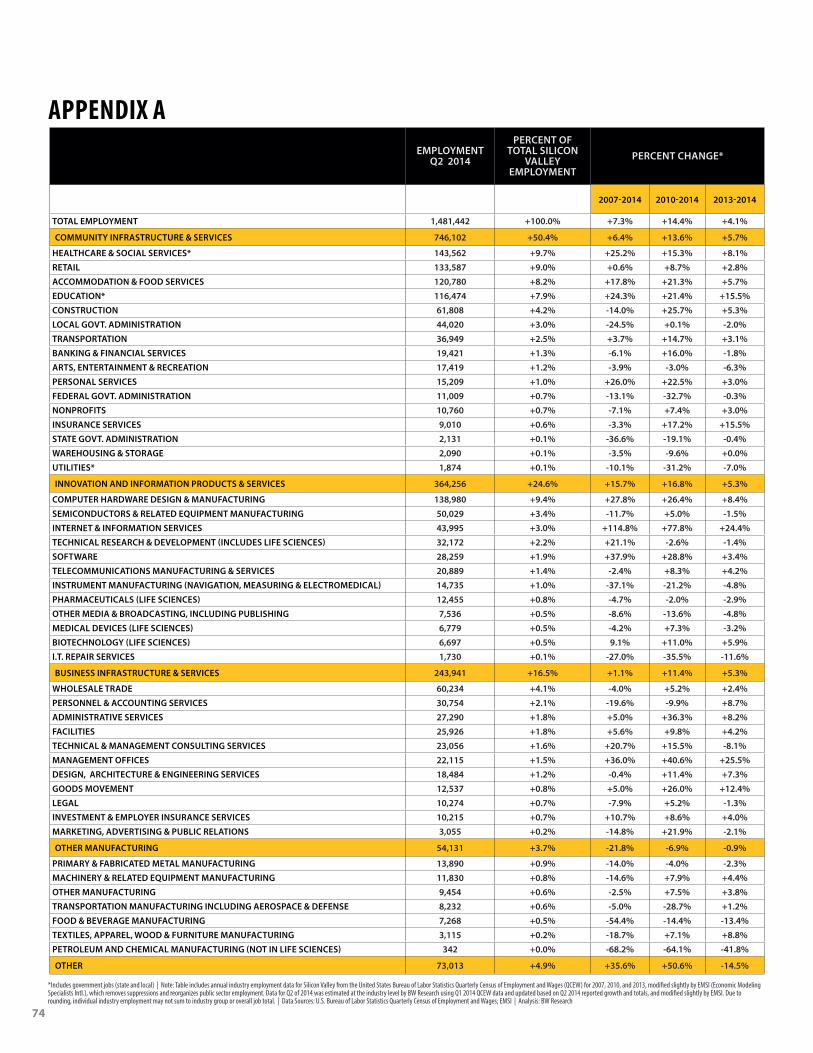
74
EMPLOYMENT Q2 2014
PERCENT OF TOTAL SILICON
VALLEY EMPLOYMENT
PERCENT CHANGE*
2007-2014 2010-2014 2013-2014
TOTAL EMPLOYMENT 1,481,442 +100.0% +7.3% +14.4% +4.1%
COMMUNITY INFRASTRUCTURE & SERVICES 746,102 +50.4% +6.4% +13.6% +5.7%
HEALTHCARE & SOCIAL SERVICES* 143,562 +9.7% +25.2% +15.3% +8.1%
RETAIL 133,587 +9.0% +0.6% +8.7% +2.8%
ACCOMMODATION & FOOD SERVICES 120,780 +8.2% +17.8% +21.3% +5.7%
EDUCATION* 116,474 +7.9% +24.3% +21.4% +15.5%
CONSTRUCTION 61,808 +4.2% -14.0% +25.7% +5.3%
LOCAL GOVT. ADMINISTRATION 44,020 +3.0% -24.5% +0.1% -2.0%
TRANSPORTATION 36,949 +2.5% +3.7% +14.7% +3.1%
BANKING & FINANCIAL SERVICES 19,421 +1.3% -6.1% +16.0% -1.8%
ARTS, ENTERTAINMENT & RECREATION 17,419 +1.2% -3.9% -3.0% -6.3%
PERSONAL SERVICES 15,209 +1.0% +26.0% +22.5% +3.0%
FEDERAL GOVT. ADMINISTRATION 11,009 +0.7% -13.1% -32.7% -0.3%
NONPROFITS 10,760 +0.7% -7.1% +7.4% +3.0%
INSURANCE SERVICES 9,010 +0.6% -3.3% +17.2% +15.5%
STATE GOVT. ADMINISTRATION 2,131 +0.1% -36.6% -19.1% -0.4%
WAREHOUSING & STORAGE 2,090 +0.1% -3.5% -9.6% +0.0%
UTILITIES* 1,874 +0.1% -10.1% -31.2% -7.0%
INNOVATION AND INFORMATION PRODUCTS & SERVICES 364,256 +24.6% +15.7% +16.8% +5.3%
COMPUTER HARDWARE DESIGN & MANUFACTURING 138,980 +9.4% +27.8% +26.4% +8.4%
SEMICONDUCTORS & RELATED EQUIPMENT MANUFACTURING 50,029 +3.4% -11.7% +5.0% -1.5%
INTERNET & INFORMATION SERVICES 43,995 +3.0% +114.8% +77.8% +24.4%
TECHNICAL RESEARCH & DEVELOPMENT (INCLUDES LIFE SCIENCES) 32,172 +2.2% +21.1% -2.6% -1.4%
SOFTWARE 28,259 +1.9% +37.9% +28.8% +3.4%
TELECOMMUNICATIONS MANUFACTURING & SERVICES 20,889 +1.4% -2.4% +8.3% +4.2%
INSTRUMENT MANUFACTURING (NAVIGATION, MEASURING & ELECTROMEDICAL) 14,735 +1.0% -37.1% -21.2% -4.8%
PHARMACEUTICALS (LIFE SCIENCES) 12,455 +0.8% -4.7% -2.0% -2.9%
OTHER MEDIA & BROADCASTING, INCLUDING PUBLISHING 7,536 +0.5% -8.6% -13.6% -4.8%
MEDICAL DEVICES (LIFE SCIENCES) 6,779 +0.5% -4.2% +7.3% -3.2%
BIOTECHNOLOGY (LIFE SCIENCES) 6,697 +0.5% 9.1% +11.0% +5.9%
I.T. REPAIR SERVICES 1,730 +0.1% -27.0% -35.5% -11.6%
BUSINESS INFRASTRUCTURE & SERVICES 243,941 +16.5% +1.1% +11.4% +5.3%
WHOLESALE TRADE 60,234 +4.1% -4.0% +5.2% +2.4%
PERSONNEL & ACCOUNTING SERVICES 30,754 +2.1% -19.6% -9.9% +8.7%
ADMINISTRATIVE SERVICES 27,290 +1.8% +5.0% +36.3% +8.2%
FACILITIES 25,926 +1.8% +5.6% +9.8% +4.2%
TECHNICAL & MANAGEMENT CONSULTING SERVICES 23,056 +1.6% +20.7% +15.5% -8.1%
MANAGEMENT OFFICES 22,115 +1.5% +36.0% +40.6% +25.5%
DESIGN, ARCHITECTURE & ENGINEERING SERVICES 18,484 +1.2% -0.4% +11.4% +7.3%
GOODS MOVEMENT 12,537 +0.8% +5.0% +26.0% +12.4%
LEGAL 10,274 +0.7% -7.9% +5.2% -1.3%
INVESTMENT & EMPLOYER INSURANCE SERVICES 10,215 +0.7% +10.7% +8.6% +4.0%
MARKETING, ADVERTISING & PUBLIC RELATIONS 3,055 +0.2% -14.8% +21.9% -2.1%
OTHER MANUFACTURING 54,131 +3.7% -21.8% -6.9% -0.9%
PRIMARY & FABRICATED METAL MANUFACTURING 13,890 +0.9% -14.0% -4.0% -2.3%
MACHINERY & RELATED EQUIPMENT MANUFACTURING 11,830 +0.8% -14.6% +7.9% +4.4%
OTHER MANUFACTURING 9,454 +0.6% -2.5% +7.5% +3.8%
TRANSPORTATION MANUFACTURING INCLUDING AEROSPACE & DEFENSE 8,232 +0.6% -5.0% -28.7% +1.2%
FOOD & BEVERAGE MANUFACTURING 7,268 +0.5% -54.4% -14.4% -13.4%
TEXTILES, APPAREL, WOOD & FURNITURE MANUFACTURING 3,115 +0.2% -18.7% +7.1% +8.8%
PETROLEUM AND CHEMICAL MANUFACTURING (NOT IN LIFE SCIENCES) 342 +0.0% -68.2% -64.1% -41.8%
OTHER 73,013 +4.9% +35.6% +50.6% -14.5%
*Includes government jobs (state and local) | Note: Table includes annual industry employment data for Silicon Valley from the United States Bureau of Labor Statistics Quarterly Census of Employment and Wages (QCEW) for 2007, 2010, and 2013, modified slightly by EMSI (Economic Modeling Specialists Intl.), which removes suppressions and reorganizes public sector employment. Data for Q2 of 2014 was estimated at the industry level by BW Research using Q1 2014 QCEW data and updated based on Q2 2014 reported growth and totals, and modified slightly by EMSI. Due to rounding, individual industry employment may not sum to industry group or overall job total. | Data Sources: U.S. Bureau of Labor Statistics Quarterly Census of Employment and Wages; EMSI | Analysis: BW Research
APPENDIX A

75
AREALand Area includes Santa Clara and San Mateo counties, Fremont, Newark, Union City, and Scotts Valley. Land Area data (except for Scotts Valley) is from the U.S. Census Bureau: State and County QuickFacts. Land area is based on current information in the TIGER® database, calculated for use with Census 2010. Scotts Valley data is from the Scotts Valley Chamber of Commerce.
POPULATIONData for the Silicon Valley population comes from the E-I: City/County Population Estimates with Annual Percent Change report by the California Department of Finance and are for Silicon Valley cities. Population estimates are for January 2014.
JOBSThe total number of jobs in the city-defined Silicon Valley region for Q2 of 2014 was estimated by BW Research using Q1 2014 United States Bureau of Labor Statistics Quarterly Census of Employment and Wages data and Q2 2014 reported growth, modified slightly by EMSI (Economic Modeling Specialists Intl.), which removes suppressions and reorganizes public sector employment.
AVERAGE ANNUAL EARNINGSAverage Annual Earnings for Silicon Valley was calculated by BW Research using data from the United States Bureau of Labor Statistics Quarterly Census of Employment and Wages, and EMSI. Data for Silicon Valley includes San Mateo and Santa Clara Counties, and the Cities of Fremont, Newark, Scotts Valley, and Union City. Earnings include wages and supplements.
FOREIGN IMMIGRATION AND DOMESTIC MIGRATIONData are from the E-6: Population Estimates and Components of Change by County - July 1, 2010-2014 reported by the California Department of Finance and are for San Mateo and Santa Clara Counties. Estimates for 2014 are
TALENT FLOWS AND DIVERSITY
Components of Population Change; Population Change; Net Migration FlowsData are from the California Department of Finance E-2: California County Population Estimates and Components of Change July 1, 1990-2000, E-2: California County Population Estimates and Components of Change by Year - July 1, 2000-2010, E-6: Population Estimates and Components of Change by County - July 1, 2010-2013 and July 1, 2010-2012, and are for San Mateo and Santa Clara Counties. The July 1, 2010-2013 population estimates include revised
PEOPLE
PROFILE OF SILICON VALLEY
provisional. Net migration includes all legal and unauthorized foreign immi-grants, residents who left the state to live abroad, and the balance of hundreds of thousands of people moving to and from California from within the United States.
ADULT EDUCATIONAL ATTAINMENTData for adult educational attainment are for Santa Clara and San Mateo coun-ties and are derived from the United States Census Bureau, 2013 American Community Survey, 1-Year Estimates. Data reflects the educational attainment of the population 25 years and over.
AGE DISTRIBUTIONData are for Santa Clara and San Mateo counties and are derived from the United States Census Bureau, 2013 American Community Survey, 1-year estimates.
ETHNIC COMPOSITIONData are for Santa Clara and San Mateo counties and are derived from the United States Census Bureau, 2013 American Community Survey, 1-year estimates. Multiple and Other includes Native Hawaiian and Other Pacific Islander Alone, Some Other Race Alone, American Indian and Alaska Native alone, and Two or More Races.
FOREIGN BORNData are for Santa Clara and San Mateo Counties and are derived from the United States Census Bureau, 2013 American Community Survey, 3-year esti-mates. The Foreign Born Population excludes those who were born at sea. Data for China includes Taiwan. 3-Year Estimates were used because 1-Year Estimates were not available for San Mateo County due to a small sample size. Oceania includes American Samoa, Australia, Cook Islands, Fiji, French Polynesia, Guam, Kiribati, Marshall Islands, Federated States of Micronesia, Nauru, New Caledonia, New Zealand, Northern Mariana Islands, Palau, Papua New Guinea, Samoa, Solomon Islands, Tonga, Tuvalu, Vanuatu, Wallis and Futuna.
July 2011 and July 2012 estimates. Estimates for 2014 are provisional. Data for the years 2000-2010 are based on revised estimates released in December 2011. Net migration includes all legal and unauthorized foreign immigrants, residents who left the state to live abroad, and the balance of hundreds of thousands of people moving to and from California from within the United States.
Age DistributionSilicon Valley data includes Santa Clara and San Mateo Counties. Data are from the United States Census Bureau, Population Division, Annual Estimates of the Resident Population for Selected Age Groups by Sex for the United States,
APPENDIX B
76
EMPLOYMENT
Number of Silicon Valley Jobs with Percent Change over Prior Year; Silicon Valley Employment in the Public SectorData includes average annual employment estimates as of the second quarter for years 2007 through 2014 from the United States Bureau of Labor Statistics Quarterly Census of Employment and Wages, and includes the entire city-defined Silicon Valley region. Data for Q2 of 2014 was estimated at the industry level by BW Research using Q1 2014 QCEW data and updated based on Q2 2014 reported growth and totals, and modified slightly by EMSI (Economic Modeling Specialists Intl.), which removes suppressions and reorganizes public sector employment.
Relative Job GrowthData is from the United States Bureau of Labor Statistics, Quarterly Census of Employment and Wages for Q2 2007, Q2 2010, Q2 2013 and Q2 2014. The total number of jobs for Q2 of 2014 was estimated by BW Research using Q1 2014
ECONOMY
United States Bureau of Labor Statistics Quarterly Census of Employment and Wages data and Q2 2014 reported growth, modified slightly by EMSI (Economic Modeling Specialists Intl.), which removes suppressions and reorganizes public sector employment.
Silicon Valley Major Areas of Economic Activity; Silicon Valley Employment Growth by Major Areas of Economic ActivityData includes average annual employment estimates as of the second quarter for years 2007 through 2013 from the United States Bureau of Labor Statistics Quarterly Census of Employment and Wages, and includes the entire city-defined Silicon Valley region. Data for Q2 of 2014 was estimated at the industry level by BW Research using Q1 2014 QCEW data and updated based on Q2 2014 reported growth and totals, and modified slightly by EMSI (Economic Modeling Specialists Intl.), which removes suppressions and reorganizes public sector employment. Community Infrastructure & Services includes Healthcare & Social Services* (including state and local government jobs); Retail;
States, Counties, and Puerto Rico Commonwealth and Municipios: April 1, 2010 to July 1, 2013.
Birth RateData are from the California Department of Finance E-2: California County Population Estimates and Components of Change July 1, 1990-2000, E-2: California County Population Estimates and Components of Change by Year - July 1, 2000-2010, E-6: Population Estimates and Components of Change by County - July 1, 2010-2013 and July 1, 2010-2012, and are for San Mateo and Santa Clara Counties. The July 1, 2010-2013 population estimates include revised July 2011 and July 2012 estimates. Estimates for 2014 are provisional. Data for the years 2000-2010 are based on revised estimates released in December 2011.
Percentage of Adults, by Educational AttainmentData for adult educational attainment are for Santa Clara and San Mateo Counties and are derived from the United States Census Bureau, 2013 American Community Survey, 1-Year Estimates. Data reflects the educational attainment of the population 25 years and over. Educational Attainment by Race/Ethnicity reflects adults whose highest degree received was either a bachelor’s degree or a graduate degree.
Percentage of Adults with a Bachelor’s Degree or Higher by Race/EthnicityData for adult educational attainment are for Santa Clara and San Mateo Counties and are derived from the United States Census Bureau, 2007, 2010, and 2013 American Community Survey 3-Year Estimates. Data reflects the educa-tional attainment of the population 25 years and over. Educational Attainment by Race/Ethnicity reflects adults whose highest degree received was either a bachelor’s degree or a graduate degree.
PEOPLE continued
Total Science and Engineering Degrees ConferredState and regional data for 1995-2013 are from the National Center for Education Statistics. Regional data for the Silicon Valley includes the following post-sec-ondary institutions: Menlo College, Cogswell Polytechnic College, University of San Francisco, University of California (Berkeley, Davis, Santa Cruz, San Francisco), Santa Clara University, San Jose State University, San Francisco State University, Stanford University, Golden Gate University, and University of Phoenix - Bay Area Campus. The academic disciplines include: computer and information sciences, engineering, engineering-related technologies, biological sciences/life sciences, mathematics, physical sciences and science technologies. Data were analyzed based on 1st major and level of degree (Bachelor’s, Master’s or Doctorate).
Foreign BornData are derived from the United States Census Bureau, 2013 American Community Survey, 1-Year Estimates. Silicon Valley includes Santa Clara and San Mateo Counties.
Foreign LanguageData for Silicon Valley include Santa Clara and San Mateo Counties, and are from the United States Census Bureau, 2007 and 2013 American Community Surveys, 3-Year Estimates (for Population Share) and 2013 American Community Survey, 1-Year Estimate (for Languages Other Than English Spoken at Home for the Population 5-Years and Over, 2013), for the population five years and over. French includes Patois, Creole, and Cajun. Spanish includes Spanish Creole. German includes other West Germanic languages.
APPENDIX B

77
Accommodation & Food Services; Education (including state and local govern-ment jobs); Construction; Local Government Administration; Transportation; Banking & Financial Services; Arts, Entertainment & Recreation; Personal Services; Federal Government Administration; Nonprofits; Insurance Services; State Government Administration; Warehousing & Storage; and Utilities (including state and local government jobs). Innovation and Information Products & Services includes Computer Hardware Design & Manufacturing; Semiconductors & related Equipment Manufacturing; Internet & Information Services; Technical Research & Development (Include Life Sciences); Software; Telecommunications Manufacturing & Services; Instrument Manufacturing (Navigation, Measuring & Electromedical); Pharmaceuticals (Life Sciences); Other Media & Broadcasting, including Publishing; Medical Devices (Life Sciences); Biotechnology (Life Sciences); and I.T. Repair Services. Business Infrastructure & Services includes Wholesale Trade; Personnel & Accounting Services; Administrative Services; Technical & Management Consulting Services; Facilities; Management Offices; Design, Architecture & Engineering Services; Goods Movement; Legal; Investment & Employer Insurance Services; and Marketing, Advertising & Public Relations. Other Manufacturing includes Primary & Fabricated Metal Manufacturing; Machinery & Related Equipment Manufacturing; Other Manufacturing; Transportation Manufacturing includ-ing Aerospace & Defense; Food & Beverage Manufacturing; Textiles, Apparel, Wood & Furniture Manufacturing; and Petroleum and Chemical Manufacturing (Not in Life Sciences).
Employment by TierEmployment by Tier data are from the U.S. Bureau of Labor Statistics, Quarterly Census of Employment and Wages (QCEW) and modified slightly by EMSI to remove suppressions and reorganize public sector employment. 2014 data are estimates based on QCEW 2014 Q2 employment at the industry level using 2014 Q1 data, and updated based on 2014 Q2 reported growth and totals reported, and modified slightly by EMSI. Occupational segmentation into tiers has been recently adopted by the California Employment Development Department (EDD), and implemented over the last several years by BW Research for regional occupational analysis. Occupational segmentation allows for the in-depth examination of the quality and quantity of jobs in a given economy. This occupational segmentation technique delineates the majority of occupations into one of three tiers. Tier 1 Occupations include managers (Chief Executives, Financial Managers, and Sales Managers), professional positions (Lawyers, Accountants, and Physicians) and highly-skilled technical occupations, such as Scientists, Computer Programmers, and Engineers, and are typically the highest-paying, highest-skilled occupations in the economy. Tier 2 Occupations include sales positions (Sales Representatives), teachers, and librarians, office and administrative positions (Accounting Clerks and Secretaries), and manu-facturing, operations, and production positions (Assemblers, Electricians, and Machinists). They have historically provided the majority of employment oppor-tunities and may be referred to as middle-wage, middle-skill positions. Tier 3 Occupations include protective services (Security Guards), food service and retail positions (Waiters, Cooks, and Cashiers), building and grounds cleaning positions ( Janitors), and personal care positions (Home Health Aides and Child Care Workers). These occupations typically represent lower-skilled service positions with lower wages that require little formal training and/or education.
In 2014, average earnings (assuming a 40 hour work week for the entire year) were $60.23 per hour or approximately $125,285 per year for Tier 1 occupations, $27.00 per hour or approximately $56,168 per year for Tier 2 occupations, and $14.05 per hour or approximately $29,220 per year for Tier 3 occupations.
Monthly Unemployment RateMonthly unemployment rates are calculated using employment and labor force data from the Bureau of Labor Statistics, Current Population Statistics (CPS) and the Local Area Unemployment Statistics (LAUS). Data is not seasonally adjusted. Santa Clara County, San Mateo County, San Francisco and California data for November 2014 are Preliminary.
Unemployed Residents’ Share of the Working Age PopulationData is for Santa Clara and San Mateo Counties, and is from the U.S. Census Bureau, American Community Survey, 1-Year Estimates for 2007 through 2013. The data counts the number of unemployed persons, as well estimates the total population in each racial/ethnic category for residents 16 years of age and older. Other includes the categories Some Other Race and Two or More Races in 2008-2013. Data for Two or More Races is not available for San Mateo County for 2007. White is non-Hispanic or Latino. Data are limited to the household population and exclude the population living in institutions, college dormitories, and other group quarters.
INCOME
Per Capita IncomePer capita values are calculated using personal income data from the U.S. Department of Commerce, Bureau of Economic Analysis and population figures from the U.S. Census Bureau mid-year population estimates for 2010-2013 available as of March 2014. Silicon Valley data are for Santa Clara and San Mateo Counties. Personal income estimates for 2001 forward reflect the results of the comprehensive revision to the national income and product accounts (NIPAs) released in July 2013, which creates a temporary break in BEA’s time series for earlier years. All per capita income values have been inflation-adjusted and are reported in 2014 dollars, using the Bay Area consumer price index for all urban consumers from the Bureau of Labor Statistics, 2014 estimate for the Silicon Valley and San Francisco data, the California consumer price index for all urban consumers from the California Department of Finance May Revision Forecast (April 2014) for California data, and the U.S. city average consumer price index for all urban consumers from the Bureau of Labor Statistics for U.S. data.
Per Capita Income by Race & Ethnicity; Percent Change in Per Capita Income: 2007-2013Data for per Capita Income are from the U.S. Census Bureau 2007, 2008, 2011 and 2013 American Community Surveys. All income values have been inflation-adjusted and are reported in 2013 dollars, using the Bay Area consumer price index for all urban consumers from the Bureau of Labor Statistics, 2013 estimate. Silicon Valley data includes Santa Clara and San Mateo Counties. Per capita income is the mean money income received computed for every man, woman,
ECONOMY continued
APPENDIX B

78
and child in a geographic area. It is derived by dividing the total income of all people 15 years old and over in a geographic area by the total population in that area. Income is not collected for people under 15 years old even though these people are included in the denominator of per capita income. This measure is rounded to the nearest whole dollar. Money income includes amounts reported separately for wage or salary income; net self-employment income; interest, dividends, or net rental or royalty income or income from estates and trusts; Social Security or Railroad Retirement income; Supplemental Security Income (SSI); public assistance or welfare payments; retirement, survivor, or disability pensions; and all other income. Population data used to compute per capita values are from the U.S. Census Bureau, American Community Survey 1-Year Estimates from 2007, 2009, 2011, and 2013, table DP05 (Demographic and Housing Estimates).
Median Household Income; Percent Change in Median Household Income: 2012-2013Data for Median Household Income are from the U.S. Census Bureau 2000-2013 American Community Surveys. All income values have been inflation-adjusted and are reported in 2014 dollars, using the Bay Area consumer price index for all urban consumers from the Bureau of Labor Statistics, 2014 estimate for the Silicon Valley and San Francisco data, the California consumer price index for all urban consumers from the California Department of Finance May Revision Forecast (April 2014) for California data, and the U.S. city average consumer price index for all urban consumers from the Bureau of Labor Statistics for U.S. data. Silicon Valley data includes Santa Clara and San Mateo Counties. Median household income for Silicon Valley was estimated using a weighted average based on the county population figures from the California Department of Finance “E-4 Population Estimates for Cities, Counties, and the State, 2011–2014, with 2010 Census Benchmark,” “E-4 Revised Historical City, County and State Population Estimates, 1991-2000, with 1990 and 2000 Census Counts,” and “E-4 Population Estimates for Cities, Counties, and the State, 2001–2010, with 2000 & 2010 Census Counts.”
Average WagesAverage wages are from the U.S. Bureau of Labor Statistics, QCEW data modi-fied slightly by EMSI to take into account yearly changes in methodology and occupational classifications. Average wage data for San Mateo County exhibited an abnormally large increase between 2011 and 2012, which may be reflective of methodological changes in data collection. Wages have been inflation-adjusted and are reported in 2014 dollars, using the Bay Area consumer price index for all urban consumers from the Bureau of Labor Statistics, 2014 estimate for the Bay Area data, and the California consumer price index for all urban consumers from the California Department of Finance May Revision Forecast (April 2014) for California data.
Median Wages for Various Occupational Categories; Percent Change in Inflation-Adjusted Median Wages for Various Occupational Categories: 2010-2014Data are from the California Employment Development Department, Employment and Wages by Occupation, 2010-2014, for the San Jose-Sunnyvale-Santa Clara Metropolitan Statistical Area (MSA), including Santa Clara and
San Benito Counties, and the San Francisco-San Mateo-Redwood City MSA, including Marin, San Francisco, and San Mateo Counties. Wages have been inflation-adjusted and are reported in 2014 dollars, using the Bay Area consumer price index for all urban consumers from the Bureau of Labor Statistics, 2014 estimate for the Bay Area data, and the California consumer price index for all urban consumers from the California Department of Finance May Revision Forecast (April 2014) for California data. Management, Business, Science and Arts Occupations include Management; Business and Financial Operations; Computer and Mathematical; Architecture and Engineering; Life, Physical, and Social Science; Community and Social Services; Legal; Education, Training, and Library; Arts, Design, Entertainment, Sports, and Media; and Healthcare Practitioners and Technical Occupations. Service Occupations include Healthcare Support; Protective Services; Food Preparation and Serving-Related; Building and Grounds Cleaning and Maintenance; and Personal Care and Service Occupations. Sales and Office Occupations include Sales and Related; and Office and Administrative Support Occupations. Natural Resources, Construction and Maintenance Occupations include Farming, Fishing and Forestry; Construction and Extraction; and Installation, Maintenance and Repair Occupations. Production, Transportation and Material Moving Occupations include Production; and Transportation and Material Moving Occupations.
Median Wages by TierMedian Wages by Tier data are based on Occupational Employment Statistics from the U.S. Bureau of Labor Statistics, Quarterly Census of Employment and Wages (QCEW) and modified slightly by EMSI county-level earnings by industry. 2014 data are estimates based on QCEW 2014 Q1 data. Occupational segmentation into tiers has been recently adopted by the California Employment Development Department (EDD), and implemented over the last several years by BW Research for regional occupational analysis. Occupational segmentation allows for the in-depth examination of the quality and quantity of jobs in a given economy. This occupational segmentation technique delineates the majority of occupations into one of three tiers. Tier 1 Occupations include managers (Chief Executives, Financial Managers, and Sales Managers), professional positions (Lawyers, Accountants, and Physicians) and highly-skilled technical occupa-tions, such as Scientists, Computer Programmers, and Engineers, and are typically the highest-paying, highest-skilled occupations in the economy. Tier 2 Occupations include sales positions (Sales Representatives), teachers, and librar-ians, office and administrative positions (Accounting Clerks and Secretaries), and manufacturing, operations, and production positions (Assemblers, Electricians, and Machinists). They have historically provided the majority of employment opportunities and may be referred to as middle-wage, middle-skill positions. Tier 3 Occupations include protective services (Security Guards), food service and retail positions (Waiters, Cooks, and Cashiers), building and grounds cleaning positions ( Janitors), and personal care positions (Home Health Aides and Child Care Workers). These occupations typically represent lower-skilled service positions with lower wages that require little formal train-ing and/or education.
ECONOMY continued
APPENDIX B

79
Poverty and Self-SufficiencyData is from the Self-Sufficiency Standard for California for 2012, from the Center for Women’s Welfare at the University of Washington School of Social Work. Silicon Valley data represents an average of the values of Santa Clara and San Mateo Counties. Developed by Dr. Diana Pearce, the Self-Sufficiency Standard defines the amount of income necessary to meet basic needs (includ-ing taxes) without public subsidies (e.g., public housing, food stamps, Medicaid or child care) and without private/informal assistance (e.g., free babysitting by a relative or friend, food provided by churches or local food banks, or shared housing). The family types for which a Standard is calculated range from one adult with no children, to one adult with one infant, one adult with one pre-schooler, and so forth, up to two-adult families with three teenagers.
Distribution of Households by Income RangesData for Distribution of Income and Housing Dynamics are from the U.S. Census Bureau 2009-2013 American Community Survey, 1-Year Estimates. Income ranges are based on nominal values. Silicon Valley data includes Santa Clara and San Mateo Counties. Income is the sum of the amounts reported separately for the following eight types of income: Wage or salary income; Net self-employment income; Interest, dividends, or net rental or royalty income from estates and trusts; Social Security or railroad retirement income; Supplemental Security Income; Public assistance or welfare payments; Retirement, survivor, or disability pensions; and All other income.
Individual Median Income by Educational Attainment; Percent Change in Median Income by Educational Attainment: 2012-2013; Individual Median Income by Gender and Educational AttainmentData for Median Income by Educational Attainment are from the U.S. Census Bureau 2006-2013 American Community Surveys, 1-Year Estimates, and include the population 25 years and over with earnings. All income values have been inflation-adjusted and are reported in 2014 dollars, using the Bay Area consumer price index for all urban consumers from the Bureau of Labor Statistics, 2014 estimate for the Silicon Valley and San Francisco data, the California consumer price index for all urban consumers from the California Department of Finance May Revision Forecast (April 2014) for California data, and the U.S. city aver-age consumer price index for all urban consumers from the Bureau of Labor Statistics for U.S. data. Silicon Valley data includes Santa Clara and San Mateo Counties. The 2008 value for those with a graduate or professional degree is for San Mateo County only because the Santa Clara County data reported median income in that category as $100,000+.
Free or Reduced Price MealsData includes students ages 5-17. Free and Reduced Meal Program (FRMP) information is submitted by schools to the Department of Education in January. The 2013-14 data is from the October 2013 data collection, and is certified as of March 24, 2014. Data for 2012-13 was revised on June 30, 2014. Data files include public school enrollment and the number of students eligible for free or reduced price meal programs. Data for Silicon Valley include Santa Clara and San Mateo Counties. A child’s family income must fall below 130% of the federal poverty guidelines ($30,615 for a family of four in 2013-2014) to qualify for free meals,
or below 185% of the federal poverty guidelines ($43,568 for a family of four in 2013-2014) to qualify for reduced-cost meals. Students may be eligible for free or reduced price meals based on applying for the National School Lunch Program (NSLP), or who are determined to meet the same income eligibility criteria as the NSLP through their local schools, or their homeless, migrant, or foster status in CALPADS, or those students “directly certified” as participating in California’s food stamp program. Years presented are the final year of a school year (e.g., 2011-2012 is shown as 2012). In school year 2012-2013, the California Department of Education changed its data collection methodology to utilize CALPADS (California Longitudinal Pupil Achievement Data System) student-level data rather than district-provided data. The Non Public Schools (NPS) and adult schools included in the CALPADS data were excluded from the analysis for consistency, because they were not included in past FRPM files. Because the 2012-2013 data had a large number of schools reporting enrollment and percent eligible but not eligible student counts, counts were estimated by multiplying enrollment by the eligibility rate and rounding to the nearest whole number.
INNOVATION & ENTREPRENEURSHIP
Value Added; Percent Change in Value Added Per EmployeeValue added per employee is calculated as regional gross domestic prod-uct (GDP) divided by the total employment. GDP estimates the market value of all final goods and services. GDP and employment data are from Moody’s Economy.com estimates using historical data through 2013 and forecasts updated on 11/10/2014 (U.S. data), 11/14/2014 (California data) and 11/03/2014 (Silicon Valley and San Francisco). All GDP values have been inflation-adjusted and are reported in 2014 dollars, using the Bay Area consumer price index for all urban consumers from the Bureau of Labor Statistics, 2014 estimate for the Silicon Valley and San Francisco data, the California consumer price index for all urban consumers from the California Department of Finance May Revision Forecast (April 2014) for California data, and the U.S. city aver-age consumer price index for all urban consumers from the Bureau of Labor Statistics for U.S. data. Silicon Valley data is for Santa Clara and San Mateo Counties.
Patent Registration; Patents Granted per 100,000 People; Patent Registrations by Technology AreaPatent data is provided by the United States Patent and Trademark Office and consists of Utility patents granted by inventor. Geographic designation is given by the location of the first inventor named on the patent application. Silicon Valley patents include only those filed by residents of Silicon Valley. Other Includes: Teaching & Amusement Devices, Transportation/Vehicles, Motors, Engines and Pumps, Dispensing & Material Handling, Food, Plant & Animal Husbandry, Furniture & Receptacles, Apparel, Textiles & Fastenings, Body Adornment, Nuclear Technology, Ammunition & Weapons, Earth Working and Agricultural Machinery, Machine Elements or Mechanisms, and Superconducting Technology. The technology area categorization method was slightly modified in 2012, resulting in minor changes to the proportion of patents in each technology area relative to previous years.
ECONOMY continued
APPENDIX B

80
Venture Capital Investment; Venture Capital by Industry; Top Venture Capital Deals of Q1-3, 2014Data are provided by The MoneyTree™ Report from PricewaterhouseCoopers and the National Venture Capital Association based on data from Thomson Reuters. Only investments in firms located within the city-defined Silicon Valley region are included. Other includes Healthcare Services, Electronics/Instrumentation, Financial Services, Business Products & Services, Other and Retailing/Distribution. All values have been inflation-adjusted and are reported in 2014 dollars, using the Bay Area consumer price index for all urban consum-ers from the Bureau of Labor Statistics, 2014 estimate for the Silicon Valley and San Francisco data, the California consumer price index for all urban consumers from the California Department of Finance May Revision Forecast (April 2014) for California data, and the U.S. city average consumer price index for all urban consumers from the Bureau of Labor Statistics for U.S. data.
Venture Capital Investment in Clean Technology; Venture Capital Investment in Clean Technology, by Segment; Total Number of Cleantech Venture Capital DealsData provided by Cleantech Group’s i3 Platform (i3.cleantech.com). For this analysis, venture capital is defined as disclosed cleantech equity investment deal totals. Silicon Valley data are based on Joint Venture’s city-defined region. The Cleantech Group describes “”cleantech”” as new technology, processes and business models, spanning a range of industries that enhance efficiency, reduce or eliminate negative ecological impact, and improve the productive and respon-sible use of natural resources. All values have been inflation-adjusted and are reported in 2014 dollars, using the Bay Area consumer price index for all urban consumers from the Bureau of Labor Statistics, 2014 estimate for the Silicon Valley and San Francisco data, the California consumer price index for all urban consumers from the California Department of Finance May Revision Forecast (April 2014) for California data, and the U.S. city average consumer price index for all urban consumers from the Bureau of Labor Statistics for U.S. data.
Angel Investment; Angel Investment, by StageData is from CB Insights, and includes the entire city-defined Silicon Valley region, San Francisco, and California. The analysis includes disclosed financ-ing data for both Seed Stage and Series A+ investments in which one or more Angel investor(s) participated. Investment amounts have been inflation-adjusted and are reported in 2014 dollars, using the Bay Area consumer price index for all urban consumers from the Bureau of Labor Statistics, 2014 estimate for the Silicon Valley and San Francisco data, and the California consumer price index for all urban consumers from the California Department of Finance May Revision Forecast (April 2014) for California data.
Initial Public Offerings ; U.S. IPO Pricings of International Companies, by CountryData is from IPO ETF manager Renaissance Capital. Locations are based on the corporate address provided to Renaissance Capital. Silicon Valley includes the city-defined region.
Mergers & Acquisitions; Percentage of Merger & Acquisition Deals, by Participation TypeData provided by FactSet Research Systems, Inc. Data are based on M&A Activity in Joint Venture’s zip code-defined region of Silicon Valley. Transactions include full acquisitions, minority stakes, club-deals and spinoffs.
Relative Growth of Firms Without Employees; Firms Without Employees in 2012; Percentage of Nonemployers by Industry, 2012Data for firms without employees are from the U.S. Census Bureau, which uses the term ‘nonemployers’. The Census defines nonemployers as a business that has no paid employees, has annual business receipts of $1,000 or more ($1 or more in the construction industries), and is subject to federal income taxes. Most nonemployers are self-employed individuals operating very small unin-corporated businesses, which may or may not be the owner’s principal source of income. Silicon Valley data include Santa Clara and San Mateo Counties. The 2009 nonemployer data was reissued August 15, 2012.
COMMERCIAL SPACE
Commercial Space; Commercial Vacancy; Commercial Rents; New Commercial DevelopmentData is from Colliers International, and represents the end of each annual period unless otherwise noted. Commercial space includes Office, R&D, Industrial and Warehouse space. For San Mateo County data, Industrial includes Warehouse. Santa Clara County data for Commercial Rents and New Commercial Development include Fremont. The vacancy rate is the amount of unoccupied space, and is calculated by dividing the direct and sublease vacant space by the building base. The vacancy rate does not include occupied spaces presently being offered on the market for sale or lease. The Change in Available Commercial Space is calculated as the change between Q3 and Q3 of the prior year. Average asking rents are weighted “Full Service” (all-inclusive) for Office space, and NNN (triple net lease structure, where the tenant pays expenses) for R&D, Industrial and Warehouse. Net absorption is the change in occupied space during a given time period. Average asking rents have been inflation-adjusted and are reported in 2014 dollars, using the Bay Area consumer price index for all urban consumers from the Bureau of Labor Statistics, 2014 estimate. 2014 data is through Q3. 2006 data for average asking rents for San Mateo County Industrial and R&D are based on Q3-4.
ECONOMY continued
APPENDIX B

81
EARLY EDUCATION
Preschool EnrollmentData for preschool enrollment is for San Mateo and Santa Clara Counties, California, and the United States. The data are from the United States Census Bureau, 2005-2013 American Community Surveys. Percentages were calculated from the number of children ages three and four that are enrolled in either public or private school, and the number that are not enrolled in school.
ARTS & CULTURE
Adult Population Share Attending Arts & Culture Events and Attractions , Purchasing Recorded Media; Annual Consumer Expenditures on Arts & Culture Consumption; Nonprofit Arts Organizations; Arts & Culture EstablishmentsData are from the Americans for the Arts Local Index. Data for Consumer Expenditures and Adult Cultural Participation was collected by Scarborough Research via survey. Consumer expenditure data is from 2013. Data for the population share attending arts & culture events and attractions was collected between 2011 and 2013, and represents an average percentage. All indicators are for adults age 18 or over. Live Entertainment includes music concerts or other stage performances. Live Performing Arts includes theatre, dance, symphony, and opera. Recorded media include music, videocassettes and DVDs. Data for Nonprofit Arts Organizations are from the National Center for Charitable Statistics (NCCS) at the Urban Institute. Arts Nonprofits are defined by 43 dif-ferent categories of several major arts-related groups in the National Taxonomy of Exempt Entities (NTEE), and only include organizations that filed the IRS Form 990 in 2009. Arts Establishments include businesses and artists serving the community, and are defined by 44 North American Industrial Classification System (NAICS) codes representative of arts and culture. Data are from the United States Census Bureau County Business Patterns series.
QUALITY OF HEALTH
Percentage of the Population with Health Insurance, by Age; Percentage of Individuals with Health Insurance, by Age & Employment Status; Change in the Percentage of Individuals with Health Insurance by Age and Employment Status, 2012-2013Data for those with health insurance are from the U.S. Census Bureau, American Community Survey, 1-Year Estimates for the civilian non-institutionalized popu-lation. Silicon Valley data includes Santa Clara and San Mateo Counties.
Students Overweight or ObeseData are from the California Department of Education, Physical Fitness Testing Research Files, and include all public school students in 5th, 7th and 9th grades in San Mateo and Santa Clara Counties, and California, who were tested through the Fitnessgram assessment. In the 2013-14 school year, the performance
SOCIETY
PREPARING FOR ECONOMIC SUCCESS
High School Graduation and Dropout Rate; High School Graduation Rates; Share of Graduates Who Meet UC/CSU RequirementsStudents meeting UC/CSU requirements include all 12th grade graduates completing all courses required for University and/or California State University entrance. Ethnicities were determined by the California Department of Education. Any student ethnicity pools containing 10 or fewer students were excluded in order to protect student privacy. Multi/None includes both students of two or more races, and those who did not report their race. Silicon Valley includes all students attending public high school in San Mateo and Santa Clara Counties, as well as those in Scotts Valley Unified School District, New Haven School District, Fremont Unified School District and Newark Unified School District. Dropout and graduation rates are four-year adjusted rates. The adjusted rates are derived from the number of cohort members who earned a regular high school diploma (or dropped out) by the end of year 4 in the cohort divided by the number of first-time grade 9 students in year 1 (starting cohort) plus students who transfer in, minus students who transfer out, emigrate, or die during school years 1, 2, 3, and 4. Years presented are the final year of a school year (e.g., 2011-2012 is shown as 2012).
Math and Science ScoresData are from the California Department of Education, California Standards Tests (CST) Research Files for San Mateo and Santa Clara Counties, and California. In 2003, the CST replaced the Stanford Achievement Test, ninth edition (SAT/9). The CSTs in English–language arts, mathematics, science, and history–social science were administered only to students in California public schools. Except for a writing component that was administered as part of the grade four and grade seven English–language arts tests, all questions were multiple-choice. These tests were developed specifically to assess students’ knowledge of the California content standards. The State Board of Education adopted these standards, which specify what all children in California are expected to know and be able to do in each grade or course. Through the 2012-13 school year, the Algebra I CSTs were required for students who were enrolled in the grade/course at the time of testing or who had completed a course during the school year, including during the previous summer. In order to protect student confidentiality, no scores were reported in the CST research files for any group of ten or fewer students. The following types of scores are reported by grade level and content area for each school, district, county, and the state: % Advanced, % Proficient, % Basic, % Below Basic, and % Far Below Basic, and are rounded to the nearest ones place. On July 1, 2014, the Standardized Testing and Reporting (STAR) Program was replaced by CAASPP, the California Assessment of Student Performance and Progress. The CAASP, test includes Smarter Balanced Summative Assessments for English–language arts (ELA) and mathematics in grades 3 through 8 and grade 11, and scores are not reported. It does include Science assessments in grades 5, 8, and 10, which are reported here. Science assessments include the CAASPP science test results for students in eighth grade from the CST test only, not CAPA for science (which is for students with significant cognitive disabilities who are unable to take the CSTs even with accessibility supports and whose IEP indicates assessment with CAPA).
APPENDIX B
82
and Santa Clara Counties. Population data is from United States Census Bureau, 2007-2013 American Community Surveys, 1-Year Estimates. Felony offenses include Violent, Property Offenses, Drug Offenses, Sex Offenses, Weapons, Driving Under the Influence, Hit and Run, Escape, Bookmaking, Manslaughter Vehicular, and Other Felonies.
Public Safety Officers; Percent Change in Silicon Valley Public Safety OfficersAll data are from the California Commission on Peace Officer Standards and Training. The total number of Public Safety Officers accounts for all sworn full-time and reserve personnel, which may include (but is not limited to) Police Chiefs, Deputy Chiefs, Commanders, Corporals, Lieutenants, Sergeants, Police Officers, Detectives, Detention Officers/Supervisors, Sheriffs, Undersheriffs, Captains, and Assistant Sheriffs; it does not include Community Service Officers or other non-sworn (civilian) police department personnel. All city, county and school district departments in Silicon Valley are included. Data does not include California Highway Patrol officers. 2013 data was as of July 8, 2013. 2014 data was as of July 1, 2014.
standards changed for the Body Mass Index (BMI), one of the three body composition test options. The changes were made to better align with the well–established, health–related body fat standards from the Centers for Disease Control and Prevention (CDC). As a result, Body Composition scores from previous years should not be compared to 2013-14 Body Composition scores.
SAFETY
Violent Crimes; Breakdown of Violent CrimesData is from the California Department of Justice, Office of the Attorney General, Interactive Crime Statistics. Violent Crimes include homicide, forcible rape, robbery and aggravated assault. Data for Silicon Valley includes San Mateo and Santa Clara Counties. Population data is from the California Department of Finance’s “E-4 Population Estimates for Cities, Counties, and the State, 2011–2014, with 2010 Census Benchmark,” and “E-4 Population Estimates for Cities, Counties, and the State, 2001–2010, with 2000 & 2010 Census Counts.”
Felony OffensesData is from the California Department of Justice, Office of the Attorney General, Interactive Crime Statistics. Data for Silicon Valley includes San Mateo
SOCIETY continued
APPENDIX B
ENVIRONMENT
Water ResourcesData for Santa Clara County was provided by Santa Clara Valley Water District (SCVWD). Scotts Valley Water District (SVWD) provided Scotts Valley data. Bay Area Water Supply & Conservation Agency (BAWSCA) provided data for member agencies servicing San Mateo County and for Alameda County Water District, which services the Cities of Fremont, Union City and Newark. These agencies include Brisbane/GVMID, Estero, Burlingame, Hillsborough, CWS - Bear Gulch, Menlo Park, CWS - Mid Peninsula, Mid-Peninsula, CWS - South SF, Millbrae, Coastside, North Coast, Redwood City, Daly City, San Bruno, East Palo Alto, and Westborough. Cordilleras serves residents in San Mateo County, but is not a BAWSCA member and therefore was not included in this analysis. BAWSCA FY 2013-14 data is preliminary. Recycled Water Consumption Data is from the BAWSCA Water Conservation Database. Data for the population served used to compute per capita values does not include unincorporated areas of Santa Clara County. FY 2000-01 through FY 2011-12 BAWSCA service area populations are from Table 6 of the BAWSCA Annual Survey FY 2011-12 (p. 49). The FY 2-13-14 BAWSCA population figure for San Mateo County is preliminary. Data for SCVWD population served used to compute per capita values are from the California Department of Finance, E-1 Population Estimates as of January 1. The Scotts Valley Water District population figure for FY 2000 is based on the AMBAG GIS-based analysis of 2000 census block population data; the 2010 population figure is based on the 2010 census block population data, and population estimates for the years in between, as well as 2011-2014, are derived from a linear interpolation. Total water consumption figures used to
calculate per capita values do not include consumption for agriculture or by pri-vate well-owners in the SCVWD data. In the BAWSCA data, the small number of agricultural users in the service area are treated as a class of commercial user and so are included in the consumption figures. Scotts Valley Water District does not serve agricultural customers, so total water consumption figures used to compute both the per capita consumption and the recycled percentage of total water used are the same. The total water consumption figures used to calculate the recycled percentage of total water used do include consumption by agricul-ture and private well-owners for SCVWD data.
Electricity Productivity and Consumption per CapitaElectricity Consumption data is from the California Energy Commission. Gross Domestic Product (GDP) data is from Moody’s Economy.com. GDP values have been inflation-adjusted and are reported in 2013 dollars, using the Bay Area con-sumer price index for all urban consumers from the Bureau of Labor Statistics for the Silicon Valley and San Francisco data, and the California consumer price index for all urban consumers from the California Department of Finance for California data. Silicon Valley data includes Santa Clara and San Mateo Counties. Per capita values were computed from the California Department of Finance’s “E-4 Population Estimates for Cities, Counties, and the State, 2011–2013, with 2010 Census Benchmark,” “E-4 Revised Historical City, County and State Population Estimates, 1991-2000, with 1990 and 2000 Census Counts,” and “E-4 Population Estimates for Cities, Counties, and the State, 2001–2010, with 2000 & 2010 Census Counts.”
PLACE
83
Solar InstallationsData are from Palo Alto Municipal Utilities, Silicon Valley Power, and Pacific Gas & Electric, and include the entire city-defined Silicon Valley region. Years listed correspond to when the systems were interconnected. Cumulative installed solar capacity does not include installations prior to 1999. Non-Residential includes Commercial, Government, Non-Profit, Agricultural, and Utility installations. All systems included in the analysis are Net Energy Metered and Non-Export PV. Data for PG&E “utility” installations less than 100 kW are not made publicly available through the California Energy Commission, and therefore may be missing from the dataset. PG&E data reflects interconnections under Rule 21 (to PG&E’s Distribution Grid) through October 31, 2014 (http://www.cpuc.ca.gov/PUC/energy/Procurement/LTPP/rule21.htm).
Electric Vehicle Charging StationsData are from the U.S. Department of Energy, and include public electric vehicle fueling stations and outlets in Santa Clara and San Mateo Counties, as of November 14, 2014.
TRANSPORTATION
Vehicle Miles Traveled per Capita and Gas PricesVehicle Miles Traveled (VMT) estimates the number of vehicle miles that motorists traveled on California State Highways using a sampling of up to 20 traffic monitoring sites. Various roadway types are used to calculate VMT. Silicon Valley data include travel within Santa Clara and San Mateo Counties. The California Department of Finance’s “E-4 Population Estimates for Cities, Counties, and the State, 2011–2013, with 2010 Census Benchmark” and “E-4 Population Estimates for Cities, Counties, and the State, 2001–2010, with 2000 & 2010 Census Counts” were used to compute per-capita values. Gas prices, from the California Energy Almanac (average annual regular retail prices) for 1995-2012 and from the U.S. Energy Information Administration for 2013, have been inflation-adjusted and are reported in 2014 dollars, using the Bay Area con-sumer price index for all urban consumers from the Bureau of Labor Statistics, 2014 estimate.
Means of CommuteData on the means of commute to work are from the United States Census Bureau, 2003 and 2013 American Community Surveys, 1-Year Estimates. Data are for workers 16 years old and over residing in Santa Clara and San Mateo Counties commuting to the geographic location at which workers carried out their occupational activities during the reference week whether or not the loca-tion was inside or outside the county limits. The data on employment status and journey to work relate to the reference week; that is, the calendar week preced-ing the date on which the respondents completed their questionnaires or were interviewed. This week is not the same for all respondents since the interviewing was conducted over a 12-month period. The occurrence of holidays during the relative reference week could affect the data on actual hours worked during the reference week, but probably had no effect on overall measurement of employ-ment status. People who used different means of transportation on different days of the week were asked to specify the one they used most often, that is, the
greatest number of days. People who used more than one means of transporta-tion to get to work each day were asked to report the one used for the longest distance during the work trip. The categories, “Drove Alone” and “Carpool” include workers using a car (including company cars but excluding taxicabs), a truck of one-ton capacity or less, or a van. The category, “Public transportation,” includes workers who used a bus or trolley bus, streetcar or trolley car, subway or elevated, railroad, or ferryboat, even if each mode is not shown separately in the tabulation. The category “Other Means” includes taxicab, motorcycle, bicycle, walking, working from home and other means that are not identified separately within the data distribution.
Commute Patterns; Percent Change in the Number of Residents who Commute to Another County Within the RegionData for Commute Patterns is from the U.S. Census Bureau, 2011, 2012, and 2013 American Community Survey, 1-Year Public Use Microdata Samples (PUMS). Data includes the Place of Work PUMA for San Francisco, San Mateo, Santa Clara and Alameda Counties.
Transit Use; Change in Per Capita Transit Use, 2010-2014Estimates are the sum of annual ridership on the light rail and bus systems in Santa Clara and San Mateo Counties, and rides on Caltrain. Data are provided by Sam Trans, Santa Clara Valley Transportation Authority, Altamont Corridor Express, and Caltrain. Data does not include paratransit, such as SamTrans’ Redi-Wheels program. The California Department of Finance’s “E-4 Population Estimates for Cities, Counties, and the State, 2011–2014, with 2010 Census Benchmark” and “E-4 Population Estimates for Cities, Counties, and the State, 2001–2010, with 2000 & 2010 Census Counts” were used to compute per-capita values.
LAND USE
Residential DensityData are from Joint Venture Silicon Valley’s annual land-use survey of all cities within Silicon Valley. Cities included in the Residential Density analysis include: Brisbane, Burlingame, Foster City, Fremont, Gilroy, Los Altos Hills, Milpitas, Morgan Hill, Mountain View, Newark, Pacifica, Palo Alto, Redwood City, San Carlos, San Jose, San Mateo, Santa Clara, South San Francisco, and Sunnyvale. Most recent data are for fiscal year 2014 ( July 2013-June 2014). The average units per acre of newly approved residential development were reported directly for each of the cities and counties participating in the survey through FY 2012-13. Beginning in FY 2013-14, residential density was calculated using the reported total number of residential units approved and corresponding acreage.
Housing Near Transit; Non-Residential DevelopmentData are from Joint Venture Silicon Valley’s annual land-use survey of all cities within Silicon Valley. Cities participating in the Housing Near Transit portion of the survey included: Belmont, Burlingame, Fremont, Gilroy, Hillsborough, Millbrae, Milpitas, Morgan Hill, Mountain View, Newark, Palo Alto, Redwood City, San Carlos, San Jose, San Mateo, Santa Clara, Santa Clara County,
PLACE continued
APPENDIX B

84
Saratoga, Scotts Valley, South San Francisco, Sunnyvale, Union City. Only cities containing rail stations or major bus corridors were included in the analysis. Most recent data are for fiscal year 2014 ( July 2013-June 2014). The number of new housing units and the square feet of commercial development within one-third mile of transit are reported directly for each of the cities and counties participating in the survey. Places with one-third mile of transit are considered “walkable” (i.e., within a 5- to 10-minute walk for the average person). Transit oriented data prior to 2012 is reported within one-quarter mile of transit.
HOUSING
Trends in Home SalesData are from Zillow Real Estate Research. Average Home Sale Prices are esti-mates based on San Mateo and Santa Clara County median sale prices and total number of homes sold. Annual estimates for Silicon Valley and California are derived from monthly median sale prices. California data for number of homes sold is based on the 29 of 58 California counties for which Zillow has published data. Beginning with the June 2008 data, Zillow changed its methodology for calculating the number of homes sold. Estimates have been inflation-adjusted and are reported in 2014 dollars, using the Bay Area consumer price index for all urban consumers from the Bureau of Labor Statistics, 2014 estimate for the Silicon Valley data, and the California consumer price index for all urban consumers from the California Department of Finance May Revision Forecast (April 2014) for California data. Data are for single family residences, condos/co-ops, and is based on the closing date recorded on the county deed. All standard real estate transactions are included, including REO sales and auctions. Annual median sale prices and forecasted annual home sales for 2014 are based on monthly data through October.
Residential BuildingData is from the Construction Industry Research Board and California Homebuilding Foundation, and includes Santa Clara and San Mateo Counties. Data includes the number of single family and multi-family units included in building permits issued between 1998 and November 2014.
Building Affordable HousingData are from Joint Venture Silicon Valley’s annual land-use survey of all cities within Silicon Valley. There were 28 cities that participated in the afford-able housing portion of the FY 2013-14 survey. Participating cities included: Belmont, Brisbane, Burlingame, East Palo Alto, Foster City, Fremont, Gilroy, Hillsborough, Los Altos Hills, Los Gatos, Millbrae, Milpitas, Morgan Hill, Mountain View, Newark, Pacifica, Palo Alto, Portola Valley, Redwood City, San Carlos, San Jose, San Mateo, Santa Clara, Santa Clara County, Saratoga, Scotts Valley, Sunnyvale, and Union City. Most recent data are for fiscal year 2014 ( July 2013-June 2014). Affordable units are those units that are affordable for a four-person family earning up to 80 percent of the median income for a county. Cities use the U.S. Department of Housing and Urban Development’s (HUD) estimates of median income to calculate the number of units affordable to low-income households in their jurisdiction.
Rental AffordabilityData on average rental rates are from RealFacts survey of all apartment com-plexes in San Mateo and Santa Clara Counties of 50 or more units. Rates are the prices charged to new residents when apartments turn over. They have been inflation-adjusted and are reported in 2014 dollars, using the Bay Area consumer price index for all urban consumers from the Bureau of Labor Statistics, 2014 estimate for the Silicon Valley and San Francisco data, the California consumer price index for all urban consumers from the California Department of Finance May Revision Forecast (April 2014) for California data, and the U.S. city aver-age consumer price index for all urban consumers from the Bureau of Labor Statistics for U.S. data. Median household income is estimated using data from the United States Census Bureau, American Community Survey, 1-year esti-mates and population estimates from the California Department of Finance.
Percent of Households with Housing Costs Greater than 35% of IncomeData for owners’ and renters’ housing costs are from the United States Census Bureau, 2002-2013 American Community Survey 1-Year Estimates. This indica-tor measures the share of owners and renters spending 35% or more of their monthly household income on housing costs. Renter data are calculated percent-ages of gross rent to household income in the past 12 months. Owner data are calculated percentages of selected monthly owner costs to household income in the past 12 months. Owners’ data are solely based on housing units with a mort-gage. According to the U.S. Department of Housing and Urban Development, housing costs greater than 30% of household income pose moderate to severe financial burdens.
Home AffordabilityData are from the California Association of Realtors’ (CAR) First-time Buyer Housing Affordability Index, which measures the percentage of households that can afford to purchase an entry-level home in California based on the median price of existing single family homes sold from CAR’s monthly existing home sales survey. Beginning in the first quarter of 2009, the Housing Affordability Index incorporates an effective interest rate that is based on the one-year, adjustable-rate mortgage from Freddie Mac’s Primary Mortgage Market Survey.
Young Adults Living With a ParentData for Silicon Valley includes Santa Clara and San Mateo Counties, and was retrieved from the special edition of the U.S. Census Bureau Census Explorer, “Young Adults Then & Now”. The data comes from the 1980, 1990, and 2000 Census Long Form and the 2009-2013 American Community Survey (ACS), 5-Year Estimates.
PLACE continued
APPENDIX B

85
CITY FINANCES
City Finances Data were obtained from 39 Silicon Valley cities’ audited annual financial reports, including Comprehensive Annual Financial Reports, Annual Financial Statements for the Year End, Annual Financial Reports, Basic Financial Statements Reports, and Annual Basic Financial Statements Reports, as well as the State of California annual year-end financial report from the California State Auditor. Data for City Finances include both Government and Business-Type Activities (where applicable). Whenever possible, data were obtained from the following year report (e.g., the 2010 report for 2009 figures) because following year reports sometimes reflects revisions/corrections. 2013 data was obtained from the Fiscal Year 2012-2013 reports. All amounts have been inflation-adjusted and are reported in 2013 dollars, using the Bay Area consumer price index for all urban consumers from the Bureau of Labor Statistics, 2014 estimate for the Silicon Valley data, and the California consumer price index for all urban consumers from the California Department of Finance May Revision Forecast (April 2014) for California data. Values are significant to the nearest $1 million due to rounding in the city and state reports. Revenues Minus Expenses is reported before Transfers or Extraordinary Items. Other Revenues includes any revenue other than Property Tax, Sales Tax, Investment Earnings, or Charges for Services. Other Revenues includes the following (as categorized by the various cities in Silicon Valley): Incremental Property Taxes; Public Safety Sales Tax; Business tax; Municipal Water System Revenue; Waste Water Treatment Revenue; Storm Drain Revenue; Transient occupancy tax Business, Hotel & Other Taxes; Property transfer tax; Property Taxes In-Lieu; Vehicle license in-lieu fees or Motor Vehicle In-Lieu; Licenses & Permits; Utility Users Tax; Development impact fees; Franchise fees; Franchise Taxes Franchise & Business Taxes; Rents & Royalties; Net Increase (decrease) in Fair Value of Investments; Equity in Income (losses) of Joint Ventures; Miscellaneous or Other Revenues; Cardroom Taxes; Fines and Forfeitures; Other Taxes; Agency Revenues; Interest Accrued from Advances to Business-Type Activities; Use of Money and Property; Property Transfer Taxes; Documentary Transfer Tax; Unrestricted/Intergovernmental Contributions in Lieu of Taxes; Gain (loss) of disposal of assets.
CIVIC ENGAGEMENT
Partisan Affiliation; Voter ParticipationData are from the California Secretary of State, Elections and Voter Information Division. The eligible population is determined by the Secretary of State using Census population data provided by the California Department of Finance. Other includes Green, Libertarian, Natural Law, Peace & Freedom/Reform, and Other. The population eligible to vote is determined by the Secretary of State using Census population data provided by the California Department of Finance. Data are for Santa Clara and San Mateo counties.
GOVERNANCE
APPENDIX B

86
This report was prepared by Rachel Massaro, Vice President and Sr. Research Associate at Joint Venture Silicon Valley and the Silicon Valley Institute for Regional Studies. She received invaluable assistance from Stephen Levy of the Center for Continuing Study of the California Economy, who provided ongoing support and served as a senior advisor.
Jill Jennings created the report’s layout and design; Duffy Jennings served as copy editor.
We gratefully acknowledge the following individuals and organizations that contributed data and expertise:
Altamont Corridor Express
Bay Area Water Supply & Conservation Agency
BW Research Partnership Inc.
California Association of Realtors
California Commission on Peace Officer Standards and Training
California Energy Commission
California Homebuilding Foundation
Caltrain
CB Insights
Cities of Silicon Valley
Cleantech Group™, Inc.
Collaborative Economics
Colliers International
Construction Industry Research Board
FactSet Research Systems, Inc.
Jon Haveman, Marin Economic Consulting
Kidsdata.org
Pacific Gas & Electric
Palo Alto Municipal Utilities
Pricewaterhouse Coopers MoneyTreeTM
RealFacts
SamTrans
Santa Clara Valley Water District
Santa Clara Valley Transportation Authority
Scotts Valley Water District
Silicon Valley Power
Steve Ross
Renaissance Capital
ACKNOWLEDGMENTS

87
This report was made possible through the generous support of Silicon Valley Community Foundation. Additional support was provided by Bank of America.

JOINT VENTURE SILICON VALLEY
Established in 1993, Joint Venture Silicon Valley provides analysis and action on issues affecting our region’s economy and quality of life. The organization brings together established and emerging leaders – from business, government, academia, labor and the broader community – to spotlight issues, launch projects, and work toward innovative solutions. For more information, visit www.jointventure.org.
SILICON VALLEY INSTITUTE FOR REGIONAL STUDIES
Housed within Joint Venture Silicon Valley, the Silicon Valley Institute for Regional Studies provides research and analysis on Silicon Valley’s economy and society.
Copyright © 2015 Joint Venture Silicon Valley, Inc. All rights reserved. Printed in the USA on recycled paper.
SILICON VALLEY INSTITUTE for REGIONAL STUDIES
S I L I C O N V A L L E Y
100 West San Fernando Street, Suite 310 San Jose, California 95113
P: (408) 298-9330 | F: (408) [email protected] | www.jointventure.org
JOINT VENTURE SILICON VALLEY
Established in 1993, Joint Venture Silicon Valley provides analysis and action on issues affecting our region’s economy and quality of life. The organization brings together established and emerging leaders – from business, government, academia, labor and the broader community – to spotlight issues, launch projects, and work toward innovative solutions. For more information, visit www.jointventure.org.
SILICON VALLEY INSTITUTE FOR REGIONAL STUDIES
Housed within Joint Venture Silicon Valley, the Silicon Valley Institute for Regional Studies provides research and analysis on Silicon Valley’s economy and society.