silicon valley venture capital survey – second quarter ......silicon valley venture capital survey...
TRANSCRIPT

Silicon Valley Venture Capital Survey Second Quarter 2018
Full Analysis
fenwick & west

SILICON VALLEY VENTURE CAPITAL SURVEY SECOND QUARTER 2018 1
fenwick & west
Silicon Valley Venture Capital SurveySecond Quarter 2018
Full Analysis
Cynthia Clarfield Hess, Mark Leahy and Khang Tran
Background
We analyzed the terms of 225 venture financings closed in the second quarter of 2018 by
companies headquartered in Silicon Valley.
Overview of Fenwick & West Results
Valuation results continued to be strong in Q2 2018, but declined moderately compared to the
prior quarter.
� Up rounds exceeded down rounds 78% to 12%, with 10% flat in Q2 2018, an increase from Q1
when up rounds exceeded down rounds 75% to 15%, with 10% flat.
� The Fenwick & West Venture Capital Barometer™ showed an average price increase in Q2 2018
of 70%, a moderate decrease from the 74% recorded in the prior quarter, and the first quarter in
which the average price increase had declined compared to the prior quarter since Q4 2016.
� The median price increase of financings in Q2 2018 was 37%, a decrease from the 41%
recorded in Q1.
� Series B financings recorded the strongest valuation results in Q2 2018, with an average price
increase of 117%, an increase from 92% in Q1, and a median price increase of 66%, an increase
from 49% in Q1. Series C financings recorded the weakest valuation results in the quarter and
the greatest declines, with the average price increase declining from 81% in Q1 to 36% in Q2
and the median price increase declining from 53% in Q1 to 22% in Q2.
� The software industry recorded the strongest valuation results in Q2 2018, with an average
price increase of 85% and a median price increase of 46%, both moderately higher compared
to the prior quarter. The valuation results for the internet/digital media industry, while still strong
in comparison to the other industries, recorded the greatest declines in the quarter, with the
average price increase declining from 101% in Q1 to 61% in Q2 and the median price increase
declining from 59% in Q1 to 25% in Q2.
Overview of Other Industry Data
The U.S. venture environment remained strong in the second quarter of 2018 with the amount of
capital invested in the quarter down only moderately from the over 10 year high recorded in the

SILICON VALLEY VENTURE CAPITAL SURVEY SECOND QUARTER 2018 2
prior quarter. Deal activity in the quarter continued the downward trend observed over the past
several years.
� Both the pace of investments and the amount of capital invested decreased moderately from
Q1 2018 to Q2 2018.
� U.S. venture deals continued to grow in size, especially in later rounds where the median
amount invested increased significantly in Q2 compared to the prior quarter.
� The Internet sector continued to receive the greatest share of investments, followed by the
healthcare sector and the mobile and telecommunications sector.
� San Francisco (North Bay Area) again took in the largest share of investments in Q2, although
the area’s share declined moderately compared to the prior quarter.
� The number of U.S. venture-backed IPOs in Q2 was up significantly from the prior quarter and
was the most in a quarter since Q1 2014, and the aggregate amount raised in these IPOs was
the highest amount in a quarter in over 10 years.
� The number of acquisitions of U.S. venture-backed companies and the value of these deals
increased significantly in Q2 to the highest levels in over 10 years.
� After a relatively slow start to the year, venture capital fundraising in terms of both fund count
and capital raised are now on pace to surpass 2017 levels.
Venture Capital Investment
U.S. venture capital investment deal flow in Q2 2018 decreased moderately compared to both the
prior quarter and the year ago period and remained significantly below the peak levels of 2015.
The total dollar value of financings in Q2 was also moderately lower than in Q1, during which
the greatest amount of capital was deployed in a quarter since 2000, but substantially higher
compared to the year ago period.
A summary of results published by three leading providers of venture data is below:
Comparison between Q2 2018 and Q1 2018:
Q2 2018
Q1 2018
($Billions) Difference %
Q2 2018
Deals
Q1 2018
Deals Difference %
VentureSource1 $27.1 $26.1 4% 1,426 1,422 0%
PitchBook-NVCA2 $27.3 $30.2 -10% 1,859 2,138 -13%
MoneyTree3 $23.0 $22.4 2% 1,416 1,297 9%
Average $25.8 $26.3 -2% 1,567 1,619 -3%
1 Dow Jones VentureSource (“VentureSource”)
2 PitchBook-NVCA Venture Monitor (“PitchBook-NVCA”)
3 PwC/CB Insights MoneyTree™ Report (“MoneyTree”)

SILICON VALLEY VENTURE CAPITAL SURVEY SECOND QUARTER 2018 3
Comparison between Q2 2018 and Q2 2017:
Q2 2018
Q2 2017
($Billions) Difference %
Q2 2018
Deals
Q2 2017
Deals Difference %
VentureSource $27.1 $21.3 27% 1,426 1,395 2.2%
PitchBook-NVCA $27.3 $20.9 31% 1,859 2,256 -18%
MoneyTree $23.0 $19.2 20% 1,416 1,336 6%
Average $25.8 $20.5 26% 1,567 1,662 -6%
U.S. venture deals continued to grow in size, with an increasing concentration of investment dollars
into a fewer number of companies. According to VentureSource, the median amount invested per
financing round by venture capitalists or venture capital-type investors (i.e., those making equity
investments in early-stage companies from a fund with multiple limited partners) was $10.0 million
in Q2 2018, up from $8.0 million in Q1 2018. While this trend was evident across all rounds, later
rounds again recorded the greatest increase, with the median amount invested having increased
from $16.8 million in Q1 to $24.0 million in Q2. Meanwhile, seed and first rounds recorded only
moderate increases in median deal size in Q2 compared to Q1.
According to MoneyTree, there were 45 mega-rounds (financings that raised $100 million or more),
breaking the prior record of 36 mega-rounds set in Q3 2015. However, mega-rounds represented
only 34% of the quarterly funding amount in Q2 2018, the second consecutive quarter of decline
and the lowest percentage since Q1 2017. In addition, six new VC-backed companies reached
unicorn status (private companies with a valuation of at least $1 billion) during Q2.
According to MoneyTree, seed/angel, expansion stage (Series B) and later stage (Series D and
E+) investment deal allocations (i.e., allocation by number of deals) were unchanged in Q2 2018
compared to Q1 2018, while early stage (Series A) investment deal allocation declined slightly from
25% in Q1 to 24% in Q2. Continuing the trend of the past several years, later stage investments
represented the lowest deal share at 11% in Q2, but the highest share of the invested capital
at 38% in Q2, which was unchanged from Q1. Meanwhile, seed stage investments recorded a
slight decline in invested capital allocation from 4% in Q1 to 3% in Q2, while expansion stage
investments recorded a slight increase in invested capital allocation from 32% in Q1 to 33% in Q2.
The Internet sector continued to receive the greatest share of investments in Q2 2018 according to
MoneyTree, comprising 43% of the total number of deals, down moderately from 46% in Q1 2018,
and 39% of the aggregate invested capital, up from 36% in Q1. The healthcare sector saw the
second highest level of investment activity in the quarter at 15% of the total deal count and 23% of
the total invested capital, followed by the mobile and telecommunications sector at 12% of the total
deal count and 15% of the invested capital.
Regionally, San Francisco (North Bay Area) continued to take in the largest share of investments
in Q2 2018 at 25% of the aggregate invested capital, down from 29% in the prior quarter, and 19%
of the total number of deals, down slightly from 20% in the prior quarter, according to MoneyTree.
Investments into New York Metro area-based companies in Q2 represented the second highest
deal share at 14%, but only the fourth highest share of the invested capital at 12%. Investments into
companies based in the Silicon Valley (South Bay Area) in Q2 represented the third highest deal

SILICON VALLEY VENTURE CAPITAL SURVEY SECOND QUARTER 2018 4
share at 12%, down slightly from 13% in Q1, and the second highest share of the invested capital
at 17%, unchanged from Q1. The New England area recorded a slight decline in deal share in Q2;
however, the invested capital allocation increased from 12% in Q1, which was the fourth highest
share of the invested capital in Q1, to 13% in Q2, which was the third highest share of the invested
capital in Q2.
IPO Activity
Initial public offerings continued to be a bright spot in the exit market. According to VentureSource,
there were 31 U.S. venture-backed IPOs in Q2 2018, up significantly from the 15 IPOs in Q1 2018
and the highest number of U.S. venture-backed IPOs in a quarter since Q1 2014. The aggregate
amount raised in the IPOs in the quarter was $4.8 billion, the highest amount in a quarter in over
10 years. The healthcare industry again made up a majority of the IPO count with 20 IPOs in Q2,
up from nine in Q1, while the aggregate amount raised in these IPOs increased from $823.9 million
in Q1 to $2.1 billion in Q2. Meanwhile, the IT industry saw a decline in IPO activity, with the number
of IPOs of IT companies declining from four in Q1 to three in Q2 and the aggregate amount raised
declining from $778.4 million in Q1 to $469.2 million in Q2.
The median time from initial equity funding to IPO decreased from 5.1 years in Q1 2018 to 4.5
years in Q2 2018, primarily as a result of the increase in the number of IPOs of relatively less
established healthcare companies over the past several years. In contrast, the median time to IPO
for IT companies has increased over the past several years from 7.9 years in 2013 to 12.5 years in
2018, with highly-valued VC-backed IT companies continuing to raise further rounds and grow in
the private market. Consistent with this trend, the median pre-IPO valuation increased from $319
million in Q1 to $473 million in Q2 and the median equity amount raised prior to IPO increased
from $102 million in Q1 to $150 million in Q2.
Merger and Acquisition Activity
U.S. M&A activity was robust in Q2 2018, with 173 deals valued at an aggregate of $36.7 billion,
according to VentureSource, the highest deal volume and aggregate deal value in over 10 years.
The median deal value, on the other hand, decreased from $125.0 million in Q1 to $119.0 million in
Q2.
The IT industry again led in terms of M&A deal count with 64 deals in Q2 2018, up slightly from
63 deals in Q1 2018, followed by the business and financial services industry, which recorded
the greatest increase from 40 deals in Q1 to 49 deals in Q2. Meanwhile, the consumer services
industry recorded only a moderate increase in deal count, but the aggregate value of these deals
increased substantially from $2.2 billion in Q1 to $11.2 billion in Q2, which was second only to the
business and financial services industry’s $12.9 billion in aggregate M&A deal value in Q2.
In contrast to the decline in median deal value, VentureSource reported a slight increase in the
median time from initial equity funding to acquisition from 5.2 years in Q1 2018 to 5.4 years in Q2
2018. Similarly, the median equity amount raised prior to acquisition increased from $15.2 million in
Q1 to $16.3 million in Q2.

SILICON VALLEY VENTURE CAPITAL SURVEY SECOND QUARTER 2018 5
Venture Capital Fundraising
According to PitchBook-NVCA, venture capitalist firms raised $10.8 billion across 72 funds in Q2
2018, an uptick in activity from Q1 2018. Both fund count and capital raised are now on pace to
surpass 2017 levels. Median fund size has been increasing over the past few years to $65.0 million
in the first half of 2018, which is a 10-year high. This increase in fund size has been primarily driven
by the increase in funds in the $100 million to $500 million range. In contrast, after a strong start
to the year, fundraising for microfunds (fund size of less than $50 million) has declined in 2018.
Another trend is the continuing decrease in mega-funds (fund size of more than $1 billion) raised,
though there is optimism that this trend will reverse in the second half of the year with the potential
closings of seven open mega-funds.

SILICON VALLEY VENTURE CAPITAL SURVEY SECOND QUARTER 2018 6
Fenwick & West Data on Valuation
PRICE CHANGE — The direction of price changes for companies receiving financing in a quarter,
compared to their prior round of financing.
The percentage of DOWN ROUNDS by series were as follows:
0%
10%
20%
30%
40%
50%
60%
70%
80%
Q3’16 Q4’16 Q1’17 Q2’17 Q3’17 Q4’17 Q1’18 Q2’18
UpDownFlat
12%
78%
10%
0%
5%
10%
15%
20%
25%
30%
35%
40%
Q3’16 Q4’16 Q1’17 Q2’17 Q3’17 Q4’17 Q1’18 Q2’18
BCDE and higher
19%
10%
7%
13%

SILICON VALLEY VENTURE CAPITAL SURVEY SECOND QUARTER 2018 7
EXPANDED PRICE CHANGE GRAPH — Set forth below is the direction of price changes for each
quarter since 2004.
0%
10%
20%
30%
40%
50%
60%
70%
80%
90%
Up RoundsDown RoundsFlat Rounds
10%12%
78%
Average percentage of Up Rounds 67%
Q1’04
Q1’05
Q1’06
Q1’07
Q1’08
Q1’09
Q1’10
Q1’11
Q1’12
Q1’13
Q1’14
Q1’15
Q1’16
Q1’17
Q1’18

SILICON VALLEY VENTURE CAPITAL SURVEY SECOND QUARTER 2018 8
THE FENWICK & WEST VENTURE CAPITAL BAROMETER™ (magnitude of price change) — Set
forth below is the average percentage change between the price per share at which companies
raised funds in a quarter, compared to the price per share at which such companies raised funds
in their prior round of financing. In calculating the average, all rounds (up, down and flat) are
included, and results are not weighted for the amount raised in a financing.
The Barometer results by series are as follows:
0%
10%
20%
30%
40%
50%
60%
70%
80%
90%
Q3’16 Q4’16 Q1’17 Q2’17 Q3’17 Q4’17 Q1’18 Q2’18
70%
-5%
5%
15%
25%
35%
45%
55%
65%
75%
85%
95%
105%
115%
125%
Q3’16 Q4’16 Q1’17 Q2’17 Q3’17 Q4’17 Q1’18 Q2’18
BCDE and higher
117%
36%
64%
49%

SILICON VALLEY VENTURE CAPITAL SURVEY SECOND QUARTER 2018 9
EXPANDED BAROMETER GRAPH — Set forth below is the average percentage price change for
each quarter since we began calculating this metric in 2004.
-10%
0%
10%
20%
30%
40%
50%
60%
70%
80%
90%
100%
110%
120%
Average 57%
70%
Q1’04
Q1’05
Q1’06
Q1’07
Q1’08
Q1’09
Q1’10
Q1’11
Q1’12
Q1’13
Q1’14
Q1’15
Q1’16
Q1’17
Q1’18

SILICON VALLEY VENTURE CAPITAL SURVEY SECOND QUARTER 2018 10
MEDIAN PERCENTAGE PRICE CHANGE — Set forth below is the median percentage change between the price per share at which companies raised funds in a quarter, compared to the price per share at which such companies raised funds in their prior round of financing. In calculating the median, all rounds (up, down and flat) are included, and results are not weighted for the amount raised in the financing. Please note that this is different than the Barometer, which is based on average percentage price change.
MEDIAN PERCENTAGE PRICE CHANGE BY SERIES.
0%
10%
20%
30%
40%
50%
Q3’16 Q4’16 Q1’17 Q2’17 Q3’17 Q4’17 Q1’18 Q2’18
37%
0%
10%
20%
30%
40%
50%
60%
70%
Q3’16 Q4’16 Q1’17 Q2’17 Q3’17 Q4’17 Q1’18 Q2’18
BCDE and higher
66%
22%
32%34%

SILICON VALLEY VENTURE CAPITAL SURVEY SECOND QUARTER 2018 11
EXPANDED MEDIAN PRICE CHANGE GRAPH — Set forth below is the median percentage price
change for each quarter since we began calculating this metric in 2004.
0%
10%
20%
30%
40%
50%
60%
70%
80%
Average 29%
37%
Q1’04
Q1’05
Q1’06
Q1’07
Q1’08
Q1’09
Q1’10
Q1’11
Q1’12
Q1’13
Q1’14
Q1’15
Q1’16
Q1’17
Q1’18

SILICON VALLEY VENTURE CAPITAL SURVEY SECOND QUARTER 2018 12
RESULTS BY INDUSTRY FOR DIRECTION OF PRICE CHANGES AND AVERAGE AND MEDIAN
PRICE CHANGES — The table below sets forth the direction of price changes, and average and
median price change results for companies receiving financing in this quarter, compared to their
previous round, by industry group. Companies receiving Series A financings are excluded as they
have no previous rounds to compare.
Industry
Up
Rounds
Down
Rounds
Flat
Rounds
Average
Price Change
Median
Price Change
Number of
Financings
Software 78% 14% 9% 75% 46% 81
Hardware 81% 5% 14% 59% 27% 21
Life Science 73% 10% 17% 63% 19% 30
Internet/Digital Media 74% 16% 11% 61% 25% 19
Other 84% 16% 0% 81% 53% 19
Total all Industries 78% 12% 10% 70% 37% 170
DOWN ROUND RESULTS BY INDUSTRY — The table below sets forth the percentage of “down
rounds,” by industry groups, for each of the past eight quarters.
Down Rounds Q3’16 Q4’16 Q1’17 Q2’17 Q3’17 Q4’17 Q1’18 Q2’18
Software 14% 13% 20% 14% 10% 18% 16% 14%
Hardware 8% 18% 18% 17% 8% 28% 10% 5%
Life Science 18% 13% 17% 16% 9% 21% 16% 10%
Internet/Digital Media 20% 15% 24% 11% 8% 14% 17% 16%
Other 0% 17% 0% 8% 15% 13% 0% 16%
Total all Industries 14% 14% 18% 13% 10% 19% 15% 12%

SILICON VALLEY VENTURE CAPITAL SURVEY SECOND QUARTER 2018 13
BAROMETER RESULTS BY INDUSTRY — The table below sets forth Barometer results by industry
group for each of the last eight quarters.
Industry Q3’16 Q4’16 Q1’17 Q2’17 Q3’17 Q4’17 Q1’18 Q2’18
Software 44% 46% 42% 87% 82% 62% 74% 75%
Hardware 44% 50% 81% 62% 82% 40% 97% 59%
Life Science 86% 123% 41% 15% 89% 31% 30% 63%
Internet/Digital Media 15% 31% 65% 57% 49% 179% 101% 61%
Other 78% -5% 69% 43% 107% 73% 72% 81%
Total all Industries 52% 51% 54% 64% 80% 74% 74% 70%
A graphical representation of the above is below.
0%
30%
60%
90%
120%
150%
180%
Q3’16 Q4’16 Q1’17 Q2’17 Q3’17 Q4’17 Q1’18 Q2’18
SoftwareHardwareLifescienceInternet/Digital Media
75%
59%
63%61%

SILICON VALLEY VENTURE CAPITAL SURVEY SECOND QUARTER 2018 14
MEDIAN PERCENTAGE PRICE CHANGE RESULTS BY INDUSTRY — The table below sets forth
the median percentage price change results by industry group for each of the last eight quarters.
Please note that this is different than the Barometer, which is based on average percentage price
change.
Median % Price Change Q3’16 Q4’16 Q1’17 Q2’17 Q3’17 Q4’17 Q1’18 Q2’18
Software 32% 34% 27% 36% 47% 37% 40% 46%
Hardware 17% 0% 38% 42% 56% 13% 52% 27%
Life Science 0% 20% 26% 14% 34% 24% 28% 19%
Internet/Digital Media 24% 34% 25% 18% 47% 51% 59% 25%
Other 53% 0% 59% 44% 18% 63% 35% 53%
Total all Industries 27% 27% 29% 30% 46% 42% 41% 37%
A graphical representation of the above is below.
0%
10%
20%
30%
40%
50%
60%
Q3’16 Q4’16 Q1’17 Q2’17 Q3’17 Q4’17 Q1’18 Q2’18
SoftwareHardwareLifescienceInternet/Digital Media
46%
27%
19%
25%

SILICON VALLEY VENTURE CAPITAL SURVEY SECOND QUARTER 2018 15
FINANCING ROUND — This quarter’s financings broke down by series according to the chart
below.
Series Q3’16 Q4’16 Q1’17 Q2’17 Q3’17 Q4’17 Q1’18 Q2’18
Series A 26% 22% 29% 28% 27% 29% 25% 24%
Series B 32% 28% 18% 23% 32% 26% 27% 24%
Series C 17% 20% 20% 23% 19% 15% 21% 19%
Series D 12% 14% 15% 9% 11% 13% 13% 13%
Series E and Higher 12% 16% 17% 17% 10% 17% 16% 19%

SILICON VALLEY VENTURE CAPITAL SURVEY SECOND QUARTER 2018 16
Fenwick & West Data on Legal Terms
LIQUIDATION PREFERENCE — Senior liquidation preferences were used in the following
percentages of financings.
The percentage of senior liquidation preference by series was as follows:
0%
5%
10%
15%
20%
25%
30%
35%
40%
Q3’16 Q4’16 Q1’17 Q2’17 Q3’17 Q4’17 Q1’18 Q2’18
26%
0%
10%
20%
30%
40%
50%
Q3’16 Q4’16 Q1’17 Q2’17 Q3’17 Q4’17 Q1’18 Q2’18
BCDE and higher
13%
40%
27%28%

SILICON VALLEY VENTURE CAPITAL SURVEY SECOND QUARTER 2018 17
MULTIPLE LIQUIDATION PREFERENCES — The percentage of senior liquidation preferences that
were multiple liquidation preferences were as follows:
Of the senior liquidation preferences that were a multiple preference, the ranges of the multiples
broke down as follows:
0%
5%
10%
15%
20%
Q3’16 Q4’16 Q1’17 Q2’17 Q3’17 Q4’17 Q1’18 Q2’18
11%
0%
20%
40%
60%
80%
100%
Q3’16 Q4’16 Q1’17 Q2’17 Q3’17 Q4’17 Q1’18 Q2’18
>1x – 2x>2x – 3x>3x
80%
20%
0%
SILICON VALLEY VENTURE CAPITAL SURVEY SECOND QUARTER 2018 18
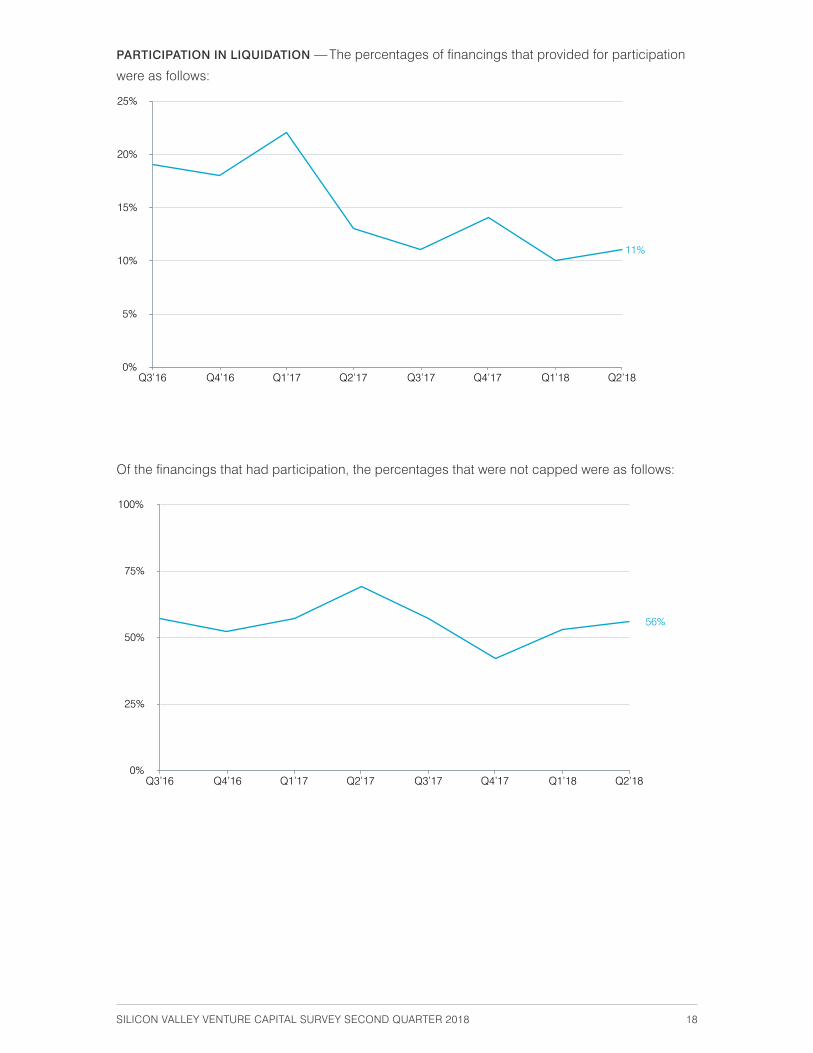
PARTICIPATION IN LIQUIDATION — The percentages of financings that provided for participation
were as follows:
Of the financings that had participation, the percentages that were not capped were as follows:
0%
5%
10%
15%
20%
25%
Q3’16 Q4’16 Q1’17 Q2’17 Q3’17 Q4’17 Q1’18 Q2’18
11%
0%
25%
50%
75%
100%
Q3’16 Q4’16 Q1’17 Q2’17 Q3’17 Q4’17 Q1’18 Q2’18
56%

SILICON VALLEY VENTURE CAPITAL SURVEY SECOND QUARTER 2018 19
CUMULATIVE DIVIDENDS – Cumulative dividends were provided for in the following percentages
of financings:
ANTIDILUTION PROVISIONS –The uses of (non-IPO) antidilution provisions in the financings were
as follows:
Please note that the chart above only applies to non-IPO anti-dilution provisions. In other words, the chart refers to anti-dilution provisions that protect the investor against a future venture financing at a price below what the investor paid. The chart does not include anti-dilution provisions designed to protect against an IPO at a price below the price paid by the venture investor (e.g., an IPO ratchet), because those provisions are generally only negotiated/included in very late stage, high value deals. We believe it would not be useful to provide a percentage of all financings that have IPO anti-dilution provisions, because it will provide a result that is artificially low. An analysis of IPO anti-dilution provisions is included in our Unicorn Survey, which by its nature is focused on late stage, high value deals.
0%
1%
2%
3%
4%
5%
6%
7%
8%
Q3’16 Q4’16 Q1’17 Q2’17 Q3’17 Q4’17 Q1’18 Q2’18
5%
0%
20%
40%
60%
80%
100%
Q3’16 Q4’16 Q1’17 Q2’17 Q3’17 Q4’17 Q1’18 Q2’18
RatchetWeighted AverageNone
98%
0%2%

SILICON VALLEY VENTURE CAPITAL SURVEY SECOND QUARTER 2018 20
PAY-TO-PLAY PROVISIONS – The percentages of financings having pay-to-play provisions were as
follows:
REDEMPTION – The percentages of financings providing for mandatory redemption or redemption
at the option of the investor were as follows:
0%
2%
4%
6%
8%
10%
12%
Q3’16 Q4’16 Q1’17 Q2’17 Q3’17 Q4’17 Q1’18 Q2’18
5%
0%
2%
4%
6%
8%
10%
12%
14%
16%
Q3’16 Q4’16 Q1’17 Q2’17 Q3’17 Q4’17 Q1’18 Q2’18
5%

SILICON VALLEY VENTURE CAPITAL SURVEY SECOND QUARTER 2018 21
CORPORATE REORGANIZATIONS – The percentages of post-Series A financings involving a
corporate reorganization (i.e. reverse splits or conversion of shares into another series or classes
of shares) were as follows:
0%
1%
2%
3%
4%
5%
6%
7%
8%
9%
Q3’16 Q4’16 Q1’17 Q2’17 Q3’17 Q4’17 Q1’18 Q2’18
6%

SILICON VALLEY VENTURE CAPITAL SURVEY SECOND QUARTER 2018 22
About our Survey
The Fenwick & West Venture Capital Survey was first published in the first quarter of 2002 and
has been published every quarter since then. Its goal is to provide information to the global
entrepreneurial and venture community on the terms of venture financings in Silicon Valley.
The survey is available to all, without charge, by signing up at www.fenwick.com/vcsurvey/sign-up.
We are pleased to be a source of information to entrepreneurs, investors, educators, students,
journalists and government officials.
Our analysis of Silicon Valley financings is based on independent data collection performed by our
lawyers and paralegals, and is not skewed towards or overly representative of financings in which
our firm is involved. We believe that this approach, compared to only reporting on deals handled
by a specific firm, provides a more statistically valid and larger dataset.
For purposes of determining whether a company is based in “Silicon Valley” we use the area code
of the corporate headquarters. The area codes included are 650, 408, 415, 510, 925, 916, 707, 831
and 209.
Note on Methodology
When interpreting the Barometer results please bear in mind that the results reflect the average
price increase of companies raising money in a given quarter compared to their prior round of
financing, which was on average about 18 months prior. By definition the Barometer does not
include companies that do not do follow-on financings (which may be because they went out of
business, were acquired or went public). Accordingly we believe that our results are most valuable
for identifying trends in the venture environment, as opposed to calculating absolute venture
returns. Please also note that our calculations are not “dollar weighted,” i.e. all venture rounds are
treated equally, regardless of size.

SILICON VALLEY VENTURE CAPITAL SURVEY SECOND QUARTER 2018 23
About the Authors
Cynthia Clarfield Hess is Co-Chair of Fenwick’s Startup and Venture Capital
Group. In her 25 plus years as a corporate attorney, Cindy has counseled
technology companies on a broad range of corporate transactional
matters, from formation matters and venture capital financings to mergers
and acquisitions and public offerings, representing both companies and
underwriters. She has worked with a wide range of high-technology clients –
from established technology stalwarts to emerging companies developing
disruptive technologies, which include some of the hottest and most
innovative companies in the mobile, SaaS and social media spaces.
Mark Leahy, Co-Chair of Fenwick’s Startup and Venture Capital Group
and a seasoned advisor to technology companies on a broad range of
corporate transactional matters, focuses on providing legal solutions that
advance his clients’ business objectives. His practice focuses on venture
capital financings, corporate governance, mergers and acquisitions, and
public offerings. His expertise spans a wide range of technologies, including
software, semiconductor, internet/e-commerce, and data management and
storage.
Khang Tran supports the firm’s knowledge management efforts by collecting
and sharing knowledge and expertise across the firm, which in turn, is
leveraged to improve the quality of legal services to the firm’s clients.

SILICON VALLEY VENTURE CAPITAL SURVEY SECOND QUARTER 2018 24
Contact/Sign Up Information
For additional information about this report please contact Cynthia Hess at 650.335.7238;
[email protected] or Mark Leahy at 650.335.7682; [email protected] at Fenwick & West.
To view the most recent survey please visit fenwick.com/vcsurvey. To be placed on an email list for
future editions of this survey please visit fenwick.com/vcsurvey/sign-up.
Disclaimer
The preparation of the information contained herein involves assumptions, compilations and analysis, and there
can be no assurance that the information provided herein is error-free. Neither Fenwick & West LLP nor any of its
partners, associates, staff or agents shall have any liability for any information contained herein, including any errors
or incompleteness. The contents of this report are not intended, and should not be considered, as legal advice or
opinion. To the extent that any views on the venture environment or other matters are expressed in this survey, they
are the views of the authors only, and not Fenwick & West LLP.
© 2018 Fenwick & West LLP

fenwick & west
SILICON VALLEY SAN FRANCISCO SEATTLE NEW YORK SHANGHAI
FENWICK.COM