silver nanowire coating as a functional thin film · silver nanowire coating as a functional thin...
TRANSCRIPT
Silver Nanowire Coating as
A Functional Thin Film
by
Devin O’Neill
A thesis submitted to the Faculty of Graduate and Postdoctoral
Affairs in partial fulfillment of the requirements
for the degree of
Master of Science
in
Chemistry
Carleton University
Ottawa, Ontario, Canada
© 2016
Devin O’Neill

The undersigned hereby recommends to the
Department of Chemistry
acceptance of the thesis
Silver Nanowire Coating as
A Functional Thin Film
Submitted by:
Devin O’Neill
In partial fulfillment of the requirements for the degree of
Masters of Science
Dr. Anatoli Ianoul
(Supervisor)

i
Abstract
This goal of thesis is to characterize a plasmonic film suitable for use on an optical fibre. This body
of work focuses on the study of a thermal and fluorescent enhancing plasmonic film. This film was
used on an optical fibre containing a tilted fibre Bragg grating to allow in situ monitoring of
temperature, and the coupling of light into the film for both heat generation (thermoplasmonics)
and to stimulate fluorescence on the surface (with fluorescent enhancement). This has involved
examining the effect of the surface density of silver nanowires, and the presence of a spacer layer.
Calculations of the fluorescent enhancement (EF ~18) as well as the heating efficiency were carried
out. This film was identified as strongly scattering light that was in the cladding out of the fibre,
as well as acting as a high efficiency heat source (100 ± 20 %.) which allowed for the determination
of the melting temperature of the silver nanowires.
.

ii
Acknowledgments
Throughout the work which is culminated in this thesis, I have worked closely, and come
to depend on the members of the Ianoul lab group (Adam Bottomley, Daniel Prezgot, Emma
Jorgenson, Jason Coyle, Grace Idiong, Alexandra Gale-Mouldey, and Anatoli Ianoul) as well as
collaborators in the Albert lab (Albane Laronche, Hubert Jean-Ruel, Wenjun Zhou, Sandrine
Lepinay, Violetta Marquez, and Jacques Albert) as well as collaborators from industry (Alan
Shayanpour, Serge Golovan, Daniel Mok, Paige Gilbank, and Chris Harder) and perhaps most
importantly, my fellow IPS comrade Jason Koppert. I would also like to thank my mother who
helped proofread, and listen to countless rants.
This experience has taught me a great deal, not necessarily about what I expected to learn,
but a great deal just the same. Working with industry was informative as to the goal of projects,
and to my own view on the value of private information.
I would also like to thank all those who had to bear with me when I was frustrated, or who
helped me remain calm; especially the staff at the local pub for having a ready supply of beer on
hand.
Finally I would like to thank my committee for they of all people had to read this work,
and for that I thank them (Anatoli Ianoul, Sean Barry, Robert Burk, Sangeeta Murugkar and Jacques
Albert).

iii
Table of Contents
Abstract ............................................................................................................................................. i
Table of Contents ............................................................................................................................ iii
List of Abbreviations .................................................................................................................... viii
1. Introduction .............................................................................................................................. 1
1.1. Optical Systems ............................................................................................................... 3
1.1.1. Electromagnetic Radiation ........................................................................................... 3
1.1.2. Light near surfaces ....................................................................................................... 6
1.1.3. Optical fibres ................................................................................................................ 6
1.1.4. TFBG ........................................................................................................................... 8
1.2. Plasmonic materials ................................................................................................... 11
1.3. Functional Plasmonic Films ........................................................................................... 12
1.4. Oxide Coating ................................................................................................................ 14
1.5. Deposition ...................................................................................................................... 15
1.5.1. SAM deposition ......................................................................................................... 15
1.5.2. LB deposition ............................................................................................................. 16
1.5.3. Spray coating ............................................................................................................. 16
1.5.4. Dip coating ................................................................................................................. 17
2. Materials and Methods ........................................................................................................... 18
2.1. Chemicals ....................................................................................................................... 18
2.2. Polyol synthesis of silver nanowires .............................................................................. 18
2.3. Deposition ...................................................................................................................... 20
2.3.1. SAM deposition ......................................................................................................... 20
2.3.2. LB deposition ............................................................................................................. 20
2.3.3. Spray coating ............................................................................................................. 20
2.4. Optical Fibre Mirror ....................................................................................................... 21
2.5. Atomic Layer Deposition ............................................................................................... 21
2.6. Fluorophore Deposition ................................................................................................. 22
2.5. Characterization ............................................................................................................. 23
2.5.1. AFM ........................................................................................................................... 23
2.5.2. UV-Vis-NIR ............................................................................................................... 23

iv
2.5.3. SEM ........................................................................................................................... 23
3. Ex Situ Heating Observations of AgNW on slides ................................................................ 24
3.1. Thermoplasmonics ..................................................................................................... 24
3.2. Preliminary study ........................................................................................................... 26
3.3. Second Study ................................................................................................................. 28
4. In Situ Heating Observations of AgNW on Fibres ................................................................ 34
4.1. Heat Flow ....................................................................................................................... 34
4.2. Heating in Water ............................................................................................................ 38
4.3. Silver Nanowire Melting: Preliminary Study ................................................................ 42
5. Polarization dependent NIR Scattering of AgNW on a TFBG .............................................. 45
5.1. Scattering Measurements ............................................................................................... 46
6. Fluorescence Enhancement of Rhodamine B Due to AgNW, Dependencies of Separation
from and the Population of the Film .............................................................................................. 53
6.1. Surface Enhanced Fluorescence..................................................................................... 53
6.4. Results ............................................................................................................................ 54
7. Conclusions ............................................................................................................................ 62
8. Appendix ................................................................................................................................ 64
9. References .............................................................................................................................. 65

v
Table of Figures
Figure 1: Depiction of the proposed fibre device. ........................................................................... 1
Figure 2: Total internal reflection resulting in surface modes of light (evanescent light)
from s or p modes of light .............................................................................................. 5
Figure 3: Example TFBG and excitation pump spectra. .................................................................. 8
Figure 4: The surface polarization as a result of s and p polarised light being ejected into
the cladding by a TFBG ................................................................................................. 9
Figure 5: TFBG spectra for s and p polarization; the p modes are at slightly higher energy
than then the s modes. .................................................................................................. 10
Figure 6: ALD is a self-limited formation of monolayers. A titanium precursor is added
to an oxide surface (A). The precursor reacts which releases propanol and
forms a titanium isopropoxide surface (B). Upon the addition of water the
remaining isoproxide groups are released as isopropanol and the initial surface
conditions are regained and a single layer of TiO2 has been deposited (C). ................ 14
Figure 7: TEM images of silver particles coated with Alumina; the number in each box
indicates the number of TMA/water cycles the samples were exposed to.
Several images were measured to find the thickness. .................................................. 22
Figure 8: Fluorescence set up; (1) a laser is coupled through (2) mirrors and a filter (3),
focused through a pair of lenses (4) before an aperture (5). For observations
of fluorescence due to evanescent excitation a prism (6) was placed with
optical gel before the slide (7). Fluorescent light passed through a second
filter (8) to remove any laser light before being captured by a camera (9) which
was connected to a laptop running a custom Labview program. ................................. 23
Figure 9: Schematic of the set up used for observing the heating of a glass slide though
NIR illumination. The Animonix 1550 nm pump (A) which is fibre coupled
(B) such that it diverges onto the surface of the slide which is coated with
silver nanowires (C), a prism was used to achieve TIR conditions for
evanescent excitement; this is monitored by the IR thermal imaging camera
(D) ................................................................................................................................ 26
Figure 10: Left: image captured by the IR camera used to determine the temperature of
irradiated AgNW coated slides. Right: SEM of one of the samples of spray
coated silver nanowires. ............................................................................................... 27
Figure 11: (Left) heating and (Right) extinction as functions of surface density as
determined through SEM measurements. .................................................................... 28
Figure 12: Left: Calibration of apparent temperature of each slide was used to determine
the emmisivity of AgNW coated samples. Rgiht: Apparent temperature for
silver nanowire surfaces. .............................................................................................. 30
Figure 13: Colour contour graphs showing TIR change with polarization. Numbers
correspond to slide identity; the images have been ordered based on
population (descending). Images depict the TIR spectra, and so a lower value
indicates greater attenuation of the signal. 0o corresponds to s, while 90o to p.
..................................................................................................................................... 33

vi
Figure 14: COMSOL heat flow simulations prepared by collaborators H. Jean-Ruel and
J Albert. Top: 3D rendering of the temperature profile inside the glass
capillary for simulations with (right) and without (left) a fan forcing air.
Bottom left: simulated and experimental measurements of the temperature at
the boundary of the water and glass capillary. Bottom right: simulation of the
temperature along the radial axis. ................................................................................ 36
Figure 15: Left: Bragg peak intensity from a fibre during heating. Fibres were calibrated
and showed that the peak shifts at 10.5 pm/Co. Right: The calibration was
used to determine the ΔT/ΔPin during excitation (where the power into the
fibre takes into account the efficiency of the couplers used in the setup). ................... 38
Figure 16: Left: SEM image (Tescan Vegall XMU) of a fibre with multiple layers of
AgNW, the damage seen in this image is due to mounding the fibre for
imaging. Right: AFM phase contrast image, the edge of the image is 2.5 µm.
..................................................................................................................................... 39
Figure 17: Set-up for heating fibres; where polarized broadband light is passed through
the system so that spectra can be taken at a given polarization, while an EDFA
pumped seed laser is coupled independently into the system so that the fibre
device can be excited. All connections between devices are by fibre optic
cable, and the final fibre device is here labeled as fibre .............................................. 40
Figure 18: Efficiency of the fibre device in a capillary of water, the fibres were tested
without wires, after a single dip into the LB film, and then after several dips
through the film to produce multilayered coatings. Individual results are
shown (points)) along with the average (bar) for each regime (none, single,
and multi layered); ....................................................................................................... 41
Figure 19: Rough calibration of the population with increasing dips used to make an
estimation of the population of dipped fibres .............................................................. 43
Figure 20: Cladding depth for both s and p modes as the fibre was pumped. The
temperature corresponds to the temperature observed during pumping ...................... 44
Figure 21: Select SEM micrographs of the two fibres; on the left the fibre which was
dipped 5 times, on the right the fibre which was dipped 10 times. .............................. 46
Figure 22: Spectra of a cladding mode as the fibres were coated. Left column are p modes,
while right are s. Upper and lower pairs correspond to the two fibres (5 and
10 dips) ........................................................................................................................ 47
Figure 23: Attenuation of the s and p modes with respect to the number of dips for the
two fibres tested. It is apparent that there are inconsistencies using the
cladding depth. ............................................................................................................. 48
Figure 24: Shifts of the cladding modes at the maximum depth, shifts were taken with
respect to the starting position of the p cladding modes. ............................................. 48
Figure 25: Scattering from the 5 dip fibre for both p and s mode illumination, numeration
indicates matched pairs of images. .............................................................................. 50
Figure 26: Scattering from the 10 dip fibre for both p and s mode illumination, dup to the
inconsistent scattering along the length of the TFBG additional images were
taken ............................................................................................................................. 51
Figure 27: Ratio of scattering intensities for the p and s modes for the two fibres........................ 52

vii
Figure 28: Glass slides were coated with AgNW, had an alumina spacer layer, and then
coated with RhB for fluorescence studies. ................................................................... 54
Figure 29: Extinction of the three Silver nanowire samples after being coated with
alumina, the excitation and emission, and fluorescence of Rhodamine B has
overlap with the particles. ............................................................................................ 55
Figure 30: Top: Two samples, illuminated at the boundary of silver nanowires showing
the difference in intensity between the coated and uncoated region. Bottom
Left: plane wave (propagating) Excitation and Bottom Right: TIR
(evanescent) Excitation of RhB coated slides with sections of AgNW (sample)
and blank sections (control) on slides. Separation is based on expected results,
and when measured was found to be 5 nm, 7 nm, and 14 nm. .................................... 56
Figure 31: Above: Surface Enhanced Fluorescence of slides for propagating, and internal
reflection with respect to the calculated population. .................................................... 57
Figure 32: SEM of AgNW coated slides; no conductive coating was deposited before
imaging. ....................................................................................................................... 59
Figure 33: TIR spectra, populations, and SEF for slides coated with AgNW ............................... 64

viii
List of Abbreviations
AFM Atomic Force Microscopy
AgNW Silver Nanowire
ALD Atomic Layer Deposition
ATR Attenuated Total internal Reflection
EDFA Erbium Doped Fibre Amplifier
EELS Electron Energy Loss Spectroscopy
EF Enhancement Factor
FBG Fibre Bragg Grating
LB Langmuir Blodgett
OSA Optical Spectrum Analyser
SAM Self-Assembled Monolayer
SEF Surface Enhanced Fluorescence
SEM Scanning Electron Microscope
Sol-Gel Solution-Gelation
TFBG Tilted Fibre Bragg Grating
TII Type II Fibre Bragg Grating
TIR Total Internal Reflection
UV-Vis-NIR Ultraviolet-Visible-Near Infrared

1
1. Introduction
This thesis is the summary of the collaborative work between academic researchers and
industry with the goal of producing a device with specific functionality requiring high efficiency
heating, and fluorescent capabilities; this device would be in a capillary filled with aqueous solution
(an example schematic is shown in figure 1). The functional component, described and
characterized in this thesis, is a plasmonic film of silver nanowires (AgNW) for heat generation
and fluorescent enhancement. The thermal properties of such a device depend heavily on the
surroundings; the population dependent heating of silver nanowires was observed on glass slides
with an IR camera, and on fibres by internal temperature measurement. The fluorescence was
probed only on slides, with variations to the separation between the metal film and the fluorophore,
as well as the dependence on the population of nanowires. The fibre has a modification to the core
which couples light into the cladding and can be used to observe the temperature.
Figure 1: Depiction of the proposed fibre device.
Fluorophore
2
It is supposed that a fibre device can be made which is optimized for the bifunctionality of
heating water in a small enclosed vessel (a capillary) and of fluorescent enhancement. The
population dependence of the heating and optical scattering of AgNW will be discussed, as will the
fluorescent enhancement with respect to the population of AgNW and the separation of the
fluorophore from the AgNW film. It is supposed that a sufficiently dense film of nanowires will
act like a mirror, hence there will be an ideal AgNW population for the interactions of the film
(absorption, fluorescent enhancement, etc). This assumption will be probed along with studying
the heating and fluorescent enhancement of the film. The heating properties of the wires will be
probed using slides which have been spray coated with AgNW; the heating of the film in water will
be investigated using a fibres coated through Langmuir-Blodgett depositions of different
populations. The scattering of light by the film will also be investigated on fibres, which were
coated by dip coating. The fluorescent enhancement will be investigated again using slides which
have been spray coated with AgNW, making use of an alumina layer which was deposited through
atomic layer deposition (to act as a spacer layer). The assumption that the coating will act as a
mirror will be tested in the scattering section.
In this work, silver nanowires are deposited on the surface of an optical fibre containing a
tilted fibre Bragg grating. Plasmonic properties of the nanowires are probed using polarized
evanescent light delivered to the surface of the fibre. Particularly we are looking to explore the
wavelength and polarization dependencies of light scattering and heat generation by the nanowires,
as well as the fluorescent enhancement of such a film. Similar observations have previously been
done through more complicated methods, here we present new observations using a relatively
simple method.
TFBG enables us to redirect a fraction of light from the core into the cladding and also to
control the polarization of light at the cladding/air interface. The polarization is of interest as the
radial modes will couple along the transverse of the wires (the plasmonic resonance occurs in the
3
visible region ~400 nm) while the tangential modes can couple to the longitudinal modes of the
wire (which are in the NIR). Therefore by using polarization it becomes possible to selectively
excite plasmon resonances at the wavelength of interest for heating or to extract light from the
optical fibre. The NIR light induces current along the length of the wire which generates heat
through resistive (Joule) heating. The scattering was observed with a NIR camera while the heat
was observed through shifts in the Bragg peak (the wavelength of light which is reflected by the
grating)
Films of silver nanowires were prepared and illuminated with 1550 nm light; the heat
generated was seen to be linearly dependent of power, and on the population (the latter of which is
subject of some discussion). When deposited on a fibre and placed in a capillary of water the
heating efficiency of the device is reported to reach 100 ± 20 % for sufficiently dense films. AgNW
welding or melting was observed with fibre platforms, with changes began at 145 oC with
significant changes occurring at and above 207 oC.
The fluorescent enhancement of the film was studied with respect to the population and the
separation of the surface mounted fluorophore from the film. It was seen that a maximum
enhancement (18 times control level) for evanescent light occurred for a population of about 4.5
AgNW µm-2. This occurred on samples with an additional mode which appeared in the polarization
dependent total internal reflection spectra; which implies that there was additional film interactions
which is responsible for this enhancement
1.1. Optical Systems
1.1.1. Electromagnetic Radiation
Light, a transverse wave which combines an electric and an orthogonal magnetic
component propagates through space and oscillates in time,1 has been the subject of study for as
long as the study of philosophy (Euclid, in ancient Greece, thought that light travelled out of one’s

4
eyes at an infinite speed).2 In the last century the study of light revealed some incredibly interesting
phenomena through the mathematical description of light.1 In the late 19th century the study of
light gave rise to a description of the transfer of energy by light, and the magnitude in relation to
the electric and magnetic components: the Poynting vector.3 The mathematics surrounding the
Poynting vector which gives the direction of linear polarized propagation (the time averaged
pointing vector, <𝑆> is equal to one half the real cross product of the electric field, �⃑⃑�, and complex
conjugate of the magnetic field, 𝐻∗⃑⃑ ⃑⃑ ⃑, Equation 1) can be manipulated to give the relationship
between the intensity of light (I) and the square of the amplitude of the electric field (Eo, Equation
2).1,3 This relation is dependent on the index of refraction (n), speed of light (c) and the magnetic
permeability (assumed to be µo).
< 𝑆 >=1
2𝑅𝑒(�⃑⃑� × 𝐻∗⃑⃑ ⃑⃑ ⃑ ) (1)
𝑰 =𝒏
𝟐𝒄µ𝒐|𝑬𝒐|𝟐 (2)
This shows that there is an intensity of light which is proportional to the square of the electric field
(this is relevant to section 1.4).
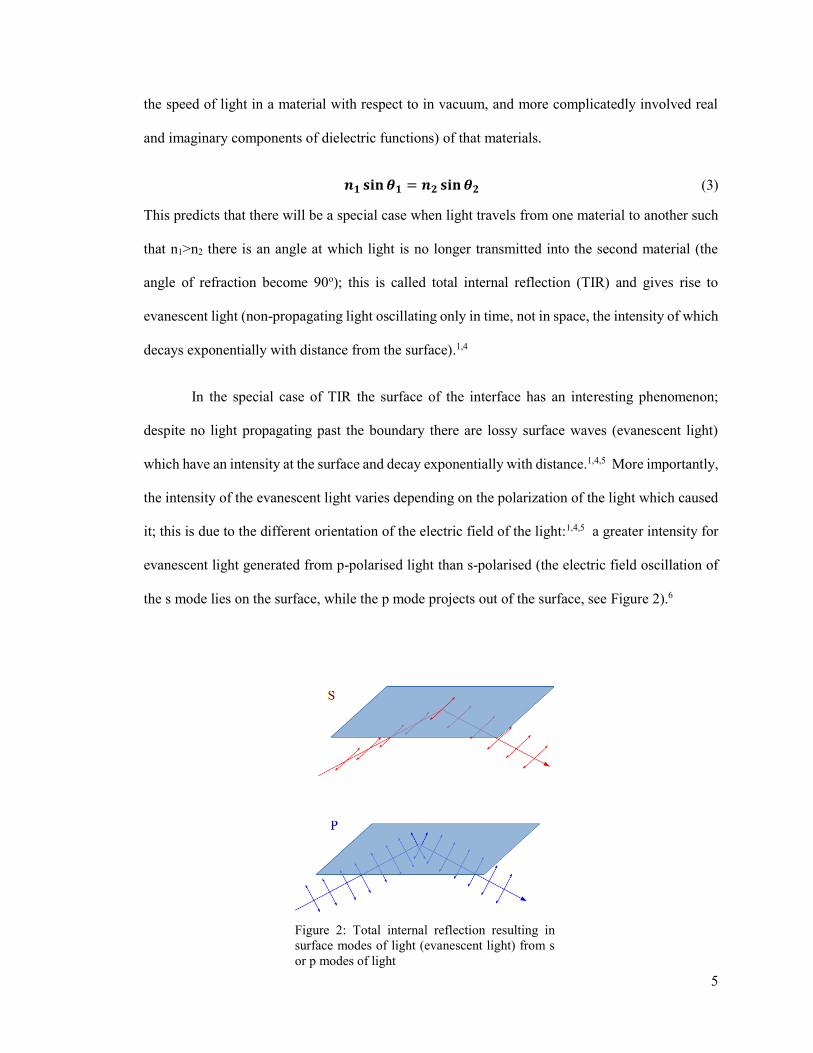
Light intrinsically is polarized and it is possible to remove all but a single orientation of
light; that is to say, light in which all the electric field oscillations occur in a single plane.1,4 This
is especially important when one considers light striking an object or plane; as the incident light
photons are commonly considered polarizations with respect to the plane of incidence (the plane
containing the vectors of the impinging light and the reflected/refracted light): parallel (p) and the
perpendicular (s Figure 2)1,4.
Light which passes through one medium to another will refract in accordance with Snell’s
law, which relates the angle of refraction and the index of refraction (which is simply the ratio of
5
the speed of light in a material with respect to in vacuum, and more complicatedly involved real
and imaginary components of dielectric functions) of that materials.
𝒏𝟏 𝐬𝐢𝐧 𝜽𝟏 = 𝒏𝟐 𝐬𝐢𝐧 𝜽𝟐 (3)
This predicts that there will be a special case when light travels from one material to another such
that n1>n2 there is an angle at which light is no longer transmitted into the second material (the
angle of refraction become 90o); this is called total internal reflection (TIR) and gives rise to
evanescent light (non-propagating light oscillating only in time, not in space, the intensity of which
decays exponentially with distance from the surface).1,4
In the special case of TIR the surface of the interface has an interesting phenomenon;
despite no light propagating past the boundary there are lossy surface waves (evanescent light)
which have an intensity at the surface and decay exponentially with distance.1,4,5 More importantly,
the intensity of the evanescent light varies depending on the polarization of the light which caused
it; this is due to the different orientation of the electric field of the light:1,4,5 a greater intensity for
evanescent light generated from p-polarised light than s-polarised (the electric field oscillation of
the s mode lies on the surface, while the p mode projects out of the surface, see Figure 2).6
Figure 2: Total internal reflection resulting in
surface modes of light (evanescent light) from s
or p modes of light
6
The relevance of the changing directionality of the electric field has significant implication
to the excitation of surface plasmons in a TIR absorption regime as this directionality of the electric
field must align with the direction of the oscillation of electrons (this will be revisited in section
1.2). 7 While using a prism to investigate such interaction can be done, it is bulky, and ill-suited
towards novel product design; the use of an optical fibre can resolve this by making use of a
substrate which guides the light and can provide evanescent excitation to surface mounted
particles.8
1.1.2. Light near surfaces
So far two types of light have been discussed, propagating light, and evanescent light; the
former can be observed easily, but not so for the latter as by definition no power is transmitted.
There is a manner to couple evanescent light into a propagating regime so that it can be observed;
by bringing an optical receiver in close proximity (less than the decay length of the evanescent
light) to the surface; the light can be coupled to the receiver as propagating light (this is known as
frustrated total internal reflection).4 This can be applied as a method to analyse light in the region
close to surfaces (less than a wavelength) in what is called near field imaging; a technique where
an optical probe (often a sharp fibre with a small aperture) is mounted on a scanning probe
microscope.9 The use of this is to directly observe so called near field phenomena such as
evanescent light or other sources of oscillating electric fields at a surface (such as those described
later in section 1.4),964 different to the near field (where light is described as fields) is the far field,
which is macro scale optics (dominated by discussions of radiation/propagation).9
1.1.3. Optical fibres
An optical fibre is comprised of a thin glass rod with a central core surrounded by a glass
layer known as the cladding with each have a different index of refraction such that light is retained
in the core through total internal reflection. In order to make use of the light in the core, one is
required to have some way to extract the light; this can be some form of coreless section or change
to the core such that light is coupled out into the cladding (this cladding mode propagates back

7
along the fibre creating evanescent waves at the interface).10,11 A great deal of work making fibre
devices which interact with their surrounding has been done; often for refractive index sensing (the
position of the cladding modes are dependent on the refractive index of the cladding, and the
surrounding material which the evanescent light illuminated).11 While many methods involve a
change in fibre sections (that is, to splice different types of fibre to make the device), there are some
which involve making modifications to the core of the fibre.
A well-known mean of modifying the core of a fibre is to produce a fibre Bragg grating
(FBG)12. There are several variations of FBG (this is by no means an exhaustive list): there is an
FBG which will reflect a desired spectral band (usually a very narrow set of wavelengths); a long
period fibre grating which will couple several wavelengths of light into the cladding of the fibre
(so called cladding modes); chirped gratings are a variant on the FBG which will reflect a broader
region of wavelengths; tilted fibre Bragg gratings (TFBG) which reflects a specific wavelength,
and creates several cladding modes (the TFBG acts in a manner analogous to a combination to a
long pass FBG and a regular FBG);12 and Type II fibre gratings (TII) where the grating has a lower
index of refraction than the surrounding core (unlike the other varieties which have a higher relative
index of refraction).13 Due to the bi-functionality of the TFBG it was selected for use in the studied
device.
8
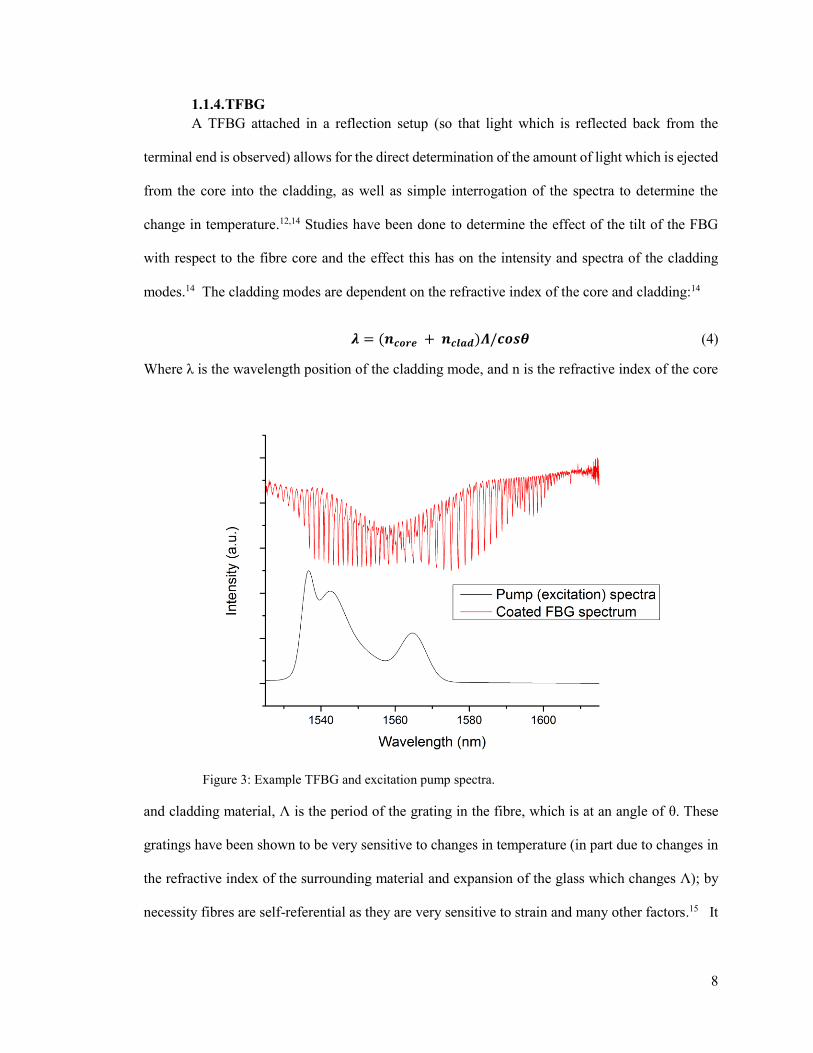
1.1.4. TFBG
A TFBG attached in a reflection setup (so that light which is reflected back from the
terminal end is observed) allows for the direct determination of the amount of light which is ejected
from the core into the cladding, as well as simple interrogation of the spectra to determine the
change in temperature.12,14 Studies have been done to determine the effect of the tilt of the FBG
with respect to the fibre core and the effect this has on the intensity and spectra of the cladding
modes.14 The cladding modes are dependent on the refractive index of the core and cladding:14
𝝀 = (𝒏𝒄𝒐𝒓𝒆 + 𝒏𝒄𝒍𝒂𝒅)𝜦/𝒄𝒐𝒔𝜽 (4)
Where λ is the wavelength position of the cladding mode, and n is the refractive index of the core
and cladding material, Λ is the period of the grating in the fibre, which is at an angle of θ. These
gratings have been shown to be very sensitive to changes in temperature (in part due to changes in
the refractive index of the surrounding material and expansion of the glass which changes Λ); by
necessity fibres are self-referential as they are very sensitive to strain and many other factors.15 It
Figure 3: Example TFBG and excitation pump spectra.

9
is through the monitoring of the position of the Bragg peak (the wavelength of light which is
reflected by the gratting) which shifts predictably with temperature.15
As for the interrogation of the amount of light which is coupled into the cladding modes
from the spectra, this can be done by comparing the excitation spectra (Ppump(λ) ) to that of the
TFBG (PTFBG(λ) , Figure 3). The intensity of the cladding resonance modes (which occure at λ<
λBragg) with respect to the background is the intensity of light which will be coupled out of the core
for a single pass of light (further consideration to take into account the mirrored surface of a
terminal cleave is needed to determine the total light coupled out of the core). The system used
here makes use of a mirrored fibre which will reflect the majority (but not all) of the light which
was not coupled into the cladding allowing for a second pass of the light through the TFBG. The
mirror is assessable by considering the intensity of the region <λTFBG (the efficiency of the mirror,
ηmirror, is determined from the intensity of >λTFBG). Taking this into account we find that the final
equation for the power of the light coupled into the cladding (Pcoupled(λ), Equation 5); this will be
Figure 4: The surface polarization as a result of s and p polarised light
being ejected into the cladding by a TFBG

10
revisited in Section 4 where it will be further modified to give an efficiency of heating for a fibre
device.
𝑷𝒄𝒐𝒖𝒑𝒍𝒆𝒅(𝝀) = 𝑷𝒑𝒖𝒎𝒑(𝝀)[𝟏 − 𝑷𝑻𝑭𝑩𝑮(𝝀)] ∗ [𝟏 + 𝑷𝑻𝑭𝑩𝑮(𝝀)𝜼𝒎𝒊𝒓𝒓𝒐𝒓] (5)
A TFBG produces different modes of light in the cladding based on the polarization of the
light passing though the TFBG. The assignment of the mode (s or p) is given with respect to the
tilt of the grating, but the generated modes are either radial or tangential, because of the electric
field is perpendicular (radial) or in the plane (tangential) of the fibre surface (this is synonymous
with s/p light in a TIR setting, Figure 4). Like in a flat prism, the s polarized light generates an
electric field in the plane (tangential) and the p polarized light generates an electric field out of the
plane (radial).16 Additionally the assignment of polarization modes when regarding a TFBG
spectrum can be done since the p polarization will produce cladding resonance modes at a shorter
wavelength then the s mode for a given cladding mode (Figure 5).16
Figure 5: TFBG spectra for s and p polarization; the p modes are at slightly higher
energy than then the s modes.

11
1.2. Plasmonic materials
It is possible for light to induce the coherent oscillation of electrons in certain materials
(materials with a negative real and a small positive imaginary dielectric constant).17 The oscillation
induced from absorption of light results in scattering of light and a strong electric field, both of
which are dependent on a myriad of parameters (composition, size, shape, local environment, etc.);
the electric field has been identified as being useful in lithography, Raman scattering, fluorescence,
and catalysis.46,47,17 There are two kinds of plasmon resonances discussed here (pertinent to silver
nanowires): localized surface plasmon resonance (LSPR), and surface plasmon polariton (SPP, also
referred to as a surface propagating plasmon).17 Which modes are present is dependent on the size
and shape of the particle (and thus on the optical spectra).
The specific nature of these modes have been calculated through mathematical models and
recently the modes have been mapped (spatially and energetically) through electron energy loss
spectroscopy (EELS, a technique where a beam of electrons passes through a material which is
retarded due to physical properties of a material)18,19 For silver nanowires it has been shown that
the energy which excites the longitudinal modes are separated from the energy to excite the
transverse mode (longitudinal mode: ~0.5-1.75 eV, ~ 2500- 700 nm identified at SPP, transverse
~2.5-3 eV, 400-300 nm, identified as LSPR) so it is possible to excite the two categories of modes
individually.19
The primary model for the scattering cross section for metal nanoparticles is Mie theory, which
relates extinction (scattering and absorption) to the size, wavelength, and dielectric constants:17,20
𝐸𝑥(𝜆) ∝𝑎3𝜀𝑜𝑢𝑡
3/2
𝜆 [
𝜀𝑖(𝜆)
(𝜀𝑟(𝜆)+𝜒𝜀𝑜𝑢𝑡)2+𝜀𝑖(𝜆)2] (6)
Where 𝑎 is the size (radius for spheres), 𝜆 is the wavelength, 𝜒 is a constant which is geometrically
dependent (2 for a sphere, and can range to as much as 20 for high aspect ratios),20 and ε is the

12
dielectric constant (for the surrounding material, εout, and the real and imaginary components for
the metal, εr, εi respectively).17,21,22 This relation shows that changes in the local environment (εout),
size (𝑎), or shape (χ) will all have profound effects on the extinction cross section.
If we consider a continuous plasmonic film (for example a thin film of gold) on a prism so
that the excitation is due to evanescent light; the excitation of the plasmon would only occur with
the p mode (the transvers magnetic mode) with an electric field perpendicular to the surface; this
aligns the direction of oscillation of the electrons with the direction of oscillations of the electric
field.43,23 It becomes clear that the different polarizations will excite different plasmonic modes of
silver nanowires (p will excite the LSPR/transverse modes, while s will excite the SPP/longitudinal
modes of individual wires), and that this will be dependent on the alignment and stacking of the
wires.43,47
1.3. Functional Plasmonic Films
A great deal of work has been done studying plasmonic materials in the pursuit of making
materials that are useful. From harnessing solar energy to making medical devices the potential
use of these materials is being explored.24,25 Many different types of particles have been explored,
differing in both geometry and composition; which have different properties. Some particles have
been identified as having higher absorption cross sections than others; or for being very efficient at
converting absorbed light into heat,26 or for enhancing optical phenomena (fluorescence or
scattering).27 The use of optical fibres as devices has been prevalent in the medical community for
the last 40 years; providing means of imaging, and more recently performing surgery and
photocoagulation.28
Many fibre based heaters have been produced; often for detecting flow rates of gases (a
great deal of work has been done in producing hot wire anemometers).29,30 These show the viability
of using a plasmonic material, including silver, to produce heat.29 In FBG devices with naked metals
(such as in physical vapour deposition, or chemical vapour deposition) it is seen that as the film

13
grows, there is initially an increased absorption of light, followed by increased reflection as the
film becomes conducting.77 This occurs when the film’s thickness is greater than the penetration
depth of the evanescent light and so it cannot couple through.6 This same coupling is often used to
increase the sensitivity of plasmon enhanced sensors (the plasmon is especially sensitive to changes
in the index of refraction, and coupling this to a TFBG or other optical sensors allows for an
increased sensitivity over the bare device). It has previously been found that there is an ideal
thickness for the absorption of light by film (50 nm for gold);31,32 this implies that there may exist
an ideal thickness for a film made of nanomaterials. Such an ideal thickness would be characterized
by a maximum attenuation of a FBG spectrum, a maximum in heating efficiency, or a maximum
in heating with respect to the population of nanoparticles.
Just as there has been a great deal of work on functional films for the generation of heat so
has work been done to probe the ability of materials for fluorescence. A recent study of the distance
dependence of single silver nanowires was carried out using DNA with different lengths; it was
found that a beacon with 34 base pairs provided the most intense fluorescence with respect to
population and buffers (which extends 3.4 nm/10 base pairs giving this beacon a length of 11.6
nm).33,34 It was also found that quenching for the sample with 12 base pairs (4.1 nm); and that this
distance was not constant depending on material (gold had quenching until 8.2 nm). Another note
of interest was that at sites of defects (increased surface roughness) there was greater SEF.33 In
contrast to the fluorophore separation, variation of the surface population of silver nanowires (while
maintaining a constant separation (11 nm) between fluorophore and particle) has also been
explored.35 Simulations of these systems indicated that ~10 nm would be ideal, and that increasing
both film packing and stacking would result in an increase in the electric field (and so would result
in increased fluorescence).35 It was indicated that increasing population resulted in increasing
fluorescence; however it is important to note that the extinction of the slides at the maximum of

14
AgNW extinction did not exceed 0.1 and the SEM reveal that this does not represent a dense film
(no stacking/multilayer formation is seen in the SEMs).35
1.4. Oxide Coating
An oxide coating was used for dual purpose: to act as a spacer layer for fluorescent
enhancement (recall that when close to the plasmonic surface quenching occurs) and to act as an
anchor site for fluorescent beacons; only the former is explored here. Films were formed
through sequential gas phase deposition resulting in atomic layer deposition (ALD); this allows for
the sequential addition of reagents which allowed for fine control of film thickness. In ALD,
reagents are alternately introduced into a reaction chamber; each reagent will form a self-limiting
monolayer, and cycling the reagents (with purging between each half cycle) allows for the
controllable growth of thin films.36 In this manner metal oxides can be deposited on a surface
(including silver nanowire networks) through cycles of metal precursor (for example to produce
TiO2: Ti(OC3H7)4, Titanium tetra(isoproxide) TTIP) alternated with a reactive oxygen donor
(carrying on in the example: H2O).36,37,38 In the above example TTIP deposits on a hydroxylated
surface (releasing isopropanol) and when exposed to water releases the remaining isopropanoxyl
groups in exchange for forming TiO2 (Figure 6) which when deposited at high (250oC) temperatures
forms a crystalline film.38,39
Figure 6: ALD is a self-limited formation of monolayers. A titanium precursor is added to an oxide
surface (A). The precursor reacts which releases propanol and forms a titanium isopropoxide surface
(B). Upon the addition of water the remaining isoproxide groups are released as isopropanol and the
initial surface conditions are regained and a single layer of TiO2 has been deposited (C).

15
1.5. Deposition
Once AgNW particles have been produced they must be mounted on a substrate to be studied
or utilized, there are several methods to deposit particles on a surface, and 4 methods are discussed
here: chemically induced self-assembled monolayer (SAM), Langmuir-Blodgett (LB), spray
coating, and dip coating which are summarized in Table 1: Summary of deposition methods.
Method Mechanism Advantage Disadvantage
Self-Assembled
Molecular interaction
between surface and
particle
Simple
No guarantee of
micron scale
consistency
Small hands on time
Semi-predictable
population
Long overall time
Langmuir-
Blodgett Surface transfer
monolayer Sensitive to
contamination
Most controllable
population
limited to (mild)
hydrophobic coated
particle
Medium hands on time
Spray Coating Directed aerosol
Simple Disorganized
Very little hands on
time Wasteful
Minimal hands off time
Semi-predictable
population
Requires heating of
substrate
Dip Coating Capillary collapse/drying
predictable population disorganized
Fastest (hands on,
hands off)
risk of
contaminating high
concentration source
Simple risk of surface
contact
high dynamic range
Table 1: Summary of deposition methods
1.5.1. SAM deposition
Thin films of nanoparticles can be produced by functionalizing the surface with a molecule
which will interact with the desired particles. One of the simplest ways to achieve this between a

16
silica surface and silver particles is to introduce an amino-functionalized silane which will form a
monolayer on the glass surface.40,41,42 In doing this, a silane group will bond to the surface of the
glass and the amine group will extend from the surface. This functional group (amine in this
example) can interact with a metal to form a chemisorbed coating of nanoparticles.
1.5.2. LB deposition
The use of the Langmuir-Blodgett technique for the deposition of nanoparticles has been
used quite extensively in recent years by many groups43,44 and is developed from the original
technique which was used to study monolayers of lipids and other molecules.45 The technique is
relatively simple: objects (molecules, or particles which are sufficiently hydrophobic) can be
floated on a surface of water (in a trough); the surface population (Γ) can be controlled by changing
the total area of the trough (by moving a bar made of a suitable material – like Teflon, across the
surface of the water to reduce, or increase the available surface). It is possible to monitor the film
before depositing it on a substrate through a small Wilhelmy plate which is pushed up as the surface
pressure is increased (by compressing the trough the objects are forced together, since the meniscus
of water bends up towards the plate this will also force the plate up).45
The use of this technique to produce films of nanoparticles with controllable populations
has been shown previously43,44 and also to deposit organized films of silver nanowires (AgNW) on
optical fibres.46 It has also been shown that the addition of other molecules can lead to controllable
spacing in a film, and so if it is desired to have separation one can add lipids;44 however if the desire
is to produce high density films, the absence of any lipids or other molecular agents can lead to
aggregated monolayers.47
1.5.3. Spray coating
Spray coating is a method of deposition which is ubiquitous in society; in 2010 over 400
million cans of spray paint were manufactured in the USA.48 In academic pursuit the technique is
widely used for simple deposition of alcohol suspensions of nanomaterials,49 and in layer-by-layer

17
deposition.50 With the intention of depositing a uniform film of a given population the well-studied
deposition of silver nanowires through spray coating was identified as a practical avenue.51,52 An
issue that can arise during the spray coating of nanowires are the drying effects as the aerosol dries,
solvent fronts move the particles which results in micron-scale inhomogeneity. This can be reduced
through controlled drying: orientation of substrate, temperature, and deposition back-pressure. In
layer-by-layer assembly it is ideal if the surface is vertical as this allows for rapid draining,50 but
with an ethanoic solution of nanowires it is desirable to have a heated substrate such that the solvent
evaporates near-instantly on contact with the surface.51
1.5.4. Dip coating
Dip coating particles onto a substrate is a simple method: as a surface is lifted out of a solution,
a thin film will also be lifted out of the bulk solution. Mostly the solution will drain back into the
bulk, but a portion of the film will dry on the surface; any particles still in solution will be deposited
on the surface. This method can be repeated to build up denser films.53 Several very good studies
have been done on this subject, as the nature of sol-gel dip coating has been studied extensively.
Brinker et al make good arguments about the nature of the dip-coated film53. The parameters which
influence the deposition include the concentration of the particles in the bulk solution, the viscosity
of the solution, the withdrawal rate, and any surface modifications done to the surface. By the
nature of the system, these parameters will include the forces which govern this relation: viscous
upward drag of the liquid; gravity drawing the solution back down; surface tension in the meniscus;
the surface tension gradient along the length of the film; and the pressure in the film (the latter few
hold more pertinence in sol-gel films where these effect pore formation/film collapse). 53

18
2. Materials and Methods
2.1. Chemicals
Name Abbreviation Chemical formula Supplier Grade
(1,2-dipalmitoyl-sn-
glycero-3-phospho-(1'-
rac-glycerol) (Sodium
Salt) DPPG C38H74O10P Na
Avanti Polar
Lipids >99%
(1,2-dipalmitoyl-sn-
glycero-3-
phosphoethanolamine DPPE C37H74NO8P
Avanti Polar
Lipids >99%
1,2-dioleoyl-sn-glycero-
3-phosphocholine DOPC C44H84NO8P
Avanti Polar
Lipids >99%
3-Aminopropyl
trimethoxy silane APTMS H2N(CH2)3Si(OCH3)3 Sigma 97%
Chloroauric acid HAuCl4 3H2O Sigma 100.00%
Chlorophorm CHCl3 Alfa Aesar
Ethanol EtOH C2H6O
Commercial
Alcohols 95%v/v
Ethylene Glycol EG HOCH2CH2OH Sigma
99.8%,
Anhydrous
Hydrogen Peroxide H2O2 Anachemia 35%
Methanol MeOH CH3OH
Commercial
Alcohols 99%
Polyvinyl Pyrrolidone
(MW=40 000) PVP (C6H9NO)n Sigma
Rhodamine B labelled
DPPE RhB C64H105N4O14PS2
Avanti Polar
Lipids
Silver Nitrate AgNO3 AgNO3 Sigma >99.0%
Sodium Chloride NaCl Bioshop
Sulphuric Acid H2SO4 Anachemia
Trimethyl aluminum TMA (CH3)3Al Sigma 97%
trisodium citrate citrate
HOC(COONa)CH2COONa)2
2H2O BDH Inc
2.2. Polyol synthesis of silver nanowires
The polyol synthesis is an established method of reducing chemical species in solution;
this is a method which makes use of a solvent, such as ethylene glycol (EG) which also acts as a
reducing agent.54 Use of the polyol method for the production of silver nanostructures, including
wires was demonstrated more recently55 and has been thoroughly described.56 If the solvent used

19
is EG then the dominant mechanism is the thermal oxidation to form a glycolaldehyde in the
presence of oxygen which then reduces the metal species.57
It is known that a capping agent, introduced during metal salt reduction will prevent
aggregation of particles, and can influence the final shape of the particle. The use of
poly(vinylpyrrolidone) (PVP) will support specific shapes of silver particles depending on the
twinning of the initial seed;55 and by tuning the preferred seed type one can controllably produce
cubes, wires, and other shapes. Recently a study was done in order to determine the effects of
several parameters on the synthesis of silver wires:56 the studied parameters include temperature
of EG, stirring rate, rate of AgNO3 addition, PVP:AgNO3 ratio, and the NaCl (etchant)
concentration.
When silver is first reduced in the solution, particles will form, many of these will form
into non-single crystal seeds; silver nanowires commonly have a fivefold twinning. Once seeds
form, the PVP will coordinate on the surface of the {100} face (silver is a face centered cubic
structure). This means that exposed faces will have faster deposition of Ag0 from solution; as the
exposed faces grow the seed will grow into a wire55,56.
Silver nanowires were prepared through the polyol method55, in a general synthesis 15 mL
of anhydrous ethylene glycol containing 0.5 g Polyvinylpyrrolidone (MW = 40,000 g/mol) and 1.4
mg NaCl would reflux at 150oC for 1 hour; a solution of silver nitrate in ethylene glycol would be
added (5 mL containing 0.1 g AgNO3). The reaction would be performed with magnetic stirring
under normal atmospheric conditions and would be allowed to proceed towards completion by
leaving the flask for 45 minutes after the end of the silver addition before removing from heat and
stirring. The particles would be isolated through repeated centrifugation (6000 g) and dispersed
into ethanol (95%) through sonication.

20
2.3. Deposition
2.3.1. SAM deposition
Self-assembled monolayers were used for initial studies and were prepared by first
cleaning the fibre surface with piranha (1:5 H2O2:H2SO4), and after extensive rinsing submerging
the fibre in a 1% solution of APTMS in methanol for 15 minutes. After the allotted time the
fibres were rinsed thoroughly with methanol, water and then ethanol before being placed in a
solution of silver particles
2.3.2. LB deposition
AgNW were deposited on the fibres through the Langmuir-Blodgett method which is a
technique where the particles are floated on a sub phase, with surface density controlled by
changing the available area. A Teflon trough with a mobile barrier was used, with water as a sub
phase. To deposit the AgNW on the surface they were transferred into chloroform (through
centrifugation and dispersion, drying in a small scintillation vial, and final dispersion in 100 µL of
chloroform with 10 µL of ethanol with 1mg/mL DOPC) and were added drop wise to the surface
of the water. The chloroform was given 20 minutes to evaporate before any depositions occurred.
Depositions were carried out at a high surface pressure to induce a dense monolayer.
2.3.3. Spray coating
Spray coated slides were prepared by placing a clean glass slide on a heated surface (90oC) so
that the ethanoic solution would dry rapidly. An aerosol of AgNW was produced by a Nalgene
aerosol spray bottle, each pass of spraying the slide was carried out over approximately ½ second.
Sample concentration was controlled by varying the number of passes before removing the sample
from the heat source.

21
2.4. Optical Fibre Mirror
TFBG were modified after being prepared and cleaved by having a mirror deposited on
them. This was done by first depositing gold seeds58 and then by reducing gold acid onto the
surface59. Seed particles were prepared by well-established methods: 1 mM HAuCl4 in deionised
water was mixed into 500 mL deionised water and brought to a boil, at this point 50 mL of 38.8
mM trisodium citrate solution was added. Once the solution turned deep red it was allowed to cool.
Seeds were deposited on the terminal cleave of fibres through 3-aminopropyl trimethoxysilane
(APTMS); fibres were cleaned, thoroughly rinsed with methanol, and then the last portion was
submerged into 1%v/v APTMS (in methanol) for no less than 5 minutes. After being removed from
the APTMS solution, fibres were rinsed with methanol, then water before being exposed to gold
seeds. APTMS coated fibres were submerged into a portion of the synthesised seeds for no less
than 5 minutes. Upon removal, fibres were rinsed with water and then submerged in an aqueous
solution of gold acid (~2-5%) and hydrogen peroxide (~30%) to create a film of gold
2.5. Atomic Layer Deposition
Samples of AgNW on glass slides were selected to study two parameters of SEF; variations
in separation and variations in population. The samples that were used in Section 3 were separated
into these two categories, with three samples with comparable population for use in the former and
the rest used, or held in reserve to study the latter. Samples were coated with alumina using
alternate pulses of trimethyl aluminum (TMA), and water with purging between; deposition
occurred at 200oC. An electron microscope grid was coated with small silver nanoparticles and
placed in the reactor with the slides to observe the film thickness (Figure 7).

22
The samples were subjected to 30, 60, and 120 cycles of TMA/water to create growth
which was found to provide films of 4.9±0.7 nm, 7±1 nm, and 14±1 nm films. There was no reason
to suspect that the silver nanowire films would differ from the colloidal silver as both sets of
samples are passivized with PVP, the purpose of these samples is only to measure the thickness of
deposited films. Once a maximum SEF was seen for a given thickness, the remaining samples
were coated with the same thickness.
2.6. Fluorophore Deposition
Rhodamine B (RhB) was selected for use as the fluorescent label, which has spectral
overlap with the AgNW spectra; so interactions between the surface and fluorophore were
expected. The use of RhB tagged lipid allowed for the controllable deposition such that a consistent
concentration was deposited; additionally a section of the AgNW sample was cleaned prior to ALD
so that each sample had an internal control for comparison. In this manner the SEF could be
determined.
Fluorescent labelling was achieved through the deposition of a 0.5% Rhodamine B labelled
lipid solution of DPPG (1,2-dipalmitoyl-sn-glycero-3-phospho-(1'-rac-glycerol) (sodium salt))
through a Langmuir-Blodgett technique at high pressure (20 mN/m)
The setup allowed for the assay to be performed with propagating and evanescent light
through the introduction of a prism (Figure 8).
30 60 120
Figure 7: TEM images of silver particles coated with Alumina; the number in each box indicates the number
of TMA/water cycles the samples were exposed to. Several images were measured to find the thickness.

23
2.5. Characterization
2.5.1. AFM
Physical characterization of AgNW and SiO2 depositions were carried out on an AFM
(Ntegra NTMDT). During fibre depositions, glass slide analogues were also prepared for
characterization by AFM.
2.5.2. UV-Vis-NIR
A Varian CARY 7000 UV-Vis-NIR spectrophotometer was used to observe solutions and
slides. For total internal reflection spectroscopy the universal measurement spectrophotometer was
used at 45o with a prism and optical gel.
2.5.3. SEM
The Carleton University Nanoimaging facility provided scanning electron microscopy on
a Tescan Vega-II XMU VPSEM, operating in backscattering mode. For samples that were not
coated with a conductive film, a small pressure (5 Pa) of nitrogen was introduced.
Figure 8: Fluorescence set up; (1) a laser is coupled through (2) mirrors and a filter (3), focused through a
pair of lenses (4) before an aperture (5). For observations of fluorescence due to evanescent excitation a
prism (6) was placed with optical gel before the slide (7). Fluorescent light passed through a second filter
(8) to remove any laser light before being captured by a camera (9) which was connected to a laptop running
a custom Labview program.

24
3. Ex Situ Heating Observations of AgNW on slides
Glass slides spray coated with AgNW were used for testing the thermal evolution of silver
nanowires with external heat measurement through use of an IR camera. Silver nanowires were
deposited on glass through spray deposition on a heated substrate to produce films. These were
used to determine the relationship between the population and thermoplasmonic heat generation;
since this was a preliminary study no heat flow modelling was done and so results are in terms of
temperature and not efficiencies. The glass has a constant emissivity regardless of sample
population it was presented to the IR camera for propagating experiments, while the wire surface
was by necessity monitored for the evanescent heating experiments (this required the calibration of
the emissivity of the slides). This chapter will cover the experiments of AgNW on slides for the
generation of heat.
3.1. Thermoplasmonics
Thermoplasmonics is the production of heat from the resistance experienced by the
oscillating electrons of a plasmon (recall Section 1.2); for metallic particles, such as silver
nanowires, this is due to Joule heating, which is a result of Ohmic losses in the particle.60
Thermoplasmonics have been studied for many particles, and in great depth; in a recent study of
gold nanoparticles the efficiency of the conversion of absorbed light to heat was observed;
ultimately their results were delivered with consideration to the number of particles; they reported
on resonant excitation of gold nanorods yielding 95% conversion efficiency.61 This is one possible
fate of an excited plasmonic mode: plasmons can be coupled to other materials/molecules resulting
in a transfer of energy (this is used in enhanced fluorescence among others)62,63 or the plasmon can
propagate to the end of the particle and be expelled as scattered light (this has been observed
through several means, including near field imaging).64 The thermoplasmonic effect has been
studied in both ultra-fast single particle settings and in bulk film.60,65 Transient absorption
spectroscopy performed by Hartland and Xia (a technique which allows for the spectroscopic

25
determination of surface vibrations associated with heating) corroborated both the near field
imaging and EELS imaging; their work showed a higher degree of absorption of NIR light at the
ends of the silver wire, which EELS showed to be the region in which the lowest energy (and order)
SPP mode is located and the same region which near field imaging shows scattering (the same
mechanism which causes the scattering also absorbs the light – namely the localization of the SPP
mode).18,19,64,65 In the case of bulk films, silver nanowires were deposited on a slide and irradiated
with broadband irradiation and were observed to weld together within two minutes of irradiation;
this welding was different than from bulk heating, as less than 60 seconds at 200-300oC on a
hotplate caused melting and coalescence into islands of silver.60
Thermoplasmonics of silver nanowires has not been explored thoroughly, but a closely
related form of heating has been: heating through direct electrical stimulation of silver nanowire
films.66,67 Such films have been shown to be robust (a PET/AgNW/Carbon nanotube layered
structure withstood 2000 cycles each exceeding 100oC with less than 1% change in efficiency),67
and tuneable based on AgNW population.66,67 The welding which was seen with optical excitation
is also seen in electrically induced Joule heating.68 That the same phenomena are observed from
both types of excitement is expected, as both are results of the same effect (moving electrons
through AgNW) with the only difference being the source (light/SPP or external electrical
excitation) and location (localizes in SPP, and across the network in the electrical systems).69

26
3.2. Preliminary study
In this study, AgNW synthesised through the polyol method (as per Section 2.2) were
deposited by spray coating glass slides. Slides were excited by an erbium pump as a source; an IR
camera was used to monitor the temperature of the substrates (as per Figure 9).
Slide preparation was done with use of a Nalgene spray pump using an ethanoic solution
of AgNW. Slides were cleaned with piranha prior to use, and then placed on a hotplate (set with a
thermocouple placed on the surface to provide a ~90oC surface) for spraying. The hotplate required
a change to the set up because the temperature is presumed to have gone too high resulting in the
melting of the wires which was seen on the SEM (the set up was improved and the temperature
lowered for the second round of experiments which included TIR excitation). These slides had
their spectra taken (Cary 7000 UV-Vis-NIR) to allow the correlation of heating to the emissivity;
later the slides would be imaged using an SEM (Tescan Vegall XMU SEM) so that the surface
population could be determined.
Figure 9: Schematic of the set up used for observing the heating of a glass slide though NIR illumination. The Animonix
1550 nm pump (A) which is fibre coupled (B) such that it diverges onto the surface of the slide which is coated with
silver nanowires (C), a prism was used to achieve TIR conditions for evanescent excitement; this is monitored by the IR
thermal imaging camera (D)
27
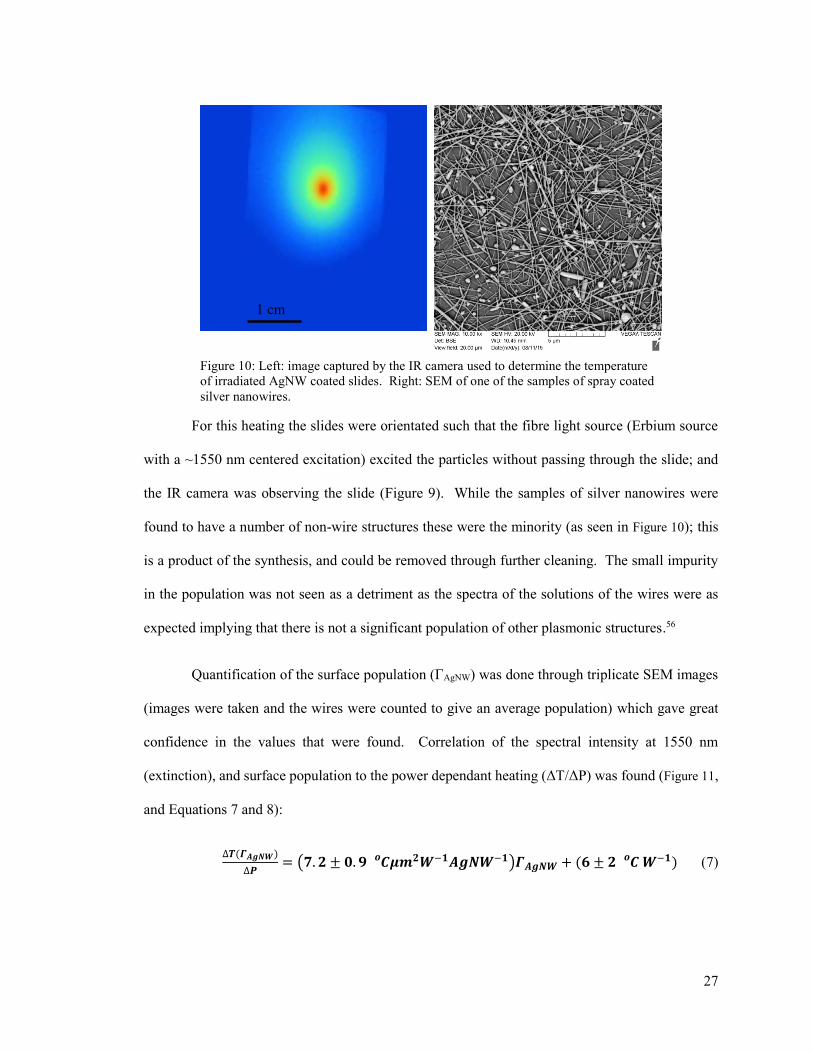
For this heating the slides were orientated such that the fibre light source (Erbium source
with a ~1550 nm centered excitation) excited the particles without passing through the slide; and
the IR camera was observing the slide (Figure 9). While the samples of silver nanowires were
found to have a number of non-wire structures these were the minority (as seen in Figure 10); this
is a product of the synthesis, and could be removed through further cleaning. The small impurity
in the population was not seen as a detriment as the spectra of the solutions of the wires were as
expected implying that there is not a significant population of other plasmonic structures.56
Quantification of the surface population (ΓAgNW) was done through triplicate SEM images
(images were taken and the wires were counted to give an average population) which gave great
confidence in the values that were found. Correlation of the spectral intensity at 1550 nm
(extinction), and surface population to the power dependant heating (ΔT/ΔP) was found (Figure 11,
and Equations 7 and 8):
∆𝑻(𝜞𝑨𝒈𝑵𝑾)
∆𝑷= (𝟕. 𝟐 ± 𝟎. 𝟗 𝑪𝒐 𝝁𝒎𝟐𝑾−𝟏𝑨𝒈𝑵𝑾−𝟏)𝜞𝑨𝒈𝑵𝑾 + (𝟔 ± 𝟐 𝑪𝒐 𝑾−𝟏) (7)
Figure 10: Left: image captured by the IR camera used to determine the temperature
of irradiated AgNW coated slides. Right: SEM of one of the samples of spray coated
silver nanowires.
1 cm
1 cm

28
∆𝑻(𝑻%)
∆𝑷= (𝟎. 𝟕 ± 𝟎. 𝟎𝟕 𝑪𝒐 𝑾−𝟏)𝑻% + (𝟔𝟏 ± 𝟑 𝑪𝒐 𝑾−𝟏) (8)
3.3. Second Study
Additional samples were prepared (with alternate placement of the thermocouple during
spray coating – no melting was observed in the SEM micrographs), and the above established
relations were used to determine the populations (the extinction and heating data from the
preliminary test was used to produce the populations shown in Table 2); a population for a blank
was also done to show the validity of the trends (the blank was found to be -0.3±0.7 AgNW µm-2
which is a valid value for a zero sample).
Samples were heated (with wires facing the camera) to determine the emissivity of the
samples (the intensity of IR light emitted with increased temperature, Figure 12, left); which was
then used to determine the actual heating of the wires through evanescent excitation. The emissivity
of the slides was determined by comparing the temperature reading for the nanowire covered
portion of a slide with the bare portion (which has a known emissivity); this showed a trend where
the bare slide had an emissivity of glass (taken to be 0.8) and then decreased; this predicts that it
would take a population of approximately 15 AgNW µm-2 to achieve an emissivity equivalent to
bulk silver (0.02-0.03 for polished silver).70 Once the emissivity was known (Figure 12, Left) it
Figure 11: (Left) heating and (Right) extinction as functions of surface density as determined through SEM
measurements.

29
was possible to apply this to the measurements of the temperature to find the actual apparent
temperature (Figure 12, Right).
Slide Number Population
[AgNW µm-2]
3 9.6±2.6
2 9.2±0.9
1 7.6±0.5
5 5.3±0.8
4 5.1±0.5
8 4.4±0.3
9 4.2±0.3
7 4.1±0.3
6 4.0±0.3
12 3.5±0.3
11 1.8±0.6
10 1.8±0.1
Table 2: populations of the slides
used in the second slide heating
experiment

30
The linear trend of the evanescent heating results in a trend which is comparable to the
propagating light trend for these slides; 6.0±0.7 oC AgNW W-1 µm-2 for the evanescent excitation
(wires facing the camera), and 6.1±0.4 oC AgNW W-1 µm-2 for propagating excitation (slide facing
the camera). While this trial found slightly different results for the thermoplasmonic heating under
propagating light (from the preliminary study, Equation 7), the extremes of the values overlap, and
the second trial had two advantages: a larger range on the surface population which should increase
the accuracy of the measurements, and no damage to the wires on the surface (later confirmed with
SEM, an example of which is seen in Figure 10).The determoined populations are thought to be
slightly biased high for the samples above the 5 AgNW/µm2 as this is above the calibrated range
(bias is suspected due to slightly negative value given for a blank slide).
When the TIR attenuation measurements were taken (Figure 13) it was apparent that the
system was sensitive to polarization. These images were taken by setting the slides on a 45o prism
with refractive index matching gel in the CARY 7000 UMA. This was to be expected as the s (0o
in Figure 13) polarization has only in-plane components to the evanescent mode, while the p (90o
in Figure 13) polarization has only out of plane electric field components (recall Figure 2). It is seen
that there were three regimes present in the spectra of the wires: high population (3, 2, and 1) which
Figure 12: Left: Calibration of apparent temperature of each slide was used to determine the emmisivity of
AgNW coated samples. Rgiht: Apparent temperature for silver nanowire surfaces.

31
demonstrated a change in intensity but not significant change in the presented modes; middling
population (5, 4, 8, 9, 7, and 6) which showed changes in the modes observed in the spectra (three
of these samples show a distinct mode in the NIR which was only seen in s polarizations, the others
either show this in a lesser degree, or show other modes); or the low population (12, 11, and 10)
which did not show significant change in the modes (although 11 does show an s specific mode).
The absorption at 800-1200 nm which was seen in several of the samples (specifically the
middling populations) corresponds somewhat to the transverse mode absorption seen in singular
wires and in aggregate rafts.64,65 This may be the source of the attenuation; and would be supported
by the lacking of this mode in the p spectra; however that this as not seen at lower populations (10
and 12) contradicts this conclusion as such attenuation would be expected to be seen with isolated
wires. A series of films monolayers were prepared using LB to try and reproduce this mode with
no success. It was due to these uncertainties that the NIR mode cannot currently be assigned. These
modes do however correspond approximately to the scattering modes seen in rough thin silver films
which are electrically stimulated.71
At low populations we see greater interaction between the NIR light which is polarised in
plane (s) rather than perpendicular modes (p); this is expected as this is the direction which can
stimulate the SPP modes in the wires. Visible light interacts with the transverse mode of the wire
which is accessible by both polarizations of light. In contrast, the high population samples interact
with the perpendicular light more than the in plane light. This is also expected from attempts to
excite a continuous film (the electric field must be perpendicular to the continuous film); however
as there is no pronounced mode apparent it may be premature to identify this as an SPR interaction.
The heating and scattering from s polarized light is dependent on the absorption of light by the
nanoparticle. The scattering of p polarized light is due to the nanoparticles acting as a thin, rough,
discontinuous metal film where the phase matching conditions (which govern what light can excite

32
the SPP) become non discreet (allowable momenta, k, are modified by the grating period, Λ, which
is not a consistent value and so the momentum becomes a range, Equation 9).72
𝑘𝑠𝑝 = 𝑛𝑘0𝑠𝑖𝑛𝜃 ±2𝜋𝑚
𝛬 (9)
Where the index of refraction is n, and m is an integer. The implication of this is that for a rough,
inhomogeneous film the phase matching conditions are less important as the gaps make previously
disallowable excitations possible. The optical attenuation is inconclusive as to the cause of the loss
of reflected light; further study or modelling would be advisable to determine the nature of the
interaction.

33
The TIR induced heating can give insight into the nature of heating, and allows for an idea
of the magnitude of the interaction of the wires with light. This can be of great use when examining
a device which is on an optical fibre, through which the primary source of optical light is
evanescent.
Figure 13: Colour contour graphs showing TIR change with polarization. Numbers correspond to slide
identity; the images have been ordered based on population (descending). Images depict the TIR spectra,
and so a lower value indicates greater attenuation of the signal. 0o corresponds to s, while 90o to p.

34
4. In Situ Heating Observations of AgNW on Fibres
The use of a fibre with a TFBG or TII allowed for excitation of the film, and simultaneous
localized measurement of the temperature. With COMSOL simulation the efficiency could be
determined. It was seen that there was saturation in the efficiency (η→1) with increasing the surface
population (ΓAgNW) through the addition of multiple layers of AgNW (Langmuir-Blodgett, LB
deposition).
4.1. Heat Flow
The functional film was made by depositing AgNW on the TFBG containing fibre using
LB; and heating was studied while the coated TFBG was contained in a cylindrical capillary filled
with water. It is important to understand the heat flow out of the proposed system so that the
efficiencies can be compared. Once the device had been excited it entered into a steady state where
the heat generated by the film (qin) was equal to the heat leaving the capillary (qout) to the
surrounding environment (so it reaches a stable Tmax and so qin=qout), it is under this condition that
the thermal conversion efficiency can be determined. Heat flow calculations, determinations and
simulations were done by Dr. Hubert Jean-Ruel in the greater collaboration with Dr. Jacques Albert.
The heat flow into the system is given by the power which reaches the nanowire film
modified by the efficiency of the conversion of light energy to heat.
𝜼 = 𝝌𝒒𝒐𝒖𝒕/𝑻 (10)
𝝌 =𝜟𝑻𝒐𝒃𝒔
𝜟𝑷𝑪𝒐𝒖𝒑𝒍𝒆𝒅 (11)
The heat flow out of the system is through radiation, conduction, and convection; and of these three
conduction is the most significant (convection is limited by the size of the structure and so is
assumed to be 0, radiation is calculated by the Stefan-Boltzmann law and was found to be 2.4
µW/oC and so is insignificant). The Stefan-Boltzmann law calculates the radiation heat transfer
from a perfect back body (qrad) at a temperature (Tb) in an enclosure (Te).73
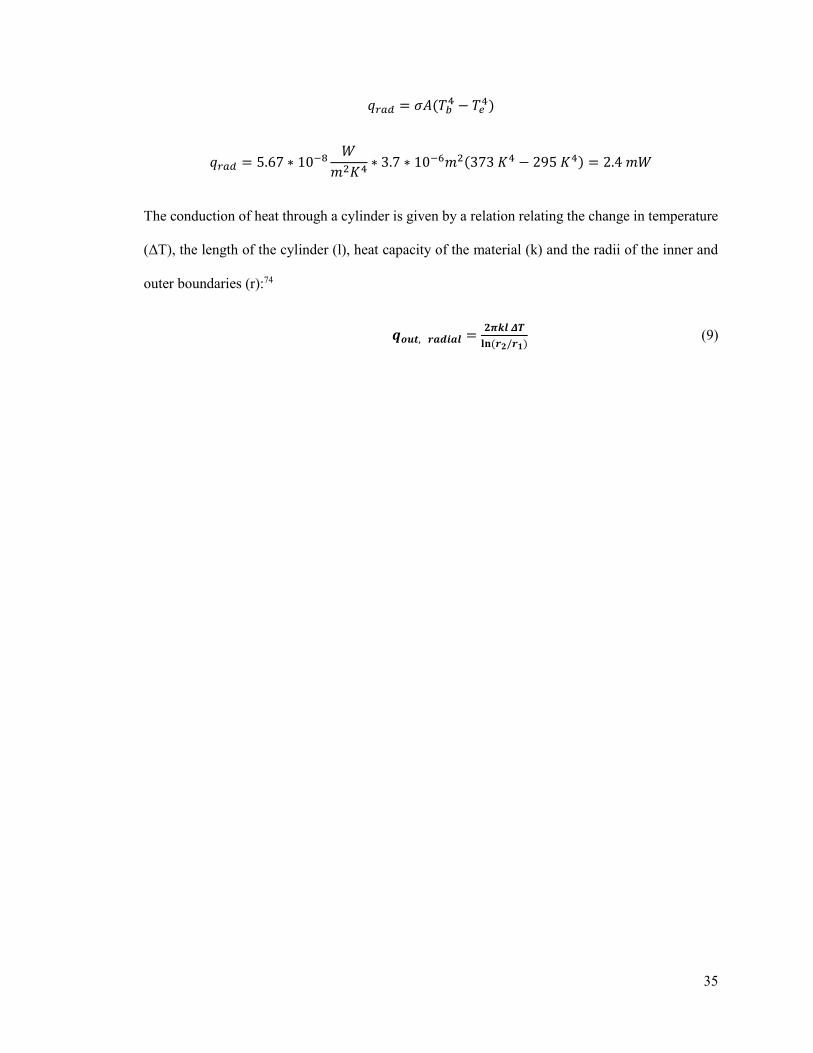
35
𝑞𝑟𝑎𝑑 = 𝜎𝐴(𝑇𝑏4 − 𝑇𝑒
4)
𝑞𝑟𝑎𝑑 = 5.67 ∗ 10−8𝑊
𝑚2𝐾4∗ 3.7 ∗ 10−6𝑚2(373 𝐾4 − 295 𝐾4) = 2.4 𝑚𝑊
The conduction of heat through a cylinder is given by a relation relating the change in temperature
(ΔT), the length of the cylinder (l), heat capacity of the material (k) and the radii of the inner and
outer boundaries (r):74
𝒒𝒐𝒖𝒕, 𝒓𝒂𝒅𝒊𝒂𝒍 =𝟐𝝅𝒌𝒍 𝜟𝑻
𝐥𝐧 (𝒓𝟐/𝒓𝟏) (9)
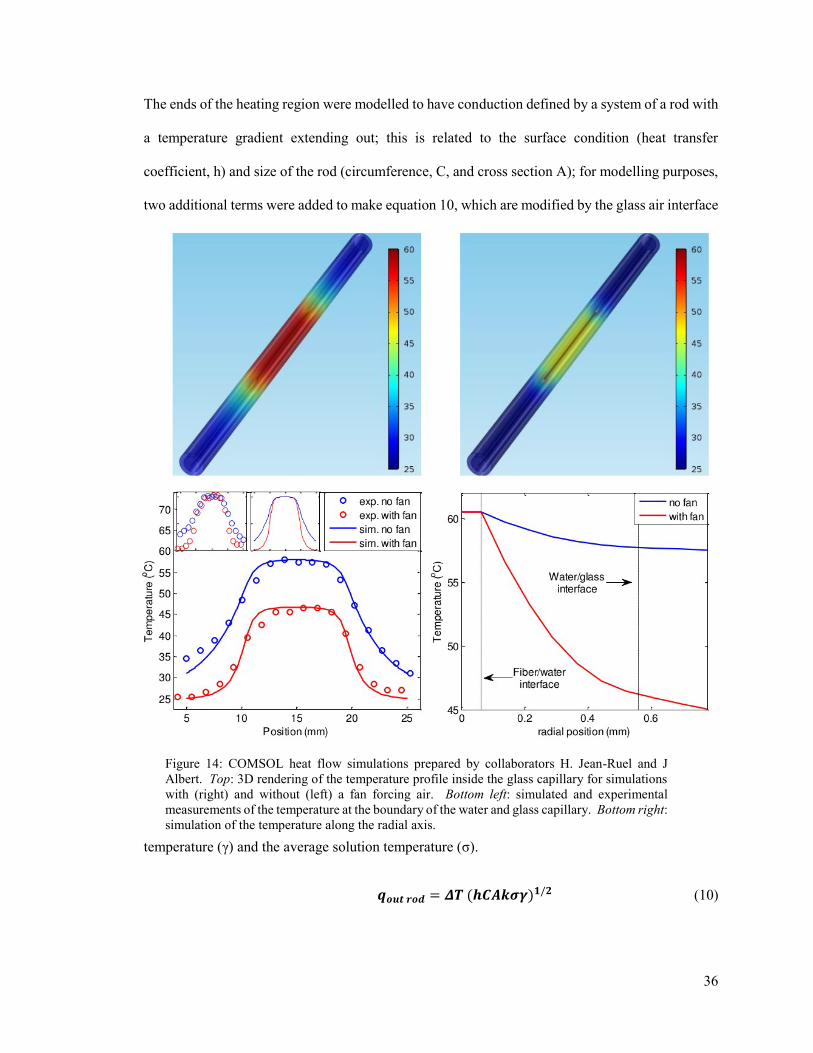
36
The ends of the heating region were modelled to have conduction defined by a system of a rod with
a temperature gradient extending out; this is related to the surface condition (heat transfer
coefficient, h) and size of the rod (circumference, C, and cross section A); for modelling purposes,
two additional terms were added to make equation 10, which are modified by the glass air interface
temperature (γ) and the average solution temperature (σ).
𝒒𝒐𝒖𝒕 𝒓𝒐𝒅 = 𝜟𝑻 (𝒉𝑪𝑨𝒌𝝈𝜸)𝟏/𝟐 (10)
Figure 14: COMSOL heat flow simulations prepared by collaborators H. Jean-Ruel and J
Albert. Top: 3D rendering of the temperature profile inside the glass capillary for simulations
with (right) and without (left) a fan forcing air. Bottom left: simulated and experimental
measurements of the temperature at the boundary of the water and glass capillary. Bottom right:
simulation of the temperature along the radial axis.
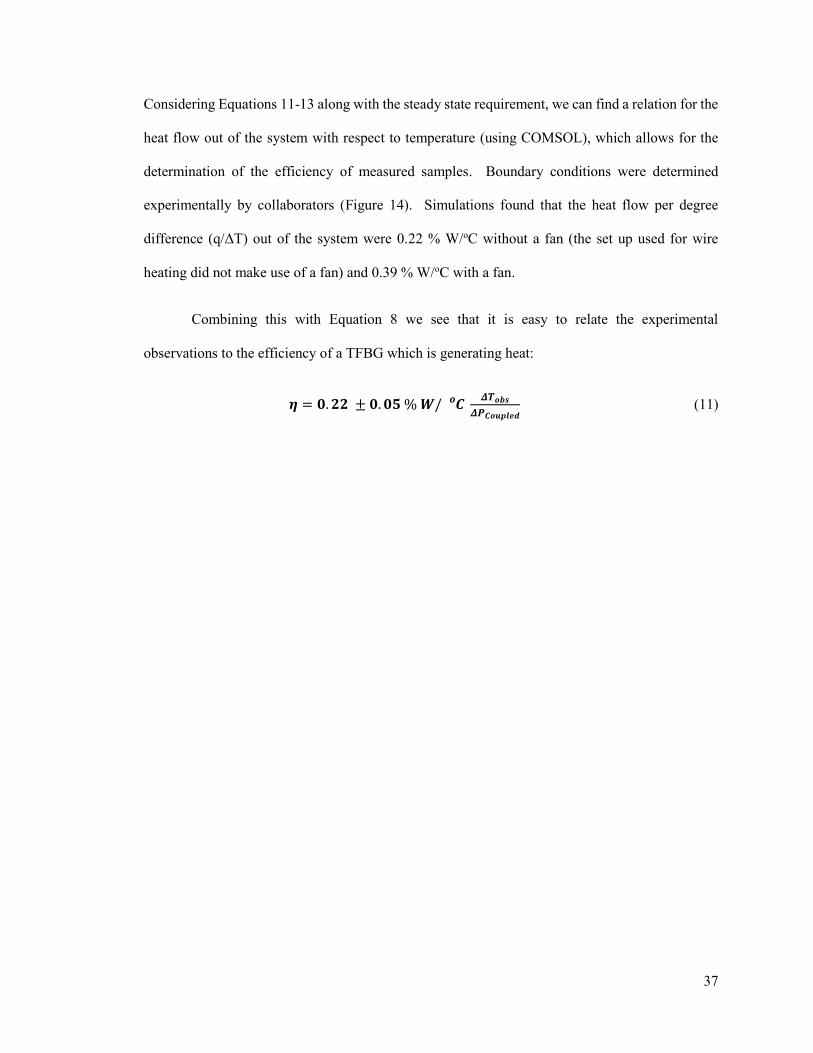
37
Considering Equations 11-13 along with the steady state requirement, we can find a relation for the
heat flow out of the system with respect to temperature (using COMSOL), which allows for the
determination of the efficiency of measured samples. Boundary conditions were determined
experimentally by collaborators (Figure 14). Simulations found that the heat flow per degree
difference (q/ΔT) out of the system were 0.22 % W/oC without a fan (the set up used for wire
heating did not make use of a fan) and 0.39 % W/oC with a fan.
Combining this with Equation 8 we see that it is easy to relate the experimental
observations to the efficiency of a TFBG which is generating heat:
𝜼 = 𝟎. 𝟐𝟐 ± 𝟎. 𝟎𝟓 % 𝑾/ 𝑪𝒐 𝜟𝑻𝒐𝒃𝒔
𝜟𝑷𝑪𝒐𝒖𝒑𝒍𝒆𝒅 (11)

38
4.2. Heating in Water
Using fibres which were prepared through LB of AgNW on the surface of TFBG
containing fibres which have a mirror on the terminal cleave, the heating efficiency of devices
could be determined. While there will be the Joule heating from the individual wires, additional
effects may come from the SPP in the wires behaving as a continuous film (which differs from the
SPP of the individual wires, this is caused by either coupling between individual wires, or by acting
as a rough thin film of silver).75 It is know that a rough metal film will aid in coupling light out of
a fibre and into the surrounding materials (provided the film has not become a reflective surface);
so by placing the fibre in water, which has a high absorption in this spectral range,76 it is expected
that heating should occur.
Using equation 14 and a calibration for peak shift with temperature, it was possible to
excite the AgNW with light from the pump and quantifiably determine the efficiency (Figure 15,
Figure 18); the set-up is depicted in Figure 17. Both SEM and AFM were used to determine the
state of the surface at the termination of the experiment (Figure 16), it was found that a single layer
Figure 15: Left: Bragg peak intensity from a fibre during heating. Fibres were calibrated and showed that the peak shifts
at 10.5 pm/Co. Right: The calibration was used to determine the ΔT/ΔPin during excitation (where the power into the fibre
takes into account the efficiency of the couplers used in the setup).

39
would provide a film between 4 and 5.2 AgNW/µm2, with some wire stacking. It was noted that
when the samples were resubmerged into the LB trough, some if not all samples experienced a
degree of delamination of the film and so no quantification of the effect of the population was
performed. Delamination would result in partially collapsed monolayers and therefore was the
attributed reason for the presence of multilayers. Samples were tested with no wires, then with a
single layer, and then with multilayers; When the efficiency of the system was considered it was
found that the fibres showed distinct difference when coated or not, with less of a difference
between the single and the multi layered systems (Figure 18); the bare fibres provided an efficiency
of 47±5%, while coating provided 85±13% and 100±20% for single and multilayered samples.
Figure 16: Left: SEM image (Tescan Vegall XMU) of a fibre with multiple layers of AgNW, the damage seen in this
image is due to mounding the fibre for imaging. Right: AFM phase contrast image, the edge of the image is 2.5 µm.

40
The deposition of the wires showed that even a small amount of wires greatly increased
the efficiency of the heating through optical stimulation. The sources of the heating was a
combination of the film generating heat, and the water absorbing the light and heating directly but
were conclusively enhanced by the presence of the film. To determine the route of the heating a
study of the modes with polarised light would be needed, as this would interrogate on which mode
is better converted to heat (the tangential modes of light will couple to the SPP modes of the wires,
while the radial and to a lesser extent the tangential modes of light would couple into the film and
water).77
It is reasonable that such a high efficiency was seen in this system. The light which was in the
cladding modes would couple to the film and scatter out (to be absorbed by the water) or propagate
through the cladding (where there is little attenuation) and so remain available to the film. With a
sufficiently dense film the light was fully converted into heat. Loss of light energy could only
occur if the light left the system (scattered out and was not absorbed by the water, reflected into the
fibre and remained in the cladding), or if light absorbed by the wires was converted into something
other than heat. For the former light that remained in the cladding could be extracted later by wires
(along the fibre) or can excite the water directly. It was seen that little if any light escaped the
system; however such interactions may occur sufficiently far from the FBG so as to be unobserved.
There are few means for the wires to express absorbed light other than heat or scattering. There are
Figure 17: Set-up for heating fibres; where polarized broadband light is passed through the system so that
spectra can be taken at a given polarization, while an EDFA pumped seed laser is coupled independently
into the system so that the fibre device can be excited. All connections between devices are by fibre optic
cable, and the final fibre device is here labeled as fibre

41
particles which have been reported to fluoresce,78 or to up/down convert light79 but wires have not
been reported to do so. Another phenomenon which can occur, if there is a fluorophore or other
light active structure (particle, or molecule) which is near the surface then the energy can transfer
through non-radiative means;80 however, in this study as there was no such structure near the
surface (aside from PVP, water, and glass) so there should be no such energy transfer. Having
excluded alternate means of plasmon decay, logically any such light energy which was absorbed
by the particle will decay as heat or scattered light. It has been shown that a TFBG coated in a
sufficiently dense film of AgNW will act as high efficiency heaters when submerged in water.
Figure 18: Efficiency of the fibre device in a capillary of water, the fibres were tested without wires, after a single
dip into the LB film, and then after several dips through the film to produce multilayered coatings. Individual results
are shown (points)) along with the average (bar) for each regime (none, single, and multi layered);

42
4.3. Silver Nanowire Melting: Preliminary Study
Since the use of a TFBG allows for the thermal monitoring and excitation of an AgNW
film is known to generate heat, an AgNW coated TFBG was used to study the melting temperature
of the silver wires. It was connected to the set-up but not immersed in water; instead it was placed
in the center of a 15 mL centrifuge tube (the grating was approximately in the center of the tube)
to prevent external air currents from compromising results. The erbium pump was used to
illuminate the grating for 30 seconds after the temperature stabilized, the Bragg peak was analysed
to determine the temperature of the fibre. Spectra of the TFBG were used to monitor cladding
mode depth to determine the effect the heating had on the AgNW thin film. Given that the nature
of a thin film can be probed by the use of a TFBG, it follows that if the film were to change state
(to melt), this would be observable. The use of TFBG sensors to monitor changes in the index of
refraction is well known.14 Should the temperature be sufficiently high (~200-300oC) then the wires
will melt60 and this will result in changed in the nature of the film which will be observable through
permanent changes to the TFBG spectra.
It has been reported that use of NIR light will cause the wires to weld together, which was
reported as self-limiting, the efficiency of heat generated by the junction of two wires that are
overlapped and perpendicular has a maximum when the wires are just in contact, and rapidly drops
off once they have begun to combine.60 Such welding would change the conductivity of the film in
the radial dimension which will change the energies and intensities of the cladding modes.
A fibre was prepared for this preliminary study, to observe the feasibility of using internal
excitation to heat the wires sufficiently such that they would melt, and if it was observable through
observation of the cladding modes. This fibre was connected to a BBS, polariser and OSA in
reflection, and had a gold mirror on the terminal cleave. It was then submerged into a solution of
silver nanowires and had the reflection spectra recorded for both s and p polarized light. After this,

43
unpolarised light at 1550 nm was used to excite the film (a BBS and polariser controller, PC, were
connected to a set-up which had a 1550 nm seed laser connected to an erbium doped fibre amplifier
(EDFA), all of which was connected to the OSA through reflection, Figure 17). In total the fibre
was dipped 75 times, which had the population estimated through a brief calibration of population
with respect to number of dips for the same solution (Figure 19), assuming a linear trend the
estimated population would be on the order of 40 ± 7 AgNW µm-2. This is a very inaccurate
estimate, the number of dips is outside of the calibrated range, and delamination may occur,
additionally, the trend may not be linear, but may instead saturate; this is only done to give a rough
idea, and to know that there is a significant amount of wires on the surface.
The fibre placed in the center of a 15 mL centrifuge tube was excited by having the laser
pumped for 30 seconds, the spectra of the Bragg peak was recorded to determine the temperature.
After the pump was disabled the spectra of the cladding modes was taken and the depth of the 1538
nm mode was monitored (Figure 20).
It was seen that there was a marked change which started to occur at 145oC and again at 207oC;
this was consistent with previously reported temperatures for wire melting. That both s and p began
by further attenuating, which mean that there is a change in the electrical properties both radially
and tangentially with respect to the surface of the fibre. After 207oC it was seen that there was a
Figure 19: Rough calibration of the population
with increasing dips used to make an
estimation of the population of dipped fibres

44
continued, and different regime; this region was poorly studied, as the experiment was concluded
when the terminus of the fibre began to burn (the gold mirror had suffered damage during fibre
production). The interactions at about 207oC could be indicative of metal island formation or the
development of a continuous thicker film as the wires near the surface melt. Given the estimation
of the population, and the size of the wires – 150 nm x 2-10 µm, we find that this estimated the film
thickness to be no less than 3 µm thick.
There was extensive change to the surface properties of the fibre between 145-207oC which
indicated change in the film`s electrical properties. While further study was needed, it was clear
that it was possible to determine the melting temperature for silver nanowires with the use of TFBG
fibres in the set-up as was used here.
Figure 20: Cladding depth for both s and p modes as the fibre was pumped. The
temperature corresponds to the temperature observed during pumping

45
5. Polarization dependent NIR Scattering of AgNW on a TFBG The metal nanoparticles that were deposited on the surface of the fibre have been seen to
maintain a scattering cross section; which at NIR wavelengths would be predominantly described
through Mie scattering,81 as would be expected from a rough metal film.82 Since the cladding modes
caused by a TFBG are sensitive to the refractive index (Equation 7), the addition of a
rough/inhomogeneous film of metal resulted in the attenuation of cladding modes and greater
scattering.77 It has been reported that the addition of a metal film on a fibre can result in a switch
of the s and p modes.83
The s mode of light (tangential) will not penetrate through a complete/dense metal film as
the electric field attenuates rapidly, but the p mode (radial) can propagate across the film if it is
sufficiently thin; additionally, both modes can scatter out of the fibre through the uncovered region
of the surface of the fibre.77 This implies that for a thin film of metal nanoparticles, excitation from
the p mode is expected to produce greater scattering than the s mode.
Plasmonically induced scattering from individual wires is expected to occur from s mode
light, as the electric field of the light would be aligned with wires and so could excite the SPP mode
of the AgNW. A study of the scattering of light compliments the study of heating as these two
components combined with the spectral data from the fibre will provide the significant interactions
of light.
The light which is reflected by the film, or not coupled into the surrounding media will be
characterized by strong cladding modes as seen in a bare fibre. 77 If the cladding modes are seen to
reform after an initial collapse then this is indicative of the development of a reflective film on the
surface of the fibre. It is with the use of the scattering data in combination with the data previously
discussed that a picture of the interactions of surface bound silver nanowires with light can be fully
visualized.

46
5.1. Scattering Measurements
Fibres were prepared by cleaning a cleaved fibre with a TFBG in ethanol, piranha, and
water before the deposition of a gold mirror (which was protected with ÅngströmBond DSM 950-
200, a commercially available UV cure methacrylate polymer). Fibres were then connected to an
OSA and mounted vertically; spectra of the p and s modes were recorded (Figure 22). Fibres were
dipped into an ethanoic solution of AgNW and had spectra taken for s/p polarizations while
immersed and once dry for each dip. Two fibres were prepared, one with 5 dips, and another with
10 dips. Before scattering measurements were taken the fibres were imaged on the SEM (mounted
so as to prevent any contact of the wire coated region with any surface, Figure 21).
Figure 21: Select SEM micrographs of the two fibres; on the left the fibre which was dipped
5 times, on the right the fibre which was dipped 10 times.

47
The coating was monitored through the cladding depth, and the mode position for both s and p.
Attenuation of the p mode (Figure 23) is attributed to directly coupling light out of the fibre (SPP
of the film rather than an SPP form a single wire) into the surrounding material, where allowable
modes (Equation 7) overlap. Since the Mie cross section is directionally dependent (due to the high
aspect ratio) the s mode will interact with the particle (Ex(λ), Equation 4).
Figure 22: Spectra of a cladding mode as the fibres were coated. Left column are p modes, while right
are s. Upper and lower pairs correspond to the two fibres (5 and 10 dips)

48
The peak shifts (Figure 22, summarized in Figure 24) showed a more reasonable trend,
where both the s and p modes shifted to higher energies indicating the presence of a low index
(metal) film. It is expected that the s and p modes may flip in energies (so that the s modes are at
a higher energy with respect to corresponding p cladding modes); 77 at 10 dips it was seen that the
energies of the s and p modes become degenerate indicating that this is occurring.
The two fibres showed different cladding mode collapses; and especially after being
imaged on the SEM (the fibre which had been put through 10 dips changed from having nearly the
same depth for the two orthogonal modes to having one mode with very collapsed cladding modes
Figure 23: Attenuation of the s and p modes with respect to the number of dips for the two fibres
tested. It is apparent that there are inconsistencies using the cladding depth.
Figure 24: Shifts of the cladding modes at the maximum depth, shifts were taken with respect to
the starting position of the p cladding modes.
49
(determined to be s based on shift) while the p mode had pronounced cladding modes (~3 dBm).
This indicates that the film changed after being exposed to vacuum and an electron beam.
Fibres were mounted under a microscope with a NIR camera; a BBS was used to supply NIR
light, and was first passed through a polarizer to allow for observation of scattering from the s and
p modes. The fibre with 5 dips appeared to be consistent along the length, while the 10 dip fibre
had variations in intensity for a given polarization along the length of the TFBG (the microscope
was brought into focus and an image was captured for each polarization before moving along the
length of the fibre - Figure 25, Figure 26), for this reason additional images were taken of the 10
dip fibre. The images were processed by taking the numerical sum of each image (black was
assigned a value of 0, increasing to saturation of the detector), and then dividing the p value by that
of the s for each image pair (σp/s, Figure 27).

50
By examining σp/s it is possible to compare the scattering of light out of the fibre by s and
p light. It is expected that for a film of discontinuous but closely packed metal islands the p mode
(radial) will be able to couple out of the fibre while the s mode (tangential) will not, so σp/s >1; this
was seen in the fibre with 5 dips (σp/s = 1.2 ± 0.1), but not for the fibre with 10 (σp/s = 1.1 ± 0.2).
The s and p mode scattering becoming indistinguishable for the 10 dip fibre, supports the
shifts of the cladding modes seen (and in the depth of the cladding modes from before the SEM).
This implied that a certain amount of light was interacting with the film, but that this amount was
unaffected by the polarization of the light. For the 5 dip fibre there was a difference between the
polarizations, this was expected from the preliminary results which showed that there was still an
energy difference between the two modes, and that the s mode was largely attenuated. The
increased p scattering implied that light was tunnelling through the film into the surrounding
medium (air) and propagating away from the fibre.
P S
1 1
2 2
3 3
Figure 25: Scattering from the 5 dip fibre for both p and s mode
illumination, numeration indicates matched pairs of images.

51
Consideration of these results with the SEM images (Figure 21) shows that this is not
unreasonable as the amount of silver nanowires (and other material) is dramatically increased with
the additional 5 dips. A comment must be made about the amount of non-wires that are seen in the
SEM images; this material is likely silver metal aggregates, silver chloride, polymer aggregates
(PVP) which have arose in the solution over time, and from aggregation of material on the inside
of the dipping vessel.
Figure 26: Scattering from the 10 dip fibre for both p and s mode illumination, dup to the inconsistent scattering
along the length of the TFBG additional images were taken
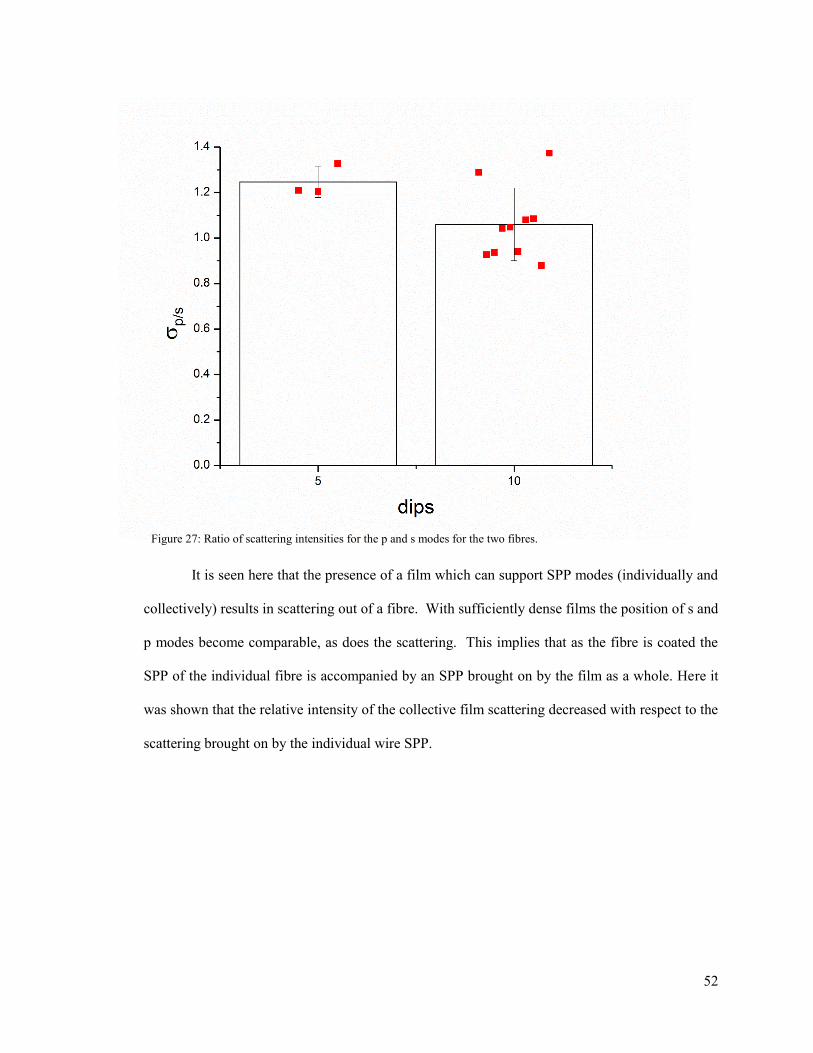
52
It is seen here that the presence of a film which can support SPP modes (individually and
collectively) results in scattering out of a fibre. With sufficiently dense films the position of s and
p modes become comparable, as does the scattering. This implies that as the fibre is coated the
SPP of the individual fibre is accompanied by an SPP brought on by the film as a whole. Here it
was shown that the relative intensity of the collective film scattering decreased with respect to the
scattering brought on by the individual wire SPP.
Figure 27: Ratio of scattering intensities for the p and s modes for the two fibres.

53
6. Fluorescence Enhancement of Rhodamine B Due to AgNW,
Dependencies of Separation from and the Population of the Film
It has been established in other works that silver nanoparticles can enhance the fluorescence;
tracked with the Enhancement Factor (EF, which is the surface enhanced fluorescent intensity with
respect to the native fluorescence). AgNW were deposited on slides through spray coating; and
then an Al2O3 coating through Atomic Layer Deposition ALD. Al2O3 was deposited with 30, 60,
and 120 cycles; thicknesses were determined from TEM. Fluorescent label was deposited on the
sample through Langmuir-Blodgett deposition; a 0.5% DPPE-RhB in DPPG (Avanti). The in
house fluorescence (figure 8) setup was used for both propagating and Total Internal Reflection
(TIR) excitation.
6.1. Surface Enhanced Fluorescence
Fluorophores near a metal surface have can have enhanced luminescence in what has been
dubbed Surface Enhanced Fluorescence (SEF); a situation where a plasmonic surface is coupled in
the near field to the fluorophore resulting in a far field effect (increased apparent fluorescence).80
This is achieved through several mechanisms: enhancing the absorption of the fluorophore,
changing the rate of radiative decay, and enhancing far field coupling of the emission.84,85,86 These
effects are dependent on the distance from the surface supporting the plasmon (the electric field
generated by the plasmon decays); quenching (non-radiative energy transfer) occurs at short
distances (<~5 nm, reducing fluorescence), increase in the intensity of light (<~15 nm, increasing
fluorescence), and changing the decay rates of fluorophores (<~20 nm, which increases
fluorescence).80 The distances are all influenced by the specific particle’s size, geometry, and local
environment as the effects are governed by the SPR.17 Studies have been performed to determine
if physical contact (chemical linkage) is required, or if merely being in the region near the surface
will suffice; it was shown by using layers of lipids deposited on a surface, and molecularly attached
beacons that no physical connection is needed.87 The proximity of the fluorophore to the surface
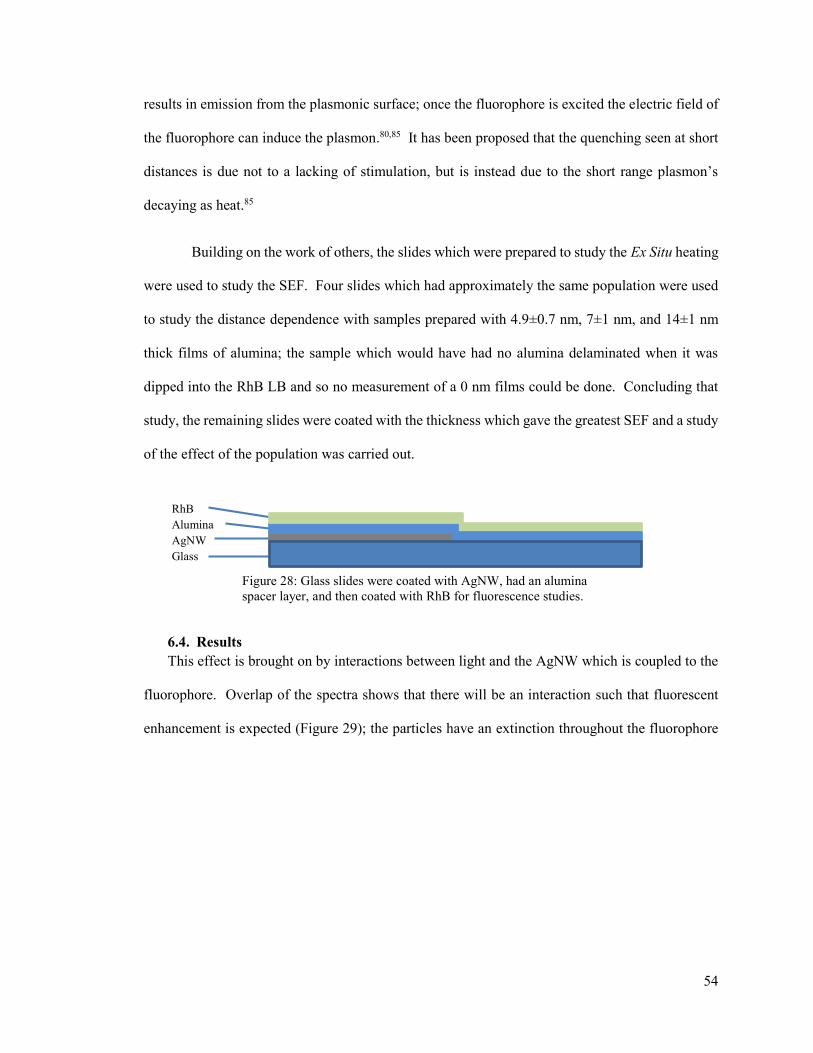
54
results in emission from the plasmonic surface; once the fluorophore is excited the electric field of
the fluorophore can induce the plasmon.80,85 It has been proposed that the quenching seen at short
distances is due not to a lacking of stimulation, but is instead due to the short range plasmon’s
decaying as heat.85
Building on the work of others, the slides which were prepared to study the Ex Situ heating
were used to study the SEF. Four slides which had approximately the same population were used
to study the distance dependence with samples prepared with 4.9±0.7 nm, 7±1 nm, and 14±1 nm
thick films of alumina; the sample which would have had no alumina delaminated when it was
dipped into the RhB LB and so no measurement of a 0 nm films could be done. Concluding that
study, the remaining slides were coated with the thickness which gave the greatest SEF and a study
of the effect of the population was carried out.
6.4. Results
This effect is brought on by interactions between light and the AgNW which is coupled to the
fluorophore. Overlap of the spectra shows that there will be an interaction such that fluorescent
enhancement is expected (Figure 29); the particles have an extinction throughout the fluorophore
Figure 28: Glass slides were coated with AgNW, had an alumina
spacer layer, and then coated with RhB for fluorescence studies.
RhB
Alumina
AgNW
Glass

55
excitation/emission and so it was expected that SEF would be seen. For the three slides, comparison
of the coated and uncoated regions of the slides did produce a strong enhancement (Figure 30).
Four silver nanowire coated slides were selected for separation dependant fluorescence
experimentation; target separations of 0 nm, 5 nm, 10 nm, and 20 nm were selected, as literature
indicated that 10 nm should provide the greatest enhancement with a sharp drop off with variation
to either greater or lesser thicknesses. When the fluorophore labelled lipid was deposited on the
samples, a constant surface pressure was maintained to deposit a uniform concentration of dye. It
was intended that during sample production a control sample (no alumina) would be produced, but
the AgNW film delaminated when submerged into the water destroying the control.
Figure 29: Extinction of the three Silver nanowire samples after being coated with alumina, the excitation
and emission, and fluorescence of Rhodamine B has overlap with the particles.

56
For both propagating and evanescent excitement samples the enhancement factor (EF) was
calculated from the ratio of peak intensity of the irradiated sample/control; peak intensity was found
through 2D Gaussian fitting of the grey scale image captured from the set up (OriginLab was used
to fit the functions). Figure 30 shows the relative intensities once they are adjusted to account for
the necessary change in exposure times (the control sections of the slides were below detectable
limits if the AgNW film was not saturating the detector). There is an apparent local maximum for
Figure 30: Top: Two samples, illuminated at the boundary of silver nanowires showing the difference
in intensity between the coated and uncoated region. Bottom Left: plane wave (propagating) Excitation
and Bottom Right: TIR (evanescent) Excitation of RhB coated slides with sections of AgNW (sample)
and blank sections (control) on slides. Separation is based on expected results, and when measured was
found to be 5 nm, 7 nm, and 14 nm.
AgNW
Control
AgNW
Control

57
the EF with evanescent excitation at 7±1 nm; the propagating SEF was statistically
indistinguishable with respect to film separation.
Comparing the SEF with the population, we see a positive trend which, excluding the 4-5
AgNW/µm2 region, is largely unchanged (Figure 31). It is not clear why this occurs, but recalling
Figure 13 where the slides with middling populations of AgNW had an unexplained mode which
may be affecting the EF (the relevant spectra, population, and SEF have been summarized in the
appendix). In this it is seen that the presence of the s polarization active secondary modes (in S 7
Figure 31: Above: Surface Enhanced
Fluorescence of slides for propagating, and
internal reflection with respect to the
calculated population.
Left: Comparison of the calculated
population and the surface coverage (the
percentage of SEM image indicating the
wires i.e.: lighter portion of the image).
Points are labelled based on slide identity;
all slides have the same separation (7nm),
except 7 and 9 (5nm, and 14nm
respectively).

58
this is pronounced as the TIR increases before the mode, while in the others it is more subtle) in
the middling population result in the highest SEF.
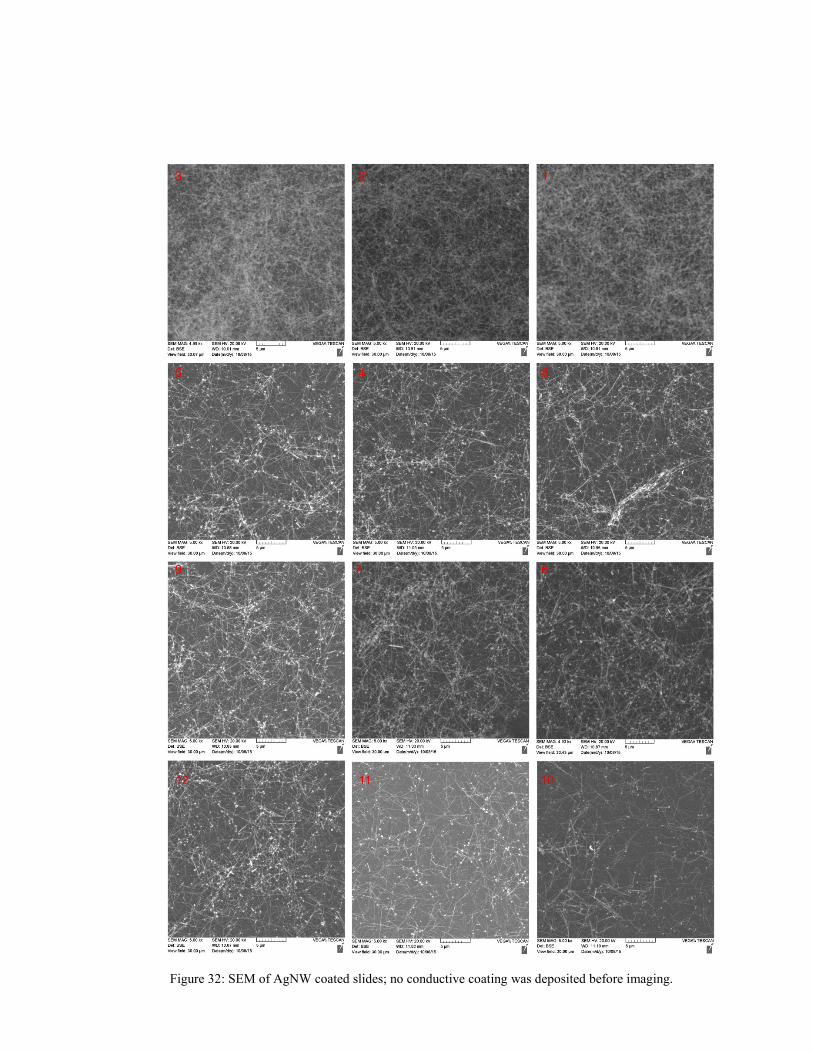
59
Figure 32: SEM of AgNW coated slides; no conductive coating was deposited before imaging.

60
Examining the SEM images (Figure 32) to determine populations; images were placed into
min/max settings (the matrix of the images was set to have only white or black) and then the ratio
of the sum of the white pixel count was compared to the total pixel count. This is representative of
the surface coverage of the slide. A comparison of this to the calculated population (determined
spectroscopically and through thermal measurements) gave an indication to the degree of stacking
that was present on the sample.
Examining the polarization data (Figure 13, summarized in the Appendix), we see that there
are three regions: Low population where the s mode shows greater absorption of the longer
wavelength light; High population where the p mode shows greater absorption to longer
wavelengths; and mid-population where there are changing maxima in the spectra. In a continuous
thin film excited by evanescent light, p light is needed to excite surface plasmons (the electric field
must be perpendicular to the surface of the plasmonic material), so it is not unsurprising that the
dense films begin to mimic a continuous thin film. That at low populations s/TE light better couples
to the wires is interesting, and implies that the longitudinal mode of the wires is supported parallel
to the substrate better than oscillating normal to the substrate. Mid-population slides show a diverse
nature of local maxima/minimum; this is possibly from inter-wire coupling, a hypothesis which is
supported by the variation in the surface coverage of SEM images despite having similar calculated
populations. This discrepancy suggests that the degree of stacking of the wires differs between
these samples.
The implication of this work is that a network which is not aggregated would result in the best
SEF for both TIR and propagating light systems. This networks population would need to be such
that localized modes occur in the spectra (TIR); implying that the nature of this mode is from

61
plasmonic coupling. It has been shown in previous literature to have potential for high energy fields
which would account for the increase in SEF.
Since the most SEF occurred in samples in the 4-5 AgNW/µm2 region, it is clear that the
interparticle coupling is important for SEF. Propagating light has higher SEF than the TIR slides,
although the trends hold true for them as well, thus indicating that the interparticle integration is
important for both modes of light introduction.

62
7. Conclusions
A film of silver nanowires, which is known to be plasmonically active has been identified
and studied as a heat source through irradiation of NIR light. The capabilities of such a film as a
SEF substrate have also been demonstrated and studied. The scattering of TFBG coated in AgNW
film show scattering from both s and p polarized light which implies that there may be interactions
with individual wires as well as coupling between particles to create SPP modes for the film as a
collective rough metal thin film. Wires were deposited through spray coating, LB, and dip coating
showing that this film is viable through several avenues of production.
The heating of the film was seen to be dependent on the population with a predictable trend;
which given set-ups can reach an efficiency of 100 ± 20 % (when in a water filled capillary). Before
saturation of efficiency the population dependence was found to appear to be linear with a relation
of 6.1 ± 0.4 oC AgNW -1 µm2 for propagating induced heating and 6.0 ± 0.7 oC AgNW -1 µm2 for
evanescent light induced heating.
Building on the generation of heat, and the knowledge that AgNW can generate sufficient
heat to undergo self-welding, TFBG coated with AgNW were used to study the melting of the film.
It was shown that it is possible to observe changes in the films optical characteristics as would be
expected in a metal film undergoing morphological changes resulting in a change in electronic
properties. Further study is required, but a preliminary study showed that changes were observable
starting at 145oC culminating at 207oC where the nature of the spectral changes began to vary.
Previous reports of AgNW melting and welding has been around 200oC.
Scattering of light out of fibres was seen to be dependent on the population of AgNW on
the surface, where the ratio of scattering from p polarized evanescent light to that from s polarized
changed as the film population increased. This was attributed to the interactions between individual

63
wires (which have an s active SPP) and the film as a whole (the coupling of wires such that the film
acts as a thin film of silver has a p active SPP).
The SEF properties of the film where also studied, and an optimal range was seen, as well
as an optical population based condition. It was found that the ideal separation between the AgNW
film and fluorophore (when the gap is filled with alumina) was 7 nm (or rather between the two
extremes of 5 nm and 14 nm). As for population dependence, it was seen that for the samples with
approximately 4 AgNW µm-2 had the most significant SEF. Interestingly these were the same
samples which had an additional s active mode in the Vis-NIR region which could not be
reproduced in LB produced films. This implies that there is a population dependence, but that it
has not been fully explored here and should be further investigated.

64
8. Appendix
Figure 33: TIR spectra, populations, and SEF for slides coated with AgNW

65
9. References
1 K Thyagarajan, A Ghatak, Optical Methods for Solid Mechanics: A Full-Field Approach, Basic Optics,
Wiley-Verlag, 2012 2 Euclid (translated by HE Burton), J Optical Soc Am, 1945, 35(5), 357-372 3 JH Poynting, Phil Thrans, 1884, 175, 343-361 4 KK Sharma Optics: Principles and Applications, Elsevier, 2006 5 M Oheim et al, Phil Trans R Soc Lond. B, 1999, 354, 307-318 6 Born, M. & Wolf, E., Principles of optics, 1980. Oxford: Pergamon Press. 7 TAF Konig et al, Nanoscale, 2015, 7, 5230 8 C Caucheteur et al, Anal Bioanal Chem, 2015, 407, 3883-3897 9 H Ditllbcher et al, Phys Rev Lett, 2005, 95,257403 10 BD Gupta, RK Verma, J Sensors, 2009, 979761 11 S Silva et al, Photonics, 2014, 1, 516-529 12 B Lee, Optical Fibre Tech, 2003, 9, 57-79 13 WX Xie et al, Optics Comm., 1995, 104, 189-195 14 J Albert et al, Laser Phot Rev, 2013, 7(1), 83-108 15 LY Shao et al, Optics Express, 2010, 18(11), 11464-11471 16 MZ Alam, J Albert, J of Lightwave Tech., 2013, 31(19), 3167-3175 17 KA Willers, RP Van Duyne, Annu. Rev. Phys. Chem., 2007, 58, 267-297 18 J Nelayah et al, Nature Phys, 2007, 3, 348- 19 I Alber et al, ACS Nano, 2011, , 5(12), 9845-985, 3 20 S Link, MA El-Sayeed, J Phys Chem B, 1999, 103, 8410-8426 21 CF Boren, DR Huffman, Absoprtion and Scattering of Light by Sall Particles, 1983, New York: Wiley,
530 22 G Mie, Ann. Phys, 1908, 25, 377-445 23 CM Wu, MC Pao, Optics Express, 2004, 12(15), 3509-3514 24 S Linic et al, Nature Mat., 2011, 10(12), 911-921 25 S Eustis, M El-Sayed, Chem Soc. Rev., 2006, 35(3), 209-217 26 L Maestro et al, Langmuir, 2014, 30, 1650-1658 27 W Deng et al, Phys Chem Chem Phys, 2013, 15(38), 15695-15708 28 M Epstein, Crit Rev Biomed Eng., 1982, 7(2), 79-120 29 X Wang et al, Sens. and Actuators A: Phys., 2014, 2014, 230-233 30 P Caldas et al, Appl. Optics, 2011, 50(17), 2738-2743 31 J Pollet et al, Biosens. Bioelectron., 2009, 25(4), 864-869 32 T Schuster et al, J Lightwave Tech, 2012, 30(8), 1003-1008 33 RL Stoermer et al, J Am Chem Soc, 2006, 128, 13243-13254 34 TJ Richmond and CA Davey, Nature, 2003, 423, 145-150 35 B Abel et al, J Phys Chem C, 2014, 119, 675-684 36 SM George, Chem Rev, 2010, 110, 111-131 37 MA Cameron et al, Langmuir, 2000, 16, 7435-7444 38 S Keun Kim et al, App. Phys. Lett., 2004, 85 (18), 4112-4114 39 J Aarik et al, Thin Solid Films, 1997, 305, 270-273 40 JJ Gooding et al, Chem Soc Rev, 2011, 40, 2704-2718 41 M Zhu et al, Langmuir, 2012, 28,416 42 NA Bakar et al, Appl. Sci., 2015, 5, 209-221 43 TAF Konig et al, Nanoscale, 2015, 7, 5230

66
44 N Ahamad et al, J Phys Chem C, 2011, 115, 3587 45 GG Roberts, Adv in Phys, 1985, 34(4), 475-512 46 JM Ranoirt et al, J Phys Chem C, 2014, 118, 11035 47 A Tao et al, Nano Lett, 2003, 3(9), 1229-1233 48 H Greenbaum, Dana Rubinstein, “The origin of Spray paint”, New York Times, Nov 4, 2011 49 H Ogihara et al, Langmuir, 2012, 28, 4605-4608 50 P Schaaf et al, Adv Mater, 2012, 24, 1001-1016 51 V Scaradaci et al, Small, 2011, 7(18), 2621-2628 52 J Krantz et al, Adv Func Mater, 2013, 23, 1711-1717 53 CJ Brinker et al, J of Non-Cryst Solids, 1992, 147/148, 424-436 54 F. Fievet et al, Solid State Ionics, 1989, 32/33, 198-205 55 Yugang Sun, Brian Mayers, Thurston Herricks, and Younan Xia, Nano Letters, 2003, 3(7), 955-960 56 S Cocskun et al, Crys Growth & Design, 2011, 11, 4963-4969 57 SE Skrabalak et al, Nano Lett., 2008, 8(7), 2077-2081 58 John Turkevich, Peter C Stevenson, and James Hillier, Disc, Faraday Soc., 1951, 11, 55-75 59 Jiandong Hu, et al, Surface & Coatings Tech., 2008, 202, 2922-2926 60 EC Garnett et al, Nature Mater, 2012, 11, 241-249 61 LM Maestro et al, Langmuir, 2014, 30, 1650-1658 62 SH Guo et al, Nano Lett, 2009, 9(7), 2666-2670 63 AV Akimov et al, Nature Lett, 2007, 450, 402-406 64 H Ditllbcher et al, Phys Rev Lett, 2005, 95,257403 65 H Staleva et al, Phys Chem Chem Phys, 2009, 11,5889-5896 66 TY Kim et al, Adv Func Mater, 2013, 23, 1250-1255 67 D Kim et al, Carbon, 2013, 13, 530-536 68 TB Song et al, ACS Nano, 2014, 8(3), 2804-2811 69 JS Woo et al, Sci Reports, 2014, 4, 4804 70 Handbook of Chemistry and Physics, 96th Ed, 2015-2016 71 D Dieding, G Kritzler, and A Otto, Topics Appl. Phys., 2003, 85, 365-427 72 H Raether, Surface Plasmons on Smooth and Rough Surfaces and on Gratings, 1988, Springer Verlag,
Berlin 73 FM White, Heat Transfer, 1984, Addision 74 YA Cengel, Heat Transfer: A Practical Approach, 2ED, 2003, McGraw-Hill 75 KM McPeak et al, ACS Photonics, 215, 2(3), 326-333 76 Linhong Kou, et al, Appl. Opt., 1993, 32(19), 3531-3540 77 W Zhou et al, Optics express, 2013, 21(1), 245-255 78 M Chen, and M Yin, Prog in Polymer Sci, 2014, 39(2), 365-395 79 G Chen et al, Chem Soc Rev, 2015, 44, 1680-1713 80 K Aslan et al, J Fluo., 2005, 15(5), 643-654 81 AJ Cox et al, Am. J. Phys., 2002, 70(6), 620-625 82 A Kaser, and E Gerlach, Zeitschift Für Physik B, 1994, 97, 139-146 83 C. Caucheteur et al, Opt. Express, 2011, 19(2), 1656-1664 84 RR Chance et al, J Chem Phys, 1974, 60, 2744-2748 85 JR Lakowics, Anal Bioc, 2005, 337, 171-194 86 R Bardhan et al, ACS Nano, 2009, 3(3), 744-752 87 K Sokolov et al, Anal Chem, 1998, 70, 3898-3905