simple harmonic motion - uwsp.edu · 1 f t. complex waveforms ... is the greatest common factor of...
TRANSCRIPT
Physics 115 Lecture 13
Fourier Analysis
February 22, 2018
1
Fourier Synthesis
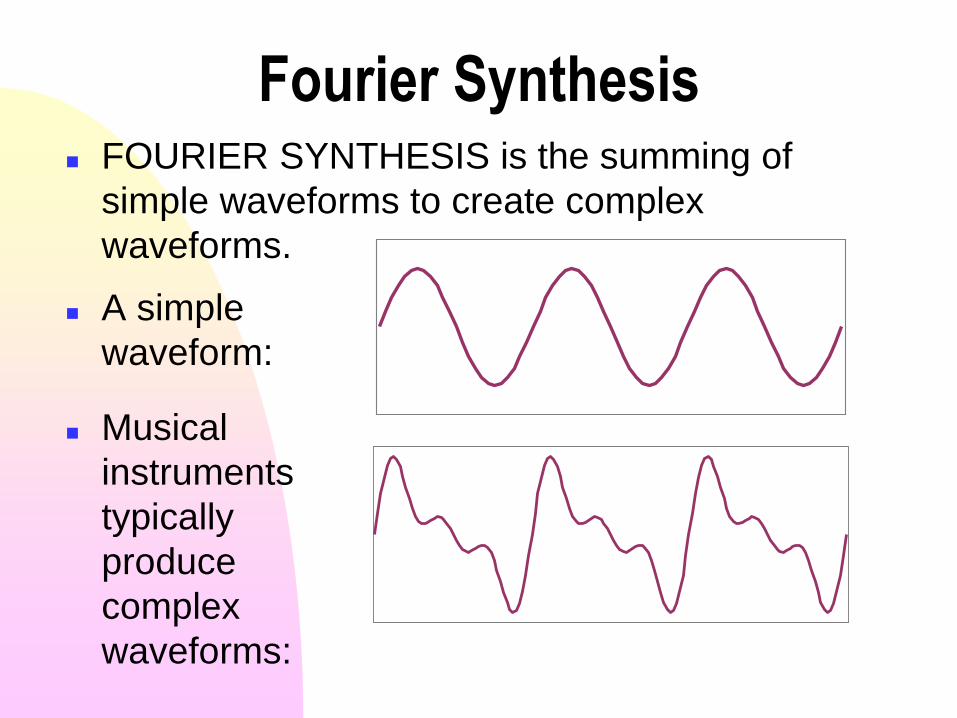
A simple
waveform:
FOURIER SYNTHESIS is the summing of
simple waveforms to create complex
waveforms.
Musical
instruments
typically
produce
complex
waveforms:
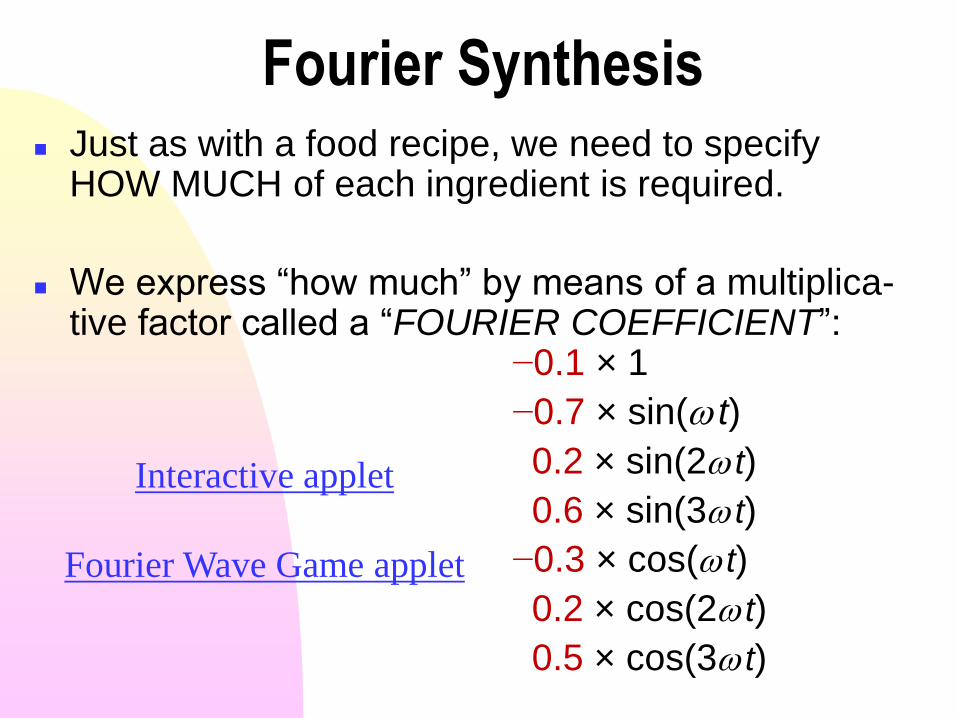
Fourier Synthesis Just as with a food recipe, we need to specify
HOW MUCH of each ingredient is required.
We express “how much” by means of a multiplica-tive factor called a “FOURIER COEFFICIENT”:
−0.1 × 1
−0.7 × sin( t)
0.2 × sin(2 t)
0.6 × sin(3 t)
−0.3 × cos( t)
0.2 × cos(2 t)
0.5 × cos(3 t)
Interactive applet
Fourier Wave Game applet
Complex waveforms
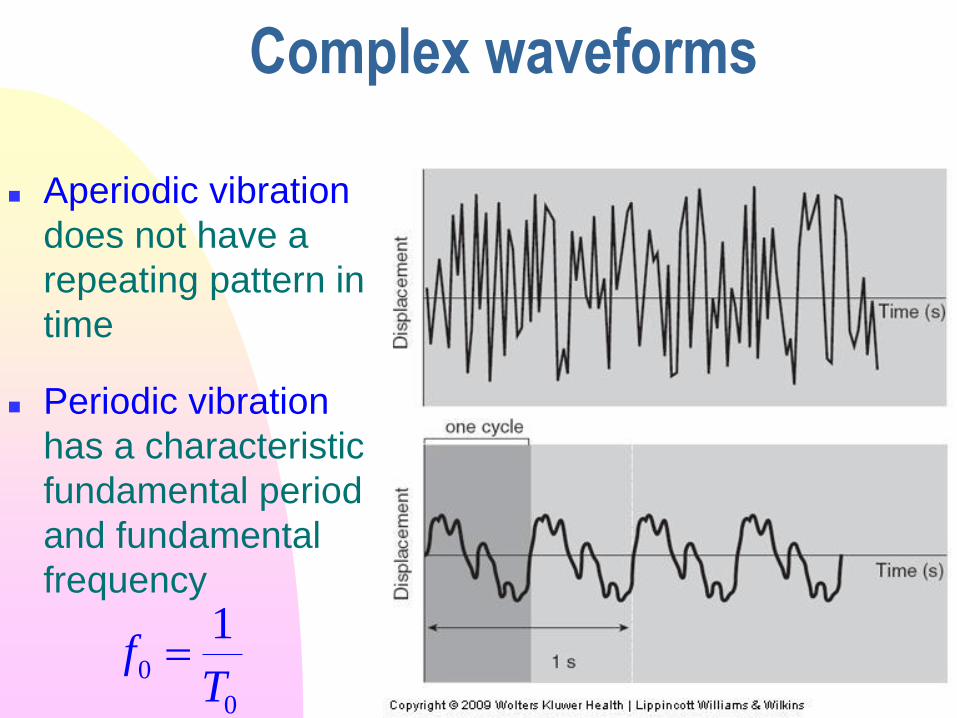
Aperiodic vibration
does not have a
repeating pattern in
time
Periodic vibration
has a characteristic
fundamental period
and fundamental
frequency
0
0
1f
T
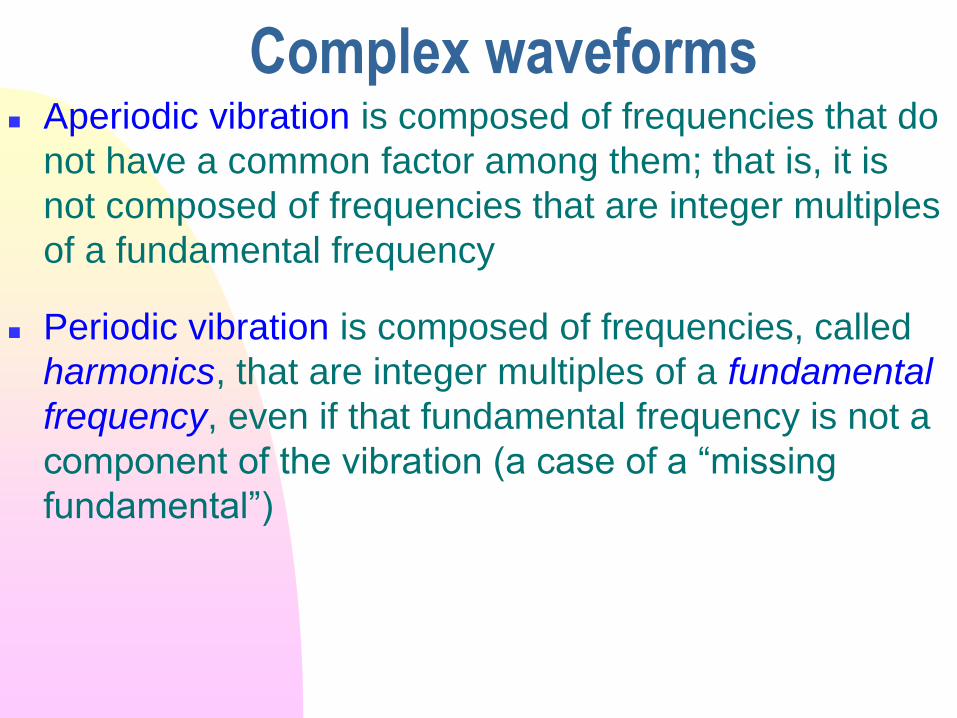
Complex waveforms Aperiodic vibration is composed of frequencies that do
not have a common factor among them; that is, it is
not composed of frequencies that are integer multiples
of a fundamental frequency
Periodic vibration is composed of frequencies, called
harmonics, that are integer multiples of a fundamental
frequency, even if that fundamental frequency is not a
component of the vibration (a case of a “missing
fundamental”)
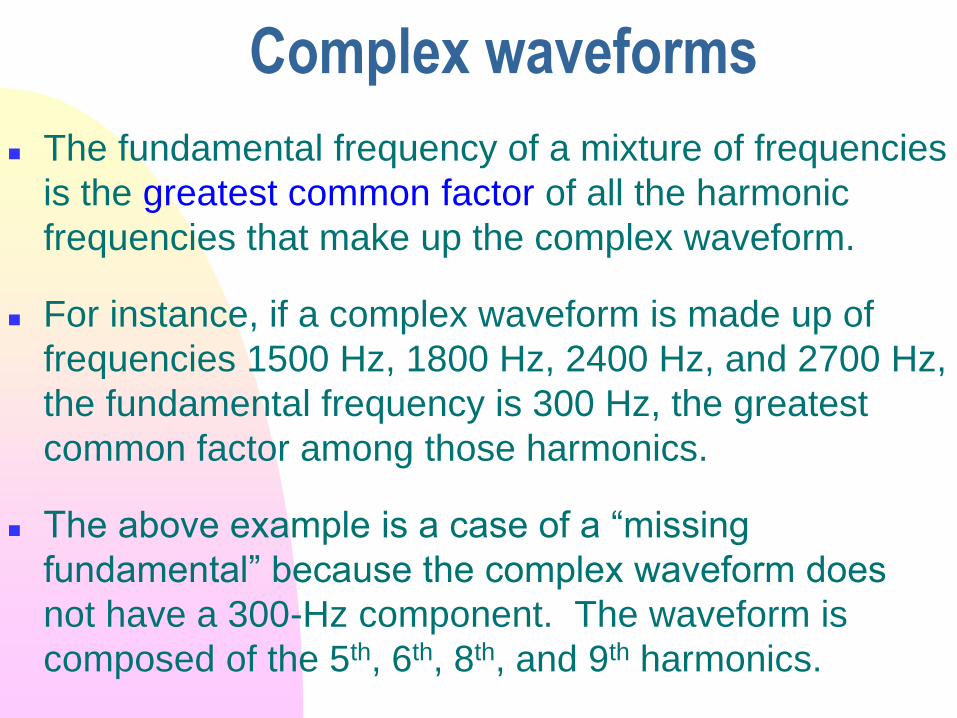
Complex waveforms
The fundamental frequency of a mixture of frequencies
is the greatest common factor of all the harmonic
frequencies that make up the complex waveform.
For instance, if a complex waveform is made up of
frequencies 1500 Hz, 1800 Hz, 2400 Hz, and 2700 Hz,
the fundamental frequency is 300 Hz, the greatest
common factor among those harmonics.
The above example is a case of a “missing
fundamental” because the complex waveform does
not have a 300-Hz component. The waveform is
composed of the 5th, 6th, 8th, and 9th harmonics.
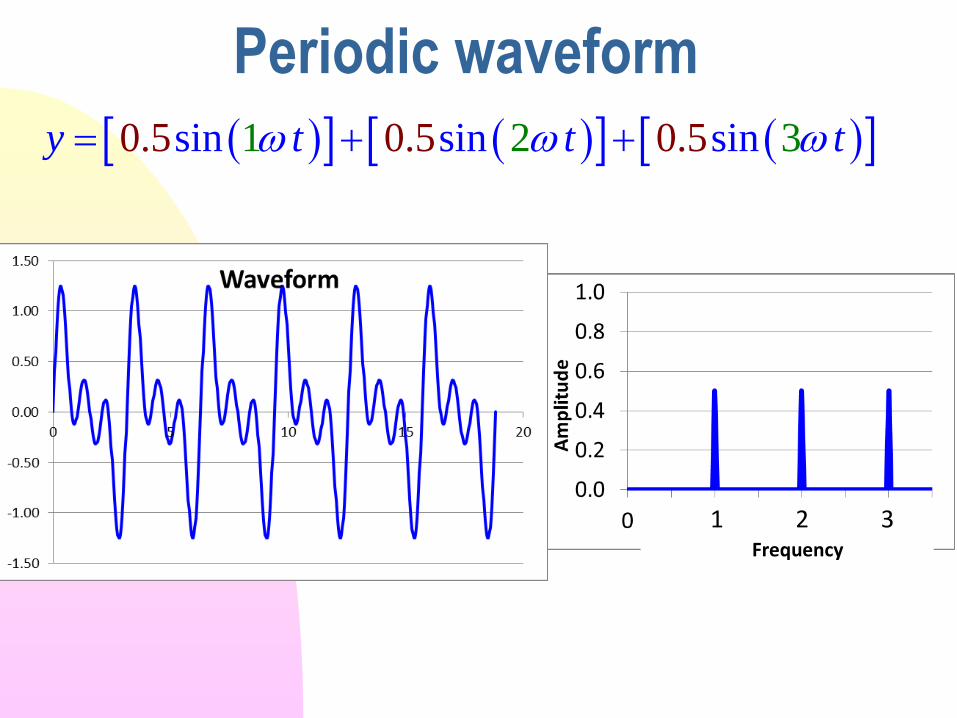
Periodic waveform
sin sin1 20.5 si0 3.5 0 5 n.y t t t
1 2 3Frequency
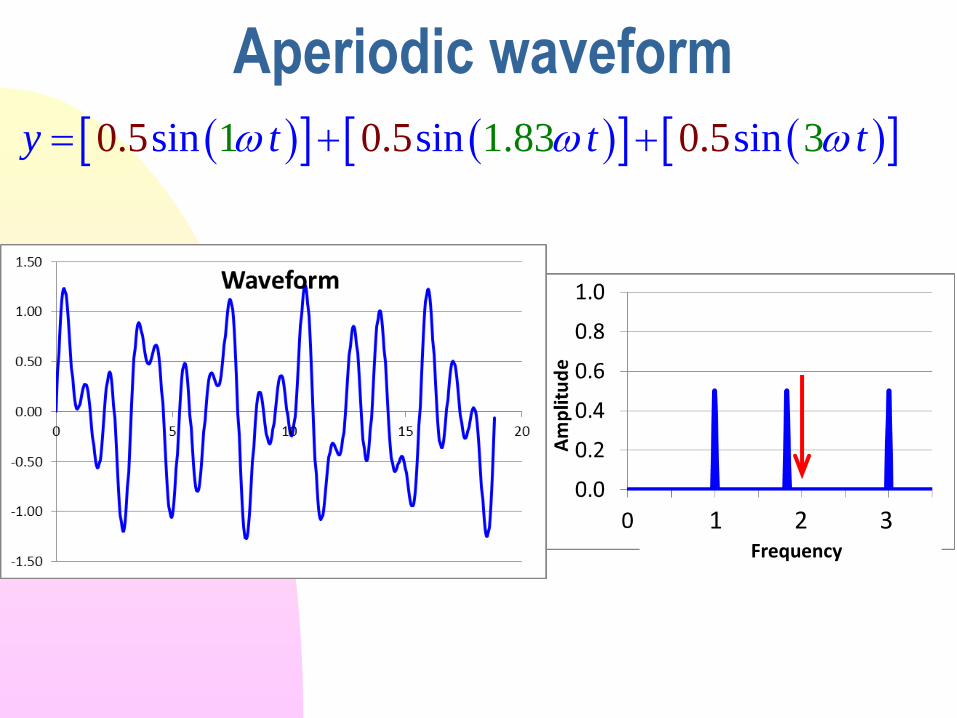
Aperiodic waveform
sin sin1 1.80.5 30.5 0.5si 3ny t t t
1 2 3Frequency
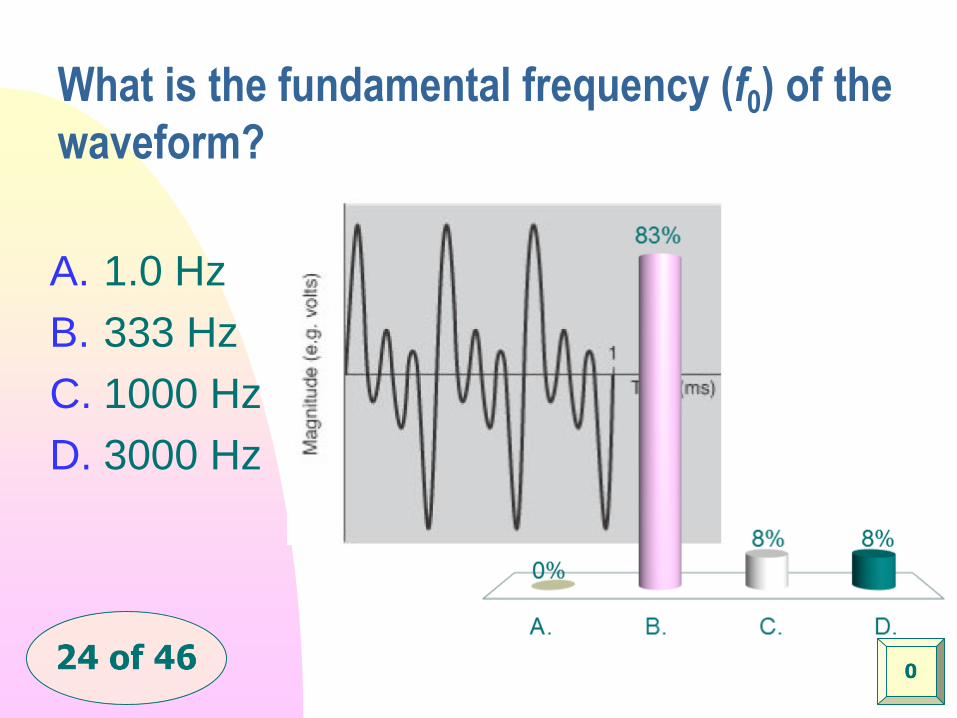
What is the fundamental frequency (f0) of the
waveform?
A. 1.0 Hz
B. 333 Hz
C. 1000 Hz
D. 3000 Hz
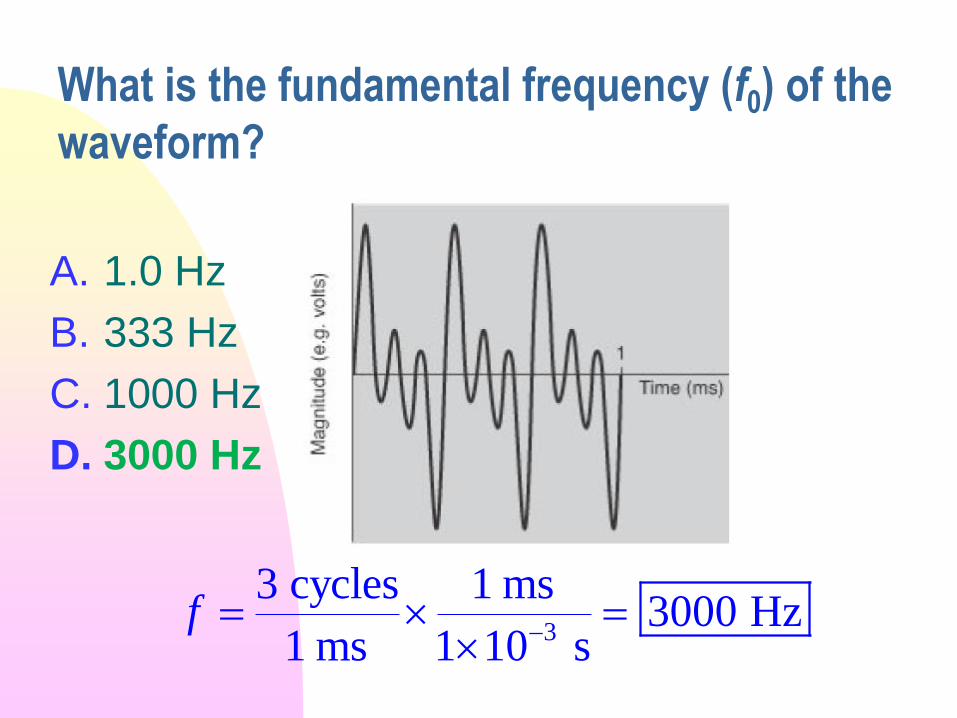
What is the fundamental frequency (f0) of the
waveform?
A. 1.0 Hz
B. 333 Hz
C. 1000 Hz
D. 3000 Hz
3
3 cycles 1 ms3000 Hz
1 ms 1 10 sf
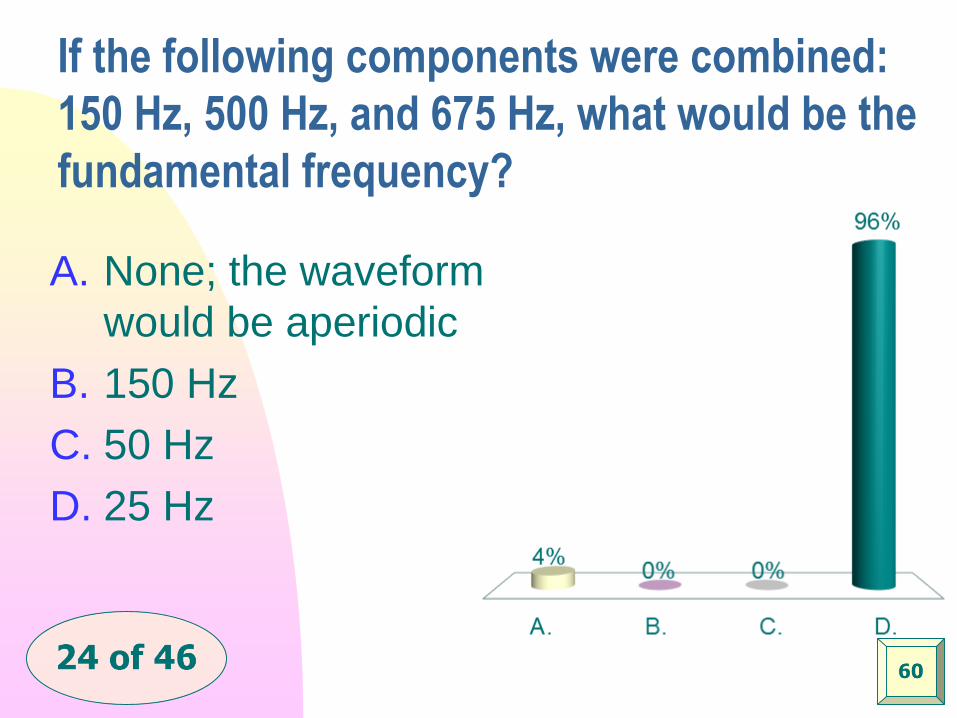
If the following components were combined:
150 Hz, 500 Hz, and 675 Hz, what would be the
fundamental frequency?
A. None; the waveform
would be aperiodic
B. 150 Hz
C. 50 Hz
D. 25 Hz
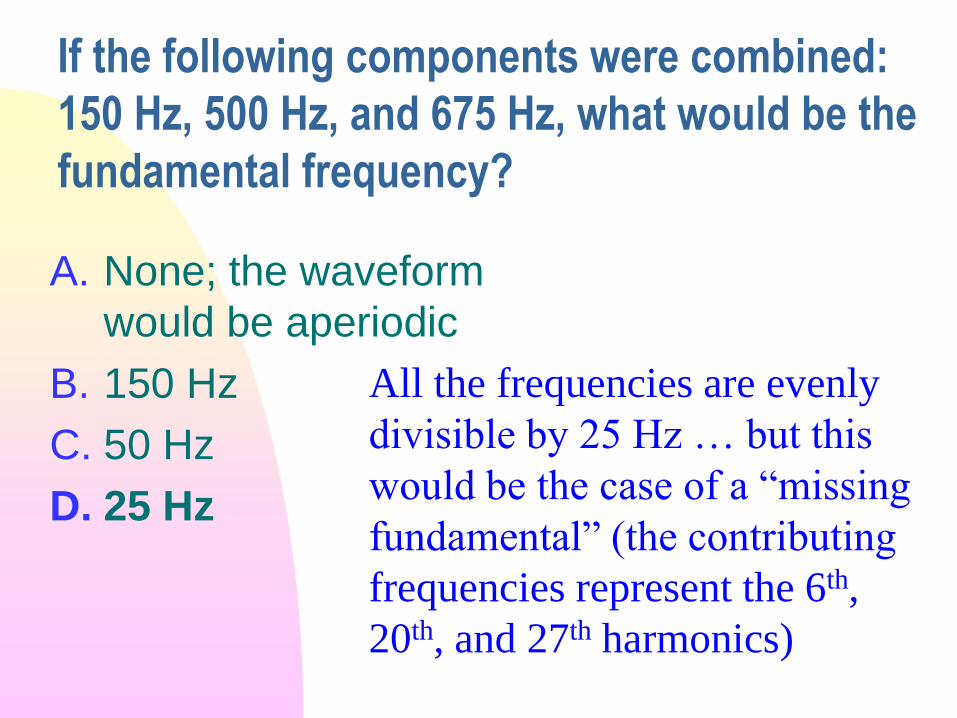
If the following components were combined:
150 Hz, 500 Hz, and 675 Hz, what would be the
fundamental frequency?
A. None; the waveform
would be aperiodic
B. 150 Hz
C. 50 Hz
D. 25 Hz
All the frequencies are evenly
divisible by 25 Hz … but this
would be the case of a “missing
fundamental” (the contributing
frequencies represent the 6th,
20th, and 27th harmonics)
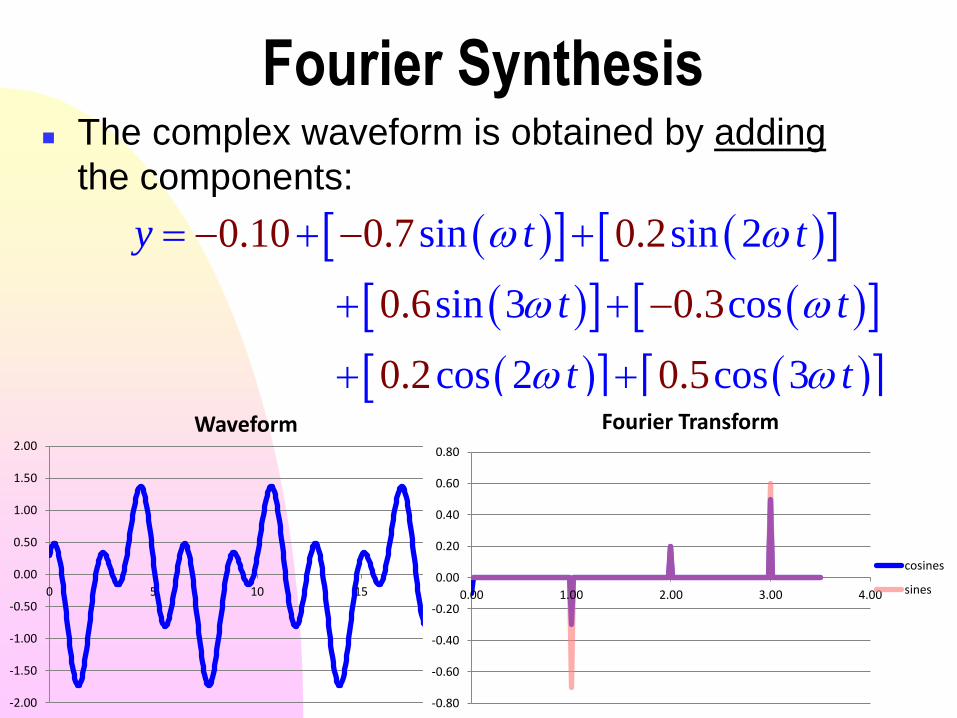
Fourier Synthesis The complex waveform is obtained by adding
the components:
-2.00
-1.50
-1.00
-0.50
0.00
0.50
1.00
1.50
2.00
0 5 10 15 20
Waveform
sin sin 2
sin 3 cos
cos 2 cos
0.10 0.7 0.2
0.6 0.3
0 3.2 0.5
y t t
t t
t t
-0.80
-0.60
-0.40
-0.20
0.00
0.20
0.40
0.60
0.80
0.00 1.00 2.00 3.00 4.00
Fourier Transform
cosines
sines
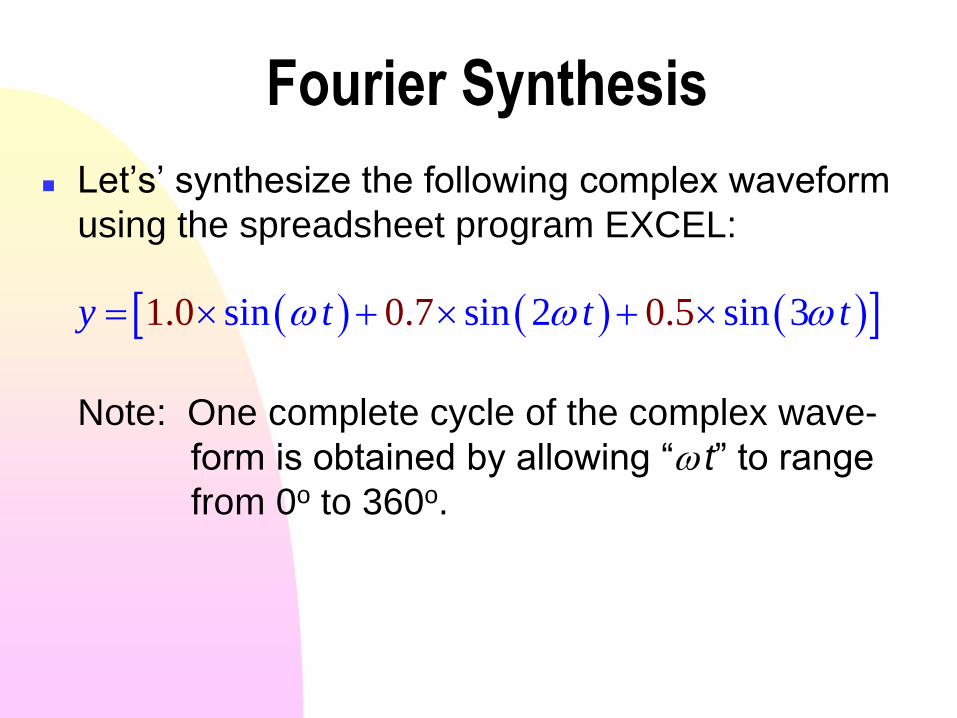
Fourier Synthesis
Let’s’ synthesize the following complex waveform
using the spreadsheet program EXCEL:
Note: One complete cycle of the complex wave-
form is obtained by allowing “ t” to range
from 0o to 360o.
sin sin 21.0 0. s 37 n5 i0.y t t t
Fourier Synthesis & Analysis
In FOURIER SYNTHESIS, we create a complex
waveform by adding sines and cosines. We can
synthesize ANY waveform this way.
Fourier analysis is the opposite of Fourier
synthesis. In FOURIER ANALYSIS, we take
a complex waveform and break it down into
its component sines and cosines! That is, we
produce a Fourier transform of the waveform.(We will do this in lab using Microsoft Excel.)
A. A
B. B
C. C
D. D
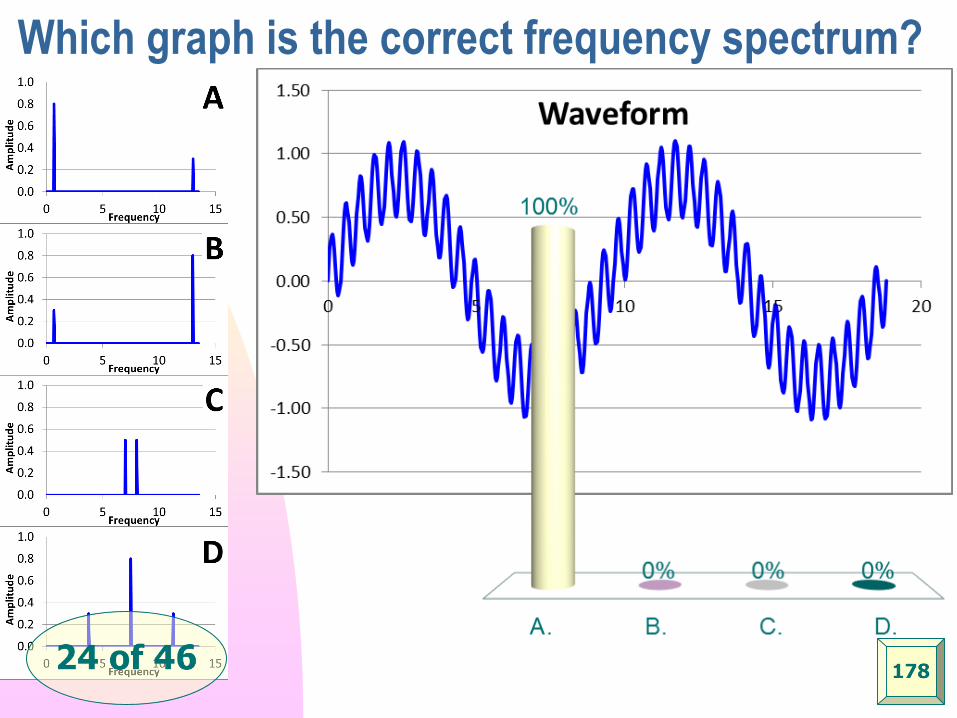
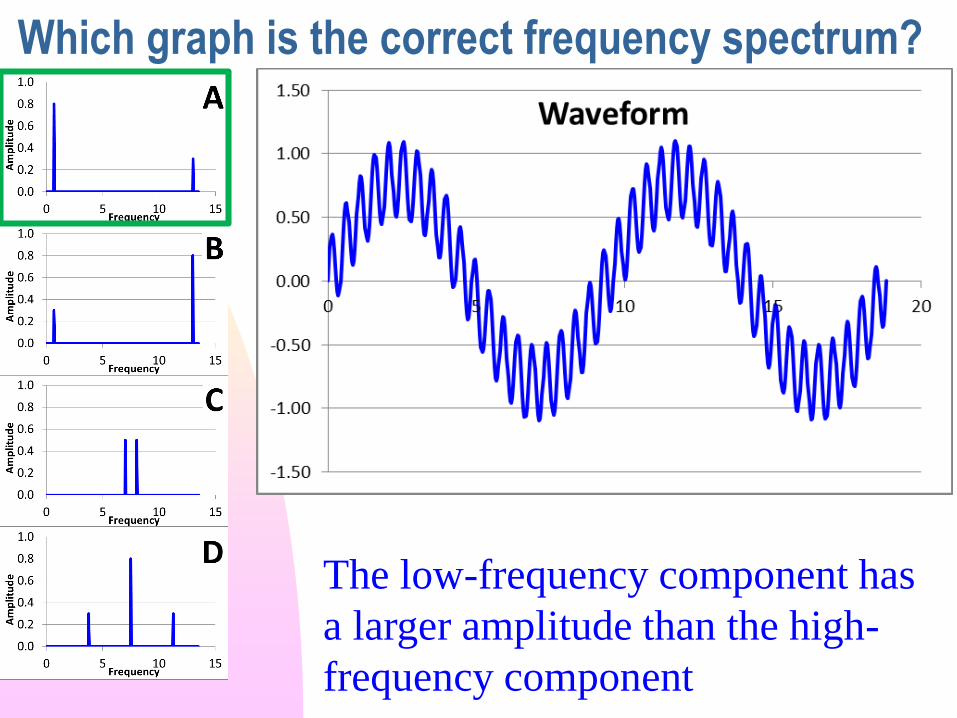
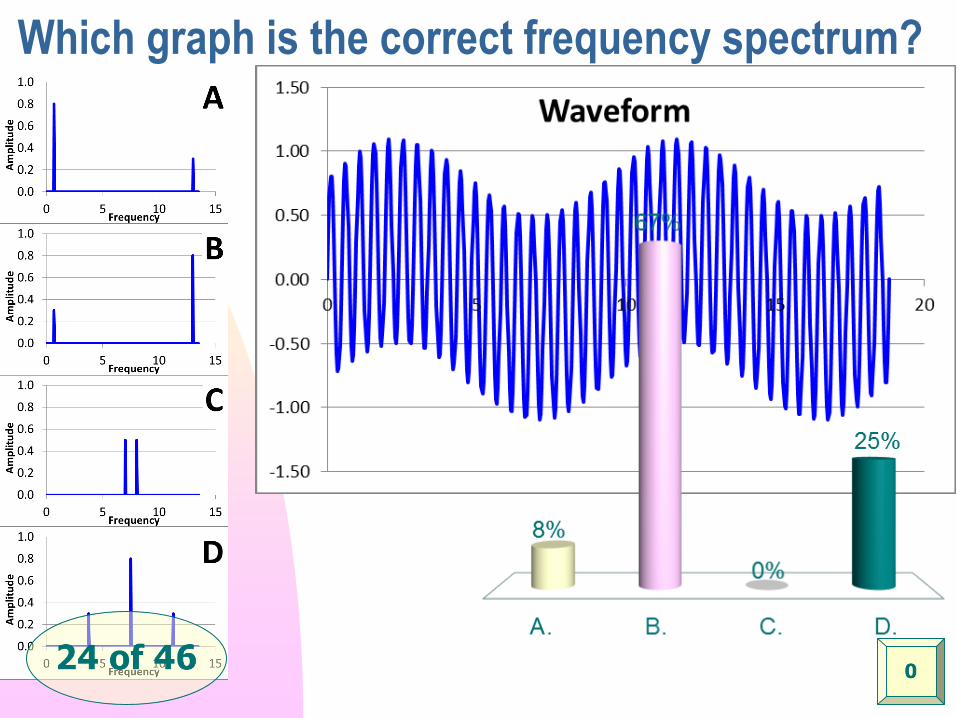
Which graph is the correct frequency spectrum?
Which graph is the correct frequency spectrum?
A. A
B. B
C. C
D. DThe low-frequency component has
a larger amplitude than the high-
frequency component
A. A
B. B
C. C
D. D
Which graph is the correct frequency spectrum?
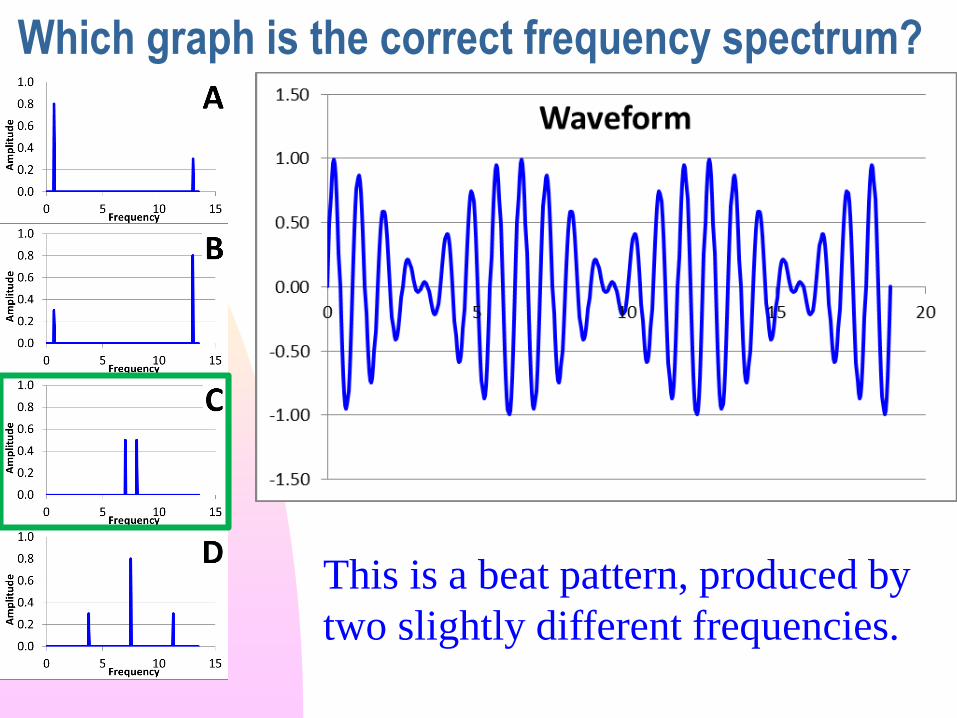
Which graph is the correct frequency spectrum?
A. A
B. B
C. C
D. DThis is a beat pattern, produced by
two slightly different frequencies.
A. A
B. B
C. C
D. D
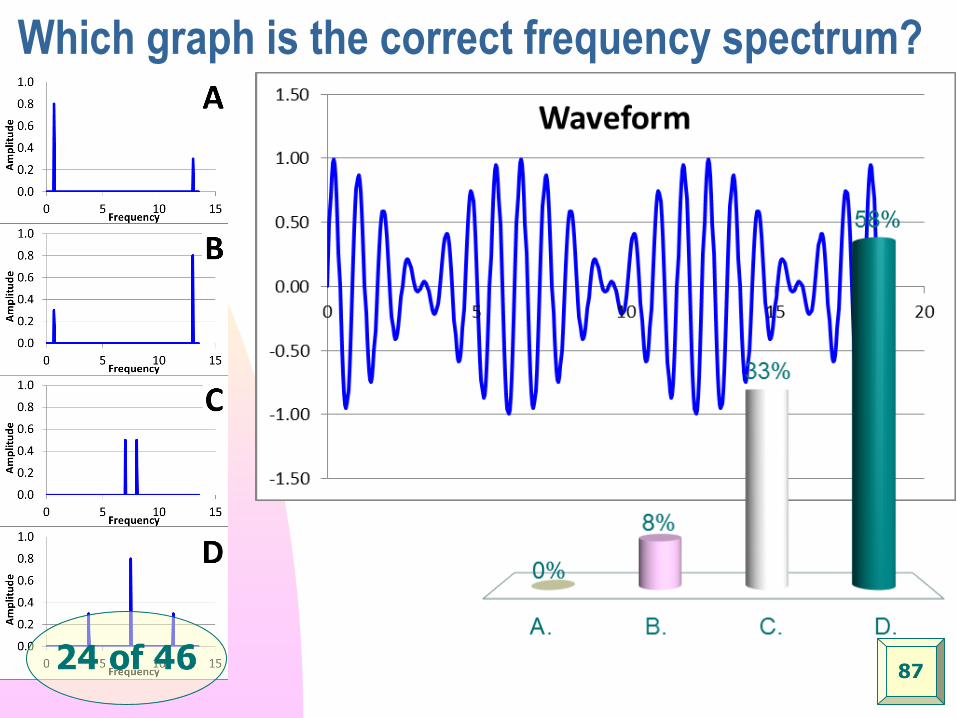
Which graph is the correct frequency spectrum?
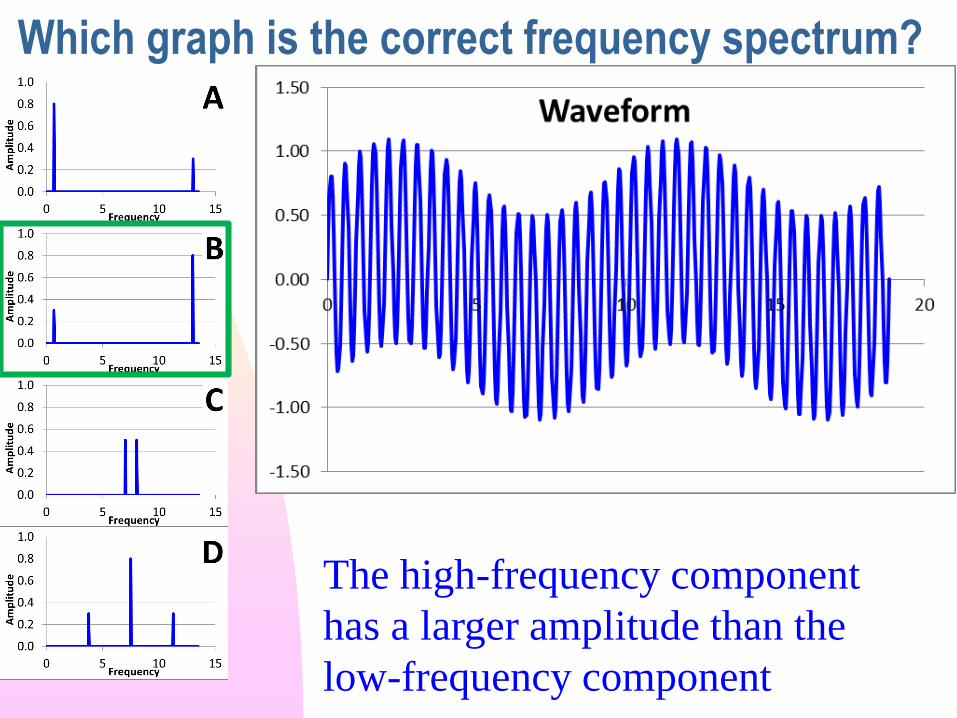
Which graph is the correct frequency spectrum?
A. A
B. B
C. C
D. DThe high-frequency component
has a larger amplitude than the
low-frequency component