simple water quality testing in and outside the classroom
TRANSCRIPT

Simple Water Quality Testing In and Outside the Classroom
Vernier Software & Technology www.vernier.com
888.837.6437
Colleen McDaniel [email protected]
NSTA National 2019
St. Louis, MO
HANDS-ON WATER QUALITY TESTS
● Temperature ● pH
● Dissolved Oxygen ● Total Dissolved Solids
● Turbidity
DATA COLLECTION FOR FIELD WORK
● Data Matrix ● Mapping Data in ArcGIS and Google Maps


LabQuest
1
Water Quality with Vernier © Vernier Software & Technology 1
Temperature INTRODUCTION The temperature of a body of water influences its overall quality by affecting solubility of gases and the health of organisms. Water temperatures outside the “normal” range for a stream or river can cause harm to the aquatic organisms that live there. If the water temperature changes by even a few degrees over a one-mile stretch of the stream, it could indicate a source of thermal pollution.
Thermal pollution caused by human activities is one factor that can affect water temperature. Many industries use river water in their processes. The water is treated before it is returned to the river, but is warmer than it was before. Runoff entering a stream from parking lots and rooftops is often warmer than the stream and will increase its overall temperature.
Shade is very important to the health of a stream because of the warming influences of direct sunlight. Some human activities may remove shade trees from the area which will allow more sunlight to reach the water, causing the water temperature to rise. Another factor that may affect water temperature is the temperature of the air above the water. The extent of its influence has a great deal to do with the depth of the water. A shallow stream is more susceptible to changes in temperature than a deep river would be.
While many factors can contribute to the warming of surface water, few cause it to be cooled. One way water can be cooled is by cold air temperatures. A second, natural method of cooling a river or lake comes from the introduction of colder water from a tributary or a spring.
One important aspect of water temperature is its effect on the solubility of gases, such as oxygen. More gas can be dissolved in cold water than in warm water. Animals that require a high level of dissolved oxygen, such as salmon, will only thrive in cold water.

LabQuest 1
2 Water Quality with Vernier
Increased water temperature can also cause an increase in the photosynthetic rate of aquatic plants and algae. This can lead to increased plant growth and algal blooms, which can be harmful to the local ecosystem.
A change in water temperature can affect the general health of the aquatic organisms, thus changing the quality of the stream. Table 1 lists the optimal temperature ranges of some selected aquatic organisms. When the water temperature becomes too hot or too cold, organisms become stressed, lowering their resistance to pollutants, diseases, and parasites.
MATERIALS
LabQuest Vernier Temperature Probe Vernier GPS Sensor (original LabQuest only) sampling container (optional)
COLLECTION AND STORAGE OF SAMPLES
• Water temperature must be measured on site by either placing the probe directly in the stream or by collecting a sample and immediately measuring its temperature.
• If you need to collect a sample to measure on site, it is important to obtain the water sample from below the surface of the water and as far away from the shore as is safe. If suitable areas of the stream appear to be unreachable, samplers consisting of a rod and container can be constructed for collection.
PROCEDURE 1. Connect a Temperature Probe to LabQuest and choose New from the File menu.
2. Initiate GPS, if desired, by connecting the Vernier GPS Sensor (original LabQuest) or by enabling the internal GPS using the instructions below (LabQuest 2). a. Choose Sensor Setup from the Sensors menu. b. Select the GPS check box and tap OK. c. It may take a few minutes for the GPS to acquire satellites.
3. On the Meter screen, tap Mode. Change the Mode to Data Matrix.
4. Set up the matrix. a. Data Matrix defaults such that rows of the data table correspond to the sampling sites and
runs correspond to the collection day. Either accept the default names of Site and Day or enter alternates.
Table 1: Optimal Temperature Ranges
Organism Temperature range (°C)
Trout 5–20
Smallmouth bass 5–28
Mayfly larvae 10–25
Stonefly larvae 10–25
Carp 10–25
Mosquito 10–25
Catfish 20–25

Temperature
Water Quality with Vernier 3
b. Another default setting is for LabQuest to automatically increment the Site and Day names, e.g., Site 1, Site 2. If you do not want this behavior, select the Automatically increment numbers box to clear it.
c. Tap OK. 5. Start data collection.
6. The Change screen will open, allowing a change or addition of sites and days. Note: These instructions use the default terms Site and Day. • If the Automatically increment numbers box was not checked, at least one of each site and
day must be added. • All of the anticipated sites and days may be added at this time, or they can be added later.
7. Tap Continue.
8. If using GPS, tap the latitude or longitude meters to keep the location. The meter for that value will turn white and the padlock will close, indicating it has been kept in the file. If a mistake is made, tapping a second time will discard the value.
9. Submerge the tip of the Temperature Probe a few centimeters into the stream (or into a sample taken from the stream) and hold until the temperature is stable. Note: The handle is not waterproof.
10. When the temperature is stable, tap it to keep the value. Note: Once a value has been kept, that sensor can be disconnected and a different sensor can be connected in order to test other parameters, if desired.
11. Data collection can be stopped and restarted at any time. This is useful for reviewing the data table or graph for analysis purposes.
12. Once all the values for that site and day have been kept, either stop data collection, or tap Change to return to the Change screen. Note: Choose Change only if the next location is very close and additional data will be collected immediately. Otherwise, stop data collection and save the file.
Optional Extension for WQI If calculating the WQI (Water Quality Index), a second temperature reading taken one mile upstream from the first site is required. Repeat Steps 5–9 at this second site.

LabQuest 1
4 Water Quality with Vernier
DATA Site Information
Name of Site 1
Name of Site 2 (for WQI only)
Date of collection
Time of collection
Group members
Field Observations (e.g., weather, geography, and vegetation along stream)
Test Results
Temperature (°C)
Date test completed
Time test completed
Test completed by
Optional Extension for WQI
Site 1 Temperature
(°C)
Site 2 Temperature
(°C)
Temperature change
(°C)

© Vernier Software & Technology 5
Collecting Data on LabQuest: Using Data Matrix Mode
Data Matrix is one of LabQuest’s data-collection modes. It was created to improve data collection in the field by addressing several key issues. These include: 1. Collecting data at multiple locations and over multiple days, all in one file.
2. Collecting data from more sensors than there are ports available.
3. Collecting data from certain combinations of water quality sensors that previously could not be used together due to electrical interference.
It is recommended that sensors requiring calibration be calibrated prior to going into the field. Save this calibration onto the sensor itself (when available).
SET UP DATA MATRIX 1. Connect one of the sensors to LabQuest and choose New from the File menu. More sensors
can be added at any time during data collection.
2. On the Meter screen, tap Mode. Change the Mode to Data Matrix.
3. Enter the names for the rows and runs of data. The default is that rows correspond to sites and runs correspond to the collection day. Either accept the default names of Site and Day, as shown in Figure 1, or enter unique names as shown in Figure 2. Another default setting is for LabQuest to automatically increment the Site and Day names, e.g., Site 1, Site 2. Uncheck this box if this is not desired.
4. Tap OK.
5. If not collecting data immediately, you may wish to save the file by choosing Save from the File menu.
Figure 1 Data Matrix with default settings Figure 2 Data Matrix with custom labels

6
Collect Data 6. Start data collection.
7. The Change screen will open, as shown in Figure 3, allowing changes or adding sites and days. Note: The words Site and Day may have been changed something else, but these instructions will use the default terms. a. If the Automatically increment numbers box was not checked, at least one of each site and
day will need to be added. b. All of the anticipated sites and days can be added at this time, or they can be added later. c. Tap Continue.
Figure 3 Data Matrix Change page with first day and site added
8. Each connected sensor will display a live reading on the screen as shown in Figure 4. If there
is not enough room to display all sensors, a scroll bar will be available. Note that the selected site and day are displayed across the top of the screen for reference.
Figure 4 Data Matrix collection page prior to storing values
9. When ready, tap the value to keep it. The meter for that value will turn white and the padlock
will close as shown in Figure 5, indicating the value has been kept in the file. If a mistake is made, tapping a second time will discard the value.

Using Data Matrix Mode
7
Figure 5 Data Matrix collection page after the temperature value has been kept
10. Once a value has been kept, that sensor can be removed and a different sensor connected, if
desired.
11. Once all the values for that site and day have been kept, either stop data collection, or tap Change to return to the Change screen. Choose Change only if the next location is very close and will continue collecting data immediately. Otherwise, stop data collection and save the file.
12. The data can be viewed by navigating to the Table screen. Use the scroll bars to navigate around the table, if needed.
ANALYZE DATA
13. The data can be graphed by doing the following: a. Navigate to the Graph screen. b. Tap on the y-axis label and select the parameter you wish to graph from the list. c. Select the site or day of your choice from the chooser located at the upper right corner of
the graph. d. To show two graphs at once, choose Show Graph from the Graph menu, and select All
Graphs.
14. (LabQuest 2 only) If the data are currently graphed to compare locations, but a comparison of dates is desired instead, or vice versa, they can be transposed or pivoted (requires LabQuest app v. 2.2 or newer). To pivot the data: a. Navigate to the Graph screen. b. Choose Advanced ► Pivot Data from the Analyze menu. c. The pivoting will be reflected on the graph and in the data table.

8
MAP THE DATA 15. If you have Logger Pro available, you could also transfer the data from LabQuest to a
computer. Logger Pro has more graphing and analysis options than LabQuest, such as bar graphs and the ability to insert images, as shown in Figure 6. If your file includes GPS coordinates, Logger Pro also has the ability to export your data into Google Maps. There are several ways to transfer the data from LabQuest to Logger Pro: • Connect LabQuest to a computer running Logger Pro using a USB cable. If there is an
active LabQuest session containing data, Logger Pro will prompt you to retrieve it. Click No. Retrieving remote data in this manner will not bring over your Run names. Instead, choose LabQuest Browser from the Logger Pro File menu and select Open. Choose from the list of saved files.
• Save the LabQuest file to a USB thumb drive or SD card, and then transfer the file onto your computer. Logger Pro will be able to open the LabQuest file.
Figure 6 Water quality data graphed and mapped in Logger Pro
LabQuest
2
Water Quality with Vernier © Vernier Software & Technology 9
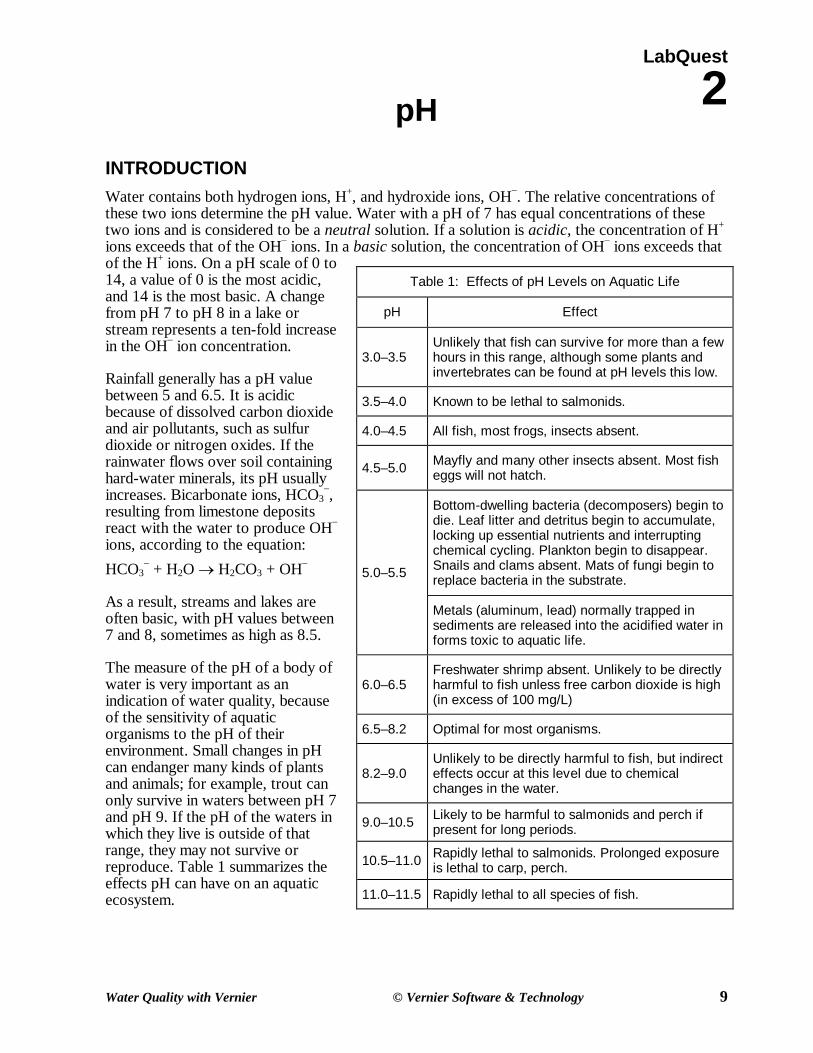
pH INTRODUCTION Water contains both hydrogen ions, H+, and hydroxide ions, OH–. The relative concentrations of these two ions determine the pH value. Water with a pH of 7 has equal concentrations of these two ions and is considered to be a neutral solution. If a solution is acidic, the concentration of H+ ions exceeds that of the OH– ions. In a basic solution, the concentration of OH– ions exceeds that of the H+ ions. On a pH scale of 0 to 14, a value of 0 is the most acidic, and 14 is the most basic. A change from pH 7 to pH 8 in a lake or stream represents a ten-fold increase in the OH– ion concentration.
Rainfall generally has a pH value between 5 and 6.5. It is acidic because of dissolved carbon dioxide and air pollutants, such as sulfur dioxide or nitrogen oxides. If the rainwater flows over soil containing hard-water minerals, its pH usually increases. Bicarbonate ions, HCO3
–, resulting from limestone deposits react with the water to produce OH– ions, according to the equation: HCO3
– + H2O → H2CO3 + OH–
As a result, streams and lakes are often basic, with pH values between 7 and 8, sometimes as high as 8.5.
The measure of the pH of a body of water is very important as an indication of water quality, because of the sensitivity of aquatic organisms to the pH of their environment. Small changes in pH can endanger many kinds of plants and animals; for example, trout can only survive in waters between pH 7 and pH 9. If the pH of the waters in which they live is outside of that range, they may not survive or reproduce. Table 1 summarizes the effects pH can have on an aquatic ecosystem.
Table 1: Effects of pH Levels on Aquatic Life
pH Effect
3.0–3.5 Unlikely that fish can survive for more than a few hours in this range, although some plants and invertebrates can be found at pH levels this low.
3.5–4.0 Known to be lethal to salmonids.
4.0–4.5 All fish, most frogs, insects absent.
4.5–5.0 Mayfly and many other insects absent. Most fish eggs will not hatch.
5.0–5.5
Bottom-dwelling bacteria (decomposers) begin to die. Leaf litter and detritus begin to accumulate, locking up essential nutrients and interrupting chemical cycling. Plankton begin to disappear. Snails and clams absent. Mats of fungi begin to replace bacteria in the substrate.
Metals (aluminum, lead) normally trapped in sediments are released into the acidified water in forms toxic to aquatic life.
6.0–6.5 Freshwater shrimp absent. Unlikely to be directly harmful to fish unless free carbon dioxide is high (in excess of 100 mg/L)
6.5–8.2 Optimal for most organisms.
8.2–9.0 Unlikely to be directly harmful to fish, but indirect effects occur at this level due to chemical changes in the water.
9.0–10.5 Likely to be harmful to salmonids and perch if present for long periods.
10.5–11.0 Rapidly lethal to salmonids. Prolonged exposure is lethal to carp, perch.
11.0–11.5 Rapidly lethal to all species of fish.

LabQuest 2
10 Water Quality with Vernier
Changes in pH can also be caused by algal blooms (more basic), industrial processes resulting in a release of bases or acids (raising or lowering pH), or the oxidation of sulfide-containing sediments (more acidic).
To gain a full understanding of the relationship between pH and water quality, measurements of the pH of a stream, as described in this test, and the stream’s alkalinity, as described in Test 11 in this book need to be made. Alkalinity is a measurement of the capacity or ability of the body of water to neutralize acids in the water. Acidic rainfall may have very little effect on the pH of a stream or lake if the region is rich in minerals that result in high alkalinity values. Higher concentrations of carbonate, bicarbonate, and hydroxide ions from limestone can provide a natural buffering capacity, capable of neutralizing many of the H+ ions from the acid. Other regions may have low concentrations of alkalinity ions to reduce the effects of acids in the rainfall. In the Northeastern United States and Eastern Canada, fish populations in some lakes have been significantly lowered due to the acidity of the water caused by acidic rainfall. If the water is very acidic, heavy metals may be released into the water and can accumulate on the gills of fish or cause deformities that reduce the likelihood of survival. In some cases, older fish will continue to live, but they will be unable to reproduce because of the sensitivity of the reproductive portion of the growth cycle.
MATERIALS
LabQuest Vernier pH Sensor distilled water waste container wash bottle (optional) sampling container (optional) Calibration Materials (optional) pH 4 buffer solution pH 7 buffer solution
COLLECTION AND STORAGE OF SAMPLES
• This test can be conducted on site or in the lab. • It is important to obtain the water sample from below the surface of the water and as far
away from shore as is safe. If suitable areas of the stream appear to be unreachable, samplers consisting of a rod and container can be constructed for collection. At least 100 mL of water is required.
• If the testing cannot be conducted within a few hours, store samples in an ice chest or refrigerator.
CALIBRATION 1. Calibrate the pH Sensor.
• If your instructor directs you to use the stored calibration, proceed directly to Step 3. • If your instructor directs you to perform a new calibration for the pH Sensor, proceed to
Step 1a. Note: It is recommended that the calibration be performed prior to going into the field.

pH
Water Quality with Vernier 11
First Calibration Point a. Connect the pH Sensor to LabQuest. b. Choose Calibrate from the Sensors menu and select Calibrate Now. c. Remove the sensor from the bottle by loosening the lid, then rinse the sensor with distilled
water into a waste container. d. Place the sensor tip into pH 4 buffer. Enter 4 as the known pH value for Reading 1. e. When the voltage reading stabilizes, tap Keep.
Second Calibration Point f. Rinse the pH Sensor with distilled water into a waste container. g. Place the sensor tip into the pH 7 buffer. Enter 7 as the known pH value for Reading 2. h. When the voltage reading stabilizes, tap Keep.
2. Save the calibration onto the sensor.
a. Select the Storage tab. b. Tap Save Calibration to Sensor and follow the onscreen instructions to save the calibration. c. Tap OK. d. Rinse the pH Sensor with distilled water into a waste container. e. If the test will not be completed immediately, replace the sensor in its storage solution.
PROCEDURE 3. Ensure that the pH Sensor is connected to LabQuest and that the correct date and location are
displayed, if using Data Matrix mode.
4. Unscrew the storage bottle cap and gently remove the pH Sensor. Rinse the tip thoroughly with distilled water into a waste container.
5. Place the tip of the sensor into the sample water. Note: The handle is not waterproof. Submerge the sensor tip no more than 3–4 cm.
6. Once the pH reading has stabilized, tap it to keep the value.
7. When finished with the pH Sensor, rinse the tip thoroughly with distilled water into a waste container and return to its storage solution.
8. If testing is complete at this time, stop data collection. If not, proceed to your next test.

LabQuest 2
12 Water Quality with Vernier
DATA Site Information
Name of site
Date of collection
Time of collection
Group members
Field Observations (e.g., weather, geography, and vegetation along stream)
Test Results
pH value
Date test completed
Time test completed
Test completed by

LabQuest
5
Water Quality with Vernier © Vernier Software & Technology 13
Dissolved Oxygen INTRODUCTION Oxygen gas dissolved in water is vital to the existence of most aquatic organisms. Oxygen is a key component in cellular respiration for both aquatic and terrestrial life. The concentration of dissolved oxygen, DO, in an aquatic environment is an important indicator of the environment’s water quality.
Some organisms, such as salmon, mayflies, and trout, require high concentrations of dissolved oxygen. Other organisms, such as catfish, mosquito larvae, and carp, can survive in environments with lower concentrations of dissolved oxygen. The diversity of organisms is greatest at higher DO concentrations. Table 1 lists the minimum dissolved oxygen concentrations necessary to sustain selected animals.
Oxygen gas is dissolved in water by a variety of processes—diffusion between the atmosphere and water at its surface, aeration as water flows over rocks and other debris, churning of water by waves and wind, and photosynthesis of aquatic plants. There are many factors that affect the concentration of dissolved oxygen in an aquatic environment. These factors include: temperature, stream flow, air pressure, aquatic plants, decaying organic matter, and human activities.
As a result of plant activity, DO levels may fluctuate during the day, rising throughout the morning and reaching a peak in the afternoon. At night photosynthesis ceases, but plants and animals continue to respire, causing a decrease in DO levels. Because large daily fluctuations are possible, DO tests should be performed at the same time each day. Large fluctuations in dissolved oxygen levels over a short period of time may be the result of an algal bloom. While the algae population is growing at a fast rate, dissolved oxygen levels increase. Soon the algae begin to die and are decomposed by aerobic bacteria, which use up the oxygen. As a greater number of algae die, the oxygen requirement of the aerobic decomposers increases, resulting in a sharp drop in dissolved oxygen levels. Following an algal bloom, oxygen levels can be so low that fish and other aquatic organisms can suffocate and die.
Temperature is important to the ability of oxygen to dissolve, because oxygen, like all gases, has different solubilities at different temperatures. Cooler waters have a greater capacity for dissolved oxygen than warmer waters. Human activities, such as the removal of foliage along a stream or the release of warm water used in industrial processes, can cause an increase in water temperature along a given stretch of the stream. This results in a lower dissolved oxygen capacity for the stream.
SUMMARY OF METHODS Method 1: Optical DO Probe A Vernier Optical DO Probe is used to measure the dissolved oxygen concentration in the water either on site or after returning to the lab.
Table 1: Minimum DO Requirements
Organism Minimum
dissolved oxygen (mg/L)
Trout 6.5
Smallmouth bass 6.5
Caddisfly larvae 4.0
Mayfly larvae 4.0
Catfish 2.5
Carp 2.0
Mosquito larvae 1.0

LabQuest 5
14 Water Quality with Vernier
Method 2: Dissolved Oxygen Probe A Vernier Dissolved Oxygen Probe is used to measure the dissolved oxygen concentration in the water either on site or after returning to the lab.
METHOD 1: OPTICAL DO PROBE MATERIALS
LabQuest Vernier Optical DO Probe distilled water sampling container (optional) wash bottle (optional)
COLLECTION AND STORAGE OF SAMPLES
• This test can be conducted on site or in the lab. • If you are going to take readings after returning to the laboratory, make sure that there are
no air bubbles in the water-sample container and that the container is tightly stoppered. The sample should be stored in an ice chest or refrigerator until measurements are to be made. Storing water samples for later testing decreases sample accuracy and is only recommended in cases where measuring at the site is not possible.
• It is important to obtain the water sample from below the surface of the water and as far away from shore as is safe. If suitable areas of the stream appear to be unreachable, samplers consisting of a rod and container can be constructed for collection. At least 100 mL of water is required.
• Avoid mixing the water sample with air. Doing so will change the dissolved oxygen concentration of the sample.
• When taking readings in cold (0–10°C) or warm (25–35°C) water, allow more time for the dissolved oxygen readings to stabilize. Automatic temperature compensation in the dissolved oxygen probe is not instantaneous and readings may take up to 2 minutes to stabilize depending on the temperature.
CALIBRATION 1. Calibrate the Optical DO Probe.
• If your instructor directs you to use the stored calibration, proceed directly to Step 3. • If your instructor directs you to perform a new calibration for the Optical DO Probe,
proceed to Step 1a. Note: It is recommended that the calibration be performed prior to going into the field.
a. Set the switch on the Optical DO Probe to mg/L or % saturation, as directed by your
instructor. The switch is located on the box containing the microSD card. b. Connect the Optical DO Probe to LabQuest. Choose New from the File menu. c. Choose Calibrate from the Sensors menu. d. Select One Point Calibration, check box to select it. Tap Calibrate Now.

Dissolved Oxygen
Water Quality with Vernier 15
e. Remove the entire storage bottle and add distilled water to the top of the sponge. Insert the probe back into the bottle. The tip of the probe should not be touching the water or the sponge. Keep the probe in this position for a minimum of 60 seconds.
f. Enter 100 if using percent saturation, or the mg/L value from Table 2 using the current barometric pressure and air temperature values. If you do not have the current air pressure, use Table 3 to estimate the air pressure at your altitude.
g. When the displayed voltage reading stabilizes, tap Keep. 2. Save the calibration onto the sensor.
a. Select the Storage tab. b. Tap Save Calibration to Sensor and follow the onscreen instructions to save the calibration. c. Tap OK.
PROCEDURE 3. Ensure the Optical DO Probe is connected to LabQuest and that the switch is set to mg/L or
% saturation, as directed by your instructor. If using Data Matrix mode, confirm that the correct date and location are displayed.
4. Remove the entire storage bottle.
5. Place the tip of the sensor into the sample water. Note: The probe itself is waterproof, but the box with the switch is not.
6. Once the DO reading has stabilized, tap it to keep the value.
7. When finished, rinse the tip thoroughly with distilled water into a waste container and return to its storage bottle.
8. If testing is complete at this time, stop data collection. If not, proceed to your next test.

LabQuest 5
16 Water Quality with Vernier
DATA Site Information
Name of site
Date of collection
Time of collection
Group members
Field Observations (e.g., weather, geography, and vegetation along stream)
Test Results
Dissolved Oxygen (mg/L)
Percent saturation (%)
Date test completed
Time test completed
Test completed by

LabQuest
12
Water Quality with Vernier © Vernier Software & Technology 17
Total Dissolved Solids INTRODUCTION Solids are found in streams in two forms, suspended and dissolved. Suspended solids include silt, stirred-up bottom sediment, decaying plant matter, and sewage-treatment effluent. Suspended solids will not pass through a filter, whereas dissolved solids will. Dissolved solids in freshwater samples include soluble salts that yield ions such as sodium (Na+), calcium (Ca2+), magnesium (Mg2+), bicarbonate (HCO3
–), sulfate (SO42–
), or chloride (Cl– ). Total dissolved solids, or TDS, can be determined by evaporating a pre-filtered sample to dryness, and then finding the mass of the dry residue per liter of sample. A second method uses a Vernier Conductivity Probe to determine the ability of the dissolved salts and their resulting ions in an unfiltered sample to conduct an electrical current. The conductivity is then converted to TDS. Either of these methods yields a TDS value in units of mg/L.
The TDS concentration in a body of water is affected by many different factors. A high concentration of dissolved ions is not, by itself, an indication that a stream is polluted or unhealthy. It is normal for streams to dissolve and accumulate fairly high concentrations of ions from the minerals in the rocks and soils over which they flow. If these deposits contain salts (sodium chloride or potassium chloride) or limestone (calcium carbonate), then significant concentrations of Na+, K+, Cl– will result, as well as hard-water ions, such as Ca2+ and HCO3
–.
TDS is sometimes used as a “watchdog” environmental test. Any change in the ionic composition between testing sites in a stream can quickly be detected using a Conductivity Probe. TDS values will change when ions are introduced to water from salts, acids, bases, hard-water minerals, or soluble gases that ionize in solution. However, the tests described here will not tell you the specific ion responsible for the increase or decrease in TDS. They simply give a general indication of the level of dissolved solids in the stream or lake. Further tests described in this book can then help to determine the specific ion or ions that contributed to changes in the initial TDS reading.
There are many possible human-created sources of ions that may contribute to elevated TDS readings. Fertilizers from fields and lawns can add a variety of ions to a stream. Increases in TDS can also result from runoff from roads that have been salted in the winter. Organic matter from wastewater treatment plants may contribute higher levels of nitrate or phosphate ions. Treated wastewater may also have higher TDS readings than surrounding streams if urban drinking water has been highly chlorinated. Irrigation water that is returned to a stream will often have higher concentrations of sodium or chloride ions. Acidic rainwater, with dissolved gases like CO2, NO2, or SO2, often yields elevated H+ ion concentrations.
If TDS levels are high, especially due to dissolved salts, many forms of aquatic life are affected. The salts act to dehydrate the skin of animals. It is also possible for dissolved ions to affect the pH of a body of water, which in turn may influence the health of aquatic species. High concentrations of dissolved solids can add a laxative effect to water or cause the water to have an unpleasant mineral taste. If high TDS readings are due to hard-water ions, then soaps may be less effective, or significant scaling may occur in heating pipes.

LabQuest 12
18 Water Quality with Vernier
MATERIALS LabQuest Vernier Conductivity Probe distilled water waste container 500 mg/L TDS standard solution 50 mg/L TDS standard solution (optional) wash bottle (optional) sampling container (optional)
COLLECTION AND STORAGE OF SAMPLES
• This test can be conducted on site or in the lab. A 100 mL water sample is required. • It is important to obtain the water sample from below the surface of the water as far away
from shore as is safe. If suitable areas of the stream appear to be unreachable, samplers consisting of a rod and container can be constructed for collection.
• If the testing cannot be conducted within a few hours, place the samples in an ice chest or a refrigerator.
CALIBRATION 1. Calibrate the Conductivity Probe.
• If your instructor directs you to use the stored calibration, proceed directly to Step 3. • If your instructor directs you to perform a new calibration for the Conductivity Probe,
proceed to Step 1a. Note: It is recommended that the calibration be performed prior to going into the field.
First Calibration Point a. Set the switch on the Conductivity Probe box to 0–2000 µS/cm (2000 µS/cm =
1000 mg/L TDS) and connect the probe to LabQuest. b. Choose Change units from the Sensors menu and select mg/L. c. Choose Calibrate from the Sensors menu and select Calibrate Now. d. Hold the probe in the air (e.g., out of any solution) and enter 0 as the mg/L TDS value for
Reading 1. e. When the voltage reading stabilizes, tap Keep.
Second Calibration Point f. Rinse the Conductivity Probe with distilled water into a waste container. g. Place the probe into the 500 mg/L TDS standard solution. The hole near the tip of the
probe should be covered completely. h. Enter 500 as the mg/L TDS value for Reading 2. i. When the voltage reading stabilizes, tap Keep.
2. Save the calibration onto the sensor.
a. Select the Storage tab. b. Tap Save Calibration to Sensor and follow the onscreen instructions to save the calibration. c. Tap OK.

Total Dissolved Solids
Water Quality with Vernier 19
d. Rinse the Conductivity Probe with distilled water into a waste container. e. If the test will not be completed immediately, gently dry off the probe and store properly.
PROCEDURE 3. Ensure the switch on the Conductivity Probe box is set to 0–2000 µS/cm (2000 µS/cm =
1000 mg/L TDS) and that it is connected to LabQuest.
4. If the units are not displaying mg/L, choose Change units from the Sensors menu and select mg/L.
5. If using Data Matrix mode, check that the correct date and location are displayed.
6. Place the tip of the probe into the sample water. The hole near the tip of the probe should be covered completely. Note: The handle is not waterproof. Submerge the sensor tip no more than 4–5 cm.
7. Once the reading has stabilized, tap it to keep the value.1
8. When finished with the Conductivity Probe, rinse the tip thoroughly with distilled water into a waste container and store properly.
9. If testing is complete at this time, stop data collection. If not, proceed to your next test.
1 If your readings are less than 100 mg/L, you may choose to recalibrate the probe for a lower range setting of 0–100 mg/L for more accurate results. To do this, change the setting on the probe box to 0–200 µS/cm and repeat Steps 1–7. Use the stored 100 mg/L TDS calibration, or calibrate with a 50 mg/L TDS standard provided by your instructor.
LabQuest 12
20 Water Quality with Vernier
DATA Site Information
Name of site
Date of collection
Time of collection
Group members
Field Observations (e.g., weather, geography, and vegetation along stream)
Test Results
TDS (mg/L)
Date test completed
Time test completed
Test completed by

LabQuest
3
Water Quality with Vernier © Vernier Software & Technology 21
Turbidity INTRODUCTION Turbidity is a measure of water’s lack of clarity. Water with high turbidity is cloudy, while water with low turbidity is clear. The cloudiness is produced by light reflecting off of particles in the water; therefore, the more particles in the water, the higher the turbidity.
Many factors can contribute to the turbidity of water. An increase in stream flow due to heavy rains or a decrease in stream-bank vegetation can speed up the process of soil erosion. This will add suspended particles, such as clay and silt, to the water.
Runoff of various types contains suspended solids that may add to the turbidity of a stream. Agricultural runoff often contains suspended soil particles. Other types of runoff include industrial waste, water treatment plant effluent, and urban runoff from parking lots, roads, and rooftops.
Bottom-dwelling aquatic organisms, such as catfish, can contribute to the turbidity of the water by stirring up the sediment that has built up on the bottom of the stream. Organic matter such as plankton or decaying plant and animal matter that is suspended in the water can also increase the turbidity in a stream.
High turbidity will decrease the amount of sunlight able to penetrate the water, thereby decreasing the photosynthetic rate. Reduced clarity also makes the water less aesthetically pleasing. While this may not be harmful directly, it is certainly undesirable for many water uses.
When the water is cloudy, sunlight will warm it more efficiently. This occurs because the suspended particles in the water absorb the sunlight, warming the surrounding water. This can lead to other problems associated with increased temperature levels.
While highly turbid water can be detrimental to an aquatic ecosystem, it is not correct to assume that clear water is always healthy. Slightly turbid water can be perfectly healthy, while clear water could contain unseen toxins or unhealthy levels of nutrients.
MATERIALS
LabQuest Vernier Turbidity Sensor soft, lint-free cloth or tissue distilled water turbidity cuvette turbidity standard (StableCal® Formazin Standard 100 NTU) sampling container with lid (optional)
COLLECTION AND STORAGE OF SAMPLES
• This test can be conducted on site or in the lab. • Stand upstream from any activity that could stir up sediment and affect your readings. Hold
the sample bottle upstream from your body.

LabQuest 3
22 Water Quality with Vernier
• It is important to obtain the water sample from below the surface of the water and as far away from the shore as is safe. If suitable areas of the stream appear to be unreachable, samplers consisting of a rod and container can be constructed for collection.
• Obtain the sample either directly in the turbidity cuvette, or in a container that has a lid to allow for gentle mixing just prior to testing. Approximately 35 mL of water is required.
• If the testing cannot be conducted within a few hours, place the sample in an ice chest or a refrigerator.
CALIBRATION 1. Calibrate the Turbidity Sensor.
• If your instructor directs you to use the stored calibration, proceed directly to Step 3. • If your instructor directs you to perform a new calibration for the Turbidity Sensor, proceed
to Step 1a. Note: It is recommended that the calibration be performed prior to going into the field.
First Calibration Point a. Place the Turbidity Sensor on a flat surface and connect to LabQuest. b. Wait approximately five minutes for the sensor to warm up. c. Choose Calibrate from the Sensors menu and select Calibrate Now. d. Prepare a blank by rinsing the turbidity cuvette with distilled water, then filling it with
distilled water so that the bottom of the meniscus is even with the top of the white line. Place the lid on the cuvette. Gently wipe the outside with a soft, lint-free cloth or tissue.
e. Check the cuvette for air bubbles. If air bubbles are present, gently tap the bottom of the cuvette on a hard surface to dislodge them.
f. Holding the cuvette by the lid, place it in the Turbidity Sensor. Make sure that the mark on the cuvette is aligned with the mark on the Turbidity Sensor. Close the lid.
g. Enter 0 as the known turbidity value for Reading 1. h. When the voltage reading stabilizes, tap Keep. i. Remove the cuvette, discard the contents, and set aside for use in Step 5.
Second Calibration Point j. Obtain the cuvette containing the turbidity standard (100 NTU) and gently invert it four
times to mix in any particles that may have settled to the bottom. Important: Do not shake the standard. Shaking will introduce tiny air bubbles that will affect turbidity.
k. Wipe the outside with a soft, lint-free cloth or tissue. l. Holding the standard by the lid, place it in the Turbidity Sensor. Make sure that the mark
on the cuvette is aligned with the mark on the Turbidity Sensor. Close the lid. m. Enter 100 as the known turbidity value for Reading 2. n. When the voltage reading stabilizes, tap Keep.
2. Save the calibration onto the sensor.
a. Select the Storage tab. b. Tap Save Calibration to Sensor and follow the onscreen instructions to save the calibration. c. Tap OK. d. Remove the turbidity standard from the sensor.

Turbidity
Water Quality with Vernier 23
PROCEDURE 3. Place the Turbidity Sensor on a flat surface, connect to LabQuest, and wait approximately
5 minutes for the sensor to warm up (if not already warmed up).
4. Ensure that the correct date and location are displayed, if using Data Matrix mode.
5. Prepare the sample. a. Obtain the sample either directly in the turbidity cuvette or from a sampling container. The
bottom of the meniscus of the sample water should be even with the top of the white line on the cuvette. Important: If the sample has been sitting, gently invert it four times to mix in any particles that may have settled to the bottom. Do not shake the sample. Shaking will introduce tiny air bubbles that will affect the turbidity value.
b. Place the lid on the cuvette. Gently dry the outside with a soft, lint-free cloth or tissue. Ensure the glass is wiped clean with no fingerprints or residue.
c. Check the cuvette for air bubbles. If air bubbles are present, gently tap the bottom of the cuvette on a hard surface to dislodge them.
d. Holding the cuvette by the lid, place it into the Turbidity Sensor. Make sure that the mark on the cuvette is aligned with the mark on the Turbidity Sensor. Close the lid.
6. Once the turbidity reading has stabilized, tap it to keep the value.
7. When finished with the Turbidity Sensor, empty the cuvette and rinse thoroughly with distilled water.
8. If testing is complete at this time, stop data collection. If not, proceed to your next test.

LabQuest 3
24 Water Quality with Vernier
DATA Site Information
Name of site
Date of collection
Time of collection
Group members
Field Observations (e.g., weather, geography, and vegetation along stream)
Test Results
Turbidity (NTU)
Date test completed
Time test completed
Test completed by