simplified design procedures for precast hybrid frames · department of civil engineering and...
TRANSCRIPT

UNIVERSITY OF WISCONSIN MILWAUKEE
Department of Civil Engineering and Mechanics
Simplified Design Proceduresfor Precast Hybrid Frames
Research Team:
Dr. Adeeb Rahman, Assistant Professor (PI)
Dr. Habib Tabatabai, Associate Professor (Co-PI)
Mr. Rami Hawileh, PhD Candidate
Submitted to:
PCI: Precast / Prestressed Concrete Institute
209 West Jackson Boulevard
Chicago, IL 60606-6938
Final Report
September, 04, 2004
Conclusions or recommendations in this report are the opinions of the authors. PCI assumes no responsibility for the interpretation or application of the information contained herein.

ACKNOWLEDGEMENTS
The research team at the University of Wisconsin-Milwaukee would like to acknowledge
the Precast/Prestressed Concrete Institute for providing the funds to conduct this research.
This work has been funded through the PCI-Daniel P. Jenny Research Fellowship for
2003-2004. The research team would like to thank the Industry Advisory Panel: S. K.
Ghosh, Ned Cleland, Roger Becker, and Sri Sritharan for providing technical support at
various level of this proj ect. Their recommendations, suggestions and critique continue to
be valuable in advancing the knowledge in this filed. We also would like to acknowledge
Fattah Shaikh for providing valuable technical insight and for his continued support. Our
thanks also go to Paul Johal, Research Director, who facilitated the administration and
the technical oversight of this project at the PCI office. Our thanks also is extended to A1
Ghorbanpoor, the Director of the structures laboratory at UWM and Rahim Reshadi,
Instrumentation Specialist, for providing facilitative support for parts of this project.
Conclusions or recommendations in this report are the opinions of the authors. PCI assumes no responsibility for the interpretation or application of the information contained herein.

Table of Contents
List of Figures
List of Tables
Abstract
Chapter 1 Introduction
1.1 Background
1.2 Objectives
1.3 Hybrid Frame - Concept Description
1.4 Report Organization
Chapter 2 Fracture Criteria for the Unbonded Mild Steel Bars in Hybrid Frames
2.1 Introduction
2.2 Bending calculations for bars
2.3 Axial strain calculations for bars
2.4 Inelastically deformed geometry of bars
2.4.1 The FE model
2.4.2 Types of elements
2.4.3 Material properties
2.4.4 Boundary conditions and loads
2.4.5 Results
2.5 Low-cycle fatigue for bar fracture
2.5.1 Introduction
2.5.2 Low-cycle fatigue relationships for reinforcing steel bars
2.6 Effects of nonzero mean strain on low-cycle fatigue behavior
iv
vii
viii
1
1
1
2
4
6
6
7
9
13
14
17
20
22
22
35.
35
36
42
Conclusions or recommendations in this report are the opinions of the authors. PCI assumes no responsibility for the interpretation or application of the information contained herein.

2.7 Effect of grout in the duct
Chapter 3 Simplified Design Procedures for Precast Hybrid Frames
3.1 Hybrid frame - PRESSS design procedure
3.2 Overview of Other Design Factors
3.3 Development of non-dimensional procedure
3.4 Summary of Proposed non-dimensional steps
3.8 Parametric studies
3.9 Results from the parametric studies
Chapter 4 Design Examples
4.1 Example # 1
4.1.1 Basic solution using PRESSS procedure
4.1.2 Solution using modified non-dimensional design procedure based on PRESSS
4.1.3 Solution using proposed design charts
4.1.4 Solution using design equations
4.2 Example # 2
4.2.1 Basic solution using PRESSS procedure
4.2.2 Solution using modified non-dimensional design procedure based on PRESSS
4.2.3 Solution using proposed design charts
4.2.4 Solution using design equations
4.3 Example # 3
4.3.1 Basic solution using PRESSS procedure
4.3.2 Solution using modified non-dimensional design procedure based on PRESSS
4.3.3 Solution using proposed design charts
42
45
45
56
60
69
71
73
85
85
87
93
99
100
103
105
111
117
117
120
122
128
134
ii
Conclusions or recommendations in this report are the opinions of the authors. PCI assumes no responsibility for the interpretation or application of the information contained herein.

4.3.4 Solution using design equations
4.4 Example # 4
4.4.1 Basic solution using PRESSS procedure
4.4.2 Solution using modified non-dimensional design procedure based on PRESSS
4.4.3 Solution using proposed design charts
4.4.4 Solution using design equations
4.5 Example # 5
4.5.1 Basic solution using PRESSS procedure
4.5.2 Solution using modified non-dimensional design procedure based on PRESSS
4.5.3 Solution using proposed design charts
4.5.4 Solution using design equations
Chapter 5 Summary and conclusions
Appendix A EXCEL spreadsheet example
References
135
138
140
146
152
153
156
158
164
170
171
174
177
181
iii
Conclusions or recommendations in this report are the opinions of the authors. PCI assumes no responsibility for the interpretation or application of the information contained herein.
List of Figures
Figure 1.1 Hybrid flame
Figure 1.2 Drift vs relative strength of resisting elements
Figure 2.1 Deformed segment of the mild steel bar
Figure 2.2 Path of point D of the unbonded segment of the mild steel bar
Figure 2.3 Location of the center of rotation at Odes
Figure 2.4 Isoparametric view of the entire model
Figure 2.5 Isoparametric view of the concrete blocks
Figure 2.6 Isoparametric view of the mild steel bar
Figure 2.7 Isoparametric view of the duet grout
Figure 2.8 BEAM 188 3-D linear finite strain beam
Figure 2.9 Mild steel bar cross section
Figure 2.10 Duct grout cross section
Figure 2.11 Concrete cross section
Figure 2.12 Stress-strain curve of grade 60 mild steel bar
Figure 2.13 Stress-strain model for concrete
Figure 2.14 Deflected shape of the model
Figure 2.15 Horizontal deformation (in) of the model
Figure 2.16 Horizontal deformation (in) of the mild steel bar
Figure 2.17 Vertical deformation (in) of the model
Figure 2.18 Vertical deflection (in) of the mild steel bar
Figure 2.19 Mild steel bar axial total strain distribution
Figure 2.20 Axial total strain distribution Of the unbonded mild steel bar
3
4
7
10
11
15
15
16
16
18
18
19
19
21
21
23
23
24
24
25
25
26
iv
Conclusions or recommendations in this report are the opinions of the authors. PCI assumes no responsibility for the interpretation or application of the information contained herein.

Figure 2.21 Mild steel bar axial stress distribution
Figure 2.22 Axial stress distribution of unbonded mild steel bar
Figure 2.23 Axial total strain distribution for concrete block
Figure 2.24 Axial total strain distribution for grout
Figure 2.25 Vertical deformation of the unbonded segment of the bar
Figure 2.26 Vertical deformation of the unbonded segment of the bar
Figure 2.27 Slope (rotation) of the unbonded segment of the bar
Figure 2.28 2nd derivative of the unbonded segment of the bar
Figure 2.29 Curvature of the unbonded segment of the bar
Figure 2.30 Bending strain of the unbonded segment of the bar
Figure 2.31 Plastic strain-life relationship
Figure 3.1 Location of forces at design drift
Figure 3.2 Number of cycles to failure versus the period of the structure
Figure 3.3 Sample view from EXCEL spreadsheet
Figure 3.4 [Mdes/Aphbfp,des] versus qb for 8s,max = 4%
Figure 3.5 [Mp,acs/Mdes] versus do for ~s,n~x = 4%
Figure 3.6 [Maes/As)~s,deshbfsy] versus ~ for es,max = 4%
Figure 3.7 [Mdes/Aphbfp,des] versus do for ~s,n~x = 2%
Figure 3.8 [Mp,ae~/Ma~] versus d~ for ~,max = 2%
Figure 3.9 [Maes/A~)~,ac~hbfsy] versus dO for ~,max = 2%
Figure 3.10 Ap/bh versus qb for f ’e = 5 ksi and fpi = 0.65 fpu
Figure 3.11 Ap/bh versus ~ for 0d¢s = 2% and fpi = 0.65 fpu
26
27
27
28
29
29
31
31
32
32
39
46
59
72
75
75
76
76
77
77
78
78
V
Conclusions or recommendations in this report are the opinions of the authors. PCI assumes no responsibility for the interpretation or application of the information contained herein.

Figure 3.12 Ap/bh versus ~b for Odes = 2% and f ’e
Figure 3.13 rides versus 91
Figure 3,14 fp,des/fpy versus ~b for fpi = 0.65 fpu
Figure 3.15 fsy/fp,des versus ( for fpi = 0.65 fpu
Figure 3.16 fp,des/fpy versus d~ for 0d~ = 2%
Figure 3.17 f~y/fp,d~s versus d~ for Odes = 2%
= 5 ksi 79
79
80
8O
81
81
vi
Conclusions or recommendations in this report are the opinions of the authors. PCI assumes no responsibility for the interpretation or application of the information contained herein.

List of Tables
Table 2.1 Study cases 14
Table 2.2 Model dimensions 17
Table 2.3 Materiai’s properties 20
Table 2.4 FEA results 28
Table 2.5 Predicted results compared with FEA results 35
Table 2.6 Effective axial strain calculations 41
Table 2.7 Average strain in the bar due to grout effect 44
Table 3.1 Material properties of hybrid frame components 48
Table 3.2Bar strains and corresponding over-strength factors for ASTM A706 bars48
Table 3.3 Range of parameters used in the parametric studies 73
Table 4.1 Material properties and design information for example 1 86
Table 4.2 Results compared using the four methods 102
Table 4.3 Material properties and design information for example 2 104
Table 4.4 Results compared using the four methods 119
Table 4.5 Material properties and design information for example 3 121
Table 4.6 Results compared using the four methods 137
Table 4.7 Material properties and design information for example 4 139
Table 4.8 Results compared using the four methods 155
Table 419 Material properties and design information for example 5 157
Table 4.10 Results compared using the four methods 173
vii
Conclusions or recommendations in this report are the opinions of the authors. PCI assumes no responsibility for the interpretation or application of the information contained herein.

ABSTRACT
In the Precast Seismic Structural Systems (PRESSS) research program (Stanton and
Nakaki, 2002), the unbonded post-tensioned frame with damping (hybrid frame)
performed very well in the experimental evaluation. The hybrid frame system offers
an important feature that allows the designer to eliminate residual drift aider an
earthquake. The PRESSS report outlined a series of step-by-step design procedures
for hybrid frames. In this project, the objective is to develop simplified design
procedures for precast hybrid frames. A set of new dimensionless parameters and
procedures for the design of hybrid frame is developed to replace current dimensional
parameters. A mild steel fracture criterion under combined axial and bending strains
is also proposed. Parametric studies were performed using the developed non-
dimensional formulation. These involved solving optimization problems to minimize
overall drift and achieve zero residual drift. The results of these studies were used to
generate non-dimensional design charts and simplified equations. Design examples
representing low and high seismic zones are presented. The results of the three
procedures (PRESSS, proposed design charts, and proposed design equations) are
compared. Very close agreement was found in all cases.
oooVlll
Conclusions or recommendations in this report are the opinions of the authors. PCI assumes no responsibility for the interpretation or application of the information contained herein.

Chapter I
INTRODUCTION
1.1 Background
In the Precast Seismic Structural Systems (PRESSS) report Volume 3 - 09 (Stanton and
Nakaki, 2002), a total of five different seismic structural systems made from precast
concrete elements were proposed. These systems formed various parts of the structural
framing in the PRESSS Phase III experimental building that was tested at the University
of California at San Diego.
The unbonded post-tensioned frame with damping (hybrid frame) performed very well in
the PRESSS evaluation. The hybrid frame system offers an important feature that allows
the designer to eliminate residual drift after an earthquake: This feature is not available in
the framing systems recognized in the 1997 Uiform Building Code (UBC). The PRESSS
report outlined a series of step-by-step design procedures for hybrid frames.
1.20b|ectives
One of the recommendations in the PRESSS report involved the development of a series
of design examples for the Hybrid frame. The objectives of this research are:
1. To develop a set of new dimensionless parameters to replace current dimensional
parameters in the calculation process.
2. To perform parametric studies based on a new non-dimensional formulation of
the PRESSS design procedures. These studies involve solving a large number of
optimization problems to minimize overall chill and achieve zero residual drift.
Design charts will be generated based on these parametric studies.
Conclusions or recommendations in this report are the opinions of the authors. PCI assumes no responsibility for the interpretation or application of the information contained herein.

3. To develop and verify simplified equations for the design of hybrid frames. These
charts and equations will enable designers to perform the design in fewer number
of steps, while affording them the opportunity to easily see how changing one or
more parameters would affect the design.
4. To develop a mild steel fracture criterion under combined axial and bending
strains by controlling the total plastic strain in the bar below a maximum value.
5. To prepare a number of design examples that includes comparisons of PRESSS
and new procedures.
1.3 Hybrid Frame - Concept Description
The hybrid frames contain precast elements (beams and columns) that are connected by
unbonded post-tensioning steel and bonded reinforcement bars, both of which contribute
to the overall moment resistance (Figure 1). An interesting feature of the connection
between beam and column is the hybrid combination of mild steel and post-tensioning
steel where the mild steel is used to dissipate energy by yielding in tension and
compression and the post-tensioning steel is used to clamp the beam against the column.
The post-tensioning force would act as a clamping/restoring force to bring the frame back
to its original configuration after an earthquake, and would provide for shear resistance
through friction developed at the beam-column interface. For a given total moment
strength, a higher proportion of mild steel reinforcement would result in more apparent
damping, lower peak drift, and higher residual drift.
2
Conclusions or recommendations in this report are the opinions of the authors. PCI assumes no responsibility for the interpretation or application of the information contained herein.

Mild Reinforcing (A706) --\(grouted) ~
Post-tensioningTendon (unbonded)
Reinforcing bar debondedlocally
Fiber-reinforcedGrout
Figure 1 Hybrid Frame (Stanton and Nakaki, 2002)
The general design philosophy, as presented by Stanton and Nakaki (2002), is to
minimize peak drift, maintain zero residual drift, and maximize the moment strength
provided by the mild steel reinforcement. Figure 2 shows the relationship between peak
and residual drifts, where
Conclusions or recommendations in this report are the opinions of the authors. PCI assumes no responsibility for the interpretation or application of the information contained herein.

Drift
Peak DriftResidualDrift
Mcap,s / Mcap,tot
Figure 2 Drift vs. Relative Strength of Resisting Elements(Stanton and Nakaki, 2002)
Mcap,tot = total moment strength (Mcap,p + Mcap,s)
M~ap,p = moment strength due to the post-tensioning force
Mo~p,s = moment strength due to the yielding of the mild steel reinforcement
The process of finding the best solution is basically an optimization problem that can be
implemented in a parametric study. Such a parametric study utilizing non-dimensional
parameters is the subject of this research.
1.4 Report Organization
This report consists of five chapters as described below
Chapter 1 (Introduction) covers research objectives, hybrid frame concept, and report
organization
Chapter 2 (Fracture criteria for the unbonded mild steel bars in hybrid frames) discusses
the fracture criteria for the unbonded mild steel bars, combined bending and axial strains,
and low cycle fatigue
Conclusions or recommendations in this report are the opinions of the authors. PCI assumes no responsibility for the interpretation or application of the information contained herein.

Chapter 3 (Simplified design procedures for precast hybrid frames) describes the
development and derivations of the simplified design procedure for precast hybrid frames
Chapter 4 (Design examples) covers five design examples for different seismic regions
that includes comparisons of PRESSS and new procedures.
Chapter 5 (Summary and conclusions) covers the summary and conclusions.
And finally the appendix A shows the formulation of the EXCEL spreadsheet for the first
design example.
Conclusions or recommendations in this report are the opinions of the authors. PCI assumes no responsibility for the interpretation or application of the information contained herein.

CHAPTER 2
Fracture Criteria for the Unbonded Mild Steel Bars in Hybrid Frames
2.1 Introduction
From preliminary nonlinear finite element (FE) analyses of a 3-D model of a hybrid
frame system [Hawileh, 2003], it was determined that the mild steel bars in a hybrid
frame exhibit significant inelastic axial and bending strains. Once the gap at the beam-
column interface opens, relatively high levels of repetitive plastic strains develop in the
mild steel bar. This prompted a need for considering the low-cycle fatigue of the mild
steel bars including both bending and axial strains. The relatively high inelastic strains in
the FE model show the potential vulnerability of mild steel bars to low-cycle fatigue
failure. It should be noted that both the PRESSS [Stanton and Nakaki, 2002] and
National Institute of Standards and Technology (NIST) [Cheok and Stone, 1994] test
reports indicate bar fractures during cyclic testing.
A mild steel fracture criterion is therefore needed in the design procedure for hybrid
frames by controlling the total plastic strains in the mild steel bar below a maximum
value. This criterion should be based on the low-cycle fatigue behavior of reinforcing
steel.
Mander and Panthaki (1994) studied the behavior of reinforcing steel bars under low-
cycle fatigue subjected to axial-strain reversals with strain amplitudes ranging from yield
to 6%. Liu (2001) studied the low-cycle fatigue behavior of steel bars subjected to
bending strain reversals with variable amplitudes. In this study, a mild steel fracture
6
Conclusions or recommendations in this report are the opinions of the authors. PCI assumes no responsibility for the interpretation or application of the information contained herein.
criterion under combined axial and bending strains is proposed based on the works of
Mander, Panthaki, and Liu.
2.2 Bending Strain Calculations for Bars
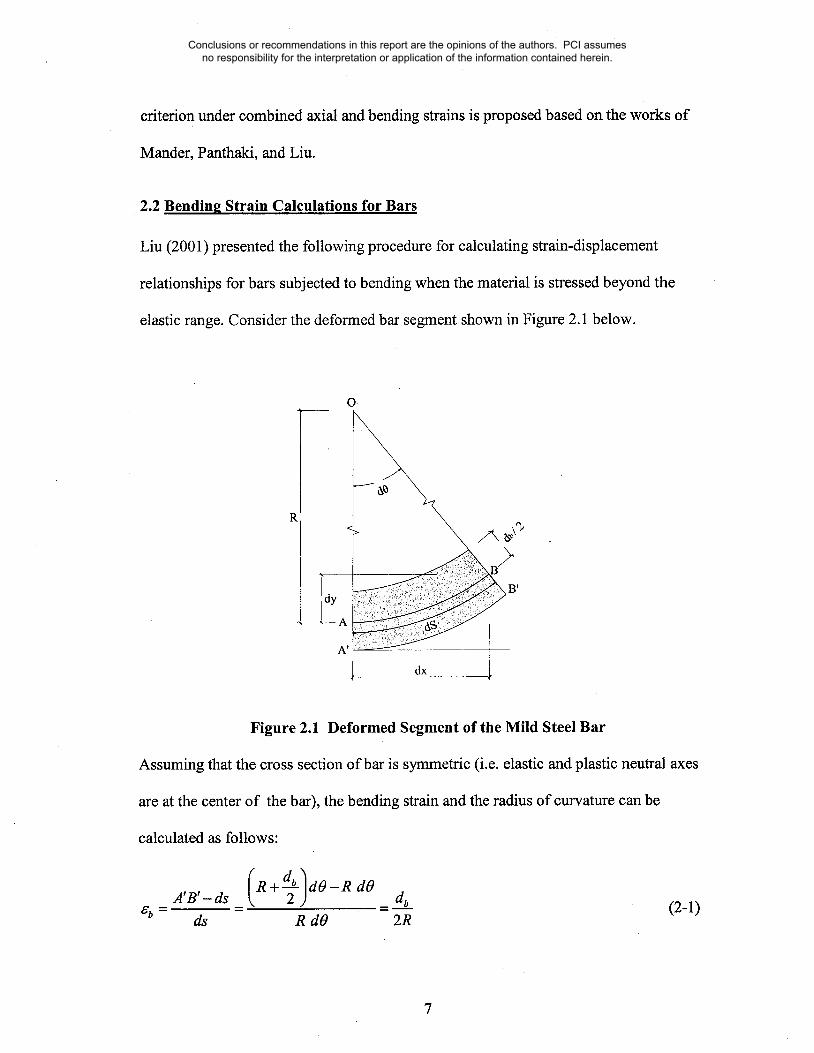
Liu (2001) presented the following procedure for calculating strain-displacement
relationships for bars subjected to bending when the material is stressed beyond the
elastic range. Consider the deformed bar segment shown in Figure 2.1 below.
R
Ydy
At
dx
Figure 2.1 Deformed Segment of the Mild Steel Bar
Assuming that the cross section of bar is symmetric (i.e. elastic and plastic neutral axes
are at the center of the bar), the bending strain and the radius of curvature can be
calculated as follows:
A’B’-ds (R +~)dO-R dO,st, = = --~--~ (2-1)
ds R dO 2R
Conclusions or recommendations in this report are the opinions of the authors. PCI assumes no responsibility for the interpretation or application of the information contained herein.
1 2~
Where
R = radius of curvature
dO = angle of rotation
ab = maximum bending strain
db = bar diameter
However,
dsz ~ dx2 + dy2 =dx2 (l +( dy)21=dx2 (l +
ds = dx(1 + y,~)l/~
But
y, dy tan0
Differentiate both sides of the above equation
y. dZy dO=-aT; = Nsec 0
=~ dO = 1 + tan~ 0 =
Knowing that
(2-2)
(2-3)
(2-4)
(2-5)
(2-6)
(2-7)
(2-8)
(2-9)
Conclusions or recommendations in this report are the opinions of the authors. PCI assumes no responsibility for the interpretation or application of the information contained herein.

ds = Rd0 (2-10)
dO 1
ds R
By inserting dO and ds values from equations 2-9 and 2-5,
Y" dx1 1 + y,2
R - dx(l + y,2 )’’2
(2-11)
(2-12)
(2-13)
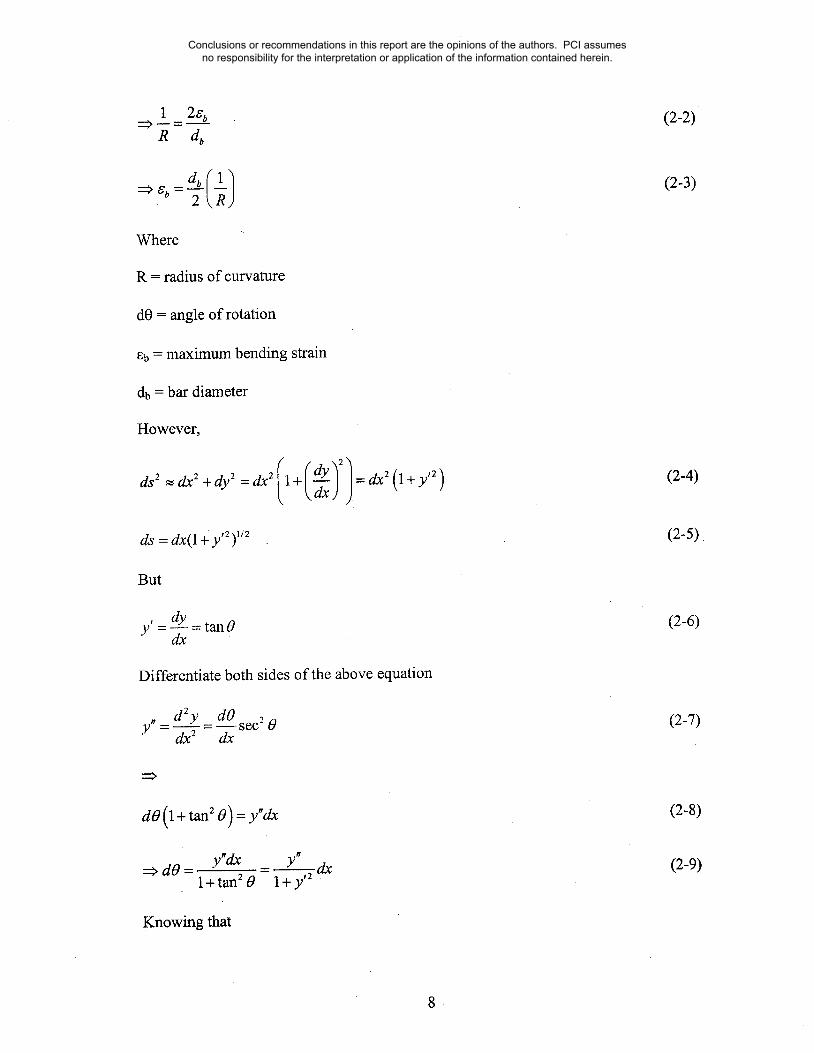
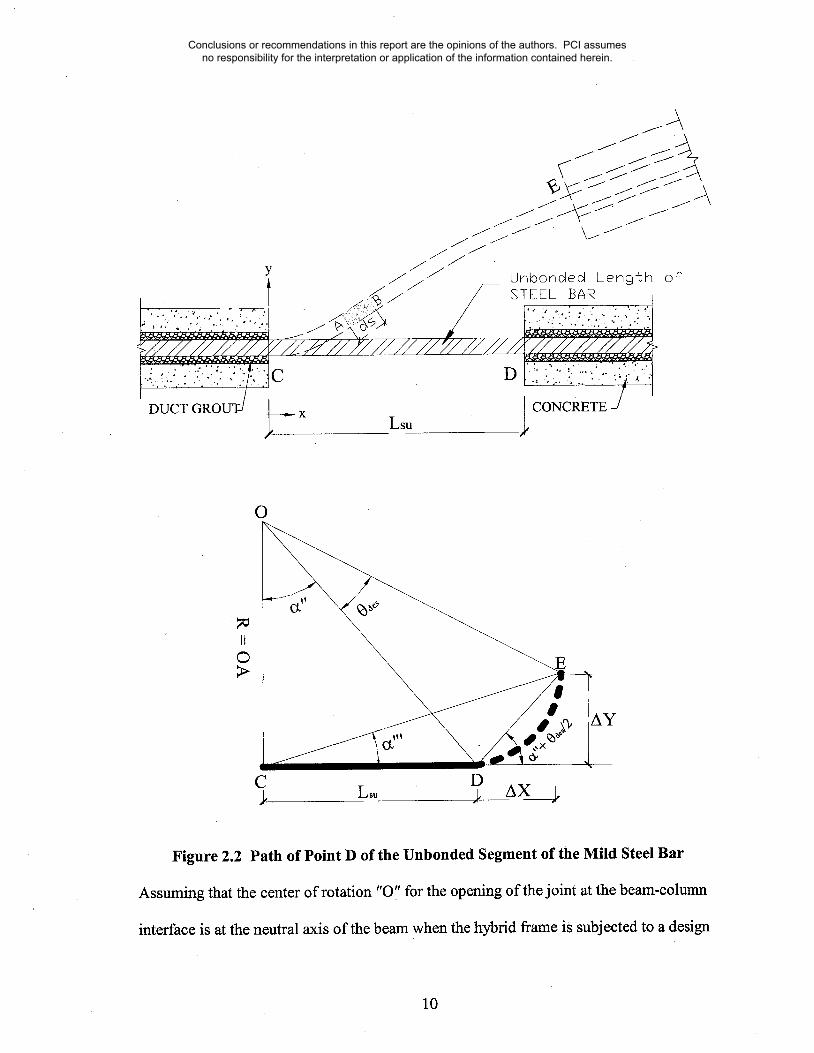
2.3 Axial Strain Calculations for Bars
In Figure 2.2 shown below, the solid line CD is the initial unbonded length of the
reinforcing bar in a hybrid frame. The dashed line DE shows the path that the end D of
the unbonded segment of the mild steel bar would take as it moves from D to E.
9
Conclusions or recommendations in this report are the opinions of the authors. PCI assumes no responsibility for the interpretation or application of the information contained herein.
D
Figure 2.2 Path of Point D of the Unbonded Segment of the Mild Steel Bar
Assuming that the center of rotation "O" for the opening of the joint at the beam-column
interface is at the neutral axis of the beam when the hybrid frame is subjected to a design
10
Conclusions or recommendations in this report are the opinions of the authors. PCI assumes no responsibility for the interpretation or application of the information contained herein.

interface rotation of Odes, the following can be written using the same assumptions as in
PRESSS program (Figure 2.2 and 2.3).
Figure 2.3 Location of the Center of Rotation at Odes (Stanton and Nakaki, 2002)
R = (1-~-rldes)hg (2-14)
rides = distance from the compression face of the beam to the neutral axis at 0 aes divided
by the height of the beam
distance from the center of the mild steel bar to the nearest face divided by the height
of the beam
hg = beam height
0 des = maximum (design) interface rotation
Lsu = unbonded length of the mild steelbar at each interface
Let:
As (2-15)
11
Conclusions or recommendations in this report are the opinions of the authors. PCI assumes no responsibility for the interpretation or application of the information contained herein.

Where As is the horizontal gap opening at the location of the tension bar at the beam-
column interface (Figure 2.3) and ea, a is the axial bar strain as calculated in the PRESSS
program assuming that there is no vertical movement at the end of the bar as a result of
rotation.
As= RO~ = hg (1-~ - rlaes)Oe~s (2-16)
(2-17)Lsu -
~a,a ~’a,a
And
tan a" = Ls---~" =R
However,
DE = OD 0~
Ba,a
And
AY= DE sin(-~+a")
(2-18)
(2-19)
(2-20)
(2-21)
(2-22)
(2-23)
12
Conclusions or recommendations in this report are the opinions of the authors. PCI assumes no responsibility for the interpretation or application of the information contained herein.

(2-24)
AYtan a" - (2-25)
02des -}- °~ a,a
"-b o° a,a COS "+- Ofn
(2-26)
The axial strain in the reinforcing bar (Eaxial) can be written as:
4(L,u + AX)2 + AY2 - L~u~’axial -- (2-27)
1
a’,=,.~, :1+ 2(Oza~, + Oe2a.a )’~ COS (2-28)
2.4 Inelastically Deformed Geometry of Bars
As shown in Section 2.2 of this report, the deformed geometry of the bar is needed to
allow calculation of bending strains. Therefore, it is important to determine the
inelastically deformed shape of the reinforcing bar at Odes. A FE model can be used to
accurately predict the inelastically deformed shape of the bar. Once AN equation for the
deflected shape of the bar is derived, the bending and axial strains of the bar can be
calculated based on the equations of sections 2.2 and 2.3.
A parametric study involving multiple nonlinear FE models was performed to understand
the combined axial and bending behavior of the mild steel bar for six different cases
listed in Table 2.1 below.
13
Conclusions or recommendations in this report are the opinions of the authors. PCI assumes no responsibility for the interpretation or application of the information contained herein.

Soo
2
3
4
5
6
Table 2.1 Study Cases
L$11
(1-~ldes-~)h 0 des (inches)
20 0.02 10
20 0.04 20
30 0.02 15
30 0.04 30
20 0.01
20 0.02 20
(rad.)
0.4636
0.7854
0.4636
0.7854
0.245
0.7854
(inches)0.398
0.784
0.597
1.176
0.200
0.396
AY(inches)
0.204
0.816
0.306
1.224
0.051
0.404
0.0398
0.0392
0.0398
0.0392
0.04
0.0198
2.4.1 The FE Model
The undeformed geometry of the mild steel bar at the beam-column interface is modeled
as shown in Figures 2.4 through 2.7 and Table 2.2 below. The partially unbonded bar and
two concrete blocks representing parts of the beam and column are modeled. The grout
around the bar in the bonded portion is also modeled. The length of the concrete block is
assumed to be 20 inches on each side of the unbonded length of the bar to provide
sufficient bar bonded length for all study cases.
14
Conclusions or recommendations in this report are the opinions of the authors. PCI assumes no responsibility for the interpretation or application of the information contained herein.

Figure 2.4 Isoparametric View of the entire Model
~ELEMENT~ A~
2004
Figure 2.5 Isoparametric View of the Concrete Blocks
15
Conclusions or recommendations in this report are the opinions of the authors. PCI assumes no responsibility for the interpretation or application of the information contained herein.

JA~ 2 200410:18:21
Figure 2.6 Isoparametric View of the Mild Steel Bar
JAN 2 2004i0:20:22
Figure 2.7 Isoparametric View of the Duct Grout
16
Conclusions or recommendations in this report are the opinions of the authors. PCI assumes no responsibility for the interpretation or application of the information contained herein.
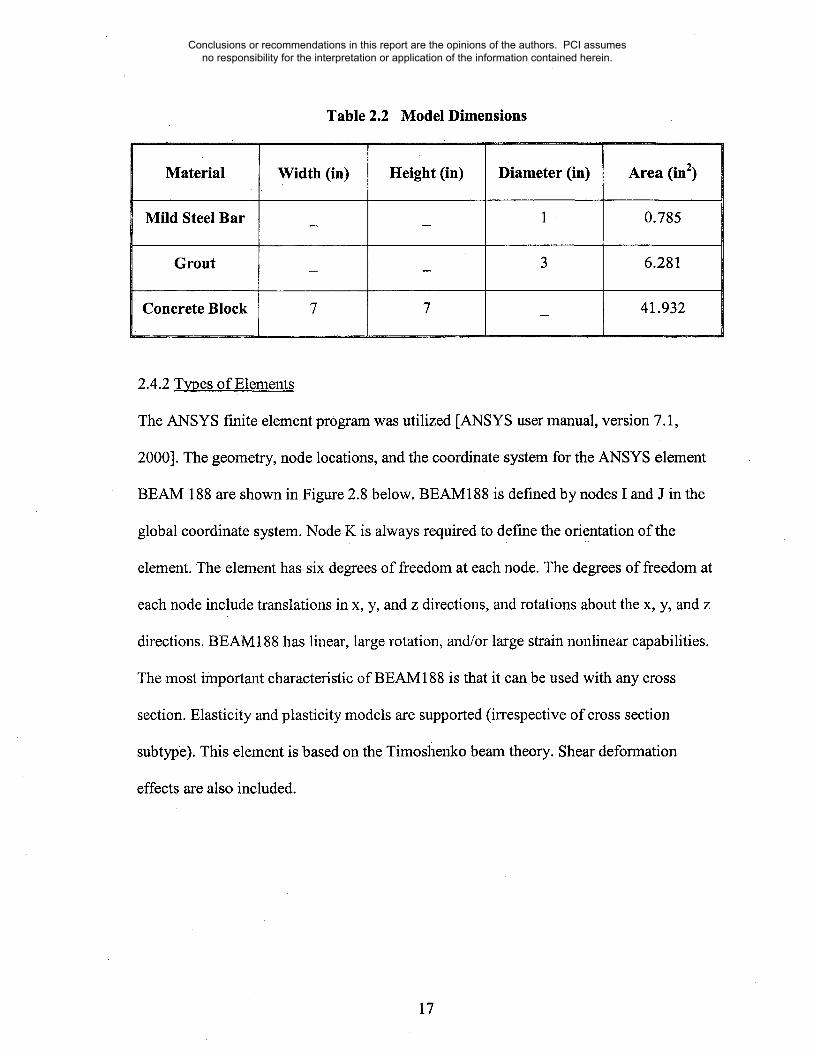
Table 2.2 Model Dimensions
Material Width (in) Height (in) Diameter (in) Area (in2)
Mild Steel Bar 1 . 0.785
Grout 3 6.281
Concrete Block 7 7 41.932
2.4.2 Types of Elements
The ANSYS finite element program was utilized [ANSYS user manual, version 7.1,
2000]. The geometry, node locations, and the coordinate system for the ANSYS element
BEAM 188 are shown in Figure 2.8 below. BEAM188 is defined by nodes I and J in the
global coordinate system. Node K is always required to define the orientation of the
element. The element has six degrees of freedom at each node. The degrees of freedom at
each node include translations in x, y, and z directions, and rotations about the x, y, and z
directions. BEAM188 has linear, large rotation, and/or large strain nonlinear capabilities.
The most important characteristic of BEAM 188 is that it can be used with any cross
section. Elasticity and plasticity models are supported (irrespective of cross section
subtype). This element is based on the Timoshenko beam theory. Shear deformation
effects are also included.
17
Conclusions or recommendations in this report are the opinions of the authors. PCI assumes no responsibility for the interpretation or application of the information contained herein.

Figure 2.8 BEAM188 3-D Linear Finite Strain Beam [3]
Beam �lcmcnts arc one-dimensional line �lcmcnts in space. The cross section details arc
provided separately. The cross sectional dimensions and properties for the mild steel bar,
duct grout and concrete arc shown in Figures 2.9 through 2.11 below.
M = Centroid ~ = ShearCenterSECTION ID 3DATA SUMMARY
Section Name= bar
Area= .786146
Iyy= .049046
lyz= .228E-17
Izz= .049046
Warping Constant=0
Torsion Constant= .098091
Centroid Y= -.133E-16
Centroid Z= ,IZOE-16
Shear Center Y= .254E-16
Shear Center Z= -.133E-16
Shear Corr. MY= .856825
shear Corr. YZ= -.304E-14
Shear Corr. ZZ= .856825
Figure 2.9 Mild Steel Bar Cross Section [3]
18
Conclusions or recommendations in this report are the opinions of the authors. PCI assumes no responsibility for the interpretation or application of the information contained herein.

\\\
SECTION ID 2DATA SUMMARY
Section Name= grout
Area= 6.281
Iyy= 3.9Z4
= -.156E-15Izz
= 3.924Warping Constant
=0Torsion Constant
= 7.847Centrold Y
= .906E-16Centroid Z
= -.442E-17Shear Center Y
= .843E-16shear Center Z
= .588E-16Shear Corr, YY
= .688249Shear Corr. YZ
= .214E-15Shear Corr. ZZ
= .688249
Figure 2.10 Duct Grout Cross Section [3]SECTION ID i
X = Cen~roid D = ShearCen~er DATA SUMMARY
Section Nama= hollow
Area= 41. 932
= 196, ID6
= . 828E-05Izz
= 196,106Warping Constant
= 15.87Torsion Constant
= 3Z9.549C ~ntr old Y
= . 662E-08Centr oid Z
= -.805E-08Shear Center Y
= .291E-05Shear Center Z
= -.148E-05Shear Corr. YY
= . 634177shear Corr. YZ
= . 437E-06shear Corr. ZZ
= . 634177
Figure 2.11 Concrete Cross Section [3]
19
Conclusions or recommendations in this report are the opinions of the authors. PCI assumes no responsibility for the interpretation or application of the information contained herein.

2.4.3 Material Properties
Various components of this model are composed of the following materials:
¯ Concrete
¯ Grout
¯ Grade 60 Reinforcing bar
The values of this constant as used in the model are shown inModulus of Elastici~_ ."
Table 2.3 below.
Table 2.3 Material Properties
Modulus ofMaterial # Material Elasticity E,Name (ksi)
1 Concrete 4900
3 Mild Steel 29,000
5 Duct Grout 3500
Stress-Strain Curve." Figures 2.12 and 2.13 below shows the stress strain diagrams for the
mild steel bar and concrete.
20
Conclusions or recommendations in this report are the opinions of the authors. PCI assumes no responsibility for the interpretation or application of the information contained herein.

#8, Grade 60 Reinforcing Mild Steel Bar
120
100
80
60
4O
2O
0 0.02 0.04 0.06 0.08
Strain (in/in)
0.1
Figure 2.12 Stress-Strain Curve of Grade 60 Mild Steel Bar [27]
Stress-Strain Model of unconfined concrete for f "c = 7400 psi
8O00
7000
6000
5000
4000
3000
2000
1000
00.0005 0.001 0.0015 0.002 0.0025 0.003
Strain (in/in)
+Series 1 ]
Figure 2.13 Stress-Strain Model of Concrete [31]
21
Conclusions or recommendations in this report are the opinions of the authors. PCI assumes no responsibility for the interpretation or application of the information contained herein.
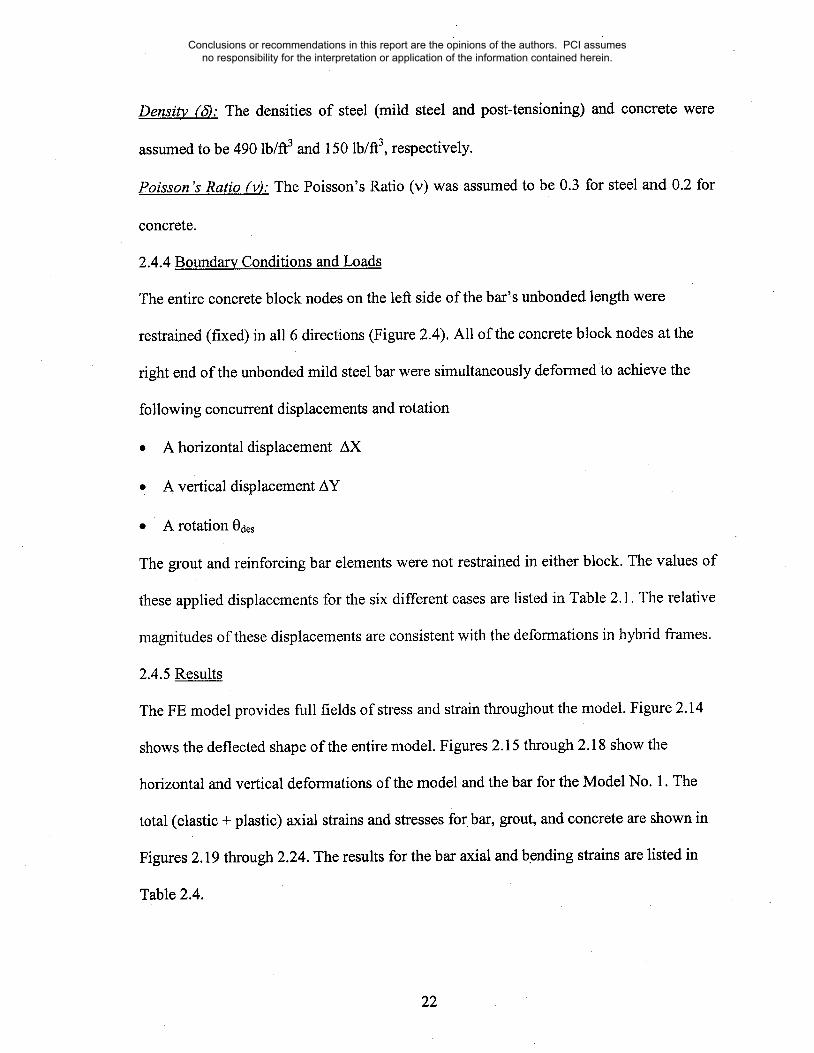
Densi_ty (~): The densities of steel (mild steel and post-tensioning) and concrete were
assumed to be 490 lb/ft3 and 150 lb/ft3, respectively.
Poisson’s Ratio (v): The Poisson’s Ratio (v) was assumed to be 0.3 for steel and 0.2 for
concrete.
2.4.4 BoundalW Conditions and Loads
The entire concrete block nodes on the left side of the bar’s unbonded length were
restrained (fixed) in all 6 directions (Figure 2.4). All of the concrete block nodes at the
right end of the unbonded mild steel bar were simultaneously deformed to achieve the
following concurrent displacements and rotation
¯ A horizontal displacement AX
¯ A vertical displacement AY
¯ A rotation
The grout and reinforcing bar elements were not restrained in either block. The values of
these applied displacements for the six different cases are listed in Table 2.1. The relative
magnitudes of these displacements are consistent with the deformations in hybrid frames.
2.4.5 Results
The FE model provides full fields of stress and strain throughout the model. Figure 2.14
shows the deflected shape of the entire model. Figures 2.15 through 2.18 show the
horizontal and vertical deformations of the model and the bar for the Model No. 1. The
total (elastic + plastic) axial strains and stresses for. bar, grout, and concrete are shown in
Figures 2:19 through 2.24. The results for the bar axial and bending strains are listed in
Table 2.4.
22
Conclusions or recommendations in this report are the opinions of the authors. PCI assumes no responsibility for the interpretation or application of the information contained herein.

DISPLACEHENT
SUB =24TIME=tO0D~X =.748385
2004
NODAL SOLUTION
STEP=ISUB =24TIME=f00uxRSYS=ODMX =.7q8385SMX =.468
Figure 2.14 Deflected Shape of the Model
JAN 210:26:27
0 . 104 .208 . 312 .416.052 .156 .26 .364 .468
Figure 2~15 Horizontal Deformation (in) of the Model
23
Conclusions or recommendations in this report are the opinions of the authors. PCI assumes no responsibility for the interpretation or application of the information contained herein.

NODAL SOLUTION
SUBTIHE=IO0
D~ =.71212~S~ =.~07Sll
JAN 2 200~110:33:27
0 .090558 .181116 .271674 ,362232.045279 .135837 .226395 .316953 ¯407511
Figure 2.16 Horizontal Deformation (in) of the Mild Steel Bar
NODAL SOLUTION
STEP=ISUB =24TIHE=IO0UY (AVG)RSYS=ODHX =.748385SHX
JAN 2 200410:27:05
0 .129778 .259556 .389333 .519111¯ 064889 .194667 .324444 .454222 .584
Figure 2.17 Vertical Deformation (in) of the Model
24
Conclusions or recommendations in this report are the opinions of the authors. PCI assumes no responsibility for the interpretation or application of the information contained herein.

NODAL SOLUTION
STEP=~SUB =24
uY (
DHX =.712124SKX =. 584
JAN 2 200410:34:41
0 .12~778 .259556 .389333 .519111.064889 ,194667 .324444 .454222 ,584
Figure 2.18 Vertical Deflection (in) of the Mild Steel Bar
NODAL SOLUTION
STEP=ISUB =24TIHE=I00EPTOX (AVG)RSYS=0DMX =.712124
SMX =.042933
JAN 2 200410:36:09
0 .009541 .019081 .028622 .038163¯ 00477 .014311 .0Z3852 .033392 ,042933
Figure 2.19 Mild Steel Bar Axial Total Strain Distribution
25
Conclusions or recommendations in this report are the opinions of the authors. PCI assumes no responsibility for the interpretation or application of the information contained herein.

NODAL SOLUTION
TIHE~I00EPTOX
DHX =.712124~NN ~0S~X =.042933
JAN 2 200410:38:45
¯ 03 .032889 .’035778 .038667 . 041556¯ 031444 ¯ 034333 .037222 .040111 .043
Figure 2.20
NODAL SOLUTTON
STEP=ISUB =24TI~E=IO0sx (AVG)RSYS=0DMX =.712124
S~X =85. 584
Axial Total Strain Distribution of Unbonded Mild Steel Bar
JAN 2 2004I0:35:34
0 19.01’9 38.037 57.056 76.0759.509 28.528 " 47.547 66.565 85.584
Figure 2.21 Mild Steel Bar Axial Stress Distribution
26
Conclusions or recommendations in this report are the opinions of the authors. PCI assumes no responsibility for the interpretation or application of the information contained herein.

NODAL SOLUTION
STEP=iSUB =24TIME=f00SX (AVG)RSYS=0DMX =.712124
S~X =85.58~
JAN 2 2004i0:40:34
76 78.111 80.222 82.333 84.44477.056 79.167 81.278 83.389 85.5
Figure 2.22
NODAL SOLUTION
STEP=ISUB =24TIHE=IO0EPTOX (AVG)RS¥S=0DMX =.7q8385
S~X =.264E-O3
Axial Stress Distribution of Unbonded Mild Steel Bar
JAN 2 200410:30:30
0 .588E-0~ .118E-03 .176E’03 .235E-03.29~E-04 .881E-04 ,147E-03 .206E-03 .264E-03
Figure 2.23 Axial Total Strain Distribution for Concrete Block
27
Conclusions or recommendations in this report are the opinions of the authors. PCI assumes no responsibility for the interpretation or application of the information contained herein.

NODAL SOLUTION
SUS =24TIldE=f00£PTOX
D~X =.723177
SHX =.264E-03
JAN 2 200410:42:52
0 .586E-04 .i17E-03 ,176E-03 .234E-03.293E-04 .879E-0~ .147E-03 .205E-03 .264E-03
Figure 2.24 Axial Total Strain Distribution for Grout
Table 2.4 FEA Results
CaseStudyNo.
AverageAxialStrain
{~avg
0.0398
MaximumBendingStrain
~b
0.0035 0.0433
/(%)
8.8
2 0.0392 0.0038 0.0430 9.7
3 0.0398 0.0025 0.0423 6.2
4 0.0392 0.0026 0.0418 6.7
5 0.0400 0.0029 0.0429 7.2
6 0.0198 0.0019 0.0217 9.5
28
Conclusions or recommendations in this report are the opinions of the authors. PCI assumes no responsibility for the interpretation or application of the information contained herein.

The above figures show the development of plastic strains in the mild steel, bar with its
highest value at the fixed end of the bar (Figure 2.20). The vertical deformation across
the unbonded segment of the bar is plotted in Figure 2.25 for Model No.land in Figure
2.26 for all model cases.
Vertical Displacement vs x
0.200
0.150
0.100
0.050
0.000
-0.050
y = -O.O002x3 + 0.0035x2 + O.O001x - 5E-05 ~i11~~
R~= 1
2 4 6 8 10
x (in)
Case 1~Poy. (Case 1)
Figure 2.25 Vertical Deformation of the Unbonded Segment of the Bar
Vertical Displacement vs x
1.400
1.200
1.000
0.800
0.600
0.400
0.200
0.0000 5 10 15 20 25 30 35
x (in)
r~ - Case 1~ Case 2
Case 3Case 4
:::::::::::::::: Case 5-- " --_" Case 6
Figure 2.26 Vertical Deformation of the Unbonded Segment of the Bar
29
Conclusions or recommendations in this report are the opinions of the authors. PCI assumes no responsibility for the interpretation or application of the information contained herein.
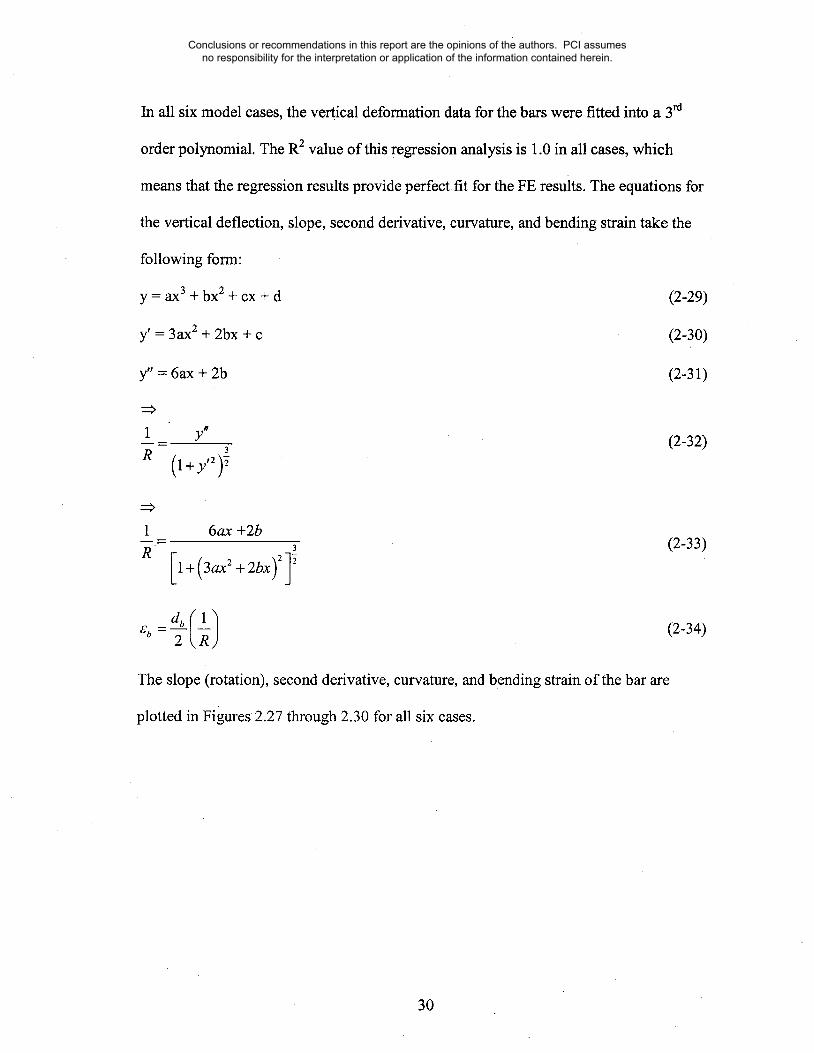
In all six model cases, the vertical deformation data for the bars were fitted into a 3rd
order polynomial. The R2 value of this regression analysis is 1.0 in all cases, which
means that the regression results provide perfect, fit for the FE results. The equations for
the vertical deflection, slope, second derivative, curvature, and bending strain take the
following form:
y = ax3 + bx2 + cx + d
y’ = 3ax2 + 2bx + c
(2-29)
(2-30)
y" = 6ax + 2b (2-31)
1 y"R
(1 + y,2)~-
(2-32)
6ax +2b3 (2-33)
(2-34)
The slope (rotation), second derivative, curvature, and bending strain of the bar are
plotted in Figures 2.27 through 2.30 for all six cases.
30
Conclusions or recommendations in this report are the opinions of the authors. PCI assumes no responsibility for the interpretation or application of the information contained herein.

0.05
0.04
0.03
0.01
">, 0.03
10 15 20 25 30 35
x (in)
Case 1Case 2Case 3Case 4Case 5Case 6
Figure 2.27 Slope (Rotation) of the Deflected Shape of the Unbonded Segment ofthe Bar
y" vs x
0.01
0.008
0.006
0.004
0.002
0
-0.002
-0.004
-0.006
x (in)
-- -- -- Case 1m . Case2
" " - Case 3-- Case 4-- Case 5m . Case 6
Figure 2.28 2nd Derivative of the Deflected Shape of the Unbonded Segment of theBar
31
Conclusions or recommendations in this report are the opinions of the authors. PCI assumes no responsibility for the interpretation or application of the information contained herein.

1/R (curvature) vs x
0.01
0.008
0.006
0.004
0.002
0
-0.002
-0.004
-0.006
x (in)
-- - -- Case 1m . Case 2
- - " Case 3--"--’- Case 4~ Case 5m . Case 6
Figure 2.29 Curvature of the Unbonded Segment of the Bar
(bending strain) vs x
0.005
0.004
0.003
0.002
,.~ 0.001
0
-0.001
-0.002
-0.003
x (in)
-- -- - Case 1m - Case2- - - Case 3~ Case 4~ Case 5~ - Case 6
Figure 2.30 Bending Strain in the Unbonded Segment of the Bar
It can be noticed from Figures 2.29 and 2.30 that the maximum curvature and bending
strain occur at the fixed end of the bar (at x = 0). A general equation for the bending
32
Conclusions or recommendations in this report are the opinions of the authors. PCI assumes no responsibility for the interpretation or application of the information contained herein.

strain in the bar can be determined using constants a, b, c, and d based on the prescribed
boundary conditions as follows:
Boundary_ Conditions:
Atx=O
y=0 ~d=0
y’=0~c=0
At x = Lsu
y= Ay
Odes
0desLs,, -2Aya = (2-35)
Lsu 3
b = 3Ay-OdesLsuZsu 2 (2-36)
Using Ay and Lsu values from equations 2-24 and 2-17,
Odes2 2 ~- 2(0 de, + e .,.) sin( + a")
a = (2-37)
( (1-- rld= ----~- ) hg Ode" l2~,,,. J
According to the FE results the values of both the curvature and bending strain are
maximum at the fixed end of the bar (at x =0).
33
Conclusions or recommendations in this report are the opinions of the authors. PCI assumes no responsibility for the interpretation or application of the information contained herein.

Therefore, Substituting Equations 2-30 and 2-31 in Equation 2-33 yields and considering
thatx=c =d=0:
:=> e~,.m~x 2 ~. R Jmax = bdb (2-40)
where ~b,max is the maximum bending strain along the length of the bar. Substituting for b
from equation 2-38,
3(Odes+o°a,a) sin(+~z")-O~,.~_g,~l )db
-
Or
(2-41)
z ~ dbeb.n~ = 3(02d~ +e o.,) sin( +g") -Odes (2-42)
Table 2.5 below compares predicted a, b, and ~b,max values with the FEM results. It can be
noticed that from Table 2,5 that the predicted values for ~b.ma× (Equation 2-42) is slightly
greater than those of the FE results for all model cases. This is because the grout is
modeled in the FE model which will results in reducing the bending strain in the bar. The
grout effect is not included in the predicted equations (Equations 2-35, 2-36, and 2-42).
34
Conclusions or recommendations in this report are the opinions of the authors. PCI assumes no responsibility for the interpretation or application of the information contained herein.

Model
Case
NO.
1
2
3
4
5
6
Fig
xl0-s
-20
-9
-8
-4
-30
-5
Table 2.5
a
Calculated
xlO-s
-20.8
-10.4
-9.24
-4.62
-41.6
-5ol
Predicted Results Compared with FEA Results
b I~b,max
FE Calculated
xl0-3 xl0-3
3.5 4.12
3.8 4.12
2.5 2.75
2.6 2.75
4.3 4.12
1.9 2
FE
xl0~
3.5
3.8
2.5
2.6
4.3
1.9
Calculated
xl0~
4.12
4.12
2.75
2.75
4.12
2
Calculted/FE
(%)
18
8
10
6
4
5
2.5 Low-Cycle Fatigue for Bar Fracture
2.5.1 Introduction:
High-cycle fatigue and low-cycle fatigue fractures are two different modes of damage in
members subjected to cyclic loading. Low-cycle fatigue is associated with high strain
ranges and low relatively number of cycles would be needed to produce fatigue failure. In
low-cycle fatigue, significant plastic deformations occur during each cycle. On the other
hand, high-cycle fatigue is associated with lower stress/strain ranges (strain cycles are in
the elastic range) and larger number of cycles would be needed to produce fatigue failure.
Low-cycle fatigue lives typically range from one up to 105 cycles, and high-cycle fatigue
cycle lives are greater than 105 cycles [Collins, 1993].
35
Conclusions or recommendations in this report are the opinions of the authors. PCI assumes no responsibility for the interpretation or application of the information contained herein.

2.5.2 Low-Cycle Fatigue Relationships for Reinforcing Steel Bars:
Manson and Coffin (1955) proposed the following empirical equation to estimate the
general fatigue life of a material:
A._~_~ = 2N~.)b + ~f (2Nf ) (2-43)2
Where:
A, = total strain range (*m~x - ~min)
c~’f = fatigue strength coefficient
Nf = number of cycles to failure
E = modulus of elasticity
b = fatigue strength exponent (ranges from -0.05 to -0.15)
~’f = fatigue ductility coefficient
c = fatigue ductility exponent (ranges from -0.5 to -0.8)
The first term in the above equation represents the elastic strain component (high-cycle
fatigue) and the second term represents the plastic strain component (low-cycle fatigue).
The mild steel bar in hybrid frames is subjected to large inelastic deformations. Mitchel
(1979) and Koh and stephens (1991) found that for most low-cycle fatigue analyses the
elastic part can be neglected, for which the above equation can be simplified.
-~- = ~fA~ ,(2Nf)C(2-44)
Mander (1994) experimentally evaluated the low-cycle fatigue behavior of reinforcing
steel bars subjected to cyclic axial strain amplitudes ranging from yield to 6%. He
evaluated the experimental results with existing low-cycle fatigue models found in the
literature..The experimental data were fit to existing fatigue equations. As a result, low-
36
Conclusions or recommendations in this report are the opinions of the authors. PCI assumes no responsibility for the interpretation or application of the information contained herein.
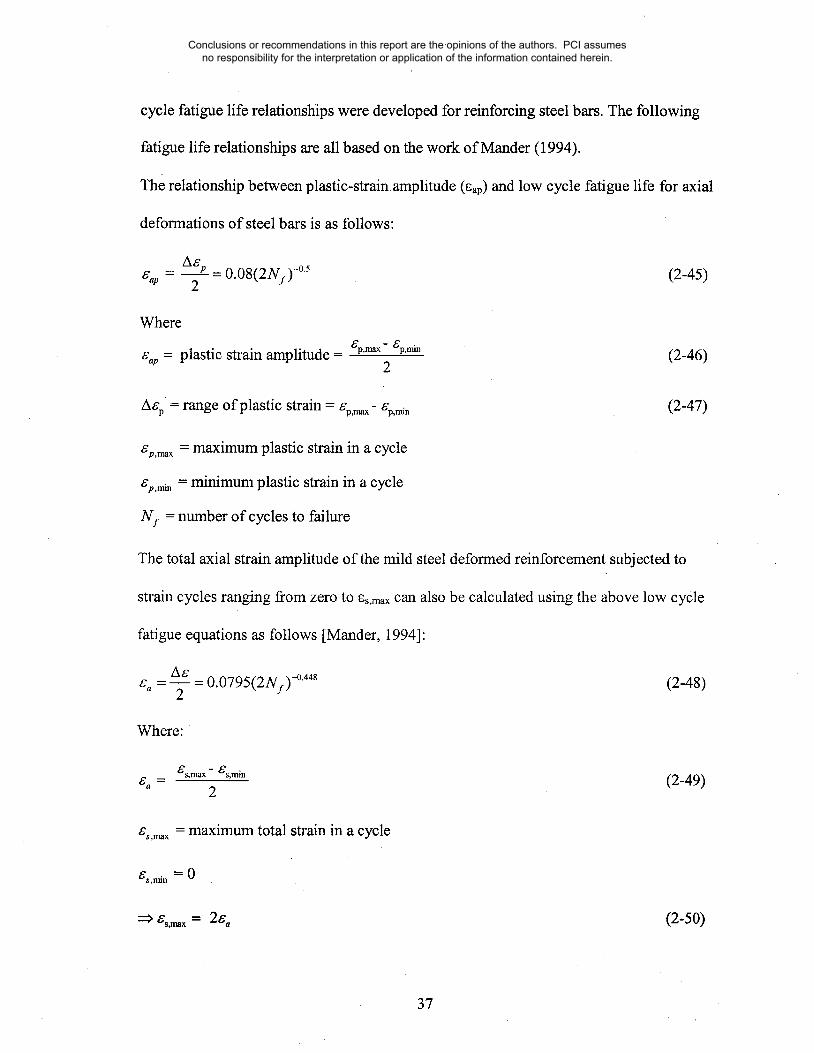
cycle fatigue life relationships were developed for reinforcing steel bars. The following
fatigue life relationships are all based on the work of Mander (1994).
The relationship between plastic-strain amplitude (~ap) and low cycle fatigue life for axial
deformations of steel bars is as follows:
A~p _ 0"08(2NI)-°5(2-45)~ap- 2
Where
~.p = plastic strain amplitude -2
(2-46)
range of plastic strain = ep,m~- (2-47)
~o,max = maximum plastic strain in a cycle
o~p,m~. = minimum plastic strain in a cycle
NI = number of cycles to failure
The total axial strain amplitude of the mild steel deformed reinforcement subjected to
strain cycles ranging from zero to ~s,max can also be calculated using the above low cycle
fatigue equations as follows [Mander, 1994]:
A~_ _0.0795t2tv )-°’448" "’’.,fga2
(2-48)
Where:
gs.m~ =maximumtotal strain ina cycle
=:’ gs,m.x = 2~a (2-50)
37
Conclusions or recommendations in this report are the opinions of the authors. PCI assumes no responsibility for the interpretation or application of the information contained herein.

Although many of the test performed by Mander (1994) were on ASTM A615
reinforcing bars, the author recommends the above equation for all steel types. Additional
tests on ASTM A706 bars are being performed by the writers of this report.
!n a separate study by Chin Liu (2001), mild steel bar specimens were subjected to
bending reversals and low-cycle fatigue life relationships were developed. The results of
constant displacement amplitude tests were plotted and a best fit relationship of the
following form was derived:
~,~, = A~b = 0.23(2NI)-°32 (2-51)2
Where
plastic bending strain amplitude = ~b.m.x- ~b,r~n2
(2-52)
Agb =. range of bending plastic strain =
~b,max = maximum bending plastic strain in a cycle
~b,.~. = minimum bending plastic strain in a cycle
Nf = number of cycles to failure
Figure 2.31 below displays the plastic strain-life relationships under both axial and
bending loadings.
(2-53)
38
Conclusions or recommendations in this report are the opinions of the authors. PCI assumes no responsibility for the interpretation or application of the information contained herein.

Plastic Strain vs 2Nf
0.16
0.14
= 0.12
E "’& 0.1< ,,t
0.08"~ ,~ 0.06
0.04
0.02
05 10 15 20 25
2Nf
Figure 2.31 Plastic Strain-Life Relationship
It can be noticed from Figure 2.31 that for a given number of cycles to failure, low cycle
bending fatigue can achieve higher maximum strain amplitude than low cycle axial
fatigue. In other words, for the same maximum strain amplitude in the bar, specimens
subjected to cyclic bending strains would have longer life than pure axial strains. This
difference is expected to occur because under bending, only the extreme fibers of the
cross section develop maximum strain
The low-cycle fatigue equations under bending action can be converted to equivalent
fatigue equations under axial loading [Chin Liu, 2001]. If the number of cycles to failure
is assumed to be the same for both the axial and bending equations, the effective strain
amplitude under axial loading can be calculated as follows:
A,~_ , (2-54)
39
Conclusions or recommendations in this report are the opinions of the authors. PCI assumes no responsibility for the interpretation or application of the information contained herein.

t t c2
2 °°a = °°fa 2gf (2-55)
1
c2
Where:
eb -- strain amplitude under cyclic bending
effective strain amplitude under cyclic axial loading
cl = fatigue ductility exponent under bending
c2 = fatigue ductility exponent under axial loading
(2-56)
(2-57)
Based on the above, the effective strain amplitude under bending for the mild steel bar is:
-g~ = 0.63(gb)~4 (2-58)2
(2-59)
and
The effective axial strain amplitude and the corresponding maximum effective axial
strain for the six FE model cases are listed in Table 2.6 below:
40
Conclusions or recommendations in this report are the opinions of the authors. PCI assumes no responsibility for the interpretation or application of the information contained herein.

Table 2.6 Effective Axial Strain Calculations
CaseStudy Ax/Ls. ~b ~a’
NO.1 0.0398 0.0035 0.00046
2 0.0392 0.0038 0.00052
3 0.0398 0.0025 0.00028
4 0.0392 0.0026 0.00030
5 0.0399 0.0029 0.00035
6 0.0198 0.0019 0.00019
It can be noticed from Table 2.6 that the value of the effective axial strain amplitude (~a’)
is much smaller than the axial strain in the bar. However, the bars in the study by Liu
[Liu, 2001] were subjected to bending reversals only without subjecting the bar to.plastic
axial strain throughout the section. The above equation (2-59) is not directly applicable to
bars in hybrid frames because the additional axial strain due to bending in hybrid frames
is superimposed on a fully plastic section from the axial loading effects.
This issue requires an experimental evaluation program to address the combined axial-
bending strain effects on low-cycle fatigue of bars. In lieu of this experimental
evaluation, the proposed conservative approach is to find the maximum total strain
variation in the mild steel bar by adding the maximum bending strain with the axial strain
as follows [Collins, 1993]:
~tot,~ = %~,~ + ~b (2-60)
The ~tot,1 can be conservatively used to estimate low-cycle fatigue life using Mander’s
recommended equation (Eq. 2-48).
41
Conclusions or recommendations in this report are the opinions of the authors. PCI assumes no responsibility for the interpretation or application of the information contained herein.

2.6 Effects of Nonzero Mean Strain On Low-Cycle Fatigue Behavior
The mild steel bars in the hybrid frame are subj ected to nonzero mean plastic strains. The
minimum strain emin in the bars is approximately equal to approximately zero. That is, the
strain ranges from zero up to some maximum strain value (say 4%) and then back to zero.
Therefore test results should be adjusted to account for the nonzero mean strain effects if
needed.
A few investigators [12] have studied the effects of nonzero mean strain under low-cycle
fatigue. The experimental results indicate that the effect of compressive mean strain is the
same as the effect of tensile mean strain on low-cycle fatigue if their magnitudes are the
same. The effects of nonzero mean stress are of primary importance only in high-cycle
fatigue where the sign of the mean stress being compressive or tensile may increase or
decrease the fatigue life (Koh and Stephens, 1991).
The mean strain effects were found to be negligible for the range of strain amplitudes
(1% to 6%) used in an experimental study on low-cycle behavior of reinforcing steel bars
[Mander and Panthaki, 1994]. Thus the mean stress and mean strain effects on the low-
cycle behavior of bars can be neglected in design. The total strain range is therefore
considered.
2.7 Effect of Grout in the Duct
Raynor and Lehman [2002] studied the bond characteristics of bars grouted in light-
gauge metal ducts. Growth in the unbonded length of the bar was noticed under high
cyclic strain. This leads to a non-uniform strain distribution at each end of the unbonded
length of the bar as shown in Figures 2.19 through 21. Raynor and Lehman (2002)
42
Conclusions or recommendations in this report are the opinions of the authors. PCI assumes no responsibility for the interpretation or application of the information contained herein.
represented the bar elongation due to strain penetration by an equivalent additional
unbonded length Lua as follows:
Where
(2-61)
f~u = steel bar ultimate strength (90 to 110 ksi for ASTM A706 bars)
f~y = steel bar yield strength (ksi)
fg = grout strength (ksi)
Thus the average axial strain would be equal to:
AL(2-62)~"’~g - Ls.. +
Where
~ = ~/(~ + ~X)~ +~r~ -~,~
Table 2.7 below compares the above equation that calculates the average strain in the bar
due to strain penetration with the FE results for the six study cases. The assumed grout
strength and the yield strength of the bar are as follows:
f’g = 8 ksi
fsy = 60.9 ksi
fsu = 85 ksi
db=l in.L,a- 0.81(85-60.9) =0.86 in.
db (8)1’5
43
Conclusions or recommendations in this report are the opinions of the authors. PCI assumes no responsibility for the interpretation or application of the information contained herein.

Table 2.7 Average Strain in the Bar Due to Grout Effect
ModelCase Lsu AX AY AL ~avg =
No. (in.) (in.) (in.) (in.) AL/(Ls.+2L.a)
10 0.398 0.204 0.4 0.034
2 20 0.784 0.816 0.8 0.037
3 15 0.597 0.306 0.6 0.036
4 30 1.176 1.224 1.2 0.0378
5 0.2 0.051 0.2 0.03
20 0.396 0.404 0.4 0.018
I~avg
(FE)
0.036
0.037
0.037
0.0375
0.035
0.019
(FE/Eq.)%
5.8
16
5
It can be noticed from Table 2.7 that the FE results and the empirical equation that
calculates the additional equivalent unbonded length in the bar are veryclose (within 15
%). Therefore the equation proposed by Raynor and Lehman (2002) is considered valid
and can be used in both analysis and design.
44
Conclusions or recommendations in this report are the opinions of the authors. PCI assumes no responsibility for the interpretation or application of the information contained herein.

Chapter 3
Simplified Design Procedures for Precast Hybrid Frames
In this chapter, the PRESSS design procedures are first described followed
presentation of the proposed non-dimensional procedures and simplified equations.
by a
3.1 Hybrid Frame - PRESSS Design Procedure
The design equations proposed in the PRESSS report are based on the following
assumptions (Stanton and Nakaki, 2002):
1. The design forces (Mdes) and drifts (Odes) are known.
2. The overall dimensions of the frame members are known.
3. At each interface, the centroid of the Post-tensioning tendon is located at the mid-
depth of the beam section.
4. The Post-tensioning tendon is at incipient yield at the design drift.
5. the Post-tensioning tendon is unbonded for the entire length of the frame.
6. Equal top and bottom mild reinforcement is used.
7. Properties of the materials are known.
The PRESSS design equations use deformation compatibility and equilibrium of forces to
calculate the forces and the resulting moment capacity at the interface between precast
beams and columns.
The forces acting on a joint between precast beam and column in a hybrid frame
subjected to a design interface rotation of 0~les are shown in Figure 3.1.
45
Conclusions or recommendations in this report are the opinions of the authors. PCI assumes no responsibility for the interpretation or application of the information contained herein.

a) Dimensions and Displacements b) Forces
Figure 3.1 Location of Forces at Design Drift (Stanton and Nakaki, 2002)
The parameters shown in Figure 3.1 are defined as follows: -
Odes = interface rotation at the design limit state
Ap = axial deformation of post-tensioning steel
As = tensile axial deformation of mild steel reinforcement
A’s = compressive axial deformation of mild steel reinforcement
~ = distance from the center of the mild steel bar to the nearest face divided by the height
of the beam
hg = depth of grout pad at beam-column interface (equal to the height of the beam h)
rides = distance from the neutral axis to the beam compression face divided by the beam
height
46
Conclusions or recommendations in this report are the opinions of the authors. PCI assumes no responsibility for the interpretation or application of the information contained herein.

~des = distance from the center of the equivalent compression block to the beam
compression face divided by the beam height (~d~s = 0.5[~’qd~)
Fp,~es = post-tensioning force in the post-tensioning tendon
Fc,~tes = concrete compressive force at the beam-column interface
Fs,~s = force in tension mild steel reinforcement at the design drit~
F~,,~s = force in compression mild steel reinforcement at the design drift
[~1 = factor defined in ACI 318-99 (section 10.2.7.3). I~1 shall be taken as 0.85 for f’c of
4000 psi and less. For f’c greater than 4000 psi, 131 shall be reduced continuously at a
rate of 0.05 for each 1000 psi of strength in excess of 4000 psi [1~1 = 0.85 - 0.05(t’c
- 4)], but 131 shall not be taken less than 0.65.
According to the PRESSS procedures, a total of 17 steps are required to design the Post-
tensioning tendon and the mild steel reinforcement at the interface. Step 16 calculates the
required unbonded length and elongation of the mild steel reinforcement.
The PRESSS design process is based on an iterative approach and utilizes a number of
dimensional design parameters. The PRESSS design procedure steps (Stanton and
Nakaki, 2002) are summarized as follows:
47
Conclusions or recommendations in this report are the opinions of the authors. PCI assumes no responsibility for the interpretation or application of the information contained herein.
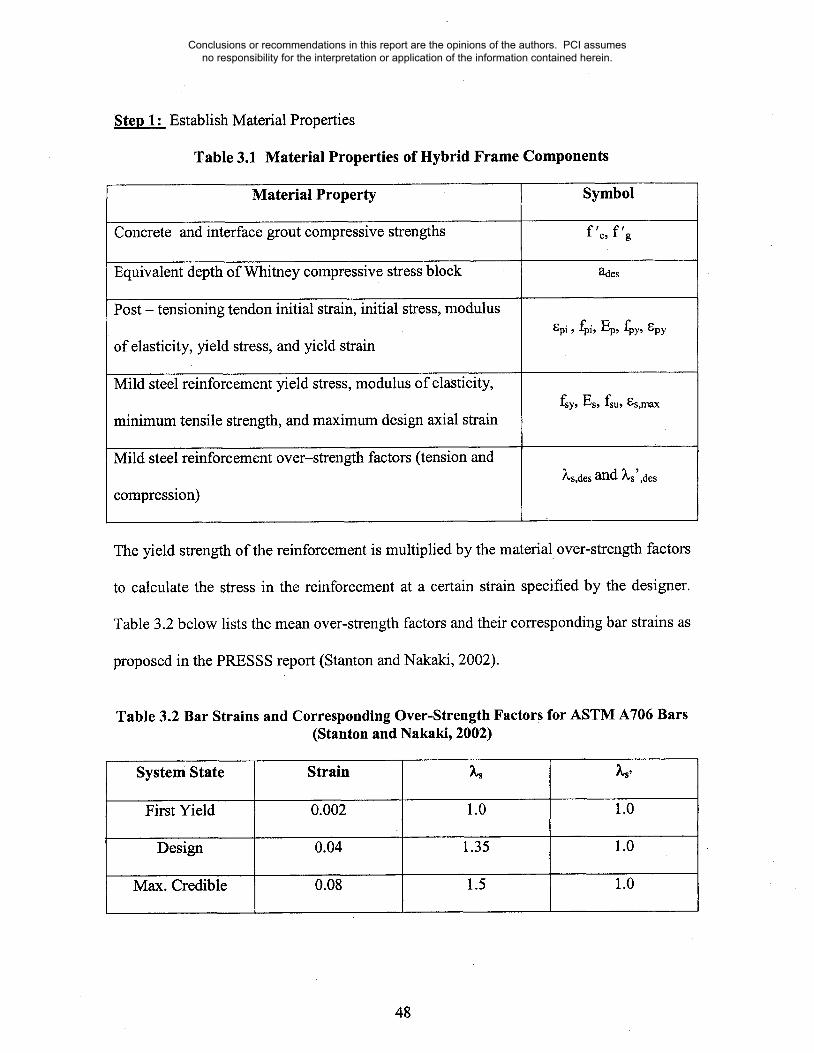
Step 1: Establish Material Properties
Table 3.1 Material Properties of Hybrid Frame Components
Material Property
Concrete and interface grout compressive strengths
Equivalent depth of Whitney compressive stress block
Post - tensioning tendon initial strain, initial stress, modulus
of elasticity, yield stress, and yield strain
Mild steel reinforcement yield stress, modulus of elasticity,
minimum tensile strength, and maximum design axial strain
Mild steel reinforcement over-strength factors (tension and
compression)
Symbol
f ’e, f ’g
ades
8pi, fpi, Ep, fpy, ~py
fsy, Es, fsu, *s,m~x
~s,des and Ls’ ,des
The yield strength of the reinforcement is multiplied by the material, over-strength factors
to calculate the stress in the reinforcement at a certain strain specified by the designer.
Table 3.2 below lists the mean over-strength factors and their corresponding bar strains as
proposed in the PRESSS report (Stanton and Nakaki, 2002).
Table 3.2 Bar Strains and Corresponding Over-Strength Factors for ASTM A706 Bars(Stanton and Nakaki, 2002)
System State Strain ~ ks,
First Yield 0.002 1.0 1.0
Design 0.04 1.35 1.0
Max. Credible 0.08 1.5 1.0
48
Conclusions or recommendations in this report are the opinions of the authors. PCI assumes no responsibility for the interpretation or application of the information contained herein.

Step 2: Obtain Design Loads (M~es) and Drifts (0aes, in percent)
Design loads can be obtained by using either Forced-Based Design (FBD) or
Displacement-Based Design (DBD).
Step 3: Estimate Frame Beam Dimensions
hg _< In/3 (3-1)
bg _> 0.3 hg (3-2)
Where:
bg = beam width
In = clear span of beam between column faces
Step 4: Establish Constants
A term Afp~ is defined below, which is subsequently used in step 11 to calculate stress
change in the tendon.
Af,~ =0.5EpO,~eshg (3-3)
Where:
lpu = unbonded length of pre-stressing tendon tributary to one interface
lpu = ln/2 + he/2
he = column width
lpu = half of the average span length if the span lengths along the tendon are not equal.
Step 5: Determine the Proportion of the PT and Deformed Reinforcement Moment
Strengths.
In the first iteration, an initial estimate can be made as follows:
Mp,des ~ 0.55 Mdes (3-4)
49
Conclusions or recommendations in this report are the opinions of the authors. PCI assumes no responsibility for the interpretation or application of the information contained herein.

Ms,,~es = Maes -
Where:
Mdes = total resisting moment at design limit state
Mp,des = resisting moment provided by PT tendon
(3-5)
Ms,de~ = resisting moment provided by tension mild steel reinforcement
Step 6: Estimate the required area of PT Tendon (Ap)
Initially (1st iteration) assume that the compression force in the beam is located 0.05hg
fi:om the compression face or the depth of Whitney stress block (a) is equal to 0.1hg. This
assumption leads to:
Ap = MP":les (3"6)(0.45hg)f,y
Step 7: Estimate the Required Area of Deformed Reinforcement (As)
Using the same assumption as in Step 6 such that:
A, = Ms’d~ (3-7)( 0. 9 5-~ ) h g/~s,ae, f sy
Step 8: Estimate the Neutral Axis Parameter at the Design Drift (~d~)
The relative location of the neutral axis can be found using the assumption that was made
in Step 6 such that:
0.1 (3-8)
This initial estimate of the neutral axis location will be adjusted during the iterative
design procedure.
Step 9: Calculate the Stress in the Tension Mild Steel Reinforcement
f~,d~ = 2~,d~ f,~ (3-9)
50
Conclusions or recommendations in this report are the opinions of the authors. PCI assumes no responsibility for the interpretation or application of the information contained herein.
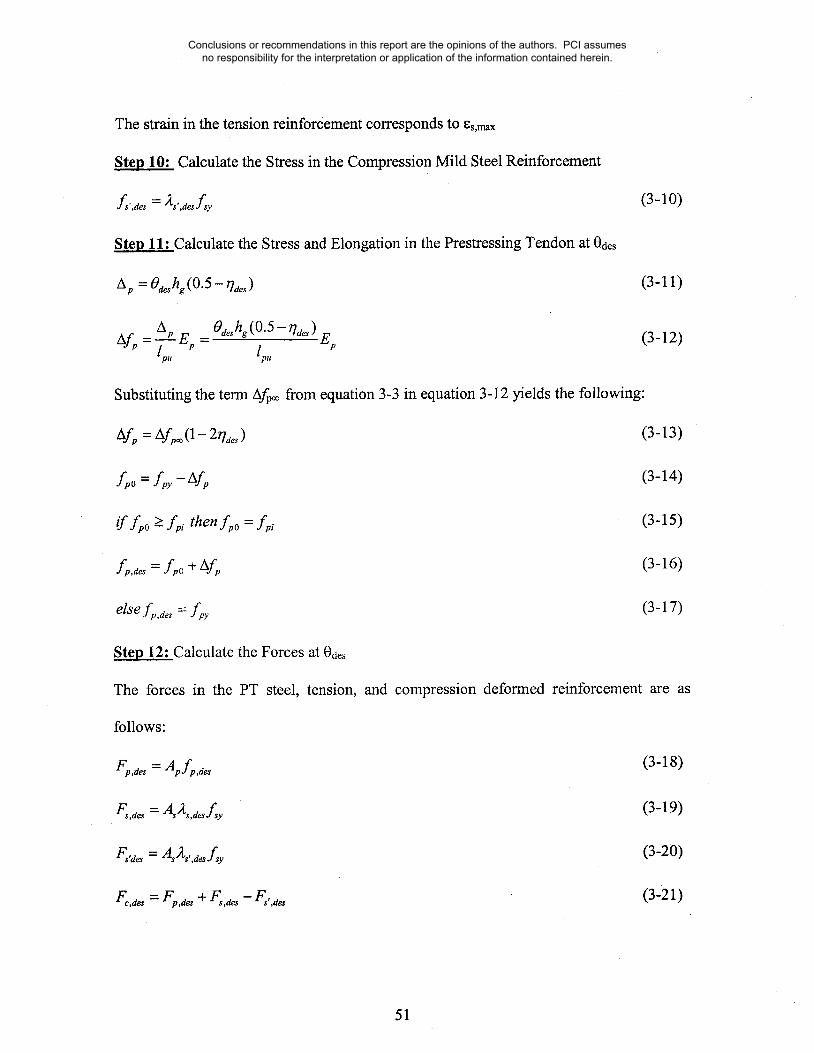
The strain in the tension reinforcement corresponds to es,max
Step 10: Calculate the Stress in the Compression Mild Steel Reinforcement
f,’,aes =
Step 11: Calculate the Stress and Elongation in the Prestressing Tendon at 0aes
Ap = Oaeshg(O.5- r]aes)
lpu
Substituting the term Afpoo from equation 3-3 in equation 3-12 yields the following:
Af,o = Afp=, (1 - 2r/,~ )
£o= fpy-Af
if f po > f pi then f po = f pi
fp,d :fpo÷Af,
else f p,~ : f py
Step 12: Calculate the Forces at 0~
The forces in the PT steel,
follows:
(3-10)
(3-11)
(3-12)
(3-13)
(3-14)
(3-15)
(3-16)
(3-17)
tension, and compression deformed reinforcement are as
(3-18)
(3-19)
(3-20)
(3-21)
51
Conclusions or recommendations in this report are the opinions of the authors. PCI assumes no responsibility for the interpretation or application of the information contained herein.

The compression force (Fc,des) between the grout and concrete is calculated based on the
equilibrium of forces at the section.
Step 13: Calculate the Locations of the Compression Force and the Neutral Axis
The depth of the Whitney equivalent stress block (a~es), the relative position of the
compressive force as a fraction of overall height ((Xdes), and the relative position of neutral
axis as a fraction of overall height (Tide~) can be calculated as follows:
Fc,desa~ 0.85f~’ b (3 -22)
= aa~ (3-23)~ des 2h
The above-calculated value of T~des is then compared with the previous value (Step 8 or
previous Step 13), and Steps 11-13 are repeated until the computed and the old and new
values of Tides converge.
Step 14: Calculate the Moment Strength of the Section at 0ae~
Taking moments of the forces in the PT and deformed reinforcement about the centroid
of the compression force yields:
M~,,ae, = F~,,a~h(0"5 - aa~,) (3-25)
M,,a,, = ~,a,,h(l_ff _aa~) (3-26)
M,,,a~ = F,,,,~h(ff -aa~) (3-27)
~ the tot~ moment strength
M~p,o~z = M p,aes + Ms,a~ + M~,.a~ (3-28)
52
Conclusions or recommendations in this report are the opinions of the authors. PCI assumes no responsibility for the interpretation or application of the information contained herein.
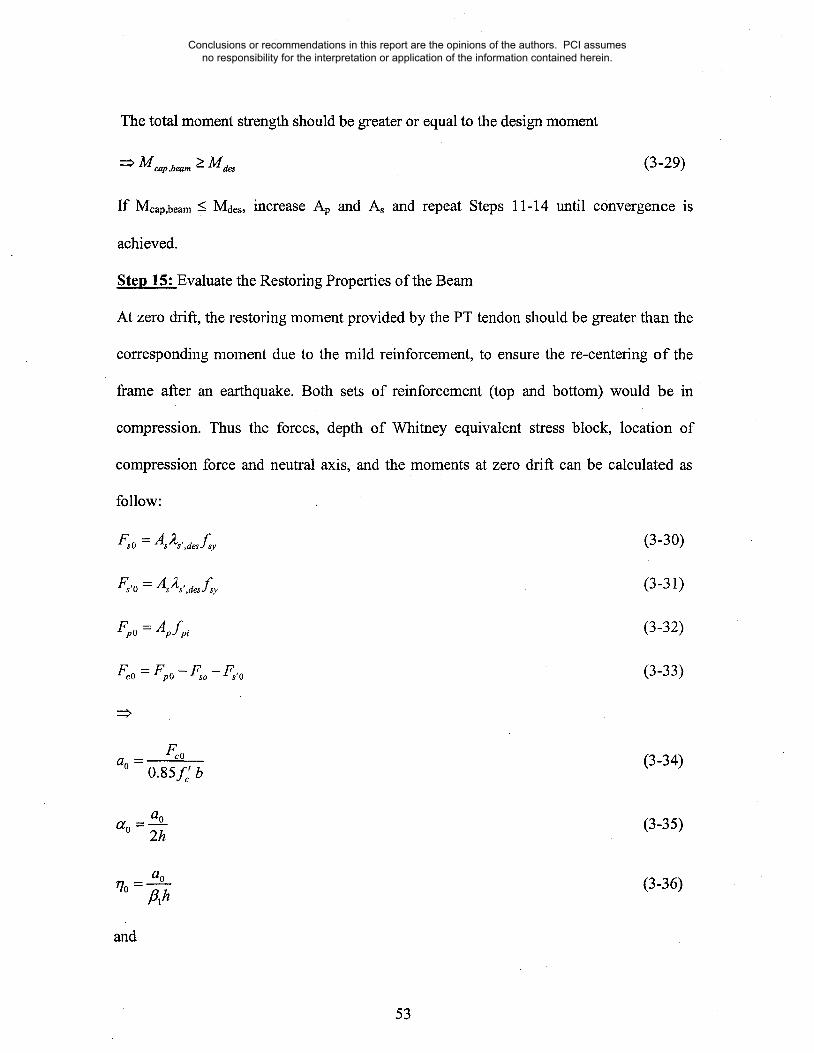
The total moment strength should be greater or equal to the design moment
~ M~,p,be, m > Ma~ (3-29)
If Mcap,beam < Mdes, increase Ap and As and repeat Steps 11-14 until convergence is
achieved.
Step 15: Evaluate the Restoring Properties of the Beam
At zero drift, the restoring moment provided by the PT tendon should be greater than the
corresponding moment due to the mild reinforcement, to ensure the re-centering of the
frame after an earthquake. Both sets of reinforcement (top and bottom) would be in
compression. Thus the forces, depth of Whitney equivalent stress block, location of
compression force and neutral axis, and the moments at zero drift can be calculated as
follow:
Fso = As/Zs,,,~f~y (3-30)
F~,o = A~A,,,desf, y (3-31)
Fpo = Apf pi (3-32)
Fco = Fpo - F,o - F,,o (3-33)
Fc0ao - (3-34)
0.85f~’ b
aoao = -z-s. (3-35)
a0r/0 = ~ (3-36)
and
53
Conclusions or recommendations in this report are the opinions of the authors. PCI assumes no responsibility for the interpretation or application of the information contained herein.
M ~,o = Fpoh(0.5 -ao) (3-37)
M,o = Fsoh(1-~-ao) (3-38)
Ms,o = F¢oh(ff -ao) (3-39)
To ensure self-centering
Moo > Ms0 + Ms’0 (3-40)
Where:
Fs0 = force in tension mild steel reinforcement at zero drift
Fs,0 = force in compression mild steel reinforcement at zero drift
Fp0 = force in PT tendon at zero drift
Feo = force between beam concrete and grout at zero drift
ao = depth of Whitney compression block at zero drift
oto = distance from the center of the compression block to the beam compression face
divided by the beam height at zero drift
rio = distance from the neutral axis to the beam compression face divided by the beam
height at zero drift
Moo = resisting moment provided by PT tendon at zero drift
M~0 = resisting moment provided by tension mild steel reinforcement at zero drift
Ms,o = resisting moment provided by compression mild steel reinforcement at zero drift
If self-centering criterion in equation 3-40 is not met, then select a higher ratio of
Ml~,deJMs,des and repeat steps 5 - 15 until the criterion is met.
54
Conclusions or recommendations in this report are the opinions of the authors. PCI assumes no responsibility for the interpretation or application of the information contained herein.

Step 16: Calculate the Elongation and Required Unbonded Length of the Mild Steel BarAs = 0d~h(1-~’-r/a,,)
(3-41)
The strain in the mild steel deformed bar should be equal or less to the maximum usable
strain (~,max). The unbonded length of the bar must therefore satisfy the following
condition:
lsu > As (3-42)
Step 17: Confine Compression Region
The common assumption that plane sections remain plane would not be valid at the
beam-column interface because the PT tendon is unbonded and pre-stressed. Also the
beam end deformation is concentrated in a single crack [Stanton and Nakaki, 2002].
Therefore, the concrete strains cannot be calculated from the curvature and a plastic hinge
length.
Stanton and Nakaki [2002] recommended a plastic hinge length, taken as a function of
the compression zone depth such that
lph = kph Tides h (3-43)
Where:
kph = 1 (Without experimental validation)
~ - Od~(rla~h) - O~e~ (3-44)lph kph
Where:
ec = concrete compression strain at beam compression face
The compression region, should be confined if the calculated concrete strain is greater
than the ultimate concrete strain (_= 0.003).
55
Conclusions or recommendations in this report are the opinions of the authors. PCI assumes no responsibility for the interpretation or application of the information contained herein.
3.2 Overview of Other Design Factors
A more simplified design procedure including user-friendly design charts and equations
would be helpful in gaining more widespread acceptance and utilization of" this
significant technology for precast seismic - resistant construction. This can be achieved
by developing dimensionless parameters that would be utilized in non-dimensional
equations applicable to most cases. The derivations of the proposed non-dimensional
design parameters and equations are described in the following.
The proposed material over-strength factors suggested by the PRESSS report are based
on the authors’ observations (Xs,aes = 1.35 and Ls’,0es = 1). However, according to section
3.3.3 of the ACI T1.2-03 the tensile strength of the mild steel reinforcement must be
taken as the specified minimum tensile strength fu and the compressive strength must be
taken as 1.25fy (in absence of test data on the stress-strain properties of the mild steel
reinforcement). A more rational procedure based on inelastic cyclic behavior of
reinforcing steel bars is needed for calculating the reinforcing steel’s over-strength
factors in tension and compression. Although, discussions on finding Ls,0es and ~s’,des
based on experimental results are given later in this section, the values recommended by
ACI T1.2-03 were used in the examples provided in chapter 4.
A potential failure mode of the hybrid frame is the fracture of the mild steel bars. Tests of
hybrid frame connections by NIST (Cheok and Stone, 1994) indicated fracture of bars
during cyclic loading. Thus the prediction of steel fracture is a very important aspect and
should be considered in the design procedure based on low-cycle fatigue behavior of
bars. The PRESSS procedures do not currently address this issue specifically.
Section 3.3.2 of the ACI T1.2-03 recommends that ASTM A 706 reinforcing bars be used
56
Conclusions or recommendations in this report are the opinions of the authors. PCI assumes no responsibility for the interpretation or application of the information contained herein.

in hybrid frames and specifies a maximum strain (Ss,max) that is 2% less than the strain at
the minimum elongation indicated in ASTM A 706 for a given bar size. For a #8 bar, this
limit would be 10%. This limit could be as high as 12% for other bar sizes.
Priestly and Seible (1996) recommend that the maximum allowable strain in the mild
steel reinforcement under cyclic loading should be limited to 75% of ultimate strain and
6% in absence of better information. Fatigue tests of ASTM A706 bars (with or without
non-zero mean strain) are currently not available. The low-cycle fatigue behavior of
A706 deformed-steel reinforcing bars will be evaluated experimentally at the University
of Wisconsin Milwaukee. The deformed bars will be subjected to cyclic axial strain
amplitudes ranging from 2% to 10% with non-zero mean strain.
As discussed in chapter 2, Mander (1994) experimentally evaluated the low-cycle fatigue.
behavior of ASTM A615 grade 40 ordinary deformed reinforcing steel bars subjected to
cyclic axial strain amplitudes ranging from yield to 6%. The plastic-strain amplitude
relationship with fatigue life for reinforcing steel bars is given by Mander (1994) as:
!~’~’p _ 0.08(2Ni)-o., (3-45)%- 2
Where:
g.~, = plastic strain amplitude - ~m~x- ~n2
Aep = plastic strain range = ~m~x- ~rnin
%~x ----- maximum plastic strain in a cycle
gm~ = minimum plastic strain in a cycle
(3-46)
number of cycles to failure
57
Conclusions or recommendations in this report are the opinions of the authors. PCI assumes no responsibility for the interpretation or application of the information contained herein.
0.0032~ Nf - (gap)2 (3-47)
The hysteretic behavior of bars subjected to cyclic deformations should be considered
when determining the stress level in the bar at maximum design strain. The maximum
tensile stress fmax,a" (in ksi) corresponding to ~ap can be calculated using the following
equation proposed by Mander (1994) for reinforcing steel bars:
fmax,rO%p = 51.6(2N:)-°"541 (3-48)
Substituting for Nffrom Equation 3-47 yields:
fm~x,r = 145(~.p)°~8 (3-49)
fmax,T2s,des =~ (3-50)
f,
Using the above equation, the )~s,aes values for ~ap of 0.04 and fy of 60 ksi would be 1.354,
which is close to the 1.35 values suggested by Stanton and Nakaki.
According to Mander (1994), the equivalent number of equi-amplitude cycles of building
motion in an earthquake (Nc) can be conservatively estimated using the following
equation:
-1
Nc = 7T5- (3-51)
Where
T = fundamental period of the structure in seconds
Chang and Mander [ 1994] report that the number of equi-amplitude cycles (Ne) depends
on the earthquake and the period of the structure as shownin Figure 3.2 below.
58
Conclusions or recommendations in this report are the opinions of the authors. PCI assumes no responsibility for the interpretation or application of the information contained herein.

I0
0.10,01 0.1 t 10
Period (see)
Figure 3.2 Number of Equi-Amplitude Cycles versus the Period of the Structure(Chang and Mander, 1994)
Therefore, substituting Nc from equation 3-51 as Nf in equation 3-45 yields the following:
Sap = 0.021T1/6 (3-52)
The mild steel bar in the hybrid frame is subjected to strains ranging froln zero to
maximum tension strain. The minimum strain would be approximately zero,
’~min ~ 0 (3-53)
Equation 3-52 can therefore be used to estimate the maximum design strain in the bar for
a given period of the structure.
59
Conclusions or recommendations in this report are the opinions of the authors. PCI assumes no responsibility for the interpretation or application of the information contained herein.

3.3 Development of Non-Dimensional Procedure
The step-by-step PRESSS procedures can be restated form as
described below.
Step 1: Establish Material properties (Same as PRESSS Design Step 1)
Step 2: Obtain Design Loads (Mdcs) and Drifts (0des~ °/_~
Step 3: Estimate Frame Beam Dimensions
The PRESSS procedures specify the following two limits for beam dimensions
hg < in/3 (3-54)
bg > 0.3 h (3-55)
However, knowing that
lpu = ½ Ls for spans of equal length along the entire frame
= (average length of spans)/2 for spans of unequal length
Ls = span length (center-to-center of columns)
The following two non-dimensional parameters can be defined.
in a non-dimensional
~b- lpu (3-56)
and
b (3-57)hg
Therefore, based on the original PRESSS limits
~ _> 2 (3-58)
and
q/ > 0.3 (3-59)
60
Conclusions or recommendations in this report are the opinions of the authors. PCI assumes no responsibility for the interpretation or application of the information contained herein.

Step 4: Determine the Proportion of the PT
Strength
Assume a value for ~o:
M p,des
Therefore,
Mp,des = ~oMaes
and
M~,de~ = (1 - (0)Mdes
and Deformed Reinforcement Moment
- ratio of PT moment to total moment strength (3-60)
(3-61)
(3-62)
Step 5: Estimate the Neutral Axis Parameter at the Design Drift (rl~e_~s
0.1r/aes = ~ Or any other initial estimate value (3-63)
The initial estimate of the neutral axis location (0.1/131) will be adjusted during the
iterative design procedure.
Steo 6." Calculate the Strain in the Prestressing Tendon at Odes
The following proposed procedure is slightly different from the PRESSS procedure in
that the strain (and not stress) in the post-tensioning tendon is checked to ensure that the
tendon would not yield.
zx, =
The corresponding change in strain is:
(3-64)
(3 -65)
The PT steel must not yield, and therefore its strain should be kept at or below yield as
follows:
61
Conclusions or recommendations in this report are the opinions of the authors. PCI assumes no responsibility for the interpretation or application of the information contained herein.

~p = epi + A~p _< a’gpy (3-66)
Where:
c~’ is a factor to allow the designer to control and limit strain in the PT tendon at any
desired level below yield. It should be noted that the ~x’ is not included in the original
PRESSS procedures.
a’_< 1 (3-67)
If this condition (Eq. 3-66) is not satisfied, then increase the unbonded length of the PT
steel (qb = lpu/h).
The PT steel stress, fp,aes can then be obtained from the o-g curve for Grade 270
prestressing strands (PCI design handbook) as follows:
For ~py--~ 0.0086 ~ fp,des = Ep ~p (3-68)
Define the following non-dimensional parameters
X- f p,de, (3-69)
~- fP"~ (3-70)
N- fp,d~ (3-71)
Y- f~Y (3-72)f;
R- fsy (3-73)f p,de~
62
Conclusions or recommendations in this report are the opinions of the authors. PCI assumes no responsibility for the interpretation or application of the information contained herein.
Ste~ 7: Calculate the Relative Locations of the Compression Force and the Neutral Axis
The depth of the Whitney equivalent stress block (a~es), the relative position of the
compressive force as a fi:action of overall height (c~es), and the relative position of neutral
axis as a fraction of overall height (rides) can be calculated as follows:
Fcd~ (3-74)aaes --
0.85f~’ bg
- aaes (3-75)cram - 2h-~-
Where:
Fc.d~ = F~,.d~ + Fs.d~ - Fs,,a~ (3-76)
Fp.,~ = Apf p,,~ (3-77)
F~,a~ = A~2s.~f~y (3-78)
F,,,~e, = As2,..a~f,y (3-79)
Define the following non-dimensional parameters
Ap (3-80)b~hg
Apr -A~
Q_ L’ (3-82)
According to Section 18.4.2 of the ACI 318-02 provisions
~, < 0.45 Q (3-83)
Substituting for Fc,des from equations 3-76 to 3-79 in equation 3.75 yields:
63
Conclusions or recommendations in this report are the opinions of the authors. PCI assumes no responsibility for the interpretation or application of the information contained herein.
_ ades
Therefore,
(3-84)
(>85)
(3-86)
The above calculated value of rides is then compared with the previous value in Step 5,
and Steps 6 and 7 are repeated until the rlaes values converge. The non-dimensional
design relationships involving area of PT tendon (Ap) and area of mild steel
reinforcement (As) for the new rides values are:
Md~ - 0"5(1-fllr/ae*) (3-87)Aphgfp,aes ~
M,~,=~ _ (1-g" - O.5fl, r&s)- 0-88)AshgZ s,desf sy 1-co
and
ip RA,,a~ (1-~-O.S flfla~,)
As 0.5(1- fllr/d~, )(1-- 1)�o
(3-89)
Ste_~__8: Calculate the Moment Strength of the Sction at 0de__~
Taking moments of the PT and deformed reinforcement forces about the centroid of the
compression force yields:
M~,,a= = Fp,q~h(0.5 - aa~) (3-90)
M,,.s = F,,a~,h(1-~-aa=) (3-91)
(3-92)
64
Conclusions or recommendations in this report are the opinions of the authors. PCI assumes no responsibility for the interpretation or application of the information contained herein.
The total moment strength
M~p,be,m = Mp,des + M,,des +
The total moment strength should be greater or equal to the design moment
M cap,beam >-- Males
Therefore, the following non-dimensional relationship can be written
0.5(1- fl~r/d~) + rR---[As,a~(1-~’-0.Sfllr/a~)+ As,,a~(~’-0.5fllr/a~)t
The above condition would be the objective function if a
performed. The objective function should be achieved by changing rlaes, ~0, and
Steo 9: Evaluate the Restoring Properties of the Beam (Constraint Equations)
= - - s0
a0--
a0~o =~
ao
M,o = F~hg(O.5-ao)
M~o = F~oh~ (1- £’- ao)
M~,o = F~’ohg (~ -eto)
(3 -93)
(3 -94)
_> 0’5(1-fllr/a~) (2-95)
design optimization is
(3 -96)
(3-97)
(3-98)
(3-99)
(3-100)
(3-101)
(3-102)
(3-103)
(3-104)
(3-105)
65
Conclusions or recommendations in this report are the opinions of the authors. PCI assumes no responsibility for the interpretation or application of the information contained herein.

To ensure self-centering
Mpo > Mso + Ms,o (3-106)
The above requirement for self-centering can be written in non-dimensional form:
r > 22s,,dosK (3-107)
where,
K- Zy (3-108)
Step 10: Calculate the Elongation and Required Unbonded Length of the Mild Steel Bar
In this step, the PRESSS procedures are modified to include the effect of bending strain
(~b,max). the contribution of additional effective unbonded length of bars dueto straining
in the bonded regions is also considered. The bar’s horizontal deformation (AX), axial
strain (ea), and bending strain (~b) should be calculated using the equations presented in
Section 2.3 as follows:
Let
As O ae, h g (1- rl ae, - £ )~’a,a ----- ~ ----- (3-109)
where,
Lsu = unbonded length of mild steel reinforcement at each interface
From the relationship developed in section 2.3 of this report,
1
~,= l+2(02ae, +e2.,.)icos +a" +(02ae. +~ .,a -1 (3-!10)
66
Conclusions or recommendations in this report are the opinions of the authors. PCI assumes no responsibility for the interpretation or application of the information contained herein.

(3-111)
Where,
~z" = tan-1/O~ / (3-112)
Growth in the unbonded length of the bar is expected to occur under high cyclic strain.
Raynor and Lehman [2002] studied the bond characteristics of bars grouted in light-
gauge metal ducts. A non-uniform strain distribution occurs at each end of the unbonded
region of the bar that penetrates into the bonded region of the bar. According to their
study, the elongation due to strain penetration is equivalent to the peak strain acting
uniformly over an equivalent additional unbonded length (Lua) on each end. The
additional equivalent debonded length can be calculated using the following equation
[Raynor, 2002]:
L"---a-~ = 0"81(f~u-f~Y) (3-113)do
Thus, the total unbonded bar length (Lot) is:
Lu,=L,u +2L.. (3-114)
The maximum total strain that the bar is subjected to is the sum of axial and bending
strains (~a×ial + ~b,m~x). As discussed earlier, the conservative approach proposed is to
ensure that the total strain is less than ~s,ma×, the maximum strain that the bar can be
subjected to basedon low-cycle fatigue tests.
’~,=;,,~ + ’~t,,~x < ’~s,~x (3-115)
67
Conclusions or recommendations in this report are the opinions of the authors. PCI assumes no responsibility for the interpretation or application of the information contained herein.

We can then calculate eU,m~x (equation 2-111) and subtract it from es,m~x to obtain the
maximum allowable axial strain (earl).
Gall : Gs,max -- Gb,nmx (3-116)
To ensure satisfactory performance, the following condition must be met
Gox~l _< GatI (3-117)
However, since the actual effective unbonded length is L~t and not Lsu, the calculated
axial strain can be reduced by the ratio (Lsu/Lut).
G,,,, >G,,xi,~, ~ Lut)- (3-1t8)
Lut >_ Ls" ~°t - (X-rld~" -£)O~ l G’~i"’I (3-119)hg hg GalI Ga,a k. Gall J
For typical values of ~a,~ and 0~,s, the ratio of ~x~___L is very close to 1. Therefore,
>_ (1 - V e, -- (3-120)
and
L,. (Required) = Lu, - 2L,u, (3-121)
Step 11: Confine Compression Region
Gc -- . lph kph
kph = 1 (Without experimental validation)
If ec > 0.003 provide confinementreinforcement in the compression region.
68
Conclusions or recommendations in this report are the opinions of the authors. PCI assumes no responsibility for the interpretation or application of the information contained herein.
3.4 Summary of Proposed Non-Dimensional Steps
1. Establish material properties
2. Obtain the applied moment and design drift (Maes and 0aes)
3. Specify d? = Lpu/h
4. determine the portion of moment strength (03)
5. Estimate the neutral axis parameter (~lae~)
6. Calculate the strain in the prestressing tendonAp _ 0~os (0.5-qa~)
¯A~r - lpu
~
7. Calculate the relative locations of the compression force and the neutral axis
Ap7-
bghg
N - fp,ae~f;
f ~d.es
G~,des -- 1.7
Mao~ _ 0.5(1-fl~r/a~)Aphgf p,des o)
69
Conclusions or recommendations in this report are the opinions of the authors. PCI assumes no responsibility for the interpretation or application of the information contained herein.

M~¢, = (1-g" - 0.5fl~r/~,)
Ap R&, ,~ (1- g" - 0.Sfl~r/~,)
As 0.5(1- tilt/des)(1-1)
8. Calculate the moment strength of the section (objective
optimization problem)
0.5(1--j~lTldes) -’b -~I,~s,des(1--~--O.5~lTldes)-b ~s,,des(~--O.51~llldes)l
9. Evaluate the restoring properties of the beam (constrained
optimization problem)
function in an
> 0.5(1- fl, r/,~)
equation in an
10. Calculate the required unbonded length of the deformed reinforcement
0 des + °~ a,a COS +
2 ~ ~3(0 ~ + g o.) sin( + a") - Od~ db
L~._~_~ = 0.8 I(f,, - f**)db
L., =Ls. +2L..
%~.~ + eb,~x < es,m.x
70
Conclusions or recommendations in this report are the opinions of the authors. PCI assumes no responsibility for the interpretation or application of the information contained herein.

3.5 Parametric Studies
The above dimensionless parameters were varied in an extensive parametric study
(approximately 1200 runs) involving an optimization process. The objective of the
optimization program was to ensure that the moment capacity of the section is greater
than Mdes and satisfying additional constraints discussed below.
M cap,bea~n = M p,aes + M s,ae, + M s,,aes > M ,u~
R A, -:::> 0"5(1--)~l/’]des) + 7[ "’a~(1-~-O’Sfl’rlae’)+ ~s"des(~--O’5t~’~des)~ > 0"5(1-fl’~/a~’)co.’. The objective function is equal to:
0.5(1-fl, r/a~) + RE,~,.a~(1-~’-0.Sfllqa~)+ I~s,,des(~--O.5~l~des)~-O’5(1-~lTldes) =0
The Microsoft EXCEL’s Solver feature was used to find the optimum solution by
changing HOes, m, and y subjected to following constraints:
(to achieve zero residual drift)
(to ensure that PT steel would not yield)
(Q =f{:/fro) (to meet ACI 318-02 section 18.4.2 requirements)
Figure 3.3 below shows some features of the Excel spreadsheet. The formulation of the
whole spreadsheet is given in Appendix A. Table 3.3 below lists the range of parameters
used in the parametric studies.
71
Conclusions or recommendations in this report are the opinions of the authors. PCI assumes no responsibility for the interpretation or application of the information contained herein.

ksi
0.03419
M~ ~M,o +M,,o
CMcu~e ti~ re]a6ve.loc ations of the compression £o~ce md the neutral
St~l-. 10 CldCULlte ~he moment ,trengffi of~ section = ~
x[~ =o-�- ~)+~,.,(¢-~)] ~ (o.5- ~. )(o~-~+ ’ ~ ¯ ~
_take OA~ to the le~ side ~the equation
Figure 3.3 Sample view from EXCEL Spreadsheet
72
Conclusions or recommendations in this report are the opinions of the authors. PCI assumes no responsibility for the interpretation or application of the information contained herein.

Table 3.3 Range of Parameters Used in the Parametric Studies
Parameter
4-L~
(%)
(%)
f~’ (ksi)
Minimum Maximum
2 20
0.5 4
1 8
0.5 0.65
4 8
3.6 Results from the Parametric StudiesBased on the results of the parametric studies, a complete set of charts
dimensional parameters were gene{ated as shown in Figures 3.4 through
simplified design equations were recommended.
The design charts that follow are based on the following basic properties
En (ksi) 28500
f~u (ksi) 270
f~y (ksi) = 0.9 fp,, 243
Es (ksi) 29000
f,~, (ksi) 60
~ 0.055
with non-
3.19 and
A designer can calculate the required areas of post-tensioning tendon (Ap) and mild steel
reinforcement (As) by utilizing Figures 3.4, 3.6, 3.7, and 3.9and using the following
procedures for a specified M~es, Odes, and Vs,m~x :
1. Specify d~ = Lpu/hg
73
Conclusions or recommendations in this report are the opinions of the authors. PCI assumes no responsibility for the interpretation or application of the information contained herein.
2. Go to either one of Figures 3.14 through 17, determine ~2, and calculate fp,des
3. Go to Figure 3.4 or Figure 3.7, determineMaes , and calculate Ap
M des4. Go to Figure 3.6 or Figure 3.9, determine As2c,,ae~h~,f,y, and calculate As
It can be noticed from Figure 3.4 that the required area of PT tendon Ap increases as Odes
increases for a given do, Mdes, and Ss,ma~. On the other hand, Av decreases as
increases for a given do, Mae~, and Odes (Figure 3.7). The reverse is true for the area of the
mild steel reinforcement As.
The stress in the PT tendon fo,des at a specified design drift Odes increases as dO increases. It
also increases when the initial stress in the PT tendon fpi increases as shown in Figures
3.14 through 3.17.
The designer can also calculate the ratio of the PT moment to the total moment strength
co from Figure 3.5 and Figure 3.8. The relative area of the PT tendon to the beam’s cross
section 3’ can be calculated from Figures 3.10through 3.12. The relative location of the
neutral axis qdes can be calculated from Figure 3.13. It can be noticed from Figure 3.13
that rides increases as the compressive strength of the concrete f’c increases.
74
Conclusions or recommendations in this report are the opinions of the authors. PCI assumes no responsibility for the interpretation or application of the information contained herein.

0.96
0.94
~ 0.92~.~ 0.9
~ 0.88~ 0.86~ 0.84
0,82
0.8
Mdo,lAphgfp,do, Vs ~[S,,max = 4%]
10 15 20 25
¢ = LpJh~
values ofe.oo (%)+0.5--=--1~ 1.5--x~2
+3--+--3.5~4
Figure 3.4 [Mdes/Aphgfp,des] versus � for ~s, max ----" 4%
0.55
0.54
0.53
0.52
0.51
0.5
0.49
0.48
0,47
0.46
~0 = Mp,des/Mdes VS �[E;s,max " 4%]
0 5 10 15 20
� = Lpu/h~
25
values ofOdes (%)
---~-’- 0.5--~--- 1---b--- 1.5---X--" 2~2.5"--~3--+--3.5~4
Figure 3.5 [Mp,des/Mdes] versus � for Ss,max = 4%
75
Conclusions or recommendations in this report are the opinions of the authors. PCI assumes no responsibility for the interpretation or application of the information contained herein.

1.95
1.90
1.85
1.8o
1.75
1.70
1.65
[ Mdesl(As~,s,deshgfsy)] V$ �
[Ss,max = 4%]
5 10 15 20
� = Lpu/hg
Figure 3.6 [Mdes/As~,s, deshgfsy] versus � for 8s,max = 4%
values ofede.~ (%
%2
"-~’- a-’-+-- &5~4
25
0.96
0.940.92
0.9
~ 0.880.86
0.84
0.820.8
Mdes/Aphgfp,des VS ~p[Odes ---- 2%]
/
0 5 10 15 20
� = Lpu/hg
25
values of~s,max (%)
---~- 4~5~6
Figure 3.7 [Mdes/Aphgfp,des] versus � for Odes = 2%
76
Conclusions or recommendations in this report are the opinions of the authors. PCI assumes no responsibility for the interpretation or application of the information contained herein.

0) = Mp,des / Mdes Vs ¢[Odes = 2%]
0.57
0.55
~0.53
0.51
0.49
0.47
0.455 10 15 20
� = Lpu/hg
25
values of~s,max (%)"-~-’- 1
"--~-- 2---)*--2.51~̄’~ 3
~5~6~7~8
Figure 3.8 [Mp,des/Mdes] versus � for Odes = 2%
2.052.001.951.901.851.801.751.701.65
[Mdes/As hgZs,desfsy)]Vs ~[Odes = 2%]
20
� = Lpu/h
25
values of
~s,max (%)+1---I-- 1.5~r-- 2
+3+3.5---t--- 4~5
---~-- 7+8
Figure 3.9 [Mdes/As~,s,deshgfsy] versus � for Odes = 2%
7?
Conclusions or recommendations in this report are the opinions of the authors. PCI assumes no responsibility for the interpretation or application of the information contained herein.

0.25%
0.24%
0.23%
0.22%
0.21%
0.20%
0.19%
0.18%
y = A~/bhg Vs �If "g = 5 Ksi, fpi = 0.65 fpu]
5 10 15 20
~ = L~/ho
25
values of6des (%)
Figure 3.10 Ap/bhg versus ~ for f’c = 5 ksi and fpi = 0.65
7 = Ap/bhg Vs �[f "c = 5 Ksi,edes = 2%]
0.35%
0.30%
0.25%
0.20%
0.15%5 10 15 20 25
( = Ipu/hg
+ fpi = 0.5 fpu+ fpi = 0.55 fpu--&--fpi = 0.6 fpu--x--fpi = 0.65 fpu
Figure 3.11 Ap/bh versus ~ for edes = 2% and fpl = 0.65 fpu
78
Conclusions or recommendations in this report are the opinions of the authors. PCI assumes no responsibility for the interpretation or application of the information contained herein.

7 = Ap/bh Vs �[Odes = 2%, fpi--’-- 0.65 fpu]
0.40%
0.35%
0.30%
0.25%
0.20%
0.15%10 15 20 25
~ = Lp,,/h
~ f "c = 5ksi~f’c 6ksi~f’c 7 ksi
!--x--f "c 8ksi
Figure 3.12 Ap/bh versus ~? for Odes ----- 2% and f’e = 5 ksi
~s Vs I~
0.2
0.19
0.18
0.17
0.16
0.15
0.14
0.13
0.12
0.11
0.10.6 0.65 0.7 0.75 0.8 0.85 0.9
Figure 3.13 Tides versus
79
Conclusions or recommendations in this report are the opinions of the authors. PCI assumes no responsibility for the interpretation or application of the information contained herein.

~ =fp,deslfpy VS �
[fpi -- 0.65 fpu]
1.00
0,95
0.90
0.85
0.80
0.75
0.705 10 15 20
� = Lpu/hg
25
~1.5---X---- 2.--)k~-- 2.5
---e--3
---~-" 3.5~4
Figure 3.14 fp,des/fpy versus ( for fpi = 0.65 fpu
0.350.340.330.320.31
~.~,~0.300.290.280.27O.260.25
R = fsylfp,desVS (~
[fpi = 0.65 fpu]
0 5 10 15 20
~ = LpJh25
(%)
-’~’- 0.5"-~-- 1
1.5"-’X’-- 2~2.5"-e--3~3.5
~4
Figure 3.15 fsy/fp,des versus � for fpl = 0.65 fpu
80
Conclusions or recommendations in this report are the opinions of the authors. PCI assumes no responsibility for the interpretation or application of the information contained herein.

E~ = fp,des/fpy VS � = Ipu/hg[O = 2%]
1.00
0.95
0.90
~~0.85
" 0.80
n,’ 0.75
0.70
0.65
0.600 5 10 15 20
~ = Ip,,/hg
25
---,-fpi = 0.5 fpu--~-- fpi = 0.55 fpu~ fpi = 0.6 fpu--x--fpi = 0.65 fpu
Figure 3.16 fp,des/fpy versus ( for 0d~s = 2%
R = fsy/fp,des VS � = Ipu/hg[0 = 2 %]
0.45
0.40
0.35
0.30
0.25
0.205 10 15 20 25
� = Ipu/hg
+ fpi = 0.5 fpu--~-- fpi = 0.55 fpu~ fpi = 0.6 fpu---X---fpi = 0.65 fpu
Figure 3.17 fsy/fp,des versus ~ for Odes ---- 2%
81
Conclusions or recommendations in this report are the opinions of the authors. PCI assumes no responsibility for the interpretation or application of the information contained herein.

Since the curves in the above figures show smooth variations, simple design equations
that are functions of Odes, I~s,max, �, and 131 can be derived from the design charts. The
proposed design equations are as follows:
Mp des’ -- 0.8 90)0.04~s,max"0"0371 (3-123)des
Maes 0.0371= 1.125rPo.o4~s,m~x (3-124)Aphgfp,des
Mde~ = 0.882Wo.o4~s,m~x*’°34 (3-125)A~Zs,ae~ h g f p,a~
Ap7 - - ~’~v~v~ (in percent) (3-126)
r/aes = -0.2fll +0.3 (3-127)
Where:
030.04 = the ratio of the PT moment to the total moment strength corresponding as,n~× = 4%
Mdes~Po.o4 - at es,n~ = 4% (3-128)
Aphgfp,des
Mdesaro.o4 = at e,,n~ = 4% (3-129)Asd,,,a~sh g f p,a~
1. For d~ = Lpu/hg -< 8
Mp des
COo.o4 = ____a__, = (5.160a~, + 0.49)#(z7°~+°’°3~Mdes
(3-130)
Mdes 0 9)¢(2’70m +0’03)q~o.o4 = = (-6"7~a~, + ¯Aphg fp,,t~s
(3-131)
M,~ = (22.230ae~ + 1.7)¢.(3.464om+o.o2,6)mo.o4 = A~2,,a~h g f l,,a~ (3-132)
82
Conclusions or recommendations in this report are the opinions of the authors. PCI assumes no responsibility for the interpretation or application of the information contained herein.

0aes = interface design drift expressed in fraction
2. For d~ = Lpu/hg > 8
Mp,des 0.47) #-(1.9oa~ +o.oo42)O90.04 = = (3.79~a= +Mdes
(3-133)
Maes 0.94) 0(1"90aes+0.0042)CPo.o4 - _ (-5.810a~ +Aphgfp,d~
(3-134)
(3-135)
Ap fOrfc~= 5 ksi ~’ldfpi = 0.65fpu (3-136)~"~ - b~,h~,
~’r~ = (-20aes + 0"215)0(38~0~=+°°25) (in percent) (3-137)
v~ = is a factor that accounts for different values off~’
= 0.208f ’-0.0355 (3-138)
Vp~ = is a factor that accounts for different values of fp~fou
Vp~ = -1.82fpi + 2.18 (3-139)
The results of the three procedures (PRESSS, proposed design charts, and proposed
design equations) are compared for each of the five examples in the following chapter.
The following steps must be followed when utilizing the new design procedures:
A. Procedures when using Design Charts:
1. Obtain the applied moment and design drift (Mae~ and 0a~).
2. From the estimated fundamental period of the structure T, calculate Nc using
equation 3-51 and Ss,max using equation 3-45 or equation 3-52.
83
Conclusions or recommendations in this report are the opinions of the authors. PCI assumes no responsibility for the interpretation or application of the information contained herein.

3. Specify d~ =/-~u/h
4. Calculate fp,des by using Figures 3.14-3.17.
5. Calculate Ap by using Figures 3.4 and 3.7.
6. Calculate As using Figures 3.6 and 3.9.
7. Calculate ,/using Figures 3.10 through 3.12..
8. Calculate Lsu
B. Procedures when using Design Equations:
1. Obtain the applied moment and design drift (Mdes and Odes).
2. From the estimated fundamental period of the structure T,
equation 3-51 and ~s,max using equation 3-45 or equation 3-52.
3. Specify d~ = Lpu/h
4. Calculate r/d~ =--0.2fl1+0.3
5. Calculate Asp using equation 3-65.
6. Check if 8p _< a’ %y using equation 3-66.
7. Calculate fp,dcs using equation 3-67.
8. Calculate Ap using equation 3-124.
9. Calculate As using equation 3-125.
10. Calculate ), using equation 3-126.
11. Calculate Lsu
calculate Nf using
84
Conclusions or recommendations in this report are the opinions of the authors. PCI assumes no responsibility for the interpretation or application of the information contained herein.

Chapter 4
Design Examples
In order to validate, verify, and illustrate the effectiveness of the developed design charts
and simplified equations, a set of five design examples are considered. Each example
includes four separate calculation processes: the original PRESSS procedures, the
modified non-dimensional procedures, the developed non-dimensional charts, and
proposed simplified equations. A comparison and discussion of various solutions is then
given. It should be noted that )~s,des and )~’s,de~ values recommended in ACI T1.2-03 were
used in these exampes
4.1 Example # 1:
Reference: S.K. Ghosh Associates Inc. (PCI Seismic Seminar, Chicago, March 2002)
The design parameters in this example are identical to the PRESSS example at the PCI
convention. However, the calculation steps are revised and corrected to achieve an
optimum solution.
Seismic Data:
Location: Charleston, SC
Site Class D
5-story Office Buildings
3 equal bays (span length = 45 if)
hg = 42 in., bg = 22.5 in
Moment-Resisting Frame System (Hybrid Frame)
85
Conclusions or recommendations in this report are the opinions of the authors. PCI assumes no responsibility for the interpretation or application of the information contained herein.

This example is solved using the original PRESSS calculation, the modified non-
dimensional procedures, the developed non-dimensional charts, and the proposed
simplified equations. Table 4.1 below shows the material properties and information that
are used in the four different design procedures. The results are compared in Table 4.2.
Table 4.1: Material Properties and Design Information for Example 1
Parameter
f ’c (ksi)
f ’g (ksi)
fpy (ksi)
fpu (ksi)
(ksi)Es (ksi)fsy (ksi)
Ls
~,, (It)
Ep (ksi)
Value
5
5.5
243
270
175.5
29000
¯ 60
0.055
45
22.5
28500
0,8[31
~3s,max 0.046
)~s 1.4
Ls’ 1.25
Sy 0.00207
Spy 0.0085
~pi 0.00616
Males (£t-kips) 1235
Odes (%) 1.96
Comments
Compressive strength of concrete
Compressive strength of grout
Yield strength of Gr. 270 strand
Minimum strength of Gr. 270 strand
Initial stress in strand
Modulus of elasticity of mild steel
Yield strength of Gr. 60 steel bars
Cover factor (See Figure 3.2)
Tendon length c/c of columns
(All spans are of equal length)
Ls/2
Modulus of elasticity of Gr. 270 strand
131 = 0.85 - 0.05 (f ’c - 4)
Maximum sustainable strain in the mild reinforcing steel
(See section 4.1.2)
Tension over-strength factor (ACI T1.2-03)
Compression over-strength factor (ACI T 1.2-03)
fsy
fpy fpi/E.
Obtained using Displacement Based Design (DBD)
Calculated Drift
86
Conclusions or recommendations in this report are the opinions of the authors. PCI assumes no responsibility for the interpretation or application of the information contained herein.

4.1.1 Basic Solution Using PRESSS Procedure
The following is an iterative process that follows steps 1 through 15 based on initial
assumptions. For the sake of brevity, only the initial and final values of parameters are
given below.
~ Establish Material Properties and Design Information
See Table 4.1
Step 2: Obtain Design Loads (Mdes) and Drifts (Odes %)
See Table 4.1
Step 3: Estimate Frame Beam Dimensions
hg </n = 42.67x12 =170.7 in. OK3 3
bg >0.3hg =0.3x42=12.6in. OK
Step 4: Establish Constants
= 0.5x 28,500× 0.0196x42
43.4 ksi22.5x12
Step 5: Determine the Proportion of the PT and Deformed Reinforcement Moment
Strength
In the PRESSS procedure, an initial assumption of Mp,des/Maes is made, which in this case
was 0.65. However after several iterations of the steps shown here, the optimum solution
converged on a Mp,desiMdes ratio of 0.51.
Mp,des =- 0.51 Mdes = 630. ft-kips (Optimum solution after several iterations)
Ms,des = Mdes - Mp,des = 605 it-kips
87
Conclusions or recommendations in this report are the opinions of the authors. PCI assumes no responsibility for the interpretation or application of the information contained herein.

Step 6: Estimate the Required Area of PT Tendon (Ap)
Assume initially that the compression force in the beam is located at 0.05hg (a = 0. lhg)
from the compression face. This assumption leads to:
Ap = MP’des
(0.45hg)f,y
630x12= 1.65 in2
0.45 × 42 × 243
Step 7: Estimate the Required Area of Deformed Reinforcement (As)
Using the same assumption as in Step 6 such that:
(0.95-g’)hg~,d~,fsy
605x12= = 2.3 in2
(0.95-0.055) x 42 x 1.39 x 60
Step 8: Estimate the Neutral Axis Parameter at the Design Drift (rides)
The location of the neutral axis can be found using an initial assumption of a!hg -= 0.1 that
was made in Step 6. This assumption results in an initial value of Tides = 0.1/~1. However
after several iterations of the steps shown here, the optimum solution converged on a rides
value of 0.14.
a/h~,r/d~ =~ = 0.14
Step 9: Calculate the Stress in the Tension Mild Steel Reinforcement
= 1.4 × 60 = 84 ksi
88
Conclusions or recommendations in this report are the opinions of the authors. PCI assumes no responsibility for the interpretation or application of the information contained herein.

Please note that the PRESSS procedure recommends a LS,des value of 1.35, but allows for
a more rational determination of this parameter. In this report, a ~s,des value of 1.4 is used
according to the provisions of section 3.3 of ACI T1.2-03.
Step 10: Calculate the Stress in the Compression Mild Steel Reinforcement
= 1.25 x 60 = 75 ksi
Please note that the PRESSS procedure recommends a Ls’,des value of 1, but allows for a
more rational determination of this parameter. In this report, a )Vs,,des value of 1.25 is used
according to the provisions of section 3.3 of ACI T1.2-03.
Step 11: Calculate the Stress and Elongation in the Pre-Stressing Tendon at 0aes
A, = Od h,(O..5- Vd )
= 0.0196x 42x (0.5- 0.14) -- 0.296 in
Ap 0.296Afp =--gp =
lpu 22.5 x 12
f,o= f,y-Af,
-- 243 - 31.2 =211.8 ksi
iffpo > f,, = 0.65x270 = 175.5 ksi
then fpo = fpi = 175.5 ksi
f p,ae, = f po + Af p
= 175.5 + 31.2 = 206.7 ksi
x28,500= 31.2ksi
else f p,de, = f py
89
Conclusions or recommendations in this report are the opinions of the authors. PCI assumes no responsibility for the interpretation or application of the information contained herein.

0.5(1- flfld. )h ~f p,d~
630x120.5(1- 0.8 x 0.14) x 42 x 206.7
= 1.96 in~
And
Ms,des
( l -- ~ -- 0.5 fllrides )hg,¢Cs,desf sy
605 x 12(1- 0.055-0.5 x 0.Sx 0.14)x 42x 1.4x 60
= 2.31 in2
Step 12: Calculate the Forces at Od~s
= 1.96x 207 = 405.71 kips
Fs,d~, = A,~,,de~fsy
= 2.31xl.4x60 = 194 kips
F,,cles = AsFI,s,,desfo,
= 2.31xl.25x 60 = 173.25 kips
Fc,ae, = Fp,ae, + F,,des-Fs,,aes
= 405.7 +194 - 173.25 = 426.5 kips
Step 13: Calculate the Locations of the Compression Force and the Neutral Axis
426.5= 4.5 in.
0.85 f_’b_ 0.85x5x22.5
4.5 = 0.054
_ ad~ = 4.5 =0.134 (Optimum value is 0.14, OK.)rides fllh g 0.Sx 4~
90
Conclusions or recommendations in this report are the opinions of the authors. PCI assumes no responsibility for the interpretation or application of the information contained herein.

1~des = O. 14
O~des = 0.5X fll ×lTdes
= 0.5 x 0.8 x 0.14 = 0.056
Step 14: Calculate the Moment Strength of the section at Odes
Taking moments of both the PT and deformed reinforcement forces about the centroid of
the compression force yields:
= 405.7 x 42(0.5-0.056)/12 = 631.1 ft-kips
Ms.ae, = F~,a~hg(1-~-aae~)
= 194 x 42(1 - 0.055 - 0.056)/12 = 604.1 ft-kips
= 173.25 x 42(0.055 - 0.056)/12 = - 0.6 g&ips
Therefore the total moment stren~h c~ be dete~ned as follows:
M ~.p,b~ = M ~,a~ + M ~,a~ + M ,’,a~
= 631.1 + 604.1 - 0.6 = 1234.6 fl-kips
g cap,b~.~ ~ g aes
1234.6 a 1235 fi-kips, OK (Optimum Solution)
Step 15: Evaluate the Restoring Properties of the Beam
= 2.31xl.25x60 = 173.3 kips
F,,o = As~s,,aesf sy
= 2.31xl.25x60 = 173.3 kips
91
Conclusions or recommendations in this report are the opinions of the authors. PCI assumes no responsibility for the interpretation or application of the information contained herein.

=2×175.5 =351 kips
Fco =Fpo-Fso-F~’o
= 351- 173.3 - 173.3 = 4.4 kips
~Feo
0.85£4.4
0.85×5x22.5= 0.046 in
_ 0.046 = 0.000552x 42
ao
0.046
0.8x 42--= 0.00137
Mpo = Fpohg (0.5 - Of 0)
= 351x 42(0.5 - 0.00055)/12 = 613.6 ft-kips
M,o = F~ohg(1-~-ao)
= 173~3 x 42(1- 0.055 - 0.00055)/12 = 572.9 if-kips
M,,o = F ’ohg( -ao)= 173.3 x 42(0.055 - 0.00055)/12 = 33 ~-~ps
To ensure self-centering
Mpo > Mso + Ms’o
613.6 ~ 572.9+ 33 = 606 fl-kips, OK
92
Conclusions or recommendations in this report are the opinions of the authors. PCI assumes no responsibility for the interpretation or application of the information contained herein.
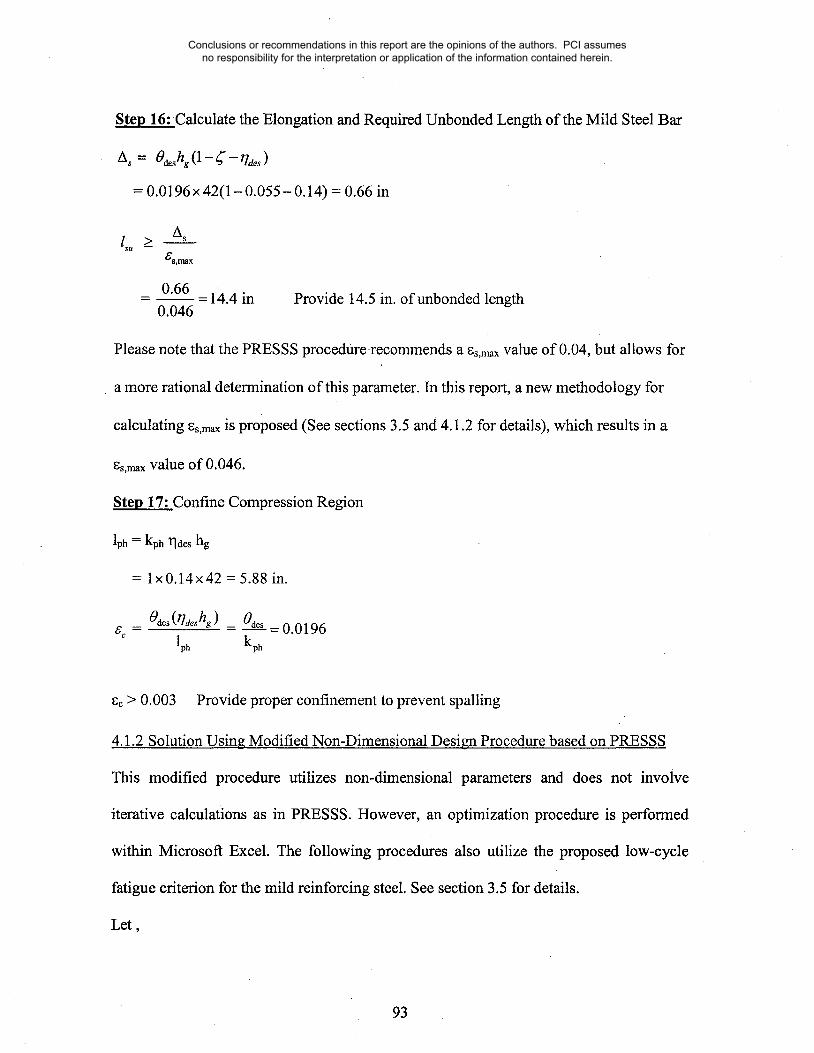
Step 16: Calculate the Elongation and Required Unbonded Length of the Mild Steel Bar
As = 0,~hg(1-g"-r/a~s)
= 0.0196 x 42(1 - 0.055 - 0.14) = 0.66 in
0.66- - 14.4 in0.046
Provide 14.5 in. of unbonded length
Please note that the PRESSS procedure recommends a es,m~x value of 0.04, but allows for
a more rational determination of this parameter. In this report, a new methodology for
calculating ~s,max is proposed (See sections 3.5 and 4.1.2 for details), which results in a
es,m~x value of 0.046.
Step 17: Confine Compression Region
lph = kph 1Ides hg
= lx0.14x42 = 5.88 in.
~c- tgdes(r/’~eshg) - odes =0.0196lph kph
0.003 Provide proper confinement to prevent spalling
4.1.2 Solution Using Modified Non-Dimensional Design Procedure based on PRESSS
This modified procedure utilizes non-dimensional parameters and does not involve
iterative calculations as in PRESSS. However, an optimization procedure is performed
within Microsoft Excel. The following procedures also utilize the proposed low-cycle
fatigue criterion for the.mild reinforcing steel. See section 3.5 for details.
Let,
93
Conclusions or recommendations in this report are the opinions of the authors. PCI assumes no responsibility for the interpretation or application of the information contained herein.
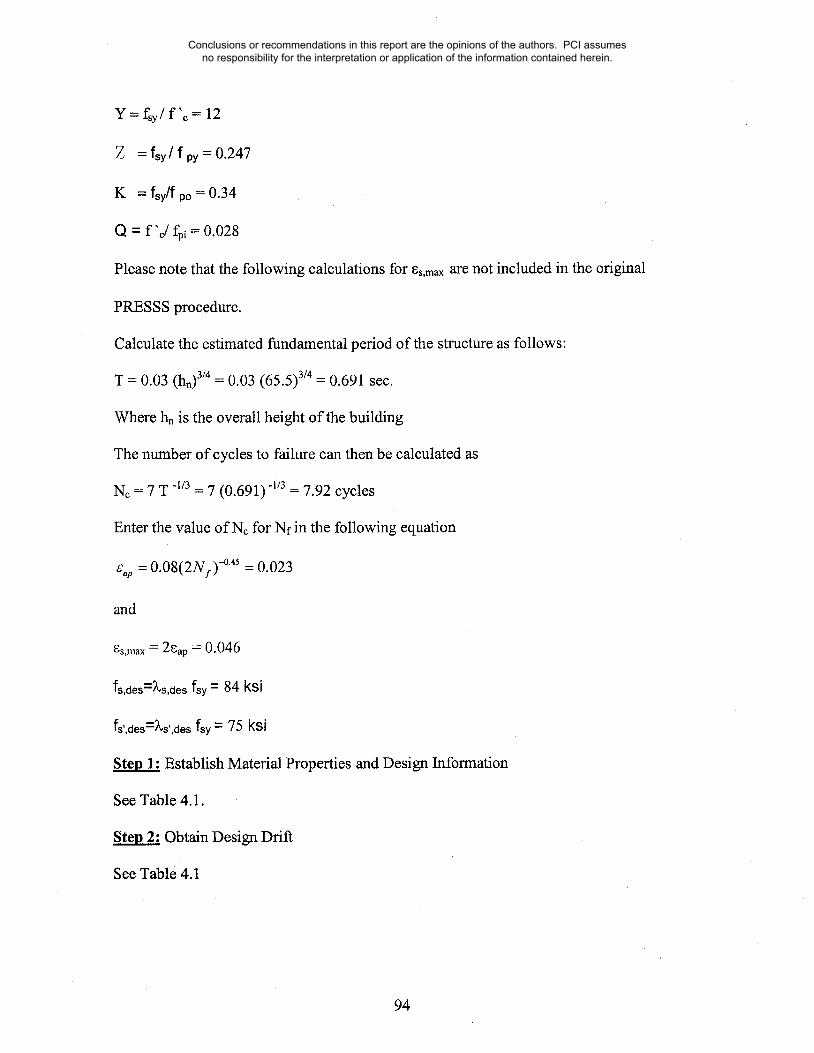
Y = fsy/f "e = 12
Z = Isy/I py = 0.247
K = fsy/f po = 0.34
O = f’c/fpi = 0.028
Please note that the following calculations for ~s,max are not included in the original
PRESSS procedure.
Calculate the estimated fundamental period of the structure as follows:
T = 0.03 (hn)3/4 = 0.03 (65.5)3/4 = 0.691 sec.
Where hn is the overall height of the building
The number of cycles to failure can then be calculated as
Nc = 7 T -1/3 = 7 (0.691)-i/3 = 7.92 cycles
Enter the value of Nc for Nf in the following equation
~,~, = 0.08(2N~.)-°’45 = 0.023
and
~s,max = 2~av = 0.046
fs,des=~,s,des fsy = 84 ksi
fs’,des=Xs’,des fsy = 75 ksi
Steo 1." Establish Material Properties and Design Information
See Table 4.1.
Steo 2.’ Obtain Design Drift
See Table 4.1
94
Conclusions or recommendations in this report are the opinions of the authors. PCI assumes no responsibility for the interpretation or application of the information contained herein.
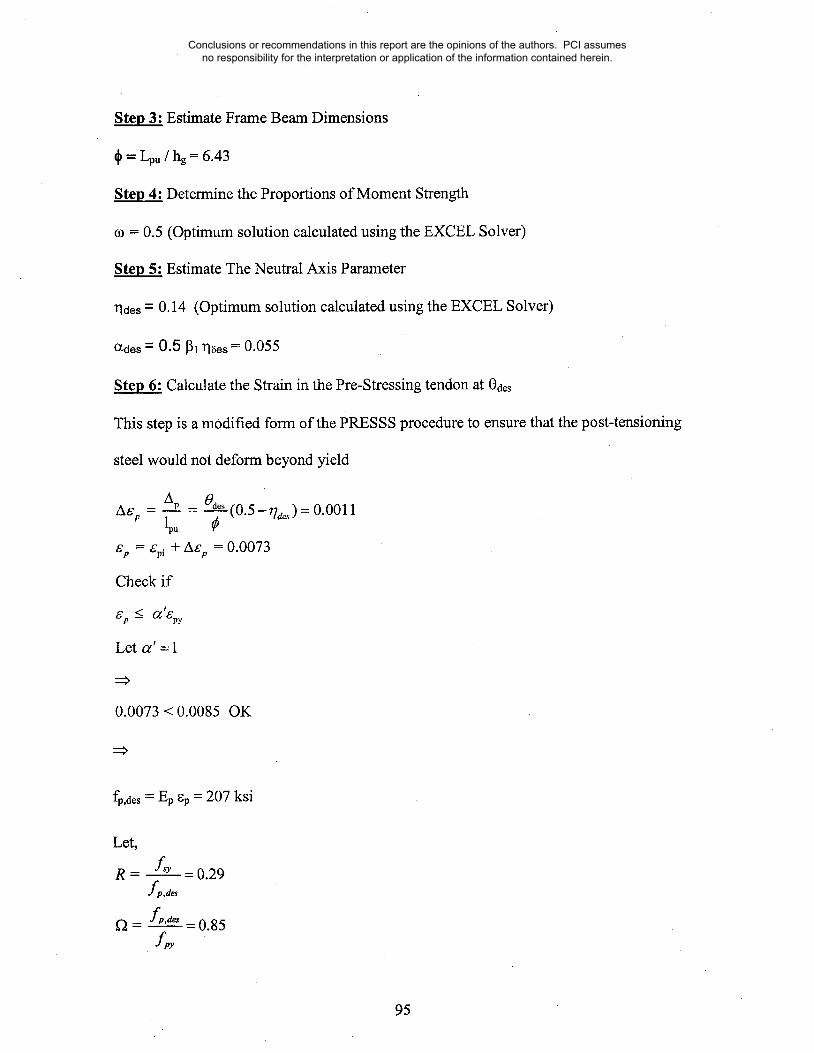
~ Estimate Frame Beam Dimensions
~ = Lpu/hg = 6.43
Ste~ 4: Determine the Proportions of Moment Strength
~o = 0.5 (Optimum solution calculated using the EXCEL Solver)
~ Estimate The Neutral Axis Parameter
rides = 0.14 (Optimum solution calculated using the EXCEL Solver)
~des = 0.5 ~11]Ses = 0.055
Ste~ 6: Calculate the Strain in the Pre-Stressing tendon at Odes
This step is a modified form of the PRESSS procedure to ensure that the post-tensioning
steel would not deform beyond yieldAp _ 0d~ (0"5--r/d~) = 0.0011
~p = ~pi + A~ = 0.0073
Check if
Let ~z’ =t
0.0073 < 0.0085 OK
fp,des = Ep 8p = 207 ksi
Let,
R- Lyf p,des
= 0.29
=.0.85
95
Conclusions or recommendations in this report are the opinions of the authors. PCI assumes no responsibility for the interpretation or application of the information contained herein.

Ste~ 7: Calculate the Relative Locations of the Compression Force and the Neutral Axis
Let,
Apy - = 0.21% (Optimum Solution)
bghg
1.96- - 22.2 in(bg)°ptimum0.0021x42
bg = 22.5 in. is OK ~
Check if
0.45 Q = 1.41%, OK (ACI 318-02 Provisions)
and
_ 2" N + --()t~,de~ = 0.14~L~0.85fll r
Mdes
Aphgfp.d~
~Ap =
and
_ 0.5(1- fllr/a~) = 0.87
1235x12 I= 1.96 in21
0.87 x 42 x 207
M~ = (1--g"--0"5fllr/d~)=1.83Ashg,%s.aes f~y 1 -c0
1235x12A~ = =12.3 in~l
1.83×42xl.4×60
96
Conclusions or recommendations in this report are the opinions of the authors. PCI assumes no responsibility for the interpretation or application of the information contained herein.
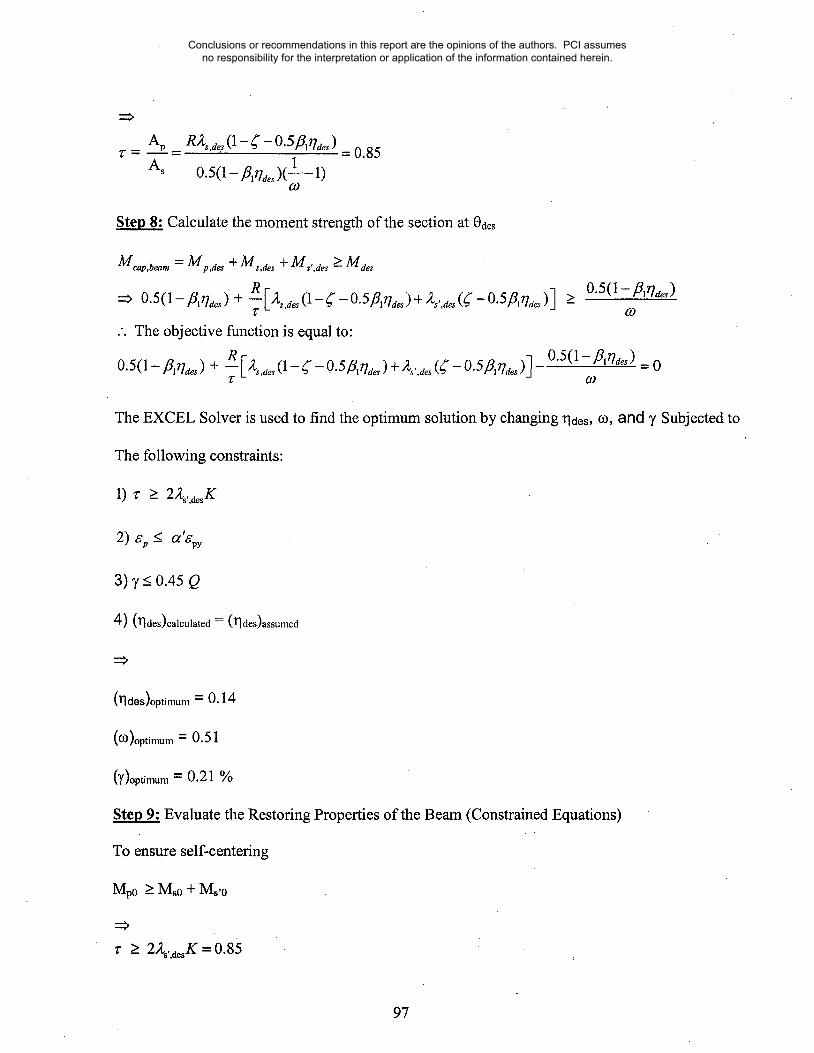
Ap RZ~ ,~= (1 - ~" - 0.5~6~r/,~)v = -- = = 0.85
A~ 0.5(1 _ tilt/des)(!_ 1)
Steo 8: Calculate the moment strength of the section at Odes
M ~,,~,,, = M ~,,a~ + M s,,~ + M ,,,ae~ >Mae.,
R ~ 0.5(1-/~lV~,)
.’. The objective Nnction is equal to:
O.50- ~ ~ + ~ [~s,~ (I- £ - 0.S~) + &,~ (~- 0.~~- 0.S(1- ~l~ =0
The EXCEL Solver is used to find the optimum solmion by ch~ging ~a~s, m, an6 ~ Subjected to
The following constraints:
1) z- > 2A~,,a~K
2) a’. <. atoC’py
3) V < 0.45 Q
4) (Tides)calculated ---- (]]des)assumed
(]]des)optimum - 0.14
(O))optimum = 0.51
(~)optimum -- 0.21%
Steo 9." Evaluate the Restoring Properties of the Beam (Constrained Equations)
To ensure self-centering
Mp0 -> M~0 + M~,0
r > 2&,,a=K=0.85
97
Conclusions or recommendations in this report are the opinions of the authors. PCI assumes no responsibility for the interpretation or application of the information contained herein.

Step 10: Calculate the required unbonded length of the deformed reinforcement
Let,
~’.,o = Q~x = 0.046
ct~=tan-ltOa~ )=0.403rad.
1
~-~-+ +(02aes + e ~,~ -1=0.0458and
2 2 ~
L~ = 0.8 l(f~ - f,),) _ 1.51
Thus, the total strain is:
£axial q" ~b,max ~ ~s,max
e~. = es,m,x - e~,r~
~,u = 0.046- 0.00283 = 0.043
98
Conclusions or recommendations in this report are the opinions of the authors. PCI assumes no responsibility for the interpretation or application of the information contained herein.

L,__c, > (1- r/a~ -(’)Oae~ = 0.365h O°atl
For h = 42 in.
L,t > 42× 0.365 = 15.33 in
Lsu = Lut - 2L,,,
= 15.33 - 2(1.51)= 12.31 in.
Provide Lsu = ~
Step 11: Confine Compression Region
lph = kph Tlaes hg
= lxO.14x42 = 5.88 in.
0.003 Provide proper confinement to prevent spalling
4.1.3 Solution Using Proposed Design Charts
1. Go to Figure 3.14 and Determine:
fp,des / fpy = 0.87
~ fp,des = 0.87 x 243 = 211.41 ksi
2. Go to Figure 3.4 and Determine:
M des
Aphgf p,aes- 0.885
1235x12 = .~~ Ap = 0.885 x 42 x 211.41
3. Go to Figure 3.6 and Determine:
99
Conclusions or recommendations in this report are the opinions of the authors. PCI assumes no responsibility for the interpretation or application of the information contained herein.

1.79
As = 1235x12 =[2.35 in2J1.79x42xl.4x60
4.1.4 Solve Using Design Equations
1. Calculate Tides
2. Calculate ASp
3. Check if ep < ~x’ ~py
4. Calculate fp,aes
5. For d~ = Lpu/hg ~< 8
r/d~, = -0.2fll +0.3
=-0.2(0.8)+0.3 = 0.14
Ap _ ~s (0.5_qaes) = 0.0011Agp- lpu ~
ep = gpi + A~p = 0.0073
Check if
~p ~
Let a’ = 1
0.0073 < 0.0085 OK
~p,des ---- Ep % --- 207 ksi
M~o~ = 1.125~00.04~s,max0’0371Aphgfp,des
rPo.o~ = (--6.70des + 0.9)~(z70~+°°3)
= (--6.7 X 0.0196 + 0.9) X 6.43(2’v×°’°~96÷°’°3) = 0.897
100
Conclusions or recommendations in this report are the opinions of the authors. PCI assumes no responsibility for the interpretation or application of the information contained herein.

M des= El. 125 x 0.046°’°3711 x 0.897 = 0.897
Aphg fp,~t~s
1235x12=> Ap - 0.897 x 42 x 207
6. For d~ = Lpuih< 8
Mdes -0.034= 0.882nro.o4e~,~x
aro.o4 = (22.230a~ + 1.7)~-(3"4640~+0’0216)
= (22.23 × 0.0196 + 1.7) x 6.43-(3’464×0’0196+0"0216) = 1.8
Mdes = E0.882 x 0.046-°’°341 x 1:8 = 1.76A~2~,a~h~ fp,a~
~As =1235x12 = 2.38 in2
1.76 x 42 x 1.4 x 60
The results of the four methods are compared in Table 4.2 below
101
Conclusions or recommendations in this report are the opinions of the authors. PCI assumes no responsibility for the interpretation or application of the information contained herein.
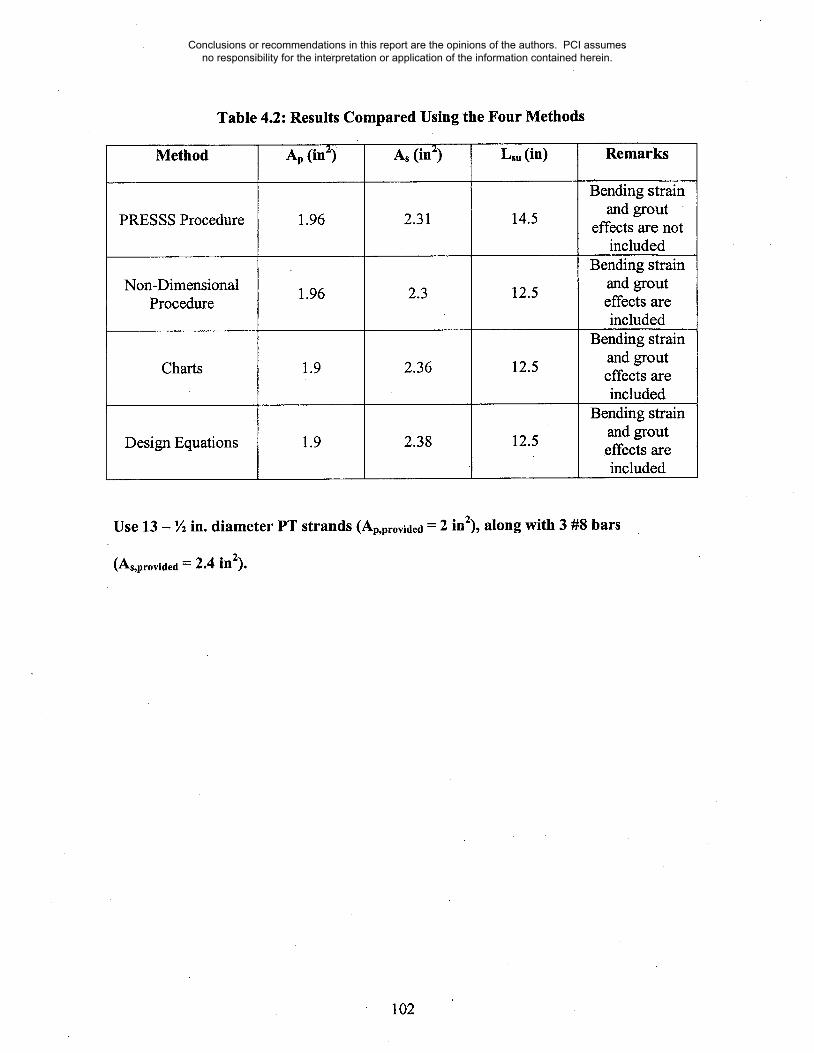
Table 4.2: Results Compared Using the Four Methods
Method
PRESSS Procedure
Non-DimensionalProcedure
Charts
Design Equations
Ap (in2)
1.96
1.96
1.9
1.9
As (in2)
2.31
2.3
2.36
2.38
L,u (in)
14.5
12.5
12.5
12.5
Remarks
Bending strainand grout
effects are notincluded
Bending strainand grouteffects areincluded
Bending strainand grouteffects areincluded
Bending strainand grouteffects areincluded
Use 13 - ½ in. diameter PT strands (Ap,provided = 2 in2), along with 3 #8 bars
(As, provided = 2.4 in2).
102
Conclusions or recommendations in this report are the opinions of the authors. PCI assumes no responsibility for the interpretation or application of the information contained herein.

4.2 Example # 2:
Reference: S.K. Ghosh and David A. Fanella, Seismic and Wind Design of Concrete
Buildings based on 2000 IBC, ASCE 7-98, and ACI 318-99 code, 2003
Seismic Data:
¯ Location: Atlanta, GA (zip code 30350)
¯ Seismic Design Category (SDC): B
¯ SiteClassC
¯ 3-Story School Building
¯ 5 equal bays (span length = 30 ft)
¯ hg = 18.5 in.,.bg = 54 in.
¯ Moment-Resisting Frame System (Hybrid Frame)
This example is solved using the original PRESSS calculation, the modified non-
dimensional procedures, the developed non-dimensional charts, and the proposed
simplified equations. Table 4.3 below shows the material properties and information that
are used in the four different design procedures. The results are compared in Table 4.4.
103
Conclusions or recommendations in this report are the opinions of the authors. PCI assumes no responsibility for the interpretation or application of the information contained herein.
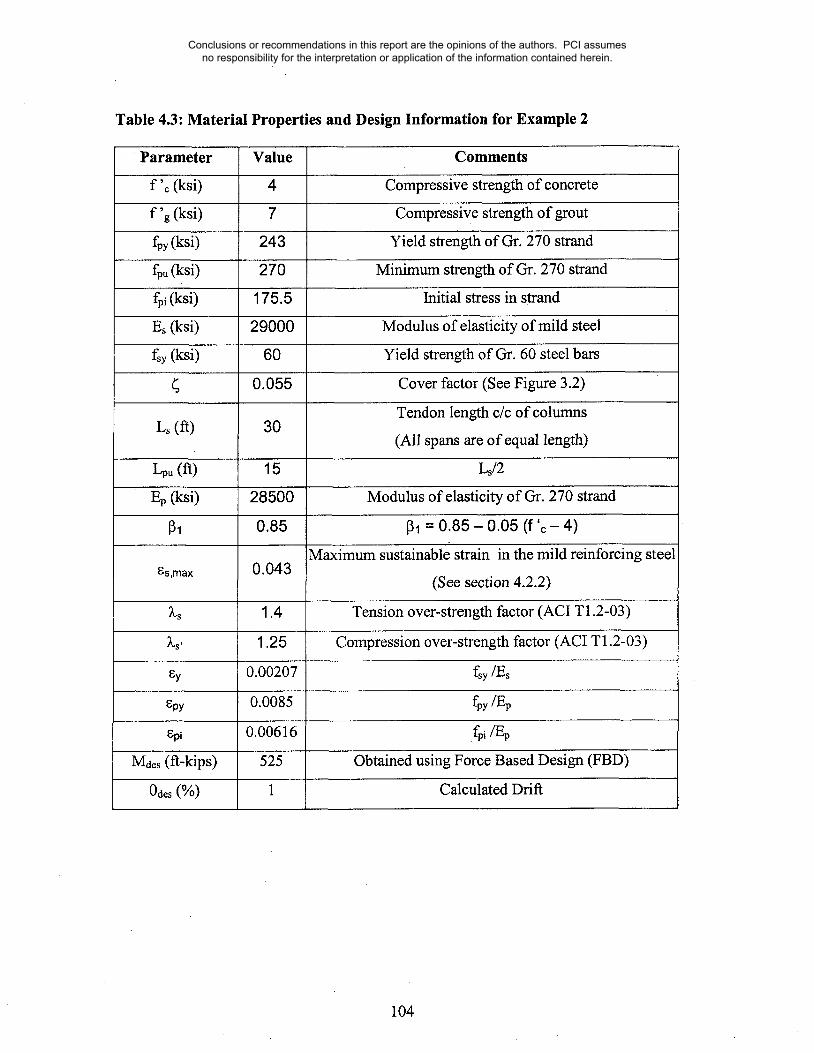
Table 4.3: Material Properties and Design Information for Example 2
Parameter
f ’¢ (ksi)
f ’~ (ksi)
fpy (ksi)
f, (ksi)f,i (ksi)~ (ksi)f~y (ksi)
L~ (if)
~s,max
~,,s’
~y
Spy
Epi
M,~¢s (ft-kips)
O~os (%)
Value
4
7
243
270
175.5
29000
60
0.055
30
15
28500
0.85
0.043
1.4
1.25
0.00207
0.0085
0.00616
525
Comments
Compressive strength of concrete
Compressive strength of grout
Yield strength of Gr. 270 strand
Minimum strength of Gr. 270 strand
Initial stress in strand
Modulus of elasticity of mild steel
Yield strength of Gr. 60 steel bars
Cover factor (See Figure 3.2)
Tendon length c/c of columns
(All spans are of equal length)
Ls/2Modulus of elasticity of Gr. 270 strand
131 = 0.85 - 0.05 (f ’e - 4)
Maximum sustainable strain in the mild reinforcing steel
(See section 4.2.2)
Tension over-strength factor (ACI T1.2-03)
Compression over-strength factor (ACI T1.2-03)
fsy/Es
fpy
Obtained using Force Based Design (FBD)
Calculated Drift
104
Conclusions or recommendations in this report are the opinions of the authors. PCI assumes no responsibility for the interpretation or application of the information contained herein.
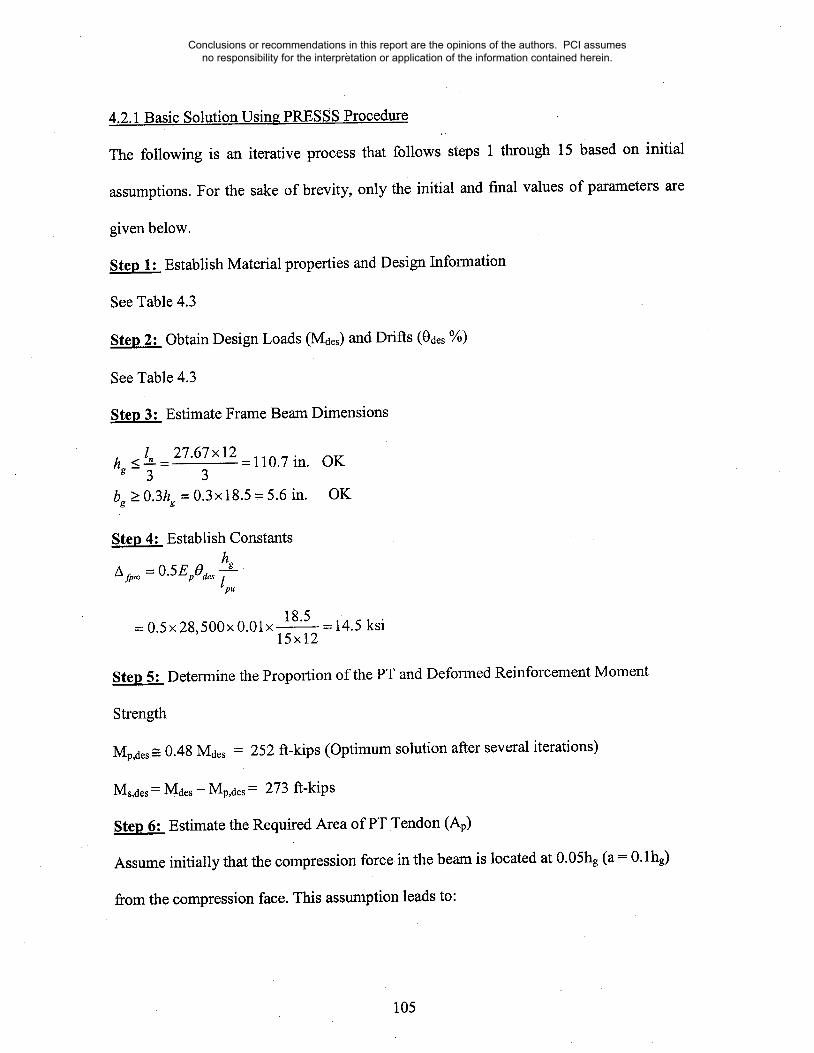
4.2.1 Basic Solution Using PRESSS Procedure
The following is an iterative process that follows steps 1 through 15 based on initial
assumptions. For the sake of brevity, only the initial and final values of parameters are
given below.
Step 1: Establish Material properties and Design Information
See Table 4.3
Step 2:. Obtain Design Loads (Mdes) and Drifts (Odes %)
See Table 4.3
Step Estimate Frame Beam Dimensions3."
hg <--=l" 27.67x12 -110.7 in. OK3 3
bg >0.3hg =0.3x18.5=5.6 in. OK
Step 4: Establish Constants
= o.5E O
18.5- 14.5 ksi= 0.5 x 28,500x 0.01x
15x12
Step 5: Determine the Proportion of the PT and Deformed Reinforcement Moment
Strength
Mp,des a 0.48 Mdes = 252 ft-kips (Optimum solution after several iterations)
Ms,des = Mdes - Mp,des = 273 ft-kips
Step 6: Estimate the Required Area of PT Tendon (Ap)
Assume initially that the compression force in the beam is located at 0.05hg (a = 0. lhg)
from the Compression face. This assumption leads to:
105
Conclusions or recommendations in this report are the opinions of the authors. PCI assumes no responsibility for the interpretation or application of the information contained herein.
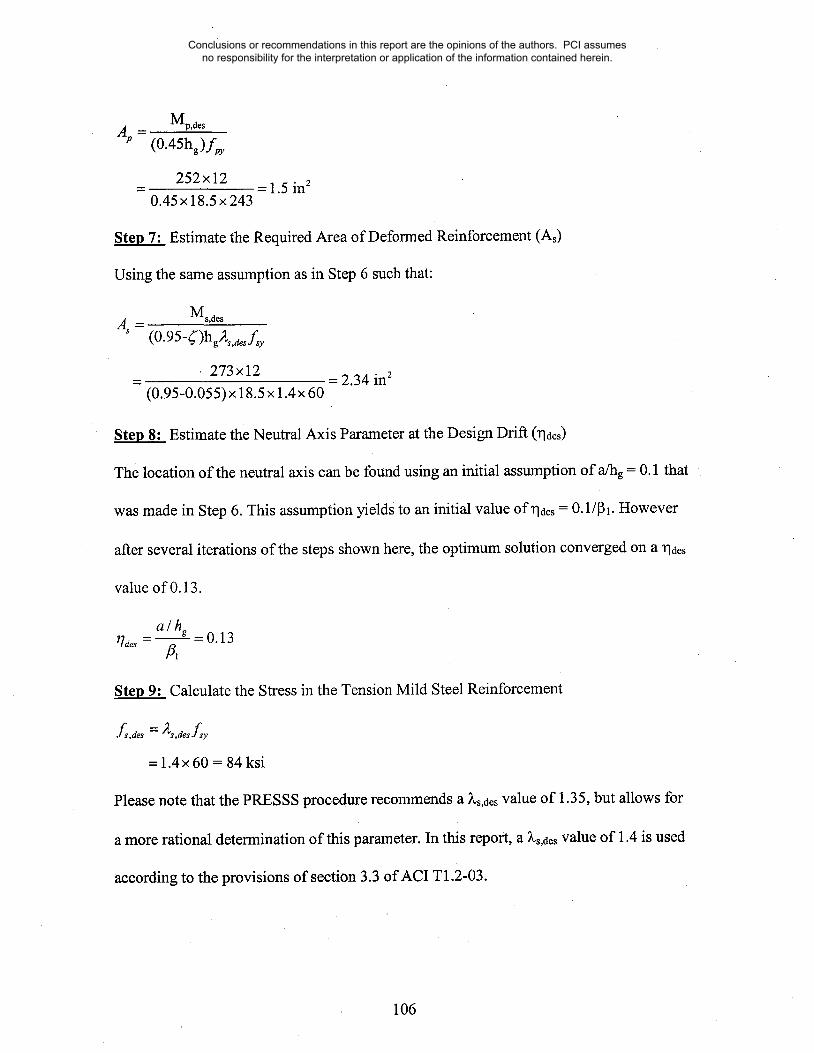
(0.45hg)fpy
252 x 12 - 1.5 in20.45 x 18.5 x 243
Step 7: Estimate the Required Area of Deformed.Reinforcement (As)
Using the same assumption as in Step 6 such that:
Ms,des
(0.95-£)hg~s,a~f~y
273x12(0.95-0.055) x 18.5 x 1.4 x 60
- 2.34 in2
Step 8: Estimate the Neutral Axis Parameter at the Design Drift (Tides)
The location of the neutral axis can be found using an initial assumption of a/hg = 0.1 that
was made in Step 6. This assumption yields to an initial value Ofrldes = 0.1/~1. However
after several iterations of the steps shown here, the optimum solution converged on a rldes
value of 0.13.
a/hg~]des = -- = O. 13
Step 9: Calculate the Stress in the Tension Mild Steel Reinforcement
= 1.4 x 60 = 84 ksi
Please note that the PRESSS procedure recommends a )~s,des value of 1.35, but allows for
a more rational determination of this parameter. In this report, a )~s,aes value of 1.4 is used
according to the provisions of section 3.3 of ACI T1.2-03.
106
Conclusions or recommendations in this report are the opinions of the authors. PCI assumes no responsibility for the interpretation or application of the information contained herein.

Step 10: Calculate the Stress in the Compression Mild Steel Reinforcement
fs’.ae, =
= 1.25 x 60 = 75 ksi
Please note that the PRESSS procedure recommends a ~s’,des value of 1, but allows for a
more rational determination of this parameter. In this report, a £s’,des value of 1.25 is used
according to the provisions of section 3.3 of ACI T1.2-03.
Step 11: Calculate the Stress and Elongation in the Pre-Stressing Tendon at Odes
= 0de hg(0.5-
= 0.01x 18.5x (0.5 -0.13) = 0.068 in
As 0.068 x 28Afp = --Ep = 500 = 10.84 ksi
lpu 15×12 ’
fpo= 243 - 10.84 = 232.16 ksi
if fpo >- fpi =0.65×270=175.5 ksi
thenfpo = f~,i = 175.5 ksi
f p.a~, = f ,o + Af p
= 175.5 + 10.84 = 186 ksi
elSe f p,des = f py
Mp,desAp = 0.5(1- f
252x120.5(1-0.85 x 0.13) x 18.5 x 186
And
= 2.04 in~
107
Conclusions or recommendations in this report are the opinions of the authors. PCI assumes no responsibility for the interpretation or application of the information contained herein.

273x12
(1-0.055 - 0.5 x 0.85 x O.13)x 18.5 x 1.4x 60= 2.37 in2
Step 12: Calculate the Forces at Odes
= 2.04x 186 = 379.4 kips
F~,gm = As2,,amf~y
= 2.37×1.4×60 = 199 kips
F,,ae~ = As 2s,,ge, f ~,,
= 2.33× 1.25 x 60 = 177.8 kips
= 379.4 +199 - 177.8 = 400.6 kips
Step 13: Calculate the Locations of the Compression Force ~d the Neutral ~is
400.6= 2.18 in.
a des 0.85/’79 0.85 x 4 x 54
agm 2.18ages - - 0.059
2hg 2x18.5
_ ages 2.18 = 0.138 (Optimum value is 0.13, OK.)r/am - fl~g = 0.85 x 18.5
r/am = 0.13
ades ---- 0.5 X/~1 X ?]des
= 0.5X 0.85x 0.13 = 0.055
Step 14: Calculate the Moment Strength of the section at Odes
Taking moments of both the PT and deformed reinforcement forces about the centroid of
the compression force yield:
108
Conclusions or recommendations in this report are the opinions of the authors. PCI assumes no responsibility for the interpretation or application of the information contained herein.
= 379.4 x 18.5(0.5-01055)/12 = :260.3 ft-kips
= 199 x 18.5(1-0.055-0.055)/12 = 273 ft-kips
Ms,,des= 177.8x18.5(0.055-0.055)/12 = 0
Therefore the total moment strength can be determined as follows:
M cap,~,ea,n = M p,aes + M.~,a~ + M s,,a,~s
= 260.3 + 273 + 0 = 533.3 R-kips
g cap,beam >-- Maw
533.3 > 525 ft-kips, OK (Optimum Solution)
Step 15: Evaluate the Restoring Properties of the Beam
= 2.37x1.25x 60 = 177.75 kips
= 2.37xl.25× 60 = 177.75 kips
Fpo:Apfpo
= 2,04x 175.5 = 358.5 kips
Feo = Fpo - F~o - Fso
= 358.5 - 177.75 - 177.75 = 3 kips
Feoa° = 0.85f~bg
3- = 0.016 in0.85x4x54
109
Conclusions or recommendations in this report are the opinions of the authors. PCI assumes no responsibility for the interpretation or application of the information contained herein.

0.016= -- = 0.000442×18.5
a0
0.0160.85x18.5
- 0.001017
Mpo = F.ohg(0.5-ao)= 358.5 × 18.5(0.5 - 0.00044)/12 = 276.1 it-kips
Mso = F, ohg(1-~’-ao)
= 177.75 x 18.5(1 - 0.055 - 0.00044)/12 = 258.5 ft-kips
M ,,o = F,’oh(( - ao)
= 177.75 x 18.5(0.055-0.00044)/12 = 14.9 ft-kips
To ensure self-centering
Mpo > Mso + Ms’o
276.1 > 258.8 + 14.9 = 273.7 ft-kips, OK
Step 16: Calculate the Elongation and Required Unbonded Length of the Mild Steel Bar
As = Odeshg(1-~-rlae,)
= 0.01x18.5(1- 0.055- 0.13) -- 0.15 in
0.15- -3.5 in0.043
Provide 3.5 in. of unbonded length
Please note that the PRESSS procedure recommends a es,max value of 0.04, but allows for
a more rational determination of this parameter. In this report, a new methodology for
110
Conclusions or recommendations in this report are the opinions of the authors. PCI assumes no responsibility for the interpretation or application of the information contained herein.

calculating [is,m,x is proposed (See sections 3.5 and 4.2.2 for details), which results in a
~s,max value of 0.043.
Step 17: Confine Compression Region
-- lxO.13x18.5 =2.4in.
O’~es(rla~shb) 0°es 0.01lph kph
[ic > 0.003 Provide proper confinement to prevent spalling
4.2.2 Solution Using Modified Non-Dimensional Design Procedure based on PRESSS
This modified procedure utilizes non-dimensional parameters and does not involve
iterative calculations as in PRESSS. However, an optimization procedure is performed
within Microsoft Excel. The following procedures also utilize the proposed low-cycle
fatigue criterion for the mild reinforcing steel. See section 3.5 for details.
Let,
Y = fsy/f ’o = 15
Z = fsy I f py = 0.247
K = fsylf po = 0.34
Q = f’¢/fpi = 0.0228
Please note that the following calculations for [is,max, ~.s,des, and Ls’,des are not included
in the original PRESSS procedure.
Calculate the estimated fundamental period of the structure as follows:
T = 0.03 (hn)3/4 = 0.03 (39)3/4 = 0.47 sec.
111
Conclusions or recommendations in this report are the opinions of the authors. PCI assumes no responsibility for the interpretation or application of the information contained herein.

Where hn is the overall height of the building
The number of cycles to failure can then be calculated as
Nc = 7 T -1/3 = 7 (0.47)-1/3 = 9 cycles
Enter the value of No for Nf in the following equation
~’ap = 0.08(2Nf )-o.4s = 0.0215
and
es,m.x = 2e~ = 0.043
fs,des=~,s,des, fsy = 84 ksi
fs’,~es=Xs’,aes, fsy = 75 ksi
~ Establish Material Properties and Design Information
See Table 4.3
~ Obtain Design Drift
See Table 4.3
Ste~ 3: Estimate Frame Beam Dimensions
~ = Lpu/hg = 9.73
~ Determine the Proportions of Moment Strength
co = 0.48 (Optimum solution calculated using the EXCEL Solver)
Ste~ 5: Estimate The Neutral Axis Parameter
~laes = 0.13 (Optimum solution calculated using the EXCEL Solver)
ades -- 0.5 ~]Tl~es = 0.055
Ste~ 6: Calculate the Strain in the Pre-Stressing tendon at 0aes
This step is a modified form of the PRESSS procedure to ensure that the post,tensioning
112
Conclusions or recommendations in this report are the opinions of the authors. PCI assumes no responsibility for the interpretation or application of the information contained herein.

steel would not deform beyond yield.Ap _ 0aes (0.5 -r/a~) = 0.00038
A~p- lpu~
~p = epi + A~p = 0.0065
Check if
°°p~ ~py
Let a’ = 1
0.0065 < 0.0085 OK
fp,des = Ep Ep = 186 ksi
Let,
R- f~Y -0.32f p,des
Ste~ 7: Calculate the Relative Locations of the Compression Force and the Neutral Axis
Let,
Ap7 - - 0.19% (Optimum Solution)
bghg
2.04 ¯(b)0ptimum : = 58 in
0.0019x18.5
Check if
113
Conclusions or recommendations in this report are the opinions of the authors. PCI assumes no responsibility for the interpretation or application of the information contained herein.

0.45 Q = 1.79%, OK (ACI 318-02 Provisions)
andqa~ - O.~5,B1 N + -~(A~,a=-~’,a=) =0.13
Mdes - 0"5(1-fllr/ae*) - 0.91Aphgfp,aes co
525x12 12.01 in21"0.93 x18.5 x186
and
Md~ = (1-~’--0"5fl:/des) = 1.73Ashg ~,s,aesf sy 1-co
As =525x12
-12.34 in:]1.73x18.5xl.4x60
Ap R/~, a~ (1- £ - O.5 flfla~ ) = O.85
As 0.5(1 _ fl, r/a~s 1( 1-- - 1)
Ste~ 8: Calculate the moment strength of the section at Odes
Mcap,beam = Mp,aes + M,,~, + M,,,ae~ > Mdes
The objective ~nction is equal to:
> 0.5(1-
0.5(1 - fl~ r/a~, ) _- 0
The EXCEL Solver is used to find the optimum solution by changing ~ldes, 0), and ~, Subjected to
114
Conclusions or recommendations in this report are the opinions of the authors. PCI assumes no responsibility for the interpretation or application of the information contained herein.

the following constraint:
1) r >_ 2~s,,desK
2) O°p ~
3) 3’ -< 0.45 Q
4) (~des)calculated = (~des)assumed
(flOes)optimum = 0.13
(0))optimum ---- 0.48
(3’)optimum = 0.19 %
Ste~ 9." Evaluate Restoring Properties of the Beam (Constrained Equations)
To ensure self-centering
Mp0 > Mso + Ms,0
22.s,,desK = 0.85
Step 10: Calculate the required unbonded length of the deformed reinforcement
Let,
~.,. = ~s,n~x = 0.043
O:" = tan-~ = 0.228 rad.
115
Conclusions or recommendations in this report are the opinions of the authors. PCI assumes no responsibility for the interpretation or application of the information contained herein.
and
3 2 + 2 )~sin(((9 ~, ~ o,~+~z’) -Odes (h~)=O.O059
L~ _ 0.81(Z~-~) =1
db (f~)l.5
Thus, the total strain is:
¯ ~at~ = ~,~ax --~a,max
~.¢~ = 0.043 -- 0:0059 = 0.0371
1.,,,1>_ (1-- rldes --¢)Od~ =0.22
Forhg = 18.5 in.
Lut >_ 18.5x 0.22 = 4.1 in
Lsu = L~ - 2L~
=4.1- 2(1)=2.1 in.
Provide L,~ = ~
Step 11: Confine Compression Region
lph = kph lqdes hg
116
Conclusions or recommendations in this report are the opinions of the authors. PCI assumes no responsibility for the interpretation or application of the information contained herein.

= 1×0.13×18.5 =2.4in.
0.003 Provide proper confinement to prevent spalling
4.2.3 Solution Using Proposed Design Charts
1. Go to Figure 3.14 and Determine:
fp,des / fpy = 0.77
~ fp,des = 0.77 x 243 = 187.11 ksi
2. Go to Figure 3.4 and Determine:
525x12= 11.96 in2]~Ap = 0.93x18.5x187.11
3. Go to Figure 3.6 and Determine:
Mdes= 1.71
Ashg’~s des L)
525x12 IAs = - 2.37 in21
1.71x18.5xl.4x 60
4.2.4 Solve Using Design Equations
1. Calculate Tides
r/d~ = --0.2fl~ +0.3= --0.2(0.88)+0.3 = 0.13.
2. Calculate Asp
117
Conclusions or recommendations in this report are the opinions of the authors. PCI assumes no responsibility for the interpretation or application of the information contained herein.
Ap _ Odes
A~’p- 1~ ~ (0"5-r/a~) -- 0"00038
3. Check if ep < c~’ ~py
~p = epi + A~p = 0.0065
Check if
~p ~ a ~’py
Let g’ = 1
0.0065 < 0.0085 OK
4. Calculate fp,des
fp,des = Ep. I~p = 186 ksi
5. For d~ = L~uih -> 8
Mdes = 1.1 25~Oo.o4gs,r~x°’°371Aphgfp,aes
M~es 0.94)~(L90~ +0.0042)~00.04 -- = (-5.8 10an +Aphg fp,cles
(/90.04 ~ (-5.81 × 0.01 + 0.94) x 9.73(t"9×°"°1+°"°°42) = 0.93
M,a~s _ [1.125 x 0.043°’°37’ I x 0.93 = 0.93~ Aphg fp,aes
525x1211,97 in2]~Ap - 0.93x18.5x186 =
6. For d~ = Lpu/h > 8
= O. 8 82~70.04~.s,max_O.034
118
Conclusions or recommendations in this report are the opinions of the authors. PCI assumes no responsibility for the interpretation or application of the information contained herein.

nro.o4 = Md~ = (13.650ae, + 1.65)~-(L970"~÷°’°°13)
~ro.o4 = (13.65 x 0.01 + 1.65) x 9.73"0’97×°’°1÷°’°°a3) = 1.7
= I0.882 x 0.043-°’°341 x 1.7 = 1.67
~ As_ 525x12 _ 12.42 in~l1.67x18.5xl.4x60
The results of the four methods are compared in Table 4.4 below
Table 4.4: Results Compared Using the Four Methods
Method
PRESSS Procedure
Non-DimensionalProcedure
Ap (inz)
2.04
2.01
As (inz)
2.37
2.34
(in.)
3.5
2.5
Charts
Design Equations
1.96
1.97
2.37
2.42
2.5
2.5
Remarks
Bending strainand grout
effects are notincluded
Bending strainand grouteffects areincluded
Bending strainand grouteffects areincluded
Bending strainand grouteffects areincluded
Use 14 - ½ in. diameter PT strands (Ap,provided = 2.14 in2), along with 4 #8 bars
(As,provided = 3.12 in2).
119
Conclusions or recommendations in this report are the opinions of the authors. PCI assumes no responsibility for the interpretation or application of the information contained herein.

4.3 Example # 3:
Reference: S.K. Ghosh and David A. Fanella, Seismic and Wind Design of Concrete
Buildings based on 2000 IBC, ASCE 7-98, and ACI 318-99 code, 2003.
Seismic Data:
. Location: San Francisco, CA (zip code 94105)
¯ Seismic Design Category (SDC): D
¯ Site Class D
¯ 12-Story School Buildings
¯ 7 equal bays (span length = 26 r)
¯ hg = 26 in., bg = 28 in.
¯ Moment-Resisting Frame System (Hybrid Frame)
This example is solved using the original PRESSS calculation, the modified non-
dimensional procedures, the developed non-dimensional charts, and the proposed
simplified equations. Table 4.5 below shows the material properties and information that
are used in the four different design procedures. The results are compared in Table 4.6.
120
Conclusions or recommendations in this report are the opinions of the authors. PCI assumes no responsibility for the interpretation or application of the information contained herein.

Table 4.5: Material Properties and Design Information for Example 3
Parameter Value Comments
f ’c (ksi) 6 Compressive strength of concrete
f ’g (ksi) 8 Compressive strength of grout
fpy (ksi) 243 Yield strength of Gr. 270 strand
fpu (ksi) 270 Minimum strength of Gr. 270 strand
fpi (ksi) 175.5 Initial stress .in strand
Es (ksi) 29000 Modulus of elasticity of mild steel
fsy (ksi) 60 Yield strength of Gr. 60 steel bars
~ 0.055 Cover factor (See Figure 3.2)
Tendon length c/c of columnsL, (~) 26
(All spans are of equal length)
Lpu ( ft) 13 L~/2
Ep (ksi) 28500 Modulus of elasticity of Gr. 270 strand
~1 0.75 ~1 = 0.85 - 0.05 (f ’c - 4)
Maximum sustainable strain in the mild reinforcing steelI~s,max
0.05(See section 4.3.2)
L, 1.4 Tension over-strength factor (ACI T1.2-03)
L~, 1.25 Compression over-strength factor (ACI T1.2-03)
ey 0.00207 fsy iEs
Spy 0.0085 fpy/Ep
~pi 0.00616 fpi/Ep
Maes (ft-kips) 737 Obtained using Force Based Design (FBD)
Odes (%) 1.65 Calculated Drift
121
Conclusions or recommendations in this report are the opinions of the authors. PCI assumes no responsibility for the interpretation or application of the information contained herein.

4.3.1 Basic Solution Using PRESSS Procedure
The following is an iterative process that follows steps 1 through 15 based on initial
assumptions. For the sake of brevity, only the initial and final values of parameters are
given below.
Step 1: Establish Material properties and Design Information
See Table 4.5
Step 2:. Obtain Design Loads (Mdes) and Drifts (Odes %)
See Table 4.5
Step 3: Estimate Frame Beam Dimensions
hg <ln= 23.67X12_95 in. OK3 3bg > 0.3hg = 0.3 x 26 = 7.8 in. OK
Step 4: Establisti Constants
h
= 0.5x 28,500x 0.0165 x26 - 39.19 ksi13x12
Step 5: Determine the Proportion of the PT and Deformed Reinforcement Moment
Strength
Mp,des = 0.51 Mdes = 375.9 R-kips (Optimum solution alter several iterations).
Ms,des = Mdes -- Mp,des = 361.1 It-kips
122
Conclusions or recommendations in this report are the opinions of the authors. PCI assumes no responsibility for the interpretation or application of the information contained herein.

Step 6: Estimate the Required Area of PT Tendon (Ap)
Assume initially that the compression force in the beam is located at 0.05hg (a = 0. lhg)
from the compression face. This assumption leads to:
A _ Mp,des
P (0.45hg)fpy
375.0×12 = 1.59 in20.45× 26x 243
Step 7: Estimate the Required Area of Deformed Reinforcement (As)
Using the same assumption as in Step 6 such that:
Ms,des
(0.95361.1x12 = 2.22 in2
(0.95-0.055) x 26 x 1.4 x 60
Step 8: Estimate the Neutral Axis Parameter at the Design Drift (rlaes)
The location of the neutral axis can be found using an initial assumption of a/h = 0.1 that
was made in Step 6. This assumption yields to an initial value of ~ldes = 0.1/~1. However
after several iterations of the steps shown here, the optimum solution converged on a
value of 0.15.
a/hg _ 0.15
Step 9: Calculate the Stress in the Tension Mild Steel Reinforcement
= 1.4 × 60 = 84 ksi
123
Conclusions or recommendations in this report are the opinions of the authors. PCI assumes no responsibility for the interpretation or application of the information contained herein.

Please note that the PRESSS procedure recommends a Ls,des value of 1.35, but allows for
a more rational determination of this parameter. In this report, a )~s,de~ value of 1.4 is used
according to the provisions of section 3.3 of ACI T1.2-03.
Step 10: Calculate the Stress in the Compression Mild Steel Reinforcement
= 1.25 x 60 = 75 ksi
Please note that the PRESSS procedure recommends a Ls’,aes value of 1, but allows for a
more rational determination of this parameter. In this report, a )~s’,des value of 1.25 is used
according to the provisions of section 3.3 of ACI T1.2-03.
Step 11: Calculate the Stress and Elongation in the Pre-Stressing Tendon at Odes
= 0.0165 x 26x (0.5-0.15) = 0.15 in
Afp =--Ep = 0.15 x28,500= 27.4ksilp, 13x12
fpo = f,y-/,f,= 243 - 27.4 = 215.6 ksi
iffpo >- fpi -- 0.65x270 =175.5 ksi
then fpo = fpi = 175,5 ksi
fp,a~ = fpo + Af,
= 175.5 + 27.4 = 202.9 ksi
else f p,aes = f ~y
124
Conclusions or recommendations in this report are the opinions of the authors. PCI assumes no responsibility for the interpretation or application of the information contained herein.

375.9x120.5(1 - 0.75 x 0.15) x 26 x 202.9
= 1.93 in2
And
As = Ms’aes
361.1x12(1-0.055-0.5 x 0.75 x 0.15) x 26 x 1.4 x 60
= 2.23 in2
Step 12: Calculate the Forces at Odes
= 1.93x 202.9 = 391.6 kips
= 2.23x 1.4x 60 = 187.32 kips
Fs,des = A,2,,,a=f~y
= 2.23x 1.25 x 60 = 167.25 kips
= 391.6 +187.32 - 167.25 = 412 kips
Steo 13: Calculate the Locations of the Compression Force and the Neutral Axis
Fc,d~ 412= = 2.89 in.0.85f~’bg 0.85 x 6 x 28
ades _ 2.89ad~~ = -- --.-- 0.056
2hg 2x26
_ a~= = 2.89 = 0.148 (Optimum value is 0.15, OK.)rl,~es - flah----7 0.75 x 26
125
Conclusions or recommendations in this report are the opinions of the authors. PCI assumes no responsibility for the interpretation or application of the information contained herein.

r/~ =0.15
ade~ = 0.5x fll × rl,~s
= 0.5 x 0.75x 0.15 = 0.056
Step 14: Calculate the Moment Strength of the section at 0d,s
Taking moments of both the PT and deformed reinforcement forces about the centroid of
the compression force yields:
= 391.6 × 26(0.5- 0.056)/12 = 376.7 ft-kips
Ms,ae, = F~,a~hg (1-~" - aden)
= 187.32 x 25(1-0.055-0.055)/12 = 350.8 fi-~ps
M ¢,d~~ = F¢,a~h , ( ~ - a a~ )
= 157.25 x 26(0.055-0.056)/12 = - 0.36 ~-~ps
Therefore the total moment stren~h can be dete~ed ~ follows:
M~,,~ = M~,ae~ + M,,a~ + M~,,a~
= 376.7 + 360.8 - 0.36 = 737.1 r-kips
M cap,bea,n >- M des
537.1 = 737 r-kips, OK (Optimum Solution)
Step 15: Evaluate the Restoring Properties of the Beam
= 2.23× 1.25 × 60 = 167.25 kips
F ,o == 2.23 × 1.25 × 60 = 167.25 kips
126
Conclusions or recommendations in this report are the opinions of the authors. PCI assumes no responsibility for the interpretation or application of the information contained herein.

Fpo = A~,f ~,o
= 1.93x175.5 = 338.7 kips
Fco=Fpo-Fso-Fs’o
= 338.7-167.25-167.25 = 4.22 kips
Fcoa° = 0.85fbg
4.22- = 0.03 in0.85x6x28
0.03- = 0.000572x26
ao
0.030.75 x 26
- 0.0015
Mpo = Fpohg (0.5 - ao)
= 338.7 x 26(0.5-0.00057)/12 = 366.5 ft-kips
M,o = Fsohg (1 - ~" - ~zo)
= 167.25 x 26(1-0.055-0.00057)/12 = 342.2 ft-kips
Ms,o = F,’ohg(~-ao)
= 167.25 × 26(0.055-0.00057)/12 = 19.72 fl-kips
To ensure self-centering
Mpo > Mso + Ms,o
366.5 > 342.2 + 19.72 = 362 ft-kips, OK
127
Conclusions or recommendations in this report are the opinions of the authors. PCI assumes no responsibility for the interpretation or application of the information contained herein.

Step 16: Calculate the Elongation and Required Unbonded Length of the Mild Steel Bar
As = Odeshg(1--~--r]des)
= 0.0165 x 26(1-0.055-0.15) = 0.34 in
AS
0.34- - 6.8 in
0.05Provide 7 in. ofunbonded length
Please note that the PRESSS procedure recommends a ~s,max value of 0.04, but allows for
a more rational determination of this parameter. In this report, a new methodology for
calculating ~s,max is proposed (See sections 3.5 and 4.3.2 for details), which results in a
. es,max value of 0.05.
Step 17: Confine Compression Region
lob = kph rides hg
= lx0.15×26 =3.9 in.
Odes (rlaeshb ) -- Odes -- 0.0165ooc --
lph kph
~o > 0.003 Provide proper confinement to prevent spalling.
4.3.2 Solution Using Modified Non-Dimensional Design Procedure based on PRESSS
This modified procedure utilizes non-dimensional parameters and does not involve
iterative calculations as in PRESSS. However, an optimization procedure is performed
within Microsoft Excel. The following procedures also utilize the proposed low-cycle
fatigue criterion for the mild reinforcing steel. See section 3.5 for details.
Let,
128
Conclusions or recommendations in this report are the opinions of the authors. PCI assumes no responsibility for the interpretation or application of the information contained herein.

Y = fsy/f’e = 10
Z = fsy / f py = 0.247
K = fsy/f po = 0.34
O = f’c/fpi = 0.034
Please note that the following calculations for es,max are not included in the original
PRESSS procedure.
Calculate the estimated fundamental period of the structure as follows:
T = 0.03 (h,03/4 = 0.03 (147.5)3/4 = 1.27 sec.
Where hn is the overall height of the building
The number of cycles to failure can then be calculated as
Nc= 7 T -1/3 = 7 (1.27)-a/3 = 6.46 cycles
Enter the value of No for Nf in the following equation
O°ap = 0.08(2Nf)-°45 = 0.025
and
es,ma~, = 2Cap = 0.05
fs,des=~,s,des fsy = 84 ksi
fs’,~es=Xs’,Oes fs~, = 75 ksi
Step 1: Establish Material Properties and Design Information
See Table 4.5
Ste~ 2: Obtain Design Drift
See Table 4.5
Ste~ 3." Estimate Frame Beam Dimensions
129
Conclusions or recommendations in this report are the opinions of the authors. PCI assumes no responsibility for the interpretation or application of the information contained herein.

= / hg = 5.57
Ste~ 4." Determine the Proportions of Moment Strength
~0 = 0.51 (Optimum solution calculated using the EXCEL Solver)
Ste~ 5." Estimate The Neutral Axis Parameter
floes = 0.15 (Optimum solution calculated using the EXCEL Solver)
~des ---- 0.5 ~l.Tl~es --- 0.055
Steo 6: Calculate the Strain in the Pre-Stressing tendon at Odes
This step is a modified form of the PRESSS procedure to ensure that the post-tensioning
steel would not deform beyond yield.
Ap _ Odes (0.5-r/de~) = 0.00105A~:p- lpu ~
ep = O~pi + Aep = 0.0072
Check if
Let a’ =1
0.0072 < 0.0085 OK
fp,des ---- Ep ~p = 205 ksi
Let,
130
Conclusions or recommendations in this report are the opinions of the authors. PCI assumes no responsibility for the interpretation or application of the information contained herein.

R - f~y - 0.29f p,des
Steo 7: Calculate the Relative Locations of the Compression Force and the Neutral Axis
Let,
Ap~" - - 0.26% (Optimum Solution)
bghg
1.91- 28.3 in(bg)optimum 0.0026 X 26
Check if
0.45 Q = 2.05 %, OK (ACI 318-02 Provisions)
= 0.055
and
- ~’ IN+ Y~d~ 0.85Pl/ --(~s’de’r -~,’,~e~) =0.15
Md~ ~- 0"5(1-fllqa~)=0.87Aphgfp,aes (0
737x12 = [1.91 in2[~Ap = 0.87 x 26 x 205
and
131
Conclusions or recommendations in this report are the opinions of the authors. PCI assumes no responsibility for the interpretation or application of the information contained herein.

M,~o, = (1-4" - 0.5fl~r/,~e,) = 1.82A~hg2.~.d~, f~y 1-co
A~ = 737x12 = L2.22 in2l1.82x 26xl.4x60
Ap R2s,de~ (1--~--O.5 fl,~Tde,) = O.85
As 0.5(1 - flf/ae,)(~l - 1)
Ste~ 8: Calculate the moment strength of the section at Odes
M eap,beam = M p,des + M ,,de~ + M ~,,d~ >- M d~
===> 0.5(1-flf/a~) + _~EA~,d~(l_~_O.5]3~rld~)+ )L,,.d~(~_O.Sfl~r/d,,)~ > 0.5(1-flf/a~s)co
" The objective function is equal to:
The EXCEL Solver is used to find the optimum solution by changing qdes, ¢9, and 3’ Subjected to
The following constraints:
1) r > 22s,,desK
2) ep < ~’~’py
3) 3,< 0.45 Q
4) (Tides)calculated = (rides)assumed
(~ldes)0ptimum = 0.15
(O))optimum -- 0.51
(It)optimum = 0.26 %
132
Conclusions or recommendations in this report are the opinions of the authors. PCI assumes no responsibility for the interpretation or application of the information contained herein.
Ste~ 9: Evaluate the Restoring Properties of the Beam (Constrained Equations)
To ensure self-centering
Mp0 > Ms0 + Ms,0
r > 2)t.s,,,~sK = 0.85
Step 10: Calculate the required unbonded length of the deformed reinforcement
Let,
~.,. = e~,max = 0.05
2 23(0 des+~" ~,a) sin(+~") -0~ db =0.005
O°a ,a
L,,,, _ 0.8 l(f~,, - f~y) = 0.86db (f,~)1.5
Thus, the total strain is:
133
Conclusions or recommendations in this report are the opinions of the authors. PCI assumes no responsibility for the interpretation or application of the information contained herein.
’~s,~x - Zb,n~,x
0.05 -- 0.005 = 0.045
Lu---t-’ > (1-r/din-~)Oaes =0.29
For hg = 26 in.
L,, > 26 x 0.29 = 7.54 in
Ls, = L,,t - 2L~
= 7.54 - 2(0.86) = 5.82 in.
Provide L~ = ~
Step 11: Confine Compression Region
lph = kph qdes hg
= lx0.15×26 = 3.9 in.
O’~es (rldeshb ) -- Odes -- 0.0165,zq’c --
lph kph
0.003 Provide proper confinement to prevent spalling.
4.3.3 Solution Using Proposed Design Charts
1. Go to Figure 3.14 and Determine:
fp,~es / fpy = 0.84
~ fp,de~ = 0.84 x 243 = 204.12 ksi
2. Go to Figure 3.4 and Determine:
134
Conclusions or recommendations in this report are the opinions of the authors. PCI assumes no responsibility for the interpretation or application of the information contained herein.

737x12 = ~=~Ap 0.88x26x204.12
3. Go to Figure 3.6 and Determine:
As =737x12
=[2.24 in2l1.Sx. 26xl.4x60
4.3.4 Solution Using Proposed Design Equations
1. Calculate
2. Calculate ASp
3. Check if
4. Calculate fp,des
r/aN = -0.2fll +0.3=-0.2(0.75)+0.3 = 0.15
A° - Odes (0.5- r/aes) = 0.001!Xgp- lpu ~
ep = ~pi + Aep = 0.0072
Check if
~p ~ I~ ~py
Let a’ = 1
0.0072 < 0.0085 OK
135
Conclusions or recommendations in this report are the opinions of the authors. PCI assumes no responsibility for the interpretation or application of the information contained herein.
5. For @ = L~u/h < 8
Males _ 1. ] 25~0o.ogg~,max°’°37~
Aphgfp,~es
(]%.04 = (--6’70d~ + 0"9)¢= (--6.7 X 0.0i65 + 0.9) x 5.57(2’7×0"0165+°"°3) = 0.897
Md= _ [1.125 x 0.05°’°371~ x 0.897 = 0.9Aphgfp,d~
737 x12 = ~~Ap 0.9x 26x 204.12
6. For qb = I_~uih _< 8
Ma~ = 0.8 82g0.0.04 ~s,max_0.o34As2s,de, h g f v.de,
nro.o,, = (22.230a~ + 1,7)lfi-(3’4640°~s+0’0216)
= (22.23 X 0.0165 + 1.7) X 5.57-{3"464×°’°16s+°’°216) = 1.8
Mdes = I0.882 x 0.05-°’°3~ 1 x 1.8 = t.76
737x12in2l~ A~ -- --
1.76x 26x 1.4x 60
The results of the four methods are compared in Table 4.6 below
136
Conclusions or recommendations in this report are the opinions of the authors. PCI assumes no responsibility for the interpretation or application of the information contained herein.

Table 4.6 Results Compared Using the Four Methods
Method
PRESSS Procedure
Non-DimensionalProcedure
Charts
Design Equations
Ap (in2)
1.93
1.91
1.89
1.85
As (inz)
2.23
2.22
2.24
2.3
L~u (in.)
7
6
Remarks
Bending strainand grout
effects are notincluded
Bending strainand grouteffects areincluded
Bending strainand grouteffects areincluded
Bending strainand grouteffects areincluded
Use 13 - 1/2 in. diameter PT strands (Ap,provided = 2 in2), along with 3 #8 bars
(As,provlded = 2;4 in2).
137
Conclusions or recommendations in this report are the opinions of the authors. PCI assumes no responsibility for the interpretation or application of the information contained herein.

4.4 Example # 4:
Reference: S.K. Ghosh and David A. Fanella, Seismic and Wind Design of Concrete
Buildings based on 2000 IBC, ASCE 7-98, and ACI 318-99 code~ 2003.
Seismic Data:
¯ Location: Berkeley, CA (zip code 94705)
¯ Seismic Design Category (SDC): E
¯ Site Class D
¯ 12-Story School Buildings
¯ 7 equal bays (span length = 26 ft)
¯ hg = 32 in., bg = 28 in.
¯
This example is solved
dimensional procedures,
Moment-Resisting Frame System (Hybrid Frame)
using the original PRESSS calculation, the modified non-
the developed non-dimensional charts, and the proposed
simplified equations. Table 4.7 below shows the material properties and information that
are used in the four different design procedures. The results are compared in Table 4.8.
138
Conclusions or recommendations in this report are the opinions of the authors. PCI assumes no responsibility for the interpretation or application of the information contained herein.

Table 4.7 Material Properties and Design Information for Example 4
Parameter
f ’~ (ksi)
f ’g (ksi)
fpy (ksi)
fpu (ksi)
f,i (ksi)Es (ksi)
fsy (ksi)
Value
6
9
243
270
175.5
29000
60
0.055
Ls(fl) 26
Lp. (ft) 13
Ep (ksi) 28500
1~1 0.75
Ss,max 0.05
)~s 1.4
Xs, 1.25
Sy 0.00207
Spy 0.0085
Spi 0.00616
Mdes (ft-kips) 1170
Odes (%) 1.9.
Comments
Compressive strength of concrete
Compressive strength of grout
Yield strength of Gr. 270 strand
Minimum strength of Gr. 270 strand
Initial stress in strand
Modulus of elasticity of mild steel
Yield strength of Gr. 60 steel bars
Cover factor (See Figure 3.2)
Tendon length c/c of colunms
(All spans are of equal length)
Ls/2
Modulus of elasticity of Gr. 270 strand
131 = 0.85 - 0.05 (f ’c - 4)
Maximum sustainable strain in the mild reinforcing steel
(See section 4.4.2)
Tension over-strength factor (ACI T 1.2-03)
Compression over-strength factor (ACI T1.2-03)
fsy/Es
Obtained using Force Based Design (FBD)
Calculated Drift
139
Conclusions or recommendations in this report are the opinions of the authors. PCI assumes no responsibility for the interpretation or application of the information contained herein.

4.4.1 Basic Solution Using PRESSS Procedure
The following is an iterative process that follows steps 1 through 15 based-on initial
assumptions. For the sake of brevity, only the initial and final values of parameters are
given below.
Step 1: Establish Material properties and Design Information
See Table 4.7
Step 2: Obtain Design Loads (Mdes) and Drifts (Odes %)
See Table 4.7
Step 3: Estimate Frame Beam Dimensions
hg <l,,= 23.67x12_94.5 in. OK3 3
bg > 0.3hg = 0.3 x 32 = 9.6 in. OK
Step 4: Establish Constants
hgA fsJ~ = 0"5EpOaes lp-~
= 0.5x28,500x 0.019x32 - 55.54 ksi
13x12
Step 5: Determine the Proportion of the PT and Deformed Reinforcement Moment
Strength
Mp,des = 0.52 Mdes = 608.4 ft-kips (Optimum solution after several iterations)
Ms,des = Mdes - Mp,des = 561.6 fl-kips
140
Conclusions or recommendations in this report are the opinions of the authors. PCI assumes no responsibility for the interpretation or application of the information contained herein.
Step 6: Estimate the Required Area of PT Tendon (Ap)
Assume initially that the compression force in the beam is located at 0.05hg (a = 0. lhg)
from the compression face. This assumption leads to:
Mp,des
(0.45hg)f,y
608.4 × 12= - 2.09 in2
0.45 × 32 × 243
Step 7: Estimate the Required Area of Deformed Reinforcement (A~)
Using the same assumption as in Step 6 such that:
(0.95 - ~)h g~s,aesf sy
573.3x12(0.95 - 0.055) x 32 x 1.4 x 60
= 2.8 in2
Step 8: Estimate the Neutral Axis Parameter at the Design Drift
The location of the neutral axis can be found using an initial assumption of a!hg = 0.1 that
was made in Step 6. This assumption yields to an initial value of rlde~ = 0.1/[~1. However
after several iterations of the steps shown here, the optimum solution converged on a ]]des
value o f 0.15.
r/a~ - = 0.15
Step 9: Calculate the Stress in the Tension Mild Steel Reinforcement
= 1.4 x 60 = 84 ksi
141
Conclusions or recommendations in this report are the opinions of the authors. PCI assumes no responsibility for the interpretation or application of the information contained herein.

Please note that the PRESSS procedure recommends a Ls,des value of 1.35, but allows for
a more rational determination of this parameter. In this report, a )~s,des value of 1.4 is used
according to the provisions of section 3.3 of ACI T1.2-03.
Step 10: Calculate the Stress in the Compression Mild Steel Reinforcement
= 1.25 x 60 = 75 ksi
Please note that the PRESSS procedure recommends a ~s’,des value of 1, but allows for a
more rational determination of this parameter. In this report, a Ls’,aes value of 1.25 is used
according to the provisions of section 3.3 of ACI T1.2-03.
Step 11: Calculate the Stress and Elongation in the Pre-Stressing Tendonat 0d~s
A, = 0~ho(0.5- ~)
= 0.019x 32 x (0.5 - 0.15) = 0.213 in
0.213Afp = --Ep = ~x 28,500 = 38.9 ksi
lp, 13x12
fpo = fpy-Afp
= 243 - 38.9 = 204.1 ksi
iffpo > fpi : 0.65 x 270 : 175.5 ksi
then fpo = f~i = 175.5 ksi
f p,ae, = f po + Af p
= 175.5 + 38.9 = 214.4 ksi
else f p,d~ = f py
142
Conclusions or recommendations in this report are the opinions of the authors. PCI assumes no responsibility for the interpretation or application of the information contained herein.

0.5(1-- flfld~ )h g f p,d~,
608.4 x 120.5(1- 0.75 x 0.15) x 32 x 214.4
= 2.4 in2
And
Ms,desAs-
(1- ¢ - 0 . S fl~ rl des ) h g 2 ~ ,des f ~y
561.6x12(1 - 0.055 - 0.5 x 0.75 x O. 15) x 32 x 1.4 x 60
= 2.82 in2
Step 12: Calculate the Forces at Odes
= 2.4× 214.4 = 514.56 kips
Fs,a~ = As2,.desf , y
= 2.82x 1.4x 60 = 237.88 kips
= 2.82x 1.25x 60 = 211.5 kips
Fc,aes = gp,aes + F,,a~ -
= 514.56 +237.88 - 211.5 = 540.94~ps
Step 13: Calculate the Locations of the Compression Force and the Neutral Axis
Fc,d~ _ 540.94 =3.79in.0.85 f~’bg 0.85x6x28
ades _ 3.79ad~, = -- 0.059
2hg 2x32
= ade..~_~ = 3.79 = 0.157 (Optimum value is 0.15, OK.)rld~ fllhg 0.75x32
143
Conclusions or recommendations in this report are the opinions of the authors. PCI assumes no responsibility for the interpretation or application of the information contained herein.

r/an = 0.15
~z~ =0.5x/~1 xr/~s
= 0.5x 0.75x 0.15 = 0.056
Step 14: Calculate the Moment Strength of the section at 0aes
Taking moments of both the PT and deformed reinforcement forces about the centroid of
the compression force yields:
Mv,ae, == 514.56 × 32(0.5 - 0.056)/12 = 609.2 ft-kips
= 237.88 x 32(1- 0.055 - 0.056)/12 = 563.9 ~-kips
= 237.88 x 32(0.055 - 0.056)/12 = - 0.64 ~-kips
Therefore the total moment strength can be dete~ined ~ follows
M cap,O~~ = M p,a~~ + M ~,a~ + M ~’,a~
= 609.2 + 563.9 - 0.64 = 1172.5 fi-kips
M cap,O~ ~ M aes
1172.5 ~ 1170 ~-kips, OK (~timum Solution)
Step 15: Evaluate the Restoring Properties of the Beam
F,o =
= 2.82×1.25×60 = 210 kips
Fs,o =
= 2.82 × 1.25 × 60 = 210 kips
144
Conclusions or recommendations in this report are the opinions of the authors. PCI assumes no responsibility for the interpretation or application of the information contained herein.
F~,o = A~,f~,o
= 2.4x175.5 = 421 kips
Fco = F~,o - Fso - F~’o
=421-210-210= 1 kips
Fco
o.85f&1
- = 0.007 in0.85 x 6 x 28
ao
2hg
0.007= -- = 0.00011
2x32
ao
0.0070.75 x 32
- 0.00029
M o=F, oh (0.5- o)= 421x 32(0.5 - 0.00011)/12 = 553.5 ft-kips
M,o = F, ohg(1-£-ao)
= 210x 32(1 - 0.055 - 0.00011)/12 = 525.3 R-kips
M ,,o = F~’oh(~ - ao)
= 210x 32(0.055 - 0.00011)/12 = 26.9 ft-kips
To ensure self-centering
Mvo- > Mso + Ms,o
553.5 > 525.2 + 26.9 = 552.2 it-kips, OK
145
Conclusions or recommendations in this report are the opinions of the authors. PCI assumes no responsibility for the interpretation or application of the information contained herein.

Step 16: Calculate the Elongation and Required Unbonded Length of the Mild Steel Bar
As : Odeshg (1-~" - ~Tdes)
= 0.019×32(1-0.055-0.15) = 0.48 in
AS
0.48-9.7 in
0.05Provide 10 in. of unbonded length
Please note that the PRESSS procedure recommends a [3s,max value of 0.04, but allows for
a more rational determination of this parameter. In this report, a new methodology for
calculating gs,m,x is proposed (See sections 3.5 and 4.4.2 for details), which results in a
gs,max value of 0.05.
Step 17: Confine Compression Region
lph = kph rides hg
= lxO.15x32 = 4.8 in.
~c- Od~(r/a=h~) - Oaes -0.019lob
gc > 0.003 Provide proper confinement to prevent spalling.
4.4.2 Solution Using Modified Non-Dimensional Design Procedure based on PRESSS
This modified procedure utilizes non-dimensional parameters and does not involve
iterative calculations as in PRESSS. However, an optimization procedure is performed
within Microsoft Excel. The following procedures also utifize the proposed low-cycle
fatigue criterion for the mild reinforcing steel. See section 3.5 for details.
Let,
146
Conclusions or recommendations in this report are the opinions of the authors. PCI assumes no responsibility for the interpretation or application of the information contained herein.

Y = fsy/f’c = 10
Z = fsy I f py = 0.247
K -- fsylf po = 0.34
0 " f’c/fpi = 0.034
Please note that the following calculations for ~s,m~x is not included in the original
PRESSS procedure.
Calculate the estimated fundamental period of the structure as follows:
T = 0.03 (hn)3/4 = 0.03 (147.5)3/4 = 1.27 see.
Where hn is the overall height of the building
The number of cycles to failure can then be calculated as
N~ = 7 T -1/3 = 7 (1.27)-a/3 = 6.46 cycles
Enter the value of N~ for Nf in the following equation
~,,p = 0.08(2Ny )-0.45 = 0.025
and
8s,max = 213ap ---- 0.045
fs,des=Xs,des fsy = 84 ksi
fs’,des=~Ls’,des fsy "- 75 ksi
~ Establish Material Properties and Design Information
See Table 4.7.
Ste~ 2." Obtain Design Drift
See Table 4.7.
147
Conclusions or recommendations in this report are the opinions of the authors. PCI assumes no responsibility for the interpretation or application of the information contained herein.

Ste~ 3." Estimate Frame Beam Dimensions
~ = Lpu/hg= 4.88
Ste~ 4." Determine the Proportions of Moment Strength
m = 0.52 (Optimum solution calculated using the EXCEL Solver)
Ste~ 5." Estimate The Neutral Axis Parameter
rides = 0.i 5 (Optimum solution calculated using the EXCEL Solver)
ades "-0.5 ~lqg~s = 0.055
Steo 6." Calculate the Strain in the Pre-Stressing tendon at 0aesAp _ Ode‘ (0.5-qde,) = 0.001376
A~,- lp~
o~p ~ O°pi q- A~p = 0.00753
Check if
Let a’ = 1
0.00753 < 0.0085 OK
fp,des = Ep Vp = 215 ksi
f~’ = 0.28f p,des
148
Conclusions or recommendations in this report are the opinions of the authors. PCI assumes no responsibility for the interpretation or application of the information contained herein.

Calculate the Relative Locations of the Compression Force and the Neutral Axis
Let,
Apy - - 0.25% (Optimum Solution)
bghg
2.4(bg)°ptimum
0.0025 x 28 - 34.3 in
Check if
0.45 Q = 1.54 %, OK (ACI 318-02 Provisions)
Ey
- N +a aes 1.7
and
= 0.O55
= 0..15
Mdes _ 0.5(1 --/~l/Taes) = 0.85
Ap h g f p ,des
1170x12 = ~=:>Ap
0.85x32x215
and
Mdes = (1--~’--0"5fl~r/des) = 1.86Ashg~,s,ae, f~y 1-09
As =1170x12 = 2.81 inz
1.86x32x1.4x60
- 149
Conclusions or recommendations in this report are the opinions of the authors. PCI assumes no responsibility for the interpretation or application of the information contained herein.

Ap R)~sdes(1--~’--0.Sfllr/de~) 0.85
A~ 0.5(1_ fl, r/~s)(l_ 1)
Ste~ 8." Calculate the momem strength of the section at Odes
M cap,beam = M p,aes + M ~,ae~ + M s,,des > M a~
~ 0.5(1-flflaes) +0.5(1- flf/~)
.’. The objective function is equal to:
0-5(1 - flf/a~,) + ~_E,~.~.a~ (1 _ ~. _ 0.5fl~r/a~)+ A¢ ae~ (~. _ 0.5,Bf/a~)~-’ 0.5(1- fl, r/a~,)co =0
The EXCEL Solver is used to find the optimum solution by changing floes, m, and ~, Subjected to
The following constraints:
1) v > 2~<desK
3) r <- 0.45 Q
4) (ndes)c. cu ate = (qde )a su ed
0Ides)optimum - 0.15
(O)optimum - 0.52
(r)opt~mum = 0.25 %
~ Evaluate the Restoring Properties of the Beam (Constrained Equations)
To ensure self-centering
Mpo >- Ms0 + Ms,0
150
Conclusions or recommendations in this report are the opinions of the authors. PCI assumes no responsibility for the interpretation or application of the information contained herein.

r > 25Ls,,a~sK = 0.85
Step 10: Calculate the required unbonded length of the deformed reinforcement
Let,
°~a,a = ~s,max = 0.05
~i.l 1 + 2 (02ae~ 2 - 1 = 0.04982= +~ .,~)Tcos +a" +(02.a~
and
3(02des + ¢2aa)-~ sin( + a") - Odesdb = 0.004
L,,~ 0.81(f~,-f,y) 0.72do (f~)"s
Thus, the total strain is:
O~axial "1-O~b,max <~ OC’s,max
~at! = ’F’s,max -- ~b,max
z~o = 0.05 - 0.004 = 0.046
151
Conclusions or recommendations in this report are the opinions of the authors. PCI assumes no responsibility for the interpretation or application of the information contained herein.
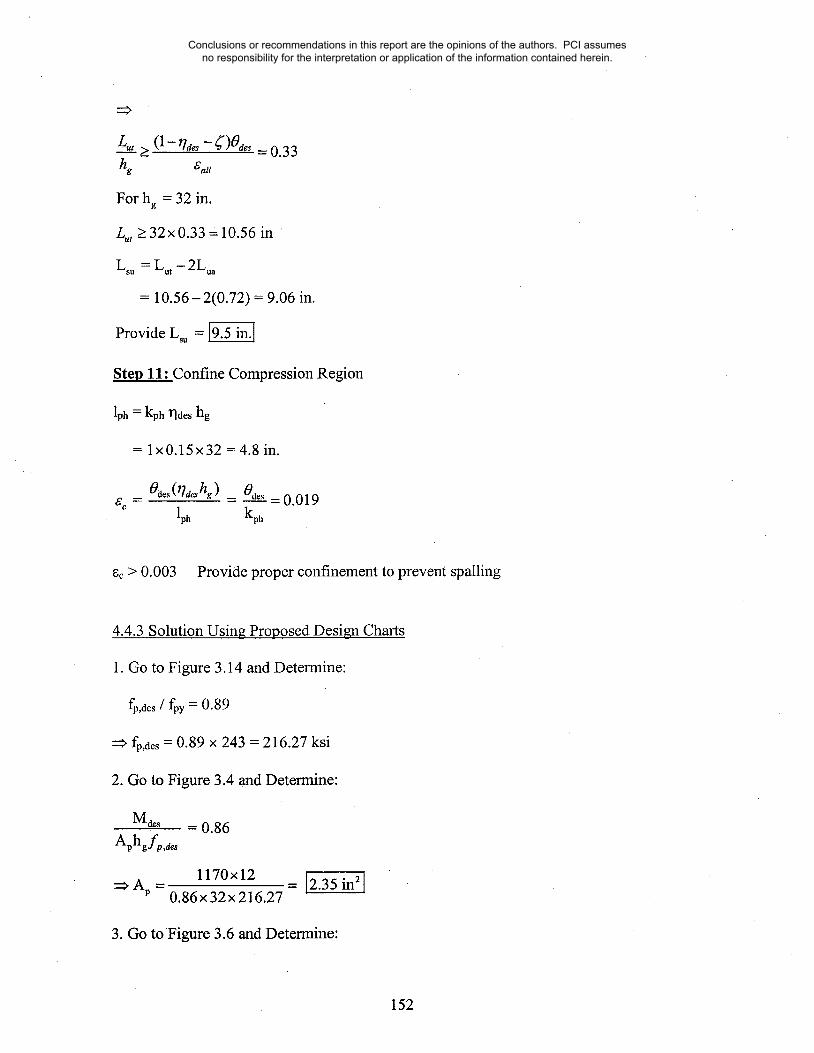
Lu,> (1-r/aes -£)O~e, =0.33
For hg = 32 in.
L.,t > 32x0.33 =10.56 in
Lsu = Lut - 2L~,
= 10.56-2(0.72) = 9.06 in.
Provide L~u = @
Step 11: Confine Compression Region
lph = kph ’q~es hg
= lx0.15x32 = 4.8 in.
~c > 0.003 Provide proper confinement to prevent spatling
4.4.3 Solution Using Proposed Design Charts
1. Go to Figure 3.14 and Determine:
fp,des / fpy = 0.89
~ fp,aes = 0.89 x 243 = 216.27 ksi
2. Go to Figure 3.4 and Determine:
= 0.86
1170×12~Ap 0.86x32x216.27 2.35 in2]
3. Go to Figure 3.6 and Determine:
152
Conclusions or recommendations in this report are the opinions of the authors. PCI assumes no responsibility for the interpretation or application of the information contained herein.

Mdes = 1.82AshgA~,ae~ f~y
As = 1170x12 -[2.86 in211.82x32x1.4x60
4.4.4 Solution Using Proposed Design Equations
1. Calculate rlaes
2. Calculate A~p
.3. Check ifsp < c~’ ~py
4. Calculate fp,des
5. For.~ = Lpuih < 8
r/des = --0.2fll +0.3
= --0.2(0.75)+0.3 = 0.15
mp _ OdesAgp - lpu
~b (0"5--r/d=) = 0.001 38
0.00753 < 0.0085 OK
fp,des = Ep Sp = 215 ksi
Md~ = 1.125~o.o48s,max0"°371Aphgfp,aes
~Oo.o4 = (--6.70d~, + 0.9)~b(z7°.~+°.°3)
= (-6.7 x 0.019 + 0.9) x 4.88(2’v×°’°19+°’°3~ = 0.878
153
Conclusions or recommendations in this report are the opinions of the authors. PCI assumes no responsibility for the interpretation or application of the information contained herein.
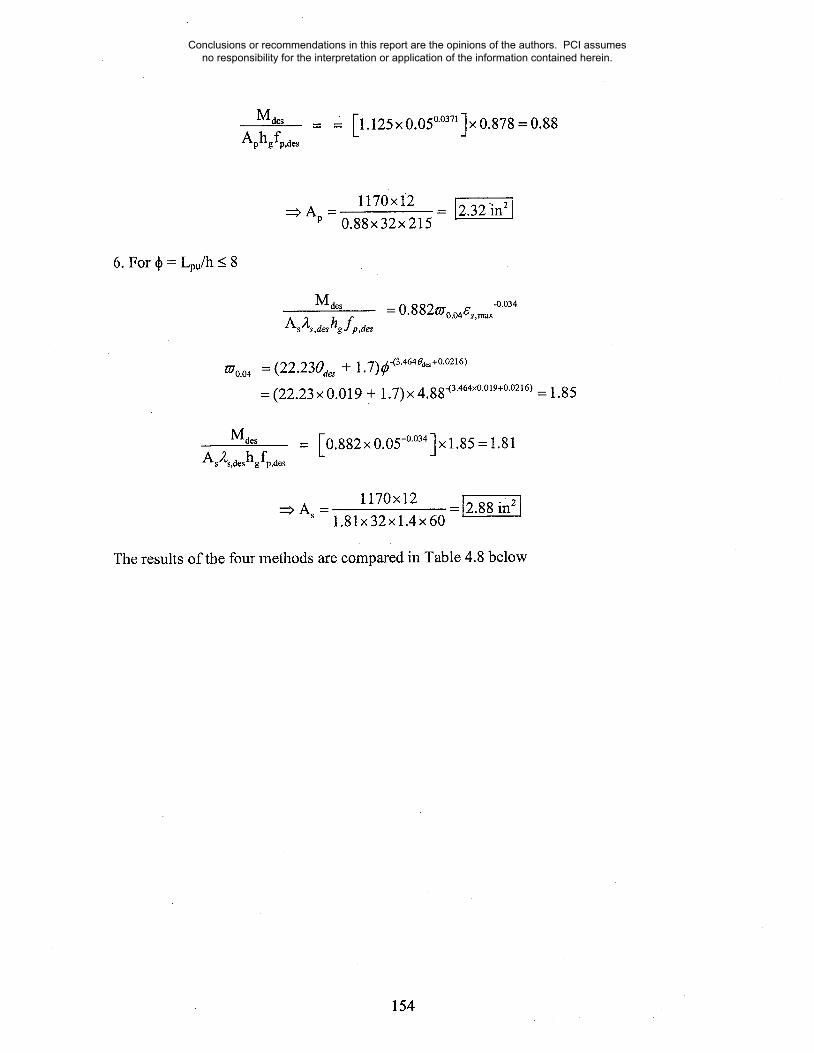
M desAphgfp,des
l. 125 x 0.050’0371J × 0.878 = 0.88
1170xi2 = [2.32in2]~ Ap = 0.88x32x215
Mdes= O. 8 821~70.04g’s,max"0’034
~J’0.04 = (22.230d~ + 1.7)¢"(3’46406+°"°216)
= (22.23 x 0.019 + 1.7) x 4.88-(3’464x0’019+0"0216) = 1.85
M des= I0.882X 0.05-0"0341 X 1.85 = 1.81
A~d’~,~hg fp,ae~
=:> A~ = 1170x12 =!2.88 in~]1.81x32xl.4x60
The results of the four methods are compared in Table 4.8 below
154
Conclusions or recommendations in this report are the opinions of the authors. PCI assumes no responsibility for the interpretation or application of the information contained herein.

Table 4.8 Results Compared Using the Four Methods
Method
PRESSS Procedure
Non-DimensionalProcedure
Ap (inz)
2.4
2.4
As (inZ)
2.82
2.81
Lsu (in.)
10
9.5
Charts
Design Equations
2.35
2.32
2.86
2.88
9.5
9.5
Remarks
Bending strainand grout
effects are notincluded
Bending strainand grouteffects areincluded
Bending strainand grouteffects areincludedBending strainand grouteffects areincluded
Use 16 - ½ in. diameter PT strands (Ap,provided = 2.45 in2), along with 4 #8 bars
(As,provided = 3.16 in2).
155
Conclusions or recommendations in this report are the opinions of the authors. PCI assumes no responsibility for the interpretation or application of the information contained herein.

4.5 Example # 5:
Reference: S.K. Ghosh and David A. Fanella, Seismic and Wind Design of Concrete
Buildings based on 2000 IBC, ASCE 7-98, and ACI 318-99 code, 2003.
Seismic Data:
¯ Location: New York, NY (zip code 10013)
¯ Seismic Design Category (SDC): C
¯ Site ClassD
¯ 12-Story School Buildings
¯ 7 equal bays (span length = 26 ft)
¯ hg = 22 in., bg = 22 in.
¯ Moment-Resisting Frame System (Hybrid Frame)
This example is solved using the original PRESSS calculation, the modified non-
dimensional procedures, the developed non-dimensional charts, and the proposed
simplified equations. Table 4.9 below shows the material properties and information that
are used in the four different design procedures. The results are compared in Table 4.10.
156
Conclusions or recommendations in this report are the opinions of the authors. PCI assumes no responsibility for the interpretation or application of the information contained herein.
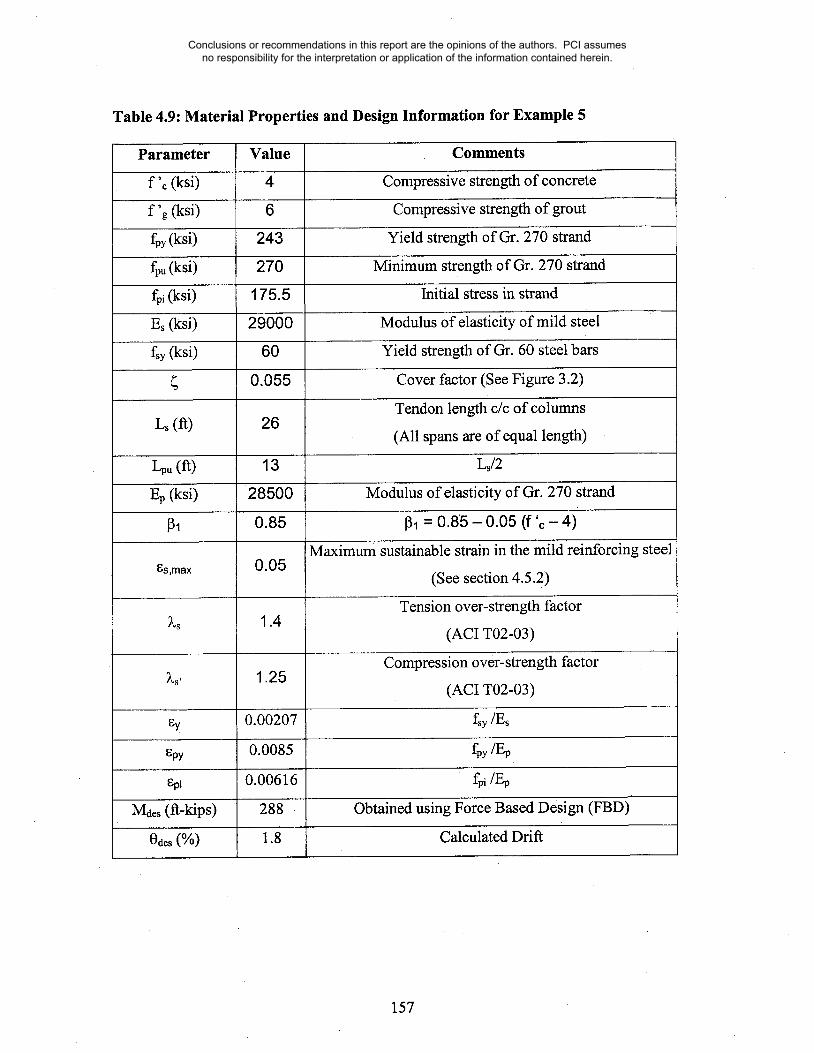
Table 4.9: Material Properties and Design Information for Example 5
Parameter Value Comments
f ’c (ksi) 4 Compressive strength of concrete
f ’g (ksi) 6 Compressive strength of grout
fpy (ksi) 243 Yield strength of Gr. 270 strand
fpu (ksi) 270 Minimum strength of Gr. 270 strand
fpi (ksi) 175.5 Initial stress in strand
Es (ksi) 29000 Modulus of elasticity of mild steel
fsy (ksi) 60 Yield strength of Gr. 60 steel bars
~ 0.055 Cover factor (See Figure 3.2)
Tendon length c/c of columnsLs (it) 26
(All spans are of equal length)
Lpu (It) 13 Ls/2
F_~ (ksi) 28500 Modulus of elasticity of Gr. 270 strand
131 0.85 1~1 = 0.85 - 0.05 (f ’c - 4)
Maximum sustainable strain in the mild reinforcing steelt;s,max 0.05
(See section 4.5.2)
Tension over-strength factorX~ 1.4
(ACI T02-03)
Compression over-strength factor1.25
(AC[ T02-03)
t;y 0.00207 fsy iEs
Spy 0.0085 fpy/F__,p
Spi 0.00616 fpi/Ep
M~es (it-kips) 288 Obtained using Force Based Design (FBD)
Odes (%) 1.8 Calculated Drift
157
Conclusions or recommendations in this report are the opinions of the authors. PCI assumes no responsibility for the interpretation or application of the information contained herein.

4.5.1 Basic Solution Using PRESSS Procedure
The following is an iterative process that follows steps 1 through 15 based on initial
assumptions. For the sake of brevity, only the initial and final values of parameters are
given below.
-Step 1: Establish Material properties and Design Information
See Table 4.9
Step 2: Obtain Design Loads (Mdes) and Drifts (Odes %)
See Table 4.9
3: Estimate Frame Beam DimensionsStep
hg < l, _ 23.67×12- 3 ~: = 94.5 in.
bg > 0.3hg = 0.3 x 22 = 6.6 in.
Step 4: Establish Constants
hgA fp<~ = 0.SEp(Ta~ l p--~
= 0.5 x 28,500× 0.018x
OK
OK
22 - 36.17 ksi13x12
Step 5: Determine the Proportion of the PT and Deformed Reinforcement Moment
Strength
Mp,des ~ 0.5 Maes = 144 ft-kips (Optimum solution after several iterations)
Ms,des = Mdes -- Mp,des = 144 ft-kips
158
Conclusions or recommendations in this report are the opinions of the authors. PCI assumes no responsibility for the interpretation or application of the information contained herein.

Step 6: Estimate the Required Area of PT Tendon (Ap)
Assume initially that the compression force in the beam is located at 0.05hg (a = 0. lhg)
from the compression face. This assumption leads to:
(0.45hg)fpy
144x12 = 0.72 in2= 0.45 x 22 x 243
Step 7: Estimate the Required Area of Deformed Reinforcement (As)
Using the same assumption as in Step 6 such that:
Ms,dos(0.95
144x12 = 1.04 in2- (0.95 - 0.055) x 22 x 1.4 x 60
Step 8: Estimate the Neutral Axis Parameter at the Design Drift (Tides)
The location of the neutral axis can be found using an initial assumption of a!lag = 0.1 that
was made in Step 6. This assumption yields to an initial value of rides = 0.1/131. However
after several iterations of the steps shown here, the optimum solution converged on a Tides
value of 0.13.
rla~ = a/hg = 0.13
Step 9: Calculate the Stress in the Tension Mild Steel Reinforcement
= 1.4 x 60 = 84 ksi
159
Conclusions or recommendations in this report are the opinions of the authors. PCI assumes no responsibility for the interpretation or application of the information contained herein.
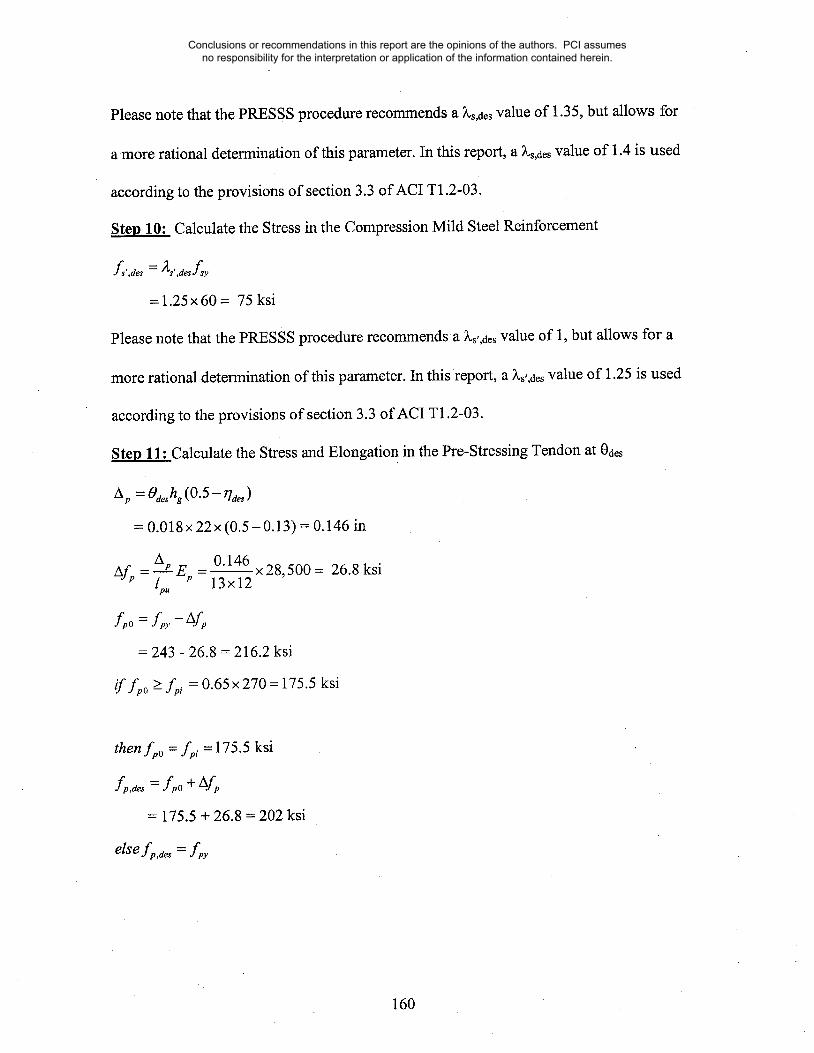
Please note that the PRESSS procedure recommends a Ls,aes value of 1.35, but allows for
a.more rational determination of this parameter. In this report, a ~.s,des value of 1.4 is used
according to the provisions of section 3.3 of ACI T1.2-03.
Step 10: Calculate the Stress in the Compression Mild Steel Reinforcement
= 1.25 × 60 = 75 ksi
Please note that the PRESSS procedure recommends a ~,s’,des value of 1, but allows for a
more rational determination of this parameter. In thisreport, a ~,s’,des value of 1.25 is used
according to the provisions of section 3.3 of ACI T1.2-03.
Step 11: Calculate the Stress and Elongation in the Pre-Stressing Tendon at
zx, = O hg(O.5-, des)
= 0.018 x 22x (0.5- 0.13) = 0.146 in
AfpAp 0.146
=--Ep .- x28,500 = 26.8 ksi13x12
f,o== 243 - 26.8 = 216.2 ksi
iffpo > foi = 0.65x270 =175.5 ksi
thenfpo = f~; = 175.5 ksi
= 175.5 + 26.8 = 202 ksi
else f ~,,a~ = for
160
Conclusions or recommendations in this report are the opinions of the authors. PCI assumes no responsibility for the interpretation or application of the information contained herein.

Mp,des
0.5(1- fl, rlaes )h g f p,ae,
144×120.5(1 - 0.85 x O. 13) x 22 x 202
= 0.89 in2
144x12(1 - 0.055 - 0.5 x 0.85 x 0.13) x 22 x 1.4 x 60
- 1.04 in2
Step 12: Calculate the Forces at Odes
Fp,des = Apf p,des
= 0.89x 202 = 180 kips
= 1.04× 1.4× 60 = 87.4 kips
Fs,aes = As2s,,aesfsy
= 1.04x 1.25 x 60 = 78 kips
Fc,aes = Fp,aes + Fs,aes -F,,,,~,s
= 180 + 87.4 - 78 = 189.4 kips
Step 13: Calculate the Locations of the Compression Force and the Neutral Axis
Fc,~ _ 189.4 = 2.53 in.aae~
0.85fc’bg 0.85 x 4 x 22
_ aae~ _ 2.53 = 0.135 (Optimum value is 0.13, OK.)r/a~ -/3,~-g 0.85 x 22
161
Conclusions or recommendations in this report are the opinions of the authors. PCI assumes no responsibility for the interpretation or application of the information contained herein.

0.13
0.5x/31 ×
0.5x 0.75x0.15 = 0.055
Step 14: Calculate the Moment Strength of the section at Odes
Taking moment of both the PT and deformed reinforcement forces about the centroid of
the compression force yield:
= 180x22(0.5-0.055)/12 = 146.85 ft-kips
Ms,,~ = F~,,~hg(1- ~ - a,~es)
= 87.4× 22(1-0.055-0.055)/12 = 142.6 ft-kips
M s ,,aes = Fs,,aesh g ( ~ - Ot ctes)
= 78× 22(0.055- 0.055)/12 -- 0
Therefore the total moment strength can be determined as follows:
Mcap,bearn = Mp,des + Ms,d~, + Ms’,des
= 146.85 + 142.6 = 289.5 fl-kips
M cap,bea~n >- Mac,
289.5 > 288 ft-kips, OK (Optimum Solution)
Step 15: Evaluate the Restoring P~operties of the Beam
= 1.04xl.25x 60 = 78 kips
= 1.04 × 1.25 × 60 = 78 kips
162
Conclusions or recommendations in this report are the opinions of the authors. PCI assumes no responsibility for the interpretation or application of the information contained herein.

Fpo = Apf po
= 0.89x 175.5 = 156 kips
Fco =Fpo-Fso-Fs’o
= 156 -78-78 =Okips
Fco
o.s5f&0
=Oin0.85x4x22
aoa° 2hg
02x 22
ao
00.85×22
Mpo = Fpohg (0.5 --O~0)
= 156 × 22(0.5 - 0)/12 = 143 it-kips
M,o = F, ohg(1-~-ao)
= 78 x 22(1 - 0.055 - 0)/12 = 135 ft-kips
M,,o= F,’ohg(~-cto)
= 78x 22(0.055-0)/12 = 7.9 ft-kips
To ensure self-centering
Mpo > Mso + Ms,o
143 > 135 + 7.7,9 = 142.9 R-kips, OK
163
Conclusions or recommendations in this report are the opinions of the authors. PCI assumes no responsibility for the interpretation or application of the information contained herein.

Step 16: Calculate the Elongation and Required Unbonded Length of the Mild Steel Bar
A., = O,a~hg(1-~-r/,~.~)
= O.O18x 22(1-0.055-7 0.13) = 0.32 in
0.32- - 6.4 in Provide 6.5 in.
0.05
Please note that the PRESSS procedure recommends a gs,max value of 0.04, but allows for
a more rational determination of this parameter. In this report, a new methodology for
calculating ~s,n~x is proposed (See sections 3.5 and 4.5.2 for details), which results in a
13s,max value of 0.05.
Step 17: Confine Compression Region
= lx0.13x22 =2.86 in.
~c > 0.003 Provide proper confinement to prevent spalling.
4.5.2 Solution Using Modified Non-Dimensional Design Procedure based on PRESSS
This modified procedure utilizes non-dimensional parameters and does not involve
iterative calculations as in PRESSS. However, an optimization procedure is performed
within Microsoft Excel. The following procedures also utilize the proposed low-cycle
fatigue criterion for the mild reinforcing steel. See section 3.5 for details.
Let,
164
Conclusions or recommendations in this report are the opinions of the authors. PCI assumes no responsibility for the interpretation or application of the information contained herein.
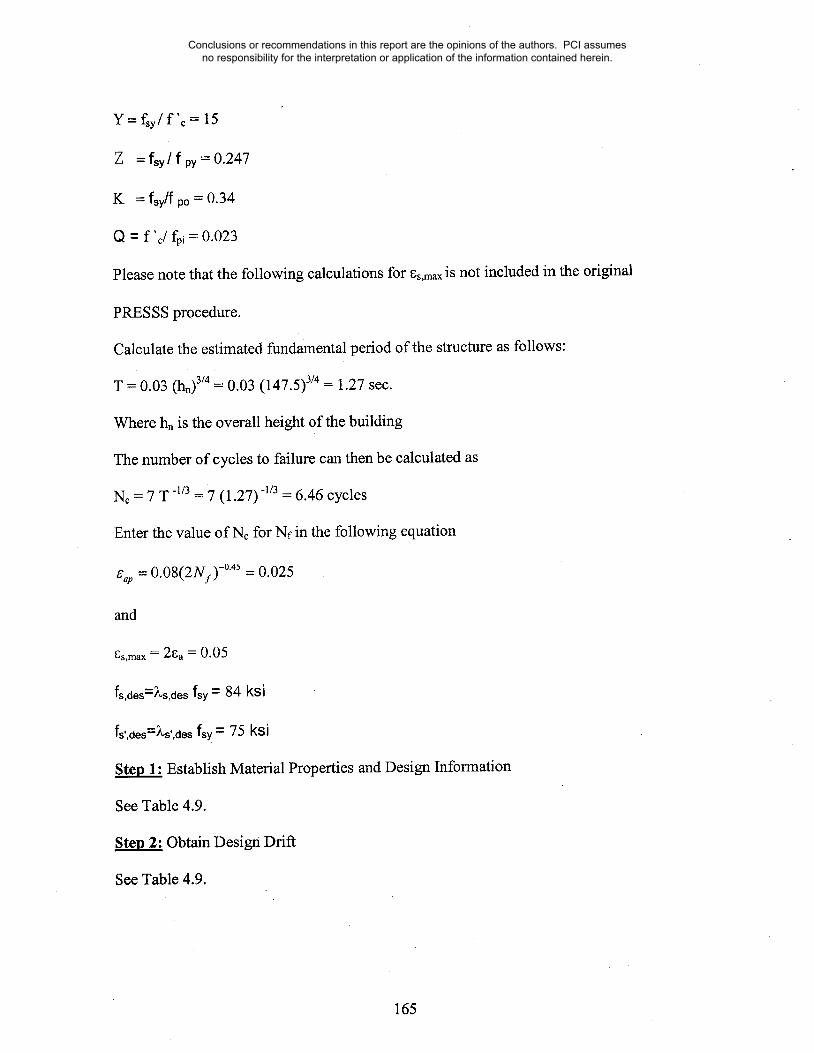
Y = fsy/f’c = 15
Z = fsy/f py= 0.247
K = fsy/f po = 0.34
Q = f "e/f~,~ = 0.023
Please note that the following calculations for es,m~x is not included in the original
PRESSS procedure.
Calculate the estimated fundamental period of the structure as follows:
T = 0.03 (hn)3/4 = 0.03 (147.5)3/4 = 1.27 sec.
Where h, is the overall height of the building
The number of cycles to failure can then be calculated as
Nc = 7 T -1/3 = 7 (1.27) -l/3 = 6.46 cycles
Enter the value of No for Nf in the following equation
~o~ = 0.08(2~Vs)-°45 = O.025
and
gs,max = 2ga = 0.05
fs,des=~,s,des fsy = 84 ksi
fs’,des’-~,s’,des fsy = 75 ksi
~ Establish Material Properties and Design Information
See Table 4.9.
Ste~ 2." Obtain Design Drit~
See Table 4.9.
165
Conclusions or recommendations in this report are the opinions of the authors. PCI assumes no responsibility for the interpretation or application of the information contained herein.

Ste~ 3: Estimate Frame Beam Dimensions
g0 = Lpu / hg = 7.09
Ste~ 4." Determine the Proportions of Moment Strength
~0 = 0.5 (Optimum solution calculated using the EXCEL Solver)
Ste~ 5." Estimate The Neutral Axis Parameter
rl~es = 0.13 (Optimum solution calculated using the EXCEL Solver)
~des ----0.5 l~ll"]Ses = 0.055
Ste~ 6." Calculate the Strain in the Pre-Stressing tendon at Odes
This step is a modified form of the PRESSS procedure to ensure that the post-tensioning
steel would not deform beyond yield
Ap _ 0d~ (0.5-r/~s) = 0.00094Asp- lpu’ ~
6"p = 6"pi + ASp = 0.0071
Check if
Let a’ =1
0.0071 < 0.0085 OK
fp,des = Ep I~p = 202 ksi
Let,
166
Conclusions or recommendations in this report are the opinions of the authors. PCI assumes no responsibility for the interpretation or application of the information contained herein.

R- f~y =0.3f p,des
Ste~ 7.- Calculate the Relative Locations of the Compression Force and the Neutral Axis
Let,
Ap;r’ - = 0.18% (Optimum Solution)
bghg
0.88( = - 23.5 in,bg-optimum 0.0018 X 22
Check if
0.45 Q = 1.03 %, OK (ACI 318-02 Provisions)
and
_ ~" IN+ Y(2~,ae,-2s’a~)t=0.13o.85/3, T ’
M,~,~ _ 0.5(1- fl~rla~) = 0.88Aphg f l~,aes 0)
288x12 = 0.88 in2l~ Ap = 0.88x 22x 202
and
167
Conclusions or recommendations in this report are the opinions of the authors. PCI assumes no responsibility for the interpretation or application of the information contained herein.

M,~ = (1- ~ - 0.5fl~r/,~)
A~ .h ~ A ~,,~ f ~y 1-co
288×12A~ =
1.8×22×1.4×60
=1.8
Ap R~,a~, (1- ~ - O.5 ~arla~ ) _ 0.85A~ 0.5(1_ flf/.~)(l_ 1)
Stel~ 8: Calculate the moment strength of the section at
0.5(1- fir/a=)
The objective function is equal to:
0.5(1-flf/~) + -~[~,~,u~(1-~-0.5fl~rl~)+2¢,~=(~-O.5flflu~)~ 0.5(1-fl~r/~)o9 =0
The EXCEL Solver is used to find the optimum solution by changing floes, co, and y Subjected to
The following constraints:
!) r ~ 21<desK
2) Sp < a’~py
3) ~/-< 0.45 Q
4) 0Ides)calculated -- 0Ides)assumed
(1"Ides)optimum "- 0.13
((D)optimum -- 0.5
(Y)optimum = 0.18 %
168
Conclusions or recommendations in this report are the opinions of the authors. PCI assumes no responsibility for the interpretation or application of the information contained herein.
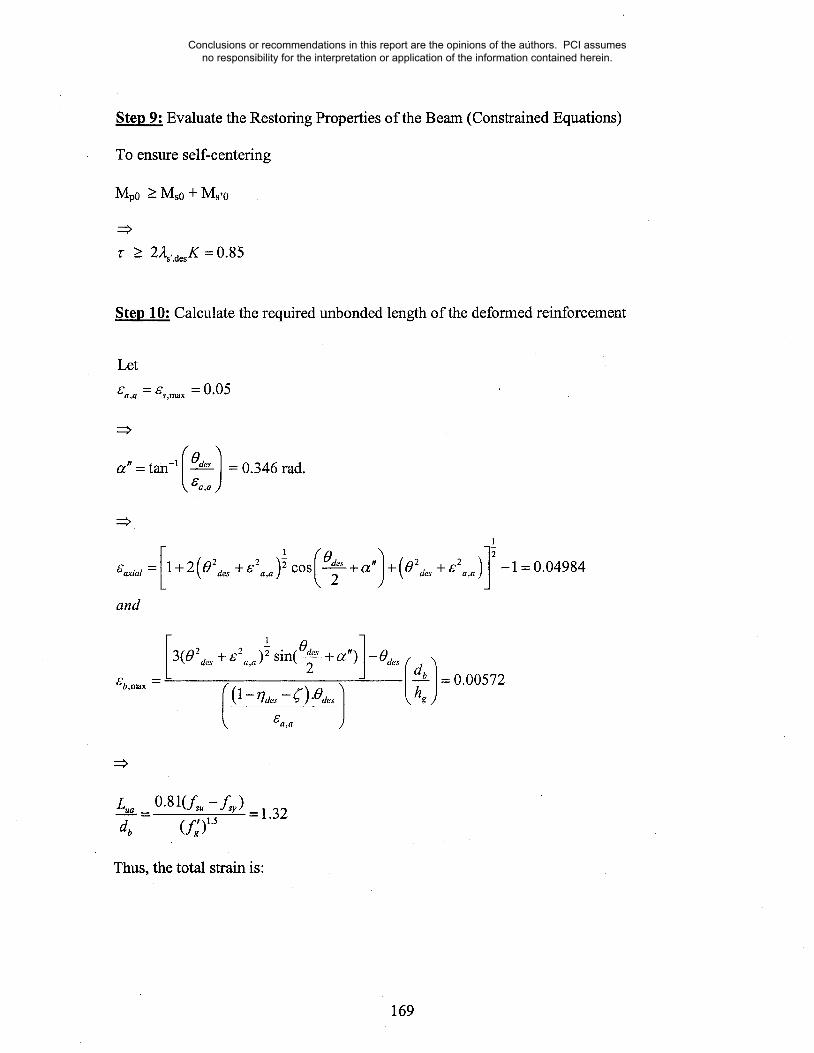
Ste~ 9". Evaluate the Restoring Properties of the Beam (Constrained Equations)
To ensure self-centering
Mp0 > Ms0 + Ms’o
22s,,a~K = 0.85
Step 10: Calculate the required unbonded length of the deformed reinforcement
Let
%° = ~s,m.x = 0.05
= 0.346 rad.
~,~g.~ 1+2 2 2 7 + 0 a~,+e ~,. -1=0.04984"~0 des + ~ a,a COS + O~t 2 2
and
Thus, the total strain is:
169
Conclusions or recommendations in this report are the opinions of the authors. PCI assumes no responsibility for the interpretation or application of the information contained herein.

~,m~ -- ~b,r~x
0.05 -- 0.00572 = 0.044
L.~ >_ (1-q~-£’)0~ -0.33h
For h = 22 in.
Lut > 22 x 0.33 = 7.26 in
Ls. = Lut - 2L.a
-- 7.26 - 2(1.35) = 4.62 in.
Provide Lsu = ~
Step 11: Confine Compression Re,on
lph = kph ~a~ hg
= 1×0.13x22 = 2.86 in.
Odes(rla~hg) -- Odes -- 0.018kph
0.003 Provide proper confinement to prevent spalling
4.5.3 Solution Using Proposed Design Charts
1. Go to Figure 3.14 and Determine:
fp,des / fpy = 0.84
~ fp,aes = 0.84 x 243 = 204.12 ksi
2. Go to Figure 3.4 and Determine:
170
Conclusions or recommendations in this report are the opinions of the authors. PCI assumes no responsibility for the interpretation or application of the information contained herein.

288x12 - [0.86 in2=:> Ap = 0.9x 22x 204.12
3. Go to Figure 3.6 and Determine:
1.77x22x1.4x60
4.5.4 Solution Using Proposed Design Equations
1. Calculate rld~
2. Calculate Agp
3. Check if e.p < ~’ ~py
4. Calculate fp,aes
r/d~ = --0.2fl1+0.3
= --0.2(0.85)+0.3 = 0.13
Ap _ 0,~es (0.5_r/d~s) = 0.00094AOOp- lpu ~
°~p = ~:pi + A~’p = 0.0071
Check if
OC’p __< O~’OPpy
Let a’ = 1
0.0071 < 0.0085 OK
fp,d~ = Ep e.p = 202 ksi
171
Conclusions or recommendations in this report are the opinions of the authors. PCI assumes no responsibility for the interpretation or application of the information contained herein.

5. For ~ -- Lpuih < 8
M~ - 1.125(,Oo.o4~,~x°’°371
Aphgfp,aes
00.04 = (-6.70d~ + 0.9)~(z7°°~+°°3)
= (-6.7 x 0.018 + 0.9) x 7.09(~’7×°’°~8+°’°3~ = 0.91
M~es _ E1.125 x 0 05°.°z7~1 x 0.91 = 0.92
288x12[0.85 in~~ Ap 0.92 x 22 x 202
6. For ~ = Lpuih < 8
= 0.882~0.04~s,max"0"034
~9"0.04 = (22.230a~ + 1.7)~-(3"4640a~+0’0216)
= (22.23 x 0.018 + 1.7) x 7.09"(3’464x0"018+°’0~16) = 1.782
Mdes = I0.882x 0.05-°’°~41xl.782 =1.74
:=> As = 288x12 =[1.07 in~[1.74x 22x 1.4x 60
The results of the four methods are compared in Table 4.10 below
172
Conclusions or recommendations in this report are the opinions of the authors. PCI assumes no responsibility for the interpretation or application of the information contained herein.

Table 4.10: Results Compared Using the Four Methods
Method
PRESSS Procedure
Non-DimensionalProcedure
Cha~s
Design Equations
Ap (in2)
0.89
0.88
0.86
0.85
As (in2)
1.04
1.04
1.05
1.07
(in.)
6.5
5
Remarks
Bending strainand grout
effects are notincluded
Bending strainand grouteffects areincluded
Bending strainand grouteffects areincluded
Bending strainand grouteffects areincluded
Use 6 - 1/2 in. diameter PT strands (Ap,provided = 0.92 in2), along with 2 #8 bars
(As,provided = 1.58 in2).
173
Conclusions or recommendations in this report are the opinions of the authors. PCI assumes no responsibility for the interpretation or application of the information contained herein.

Chapter 5
Summary and Conclusions
The Unbonded Post-Tensioned frame with Damping (hybrid frame) performed very well
in the PRESSS research program. It formed one part of the structural framing in the
PRESSS Phase III experimental building that was tested at the University of California at
San Diego. The hybrid frame was one of a total of five different seismic structural
systems proposed in the PRESSS report. The hybrid frame system has an important
feature that allows the designer to eliminate residual drift after an earthquake. This
feature is not available in the framing systems recognized in the 1997 UBC. The PRESSS
report outlined a series of step-by-step design procedures for hybrid frames.-
In this report, a set of new dimensionless parameters to replace current dimensional
parameters in the PRESSS calculation process were developed. Proposals for
modifications to same PRESSS procedures were also made. Parametric studies based on
this new non-dimensional formulation of the PRESSS design procedures were performed.
A large number of optimization problems (approximately 1200) were solved to achieve
optimum solution in each case.
Based on the results of the parametric study, a complete set of charts with non-
dimensional parameters were generated and simplified design equations were
recommended. These charts and equations would enable designers to perform the design
in fewer number of steps, while affording them the opportunity to see how changing one
or more parameters would affect the design.
It was observed from a preliminary nonlinear finite element (FE) analysis of a 3-D model
of a hybrid frame system [Hawileh, 2003], that the mild steel bars in a hybrid frame
174
Conclusions or recommendations in this report are the opinions of the authors. PCI assumes no responsibility for the interpretation or application of the information contained herein.
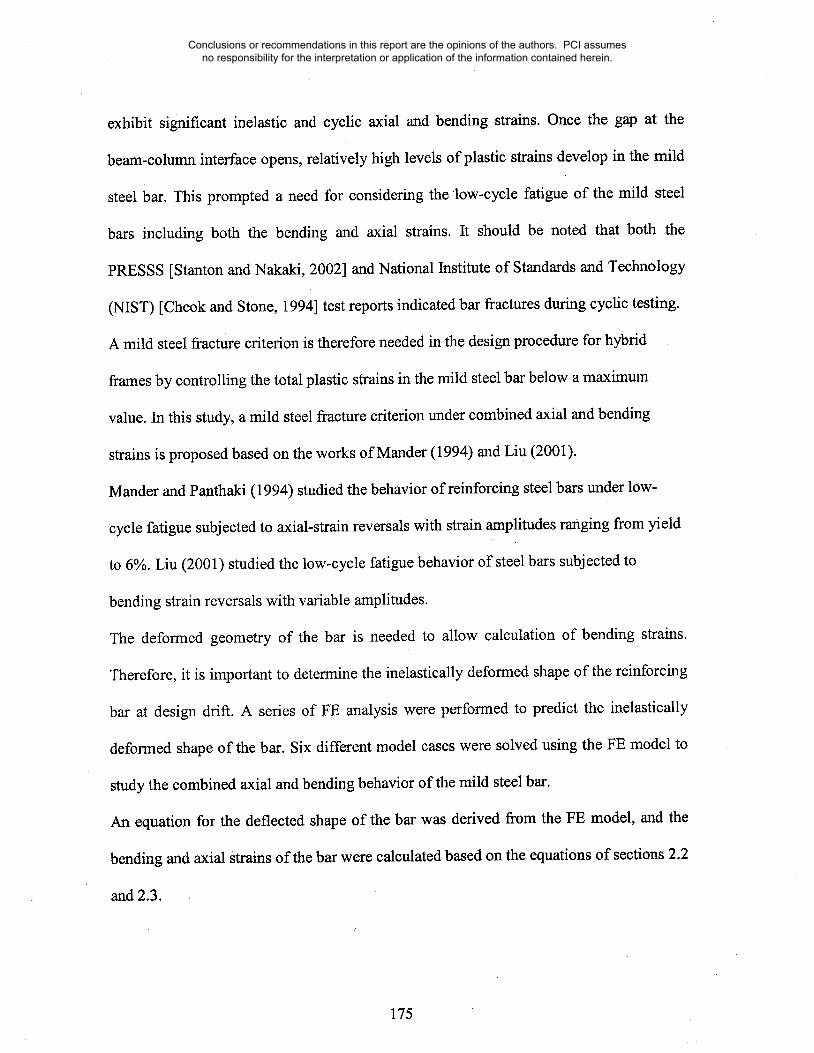
exhibit significant inelastic and cyclic axial and bending strains. Once the gap at the
beam-column interface opens, relatively high levels of plastic strains develop in the mild
steel bar. This prompted a need for considering the low-cycle fatigue of the mild steel
bars including both the bending and axial strains. It should be noted that both the
PRESSS [Stanton and Nakaki, 2002] and National Institute of Standards and Technology
(NIST) [Cheok and Stone, 1994] test reports indicated bar fractures during cyclic testing.
A mild steel fracture criterion is therefore needed in the design procedure for hybrid
frames by controlling the total plastic strains in the mild steel bar below a maximum
value. In this study, a mild steel fracture criterion under combined axial and bending
strains is proposed based on the works of Mander (1994) and Liu (2001).
Mander and Panthaki (1994) studied the behavior of reinforcing steel bars under low-
cycle fatigue subjected to axial-strain reversals with strain amplitudes ranging from yield
to 6%. Liu (2001) studied the low-cycle fatigue behavior of steel bars subjected to
bending strain reversals with variable amplitudes.
The deformed geometry of the bar is needed to allow calculation of bending strains.
Therefore, it is important to determine the inelastically deformed shape of the reinforcing
bar at design drift. A series of FE analysis were performed to predict the inelastically
deformed shape of the bar. Six different model cases were solved using the FE model to
study the combined axial and bending behavior of the mild steel bar.
An equation for the deflected shape of the bar was derived from the FE model, and the
bending and axial strains of the bar were calculated based on the equations of sections 2.2
and 2.3.
175
Conclusions or recommendations in this report are the opinions of the authors. PCI assumes no responsibility for the interpretation or application of the information contained herein.

A set of five design examples were prepared coveting low to high seismic zones using
the PRESSS and newly developed simplified design procedures. The results of the three
procedures (PRESSS, proposed design charts, and proposed design equations) were in
close agreement (within 10 %).
176
Conclusions or recommendations in this report are the opinions of the authors. PCI assumes no responsibility for the interpretation or application of the information contained herein.
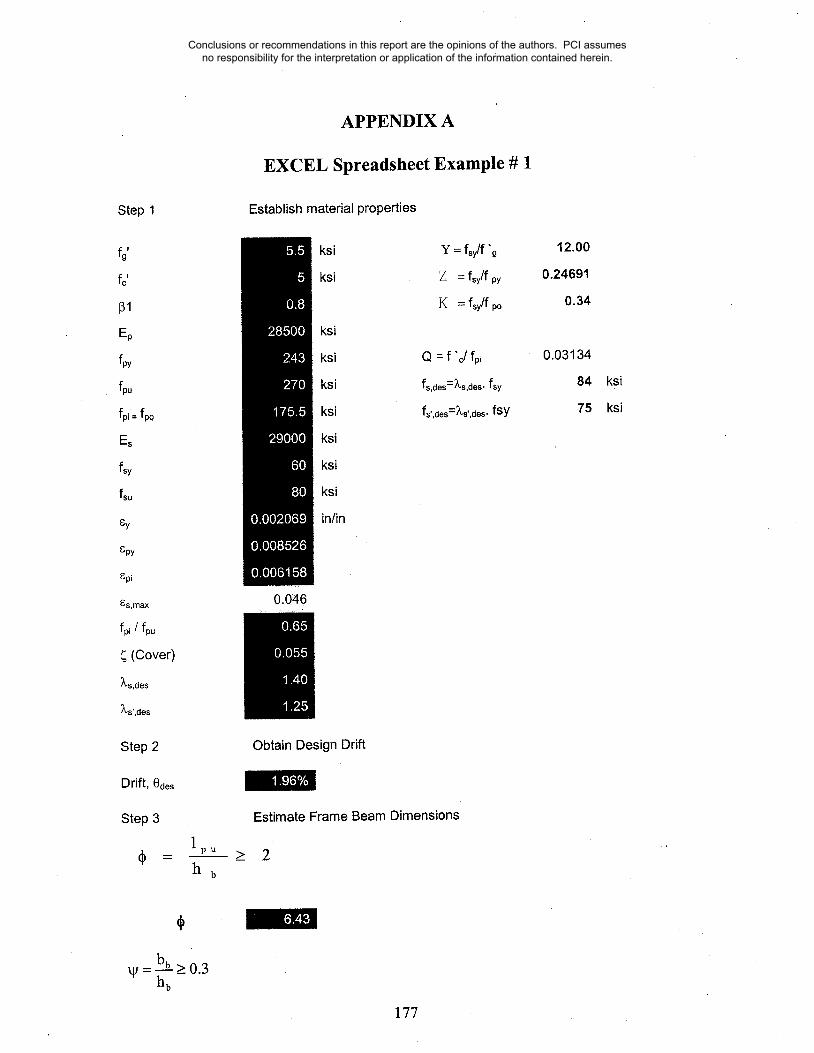
Step 1
fg
p~Ep
f~ofpi = fpo
Es
Sy
Spy
~pi
~s,rnax
fpi / fpu
~ (Cover)
~s,des
~,s’,des
Step 2
Drift, Odes
Step 3
~ - 1h b
APPENDIX A
EXCEL Spreadsheet Example # 1
Establish material properties
ksi Y = fsy/f "g 12.00
ksi Z = fsy/f py 0.24691
K = fsy/f po 0.34
ksi
ksi
ksi
ksi
ksi
ksi
ksi
in/in
Q = f "c/fpi
fs,des=~,s,des¯ fsy
fs,,des=Xs,,des. fsy
0,046
Obtain Design Drift
Estimate Frame Beam Dimensions
2
0.03134
84
75
ksi
ksi
bb _> 0.3~/ hb
177
Conclusions or recommendations in this report are the opinions of the authors. PCI assumes no responsibility for the interpretation or application of the information contained herein.

Step 7 Estimate The Neutral Axis Parameter
0.1375
C70-D70
Constraint = zero1.6E-
O9
Step 8 Calculate the elongation and stress in the prestressing tendon at eaes
A~:p= ~-~-(0,$ - qd.) =0.001104977
~p "-" I~pi -1-Al~p = 0.007262871 ksi
O°p ~ ~py
fp,des = 8p. Ep =
f p ,des
_ fp ,des
fpy
fp,des
207 ksi
Step 4 Determine the proportions of momentstrength
assume w
Mdes
fp,dosAphb
M des
fsy ’As ’L s,desh b
178
Conclusions or recommendations in this report are the opinions of the authors. PCI assumes no responsibility for the interpretation or application of the information contained herein.

Step 5
Estimate
Ap
Estimate Required required percentage of Tendon Area,
7Ap
bbhb
~s,d~.s (1 ~-- O~des)
T < 0.45Q=1.41 %
Step 6
As _ 7bbhb z
Estimate Required Mild Reinforcement Area, As
Step 9 Evaluate Restoring Properties of the beam section
Mpo >- Mso + M,~o
K0.85470085 0.00
Step 10
Pc,desades -- 0.85f’c bb
Calculate the neutral axis location from the concrete compression force
ades
~des = ~ades2hb
in
Pc,des(~des = --1.7f’chbbb
179
Conclusions or recommendations in this report are the opinions of the authors. PCI assumes no responsibility for the interpretation or application of the information contained herein.

Step 11 Calculate the moment strength of the section at edes
0.867573take 0.45/w to the left side of the equation
180
Conclusions or recommendations in this report are the opinions of the authors. PCI assumes no responsibility for the interpretation or application of the information contained herein.

References:
1. ANSYS theory manual, version 7.1, 2000
2. ANSYS training manual, 2001
3. ANSYS user manual, version 7.1, 2000
4. Stanton, John F. and Nakaki, Susan D. (2002). "Design Guidelines for Precast
Concrete Seismic Structural Systems", PRESSS Report No. 01/03-09, UW Report
No. SM 02-02, Seattle, WA 98195, February.
5. Cheok, G.S., Stone, W.C. and Nakaki, S.D. (1996). "Simplified Design Procedure for
Hybrid Precast Connections". Report No. NISTIR 5765, NIST, Gaithersburg, MD,
Feb.
6. Raynor, D.J., Lehman, D.E., and Stanton. J.F, (2002), "Bond-Slip Response of
Reinforcing Bars Grouted in Ducts", ACI Structural Journal, Vol. 99, No. 5, pp. 568-
577.
7. Mander, J.B., Panthaki, F.D., a., (1994), "Low-Cycle Fatigue Behavior of
Reinforcing Steel,"Journal of Materials in Civil Engineering, ASCE, Vol.6, No.4, pp.
453-468..
8. Chang, G.A. and Mander, J.B., (1994), "Seismic Energy Based Fatigue Damage
Analysis of Bridge Columns: Part II - Evaluation of Seismic Demand", Technical
Report NCEER-94-0013, Buffalo, New York.
9. FEMA368, 2001, "NEHRP Recommended Provisions for Seismic Regulations for
New Buildings and Other Structures: Part I - Provisions", Building Seismic Safety
Council, Washington, D.C.
181 ¯
Conclusions or recommendations in this report are the opinions of the authors. PCI assumes no responsibility for the interpretation or application of the information contained herein.

10. Chin Liu, Wen, 2001, "Low Cycle Fatigue of A36 Steel Bars Subjected to Bending
with Variable Amplitudes", Ph.D Thesis, State University of New York at Buffalo.
11. Hawileh, Rami, 2003, "Non-Linear Finite Element Analysis of Precast Hybrid Beam-
Column Connections Subjected to Cyclic Loads", Ph.D Thesis Proposal, University
of Wisconsin Milwaukee, Milwaukee, WI.
12. Collins, Jack A., 1993, "Failure of Materials in Mechanical Design: Second Edition",
Ohio State University, Columbus, OH.
13. S.K. Ghosh and David A. Fanella, Seismic and Wind Design of Concrete Buildings
based on 2000 ]BC, ASCE 7-98, and ACI 318-99 code, 2003.
14. Nakaki, S.D., Stanton, J.F. and Sritharan, S., (1999). "An Overview of the PRESSS
Five Story Precast Test Building". PCI Jo., 44(2), Mar.-Apr., pp. 28-39
15. Stone, W.C., Cheok, G.S., and Stanton, J.F., "Performance of Hybrid Moment-
Resisting Precast Beam-Column Concrete Connections, " ACI Journal, Vol. 92, No.
2, March-April 1995, pp. 229-249.
16. Pampanin, S., M.J.N., Priestley, and Sritharan, "Frame Direction Response", PRESSS
Phase 3: The Five-Story Precast Building (Vol. 3-4), Report No. SSRP-2000/08,
Department of Structural Engineering, University of Canterbury, 2000
17. Priestley, M.J.N,S. Sritharan, J.R. Conley, and S. Pampanin, S., "Preliminary Results
and Conclusions from the PRESSS Five-Story Precast Concrete Test Building", PCI
Journal, Vol. 44, No.6,1999,pp. 42-67.
18. Cheok, G.S. and Stone, W.C. (1994). "Performance of 1/3 Scale Model Precast
Concrete Beam-Column Connections Subjected to Cyclic Inelastic Loads - Report
No. 4". Report No. NISTIR 5436, NIST, Gaithersburg, MD, June.
182
Conclusions or recommendations in this report are the opinions of the authors. PCI assumes no responsibility for the interpretation or application of the information contained herein.

19. Cheok, G. and Lew, H.S. (1990), "Performance of 1/3 Scale Model Precast Concrete
Beam-Column Connections Subjected to Cyclic Inelastic Loads," NISTIR 4589,
NIST, Gaithersburg, MD, June, 1991.
20. Cheok, G.C., Stone W.C. and Lew, H.S. (1993), "Performance of 1/3 Scale Model
Precast Concrete Beam-Column Connections Subjected to Cyclic Inelastic Loads -
Report No. 3," NISTIR 5246, NIST, Gaithersburg, MD, August, 1993.
21. Pampanin, S., M.J.N., Priestley, and Sritharan, "Analytical Modeling of the Seismic
Behavior of Precast Concrete Frame Ductile Connections", Master Thesis,
Department of Structural Engineering, University of California, San Diego, 2000
22. Cheok, G.S., Stone, W.C. and Kunnath, S.k., (1998), "Seismic Response of Precast
Concrete Frames with Hybrid Connections", ACI Structural Joumal, Vol. 95, No. 5,
pp.527-539.
23. EI-Sheikh, M., Sause,R., Pessiki, S., Lu, L.W, Kurama, Y.,(1998)," Seismic
Analysis, Behavior and Design of Unbonded Post-Tensioned Precast Concrete
Frames", PRESSS Report No. 98/04, LU Report No. EQ-97-02, Lehigh University,
Bethlehem, Pennsylvania.
24. Priestley, M.J.N. and MacRae, G., (1994), " Precast Post-Tensioned Ungrouted
Concrete Beam-Column Subassemblage Tests", Structural Systems Research Project,
University of California, San Diego, Report No. SSRP-94/10.
25. Stanton, J.F., W.C., and Cheok, G.S., (1997), A Hybrid Reinforced Precast Frame for
Seismic Regions, PCI Journal, Vol. 42, No. 2, pp.20-32.
26. Priestley,. M.J.N.,(2002), "Direct Displacement-Based Design of PrecastiPrestressed
Concrete Buildings.", PCI Journal, Vol. 47, No.6, pp. 66-79.
183
Conclusions or recommendations in this report are the opinions of the authors. PCI assumes no responsibility for the interpretation or application of the information contained herein.

27. Pampanin, Stefano (2000), "Analytical Modeling of thr Seismic Behavior of Precast
Concrete Frame Ductile Connections", Master Thesis, University of California, San
Diego.
28. Beer, F.P., and Johnston, E. Russel, and DeWolf "Mechanics of Materials", Third
Edition, (2002).
29. ACI T1.2-03, "Special Hybrid Moment Frames Composed of Discretely Jointed
Precast and Post-Tensioned Concrete Members (T1.2-03) and Commentary (T1.2R-
03)".
30. ACI 318-02, "Building Code Requirement for Structural Concrete (ACI 318-02) and
Commentary (ACI 318R-02)".
31. Mander, J.b., and Priestley, M.J., ’Theoretical Stress-Strain Model for Confined
Concrete", Journal of Structural Engineering, Vol. 114, No. 8, August, 1988, pp.
1804-1826.
184
Conclusions or recommendations in this report are the opinions of the authors. PCI assumes no responsibility for the interpretation or application of the information contained herein.