simplified indexes for the seismic vulnerability of ... indexes for the seismic vulnerability of...
TRANSCRIPT
1
Simplified indexes for the seismic vulnerability of
ancient masonry buildings
P.B. Lourenço1 and J.A. Roque2
1 Abstract
This paper presents a contribution for the safety assessment of historical masonry buildings under
seismic loading. Three different simplified safety indexes (in-plan area ratio, area to weight ratio and base shear
ratio) are analyzed, taking into account a large sample of fifty-eight Portuguese churches. The sample of building
has been organized according to the seismic zonation, from high to low seismicity. The results indicate that
valuable information can be obtained from simplified methods, with respect to performing a first screening and
to prioritizing further, deeper investigations. A new proposal is made regarding the combined usage of two of the
indexes.
Keywords:
Masonry; Ancient buildings; Churches; Simplified methods; Seismic vulnerability
2 Introduction
Ancient masonry structures are particularly vulnerable to dynamic actions, with a special focus on
seismic action. Countries from the Mediterranean basin are particularly at risk due to the large number of ancient
monuments and dwellings. Due to the ageing process as well as to the environmental factors, many cultural
heritage buildings, as structures planned and constructed in the past, result to be vulnerable to dynamic loads,
which may unpredictably induce a collapse of a portion or drive the whole structure to a rapid failure. But the
high vulnerability of historical masonry buildings to seismic actions is mostly due to the absence of adequate
1 Associate Professor of Civil Engineering, University of Minho, Azurém, P – 4800-058 Guimarães, Portugal, Tel + 351 510 200, Fax +351 253 510217, E-mail [email protected]
2 PhD Student, University of Minho. Lecturer at Polytechnic Institute of Bragança.
2
connections between the various parts (masonry walls, timber beams in the floors and timber beams in the roof).
This characteristic leads to overturning collapse of the perimeter walls under seismic horizontal acceleration.
An analysis of the damage survey of historical masonry buildings for the Umbria-Marche earthquake
[1] shows that the problem is generalized and that structural typologies, as well as associated type and
distribution of damage, are fairly recurring. Vulnerability may be reduced through retrofitting/protection to better
resist the seismic demand. Anti-seismic action requires the knowledge of seismic site response, the definition of
the seismic load (a rather challenging issue) and the knowledge of the characteristics of existing buildings. This
is a gigantic task, requiring large funds and considerable large time-span, but several efforts have been made to
create damage scenarios and to prioritize retrofitting works, e.g. [2,3].
The approach sought here is much more simple, fast and low cost, being based on a simplified
geometric approach for immediate screening of the large number of buildings at risk. The objective is to detect
historical buildings at possible risk for subsequent more detailed study using advanced computer simulations,
together with adequate material and structural characterization, see [4,5] for recommendations. In case of urban
areas, and in spite of the diversity, a common matrix can usually be established for the seismic areas, more
structural than technological. This consists of low building height (up to three stories), moderate spans
(maximum of four or five meters) and large thickness of the walls (less than 1/7 of the height) [6].
The paper concentrates in churches, given: (a) their intrinsic greater structural vulnerability due to open
plan, greater height to width ratio and, often, the presence of thrusting horizontal structures from vaulted ceilings
and timber roof; (b) the ample geometry survey drawings and documentation available. Moreover, in earthquake
prone countries, churches have already been subjected to earthquakes, and sometimes survived them, meaning
that they are testimonies and they represent full-scale testing data. This fact, permits to discuss and, generally, to
accept that these ancient structures have been adjusted to local seismicity.
Fifty-eight Portuguese churches have been selected and analyzed with three simplified expedite
methods, namely in-plan area ratio, area to weight ratio and base shear ratio. The churches are located in
different seismic zones aiming at verifying the likely existence of a correlation between structural characteristics
and seismic zone.
3 Simplified Methods of Analysis
The analysis of historical masonry constructions is a complex task, namely because: (a) geometry data
is missing; (b) information about the inner core of the structural elements is also missing; (c) characterization of
3
the mechanical properties of the materials used is difficult and expensive; (d) large variability of mechanical
properties, due to workmanship and use of natural materials; (e) significant changes in the core and constitution
of structural elements, associated with long construction periods; (f) construction sequence is unknown;
(g) existing damage in the structure is unknown; (h) regulations and codes are non-applicable. Moreover, the
behavior of the connections between masonry elements (walls, arches and vaults) and masonry elements and
timber elements (roofs and floors) is usually unknown. All these factors, indicate that the quantitative results of
structural analysis must be looked at with reserves, in the case of vertical loading and, even more carefully, in
the case of seismic action. Therefore, more complex and accurate methods do not correspond necessarily to more
reliable and better analyses.
The usage of simplified methods of analysis usually requires that the structure is regular and symmetric,
that the floors act as rigid diaphragms and that the dominant collapse mode is in plane shear failure of the walls
[7]. In general, these last two conditions are not verified by ancient masonry structures, meaning that simplified
methods should not be understood as quantitative safety assessment but merely as a simple indicator of possible
seismic performance of a building. Here, the following simplified methods of analysis and corresponding
indexes are considered:
- Index 1: In-plan area ratio;
- Index 2: Area to weight ratio;
- Index 3: Base shear ratio.
These methods can be considered as an operator that manipulates the geometric values of the structural
walls and produces a scalar. As the methods measure different quantities, their application to a large sample of
buildings contributes to further enlightening of their application. As stated above, a more rigorous assessment of
the actual safety conditions of a building is necessary to have quantitative values and to define remedial
measures, if necessary.
3.1 Index 1: In-plan area ratio
The simplest index to assess the safety of ancient constructions is the ratio between the area of the
earthquake resistant walls in each main direction (transversal x and longitudinal y, with respect to the church
nave) and the total in-plan area of the buildings. According to Eurocode 8 [8], walls should only be considered as
earthquake resistant if the thickness is larger than 0.35 m, and the ratio between height and thickness is smaller
than nine. The first index γ1,i reads:

4
γ1,i = Awi / S [-] (1)
where Awi is the in plan area of earthquake resistant walls in direction “i” and S is the total in plan area of the
building.
The non-dimensional index γ1,i is the simplest one, being associated with the base shear strength.
Special attention is required when using this index as it ignores the slenderness ratio of the walls and the mass of
the construction. Eurocode 8 [8] recommends values up to 5-6% for regular structures with rigid floor
diaphragms. In cases of high seismicity, a minimum value of 10% seems to be recommended for historical
masonry buildings [7]. For simplicity sake, high seismicity cases can be assumed as those where the design
ground acceleration for rock-like soils is larger than 0.2 g.
3.2 Index 2: Area to weight ratio
This index provides the ratio between the in plan area of the earthquake resistant walls in each main
direction (again, transversal x and longitudinal y) and the total weight of the construction, reading:
γ2,i = Awi / G [L2F-1] (2)
where Awi is the in plan area of earthquake resistant walls in direction “i” and G is the quasi-permanent vertical
action.
This index is associated with the horizontal cross-section of the building, per unit of weight. Therefore,
the height (i.e the mass) of the building is taken into account, but a major disadvantage is that the index is not
non-dimensional, meaning that it must be analyzed for fixed units. In cases of high seismicity, a minimum value
of 1.2 m2/MN seems to be recommended for historical masonry buildings [7].
3.3 Index 3: Base shear ratio
Finally, the base shear ratio provides a safety value with respect to the shear safety of the construction.
The total base shear for seismic loading (VSd,base = FE) can be estimated from an analysis with horizontal static
loading equivalent to the seismic action (FE = β × G ), where β is an equivalent seismic static coefficient related
to the design ground acceleration. The shear strength of the structure (VRd,base = FRd) can be estimated from the
5
contribution of all earthquake resistant walls FRd,i = ∑ Awi × fvk, where, according to Eurocode 6 [9], fvk = fvk0 +
0.4 σd. Here, fvk0 is the cohesion, which can be assumed equal to a low value or zero in the absence of more
information, σd is the design value of the normal stress and 0.4 represents the tangent of a constant friction angle
φ, equal to 22º.
The new index γ3 reads:
γ3,i = FRd,i / FE [-] (3)
If a zero cohesion is assumed (fvk0 = 0), γ3,i is independent from the building height, reading:
γ3,i = VRd,i / VSd = Awi / Aw × tanφ / β (4)
but for a non-zero cohesion, which is most relevant for low height buildings, γ3,i reads:
γ3,i = VRd,i / VSd = Awi / Aw × [tanφ + fvk0 / ( γ × h )] / β (5)
where Awi is the in plan area of earthquake resistant walls in direction “i”, Aw is the total in plan area of
earthquake resistant walls, h is the (average) height of the building, γ is the volumetric masonry weight, φ is the
friction angle of masonry walls and β is an equivalent static seismic coefficient. Here, it is assumed that the
normal stress in the walls is only due to their self-weight, i.e. σd = γ × h, which is on the safe side and is a very
reasonable approximation for historical masonry building, usually made of very thick walls.
Moreover, assuming a tangent of the friction angle in the range of 0.4, a value of the cohesion fvk0 in the
range of 0.1 N/mm2, and a volumetric weight γ equal to 20 kN/m3 (2 × 10⁻⁵ N/mm3), the modified value of tanφ
in Eq. (5) reads tanφ + fvk0 / ( γ × h ) = 0.4 + 0.1 / (2 × 10⁻⁵ × h). This means that the contribution of the cohesion
is very large (for a height h equal to 5.0 m, tanφ + fvk0 / ( γ × h ) equals 1.4, for 10.0 m, it equals 0.9, and for
20.0 m, it equals 0.65) and Eq. (5) must be used rather carefully. In the rest of this paper, zero cohesion will be
assumed as a conservative value.
This non-dimensional index considers the seismicity of the zone, taken into account in β. The building
will be safer with increasing ratio (earthquake resistant walls/weight), i.e. larger relation (Awi / Aw) and lower
heights. For this type of buildings and action, a minimum value of γ3,i equal to one seems acceptable.
6
3.4 Preliminary Comparative Analysis
Eqs. (1-4) can be recast in a similar format as a function of the ratio (Awi / Aw), which allows direct
comparison between the different methods, as
Index 1: γ1,i = Awi / S = Awi / Aw × Aw / S = Awi / Aw × k1 [L2/L2]
Index 2: γ2,i = Awi / G = Awi / Aw × 1 / (γ × h) = Awi / Aw × k2 [L2/F]
Index 3: γ3,i =VRd, i / VSd = Awi / Aw × tanφ / β = Awi / Aw × k3 [F/F] (6)
k1 = Aw / S ; k2 = 1 / (γ × h) ; k3 = tanφ / β
Here, it is stressed that the ratio (Awi / Aw) represents the percentage of earthquake resistant walls in a given
direction in relation to the total area of earthquake resistant walls in the building.
The new expressions for the scalar indexes indicate that they are all linearly dependent on the ratio
(Awi / Aw). This ratio provides direct information about the in plan stiffness of the structure along each main
direction and it is usually accepted that the sum of the relations (Awi / Aw) for the two orthogonal directions can
be larger than the unit value, due to superposition of the areas in the two directions [7].
The indexes depend linearly also in the following quantities: (a) ratio between total area of earthquake
resistant walls and total in plan area of the building (Index 1); (b) height of the building (Index 2); (c) ratio
between friction and equivalent seismic static coefficient (Index 3). This stresses the fact that the indexes
measure rather different quantities and can hardly be compared between them. Index 2 is dimensional, which
means that it should be used with particular care. Index 1 and Index 2 are independent of the design ground
acceleration. Therefore, assuming that the buildings must have identical safety, these indexes should be larger
with increasing seismicity. On the other hand, Index 3 should be constant in different seismic zones, as it
considers the effect of seismicity. Finally, Index 3 format is close to the traditional safety approach adopted for
structural design.
4 Investigation Using Portuguese Churches
The investigation presented here included the application of the simplified methods to a sample of
Portuguese churches, with the following objectives: (a) Validate the hypothesis of an empirical relation of the
ancient builders, able to define an expedite preliminary assessment of seismic vulnerability of historical masonry
buildings; (b) Validate the hypothesis of an empirical relation between architectural-structural characteristics of
7
historical masonry buildings and seismicity; (c) Prioritize further investigations and possible remedial measures
for the selected sample; (d) Extrapolate, from the results on the sample, the seismic vulnerability of ancient
masonry buildings in Portugal.
The sample is made of fifty-eight churches selected according to the Portuguese seismic zonation [10],
see Figure 1, and to the availability of information at the Database of Architectural Heritage from the General
Directorate of Buildings and National Monuments, partly available in [11]. Portuguese zonation includes four
zones (A to D), being the design ground acceleration for zone A and rock-like soils equal to 0.27 g for Type 1
spectra (moderate magnitude and close epicenter) and 0.16 g for Type 2 spectra (large magnitude and far away
epicenter). For zones B, C and D, the seismic action is reduced by 70%, 50% and 30%, respectively. The sample
includes twenty-five churches for the higher seismicity zone (A) and eleven churches for each lower seismicity
zone (B, C and D).
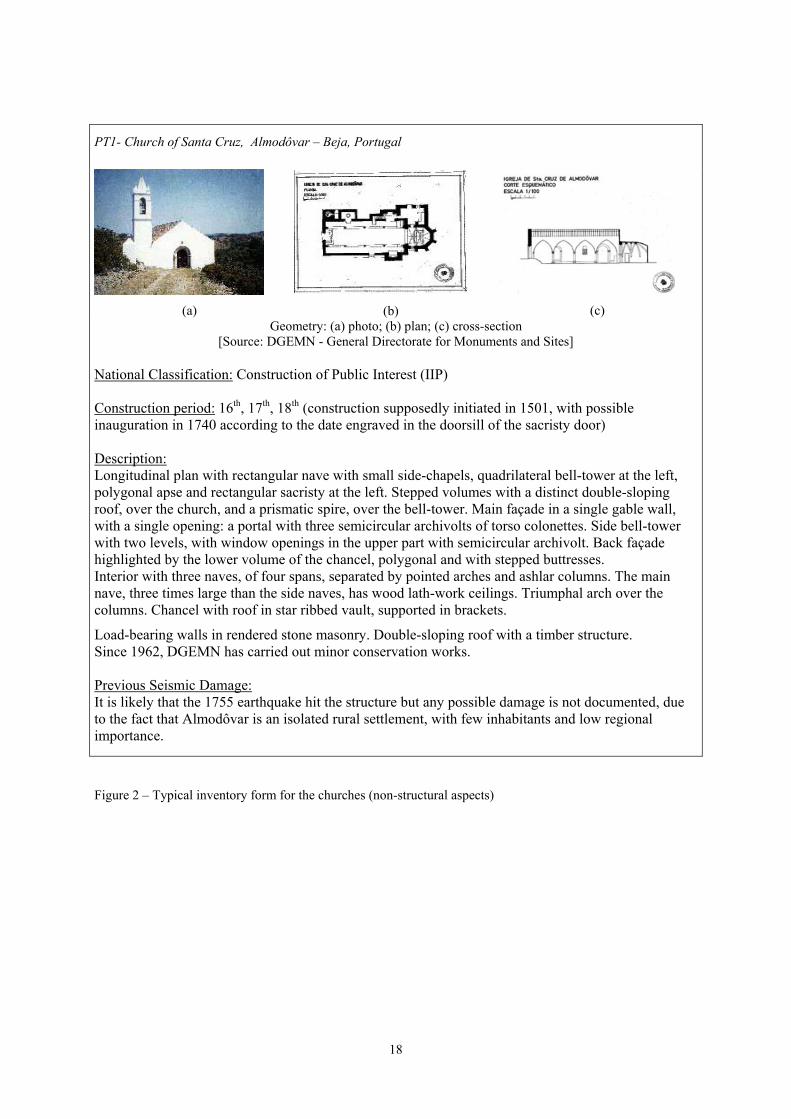
The work was organized so that, for each church, an inventory form was filled including the
classification, construction date, short description and reported previous seismic damage (if any), see Figure 2. In
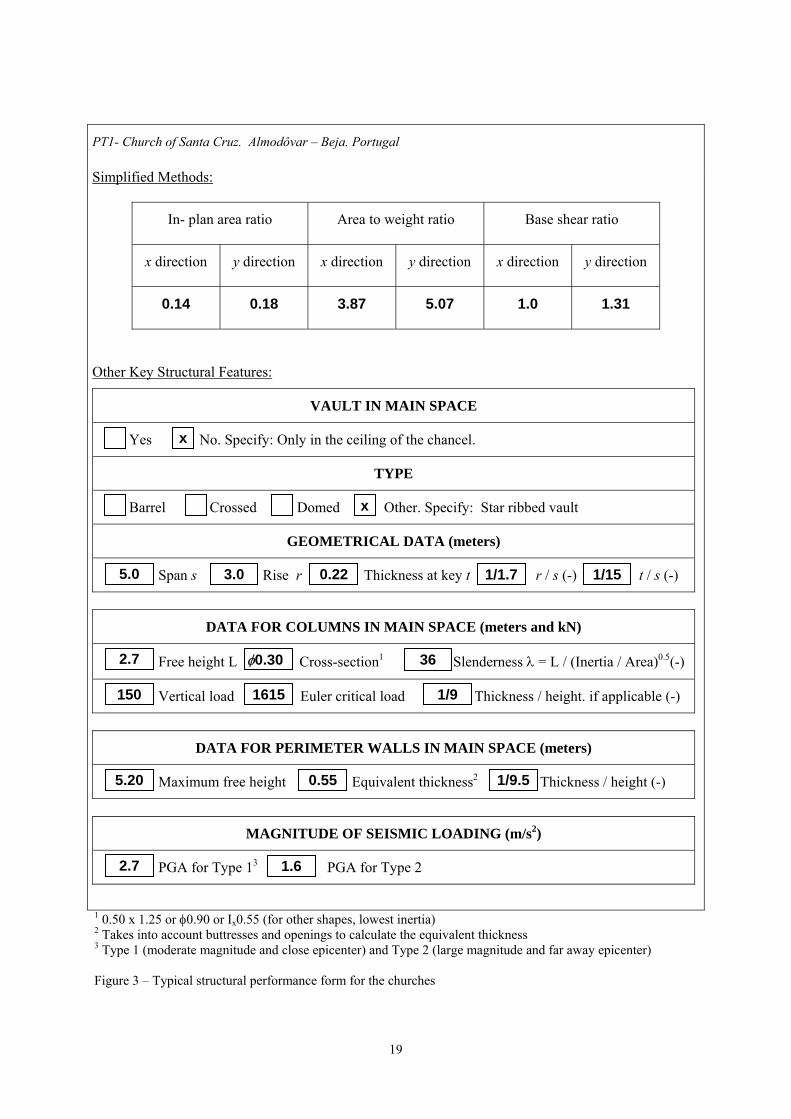
addition, a structural performance form was also prepared, incorporating the most relevant parameters, see
Figure 3.
4.1 Global Analysis of Results
For the application of the simplified analysis methods, it was assumed that all the masonry materials
were similar, the volumetric weight of masonry was 20 kN/m3, the weight of roofs was equal to 2.0 kN/m2 and
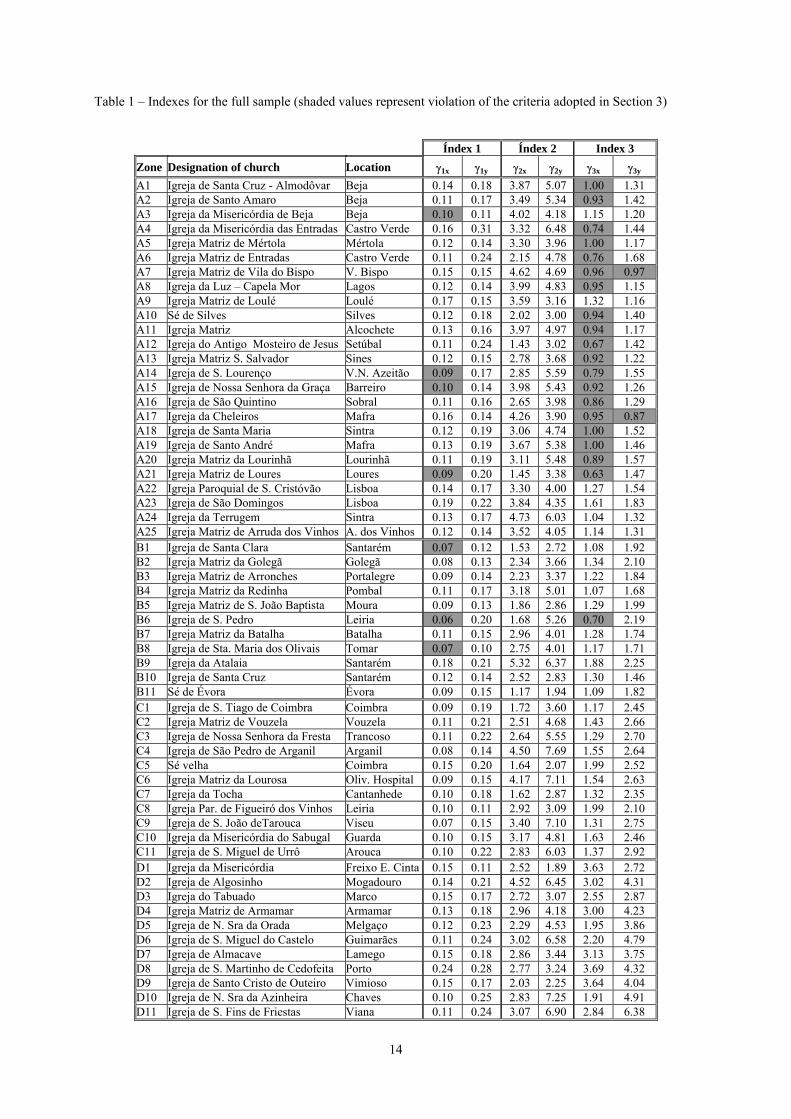
the β coefficient was equal to 0.22 [10]. Table 1 gives the values of three indexes for the entire sample, see [12]
for a complete description. The shaded cells indicate violation of the conditions provided in Section 3, namely
γ1,i ≤ 10%, γ2,i ≤ 1.2 MN/m2 and γ3,i ≤ 1.0. For indexes 1 and 2, the seismicity is taken into account by
multiplying the threshold by the seismicity coefficient α according to the zone A, B, C and D, respectively equal
to 1.0, 0.7, 0.5 and 0.3.
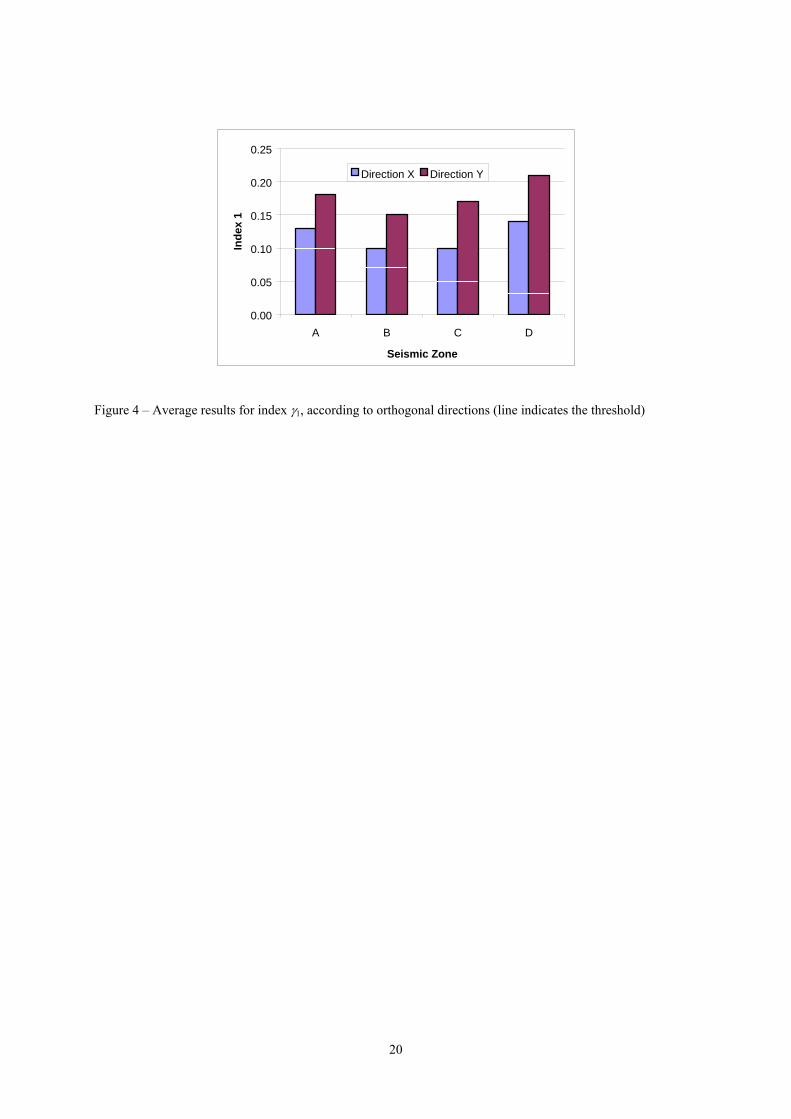
Index γ1 indicates a unexpected variation for the churches, because the average values exhibit minor
differences according to the seismicity, see Figure 4, contrarily to the expected dependency (γ1,A > γ1,B > γ1,C >
γ1,D). On average, the adopted criterion is not violated but, individually, four churches (16%) in zone A and three
churches (27%) in zone B, violate the adopted criterion, see Table 1. As expected, all cases that might require
further investigation are due to a deficient earthquake resistance along the transversal direction of the church
nave (direction x).

8
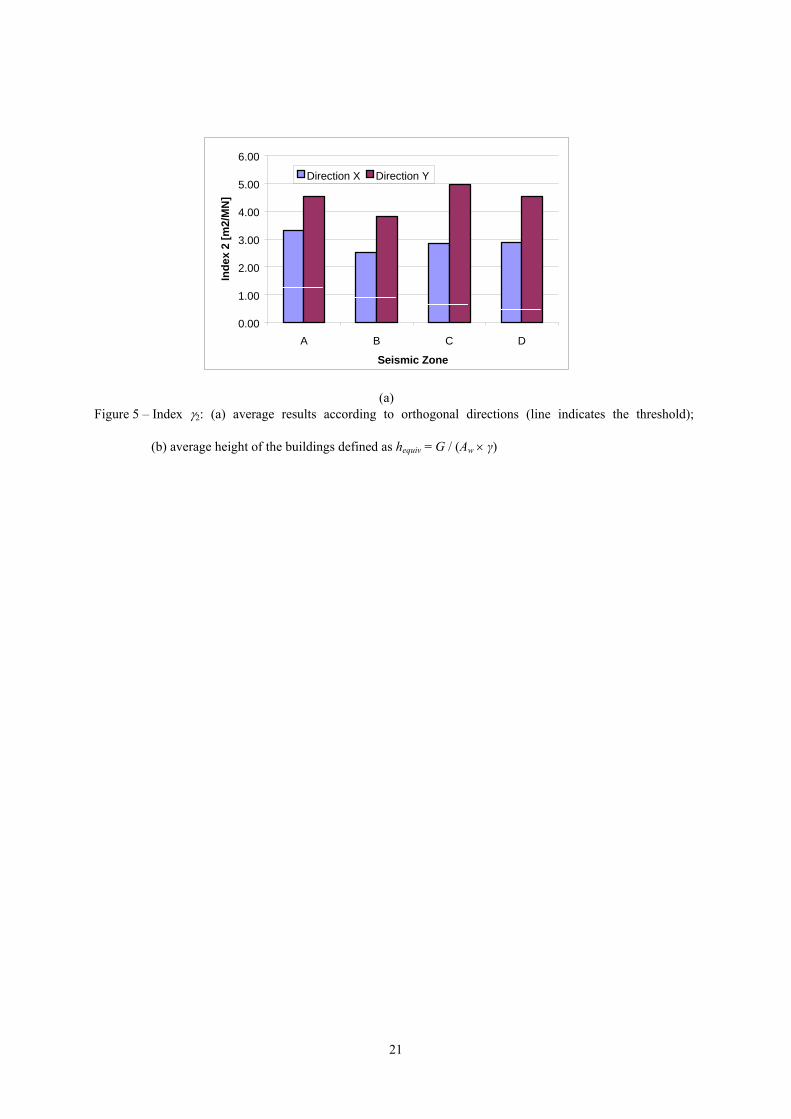
Index γ2, although being inversely proportional to the height of the buildings, presents a situation similar
to Index 1. Again, the calculated values are independent of the seismic zone, which is partly associated with the
fact that the height of the buildings is not decreasing with increasing seismicity, see Figure 5a. It is also
interesting to confirm the early statement that vertical loading is mostly due to self-weight of the walls, see
Figure 5b. The fact that not a single building violates the criterion proposed by [7] and adopted here, see Table 1,
seems to indicate that the threshold needs revision and is in conflict with Index 1.
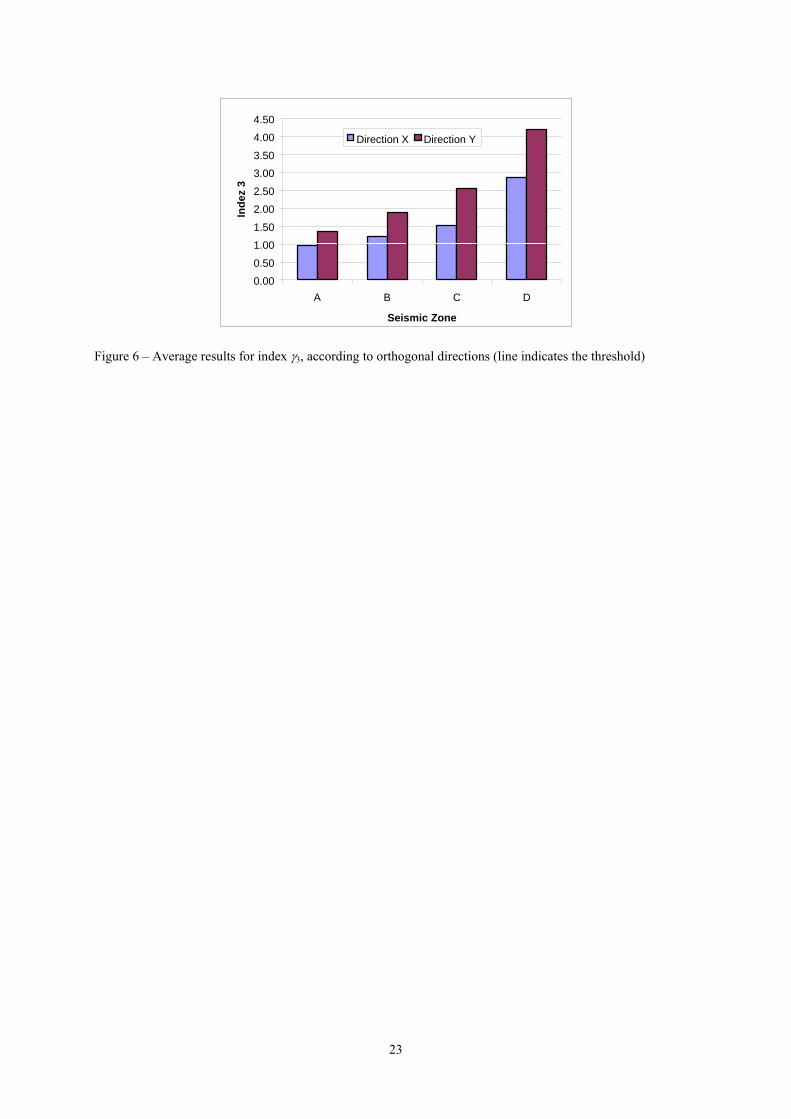
Index γ3, as a direct result from the constant values of indexes 1 and 2, exhibits increasing values with
decreasing seismicity, see Figure 6. On average, index γ3 is on the verge of violation for the adopted criterion of
zone A, but adequate for the other zones. Individually, seventeen churches (68%) in zone A and one church (9%)
in zone B, violate the adopted criterion. Again, almost all cases that might require further investigation are due to
a deficient earthquake resistance along the transversal direction of the church nave (direction x). Moreover,
Index 3 is clearly in conflict with the other two indexes, indicating that a new proposal for criteria violation is
needed. As stressed before, a value of zero was adopted for the cohesion, if a value of 0.10 N/mm2 is adopted for
the cohesion all churches fulfill the adopted criterion.
4.2 Proposal for the Usage of Simplified Indexes
Index 1 is independent from the height, which is considered a major drawback. Therefore, only Index 2
and 3 are further analyzed. The comparison between γ2 and γ 3 is equivalent to compare (1 / h) and (1 / β), see
Eq. (6), or height and seismicity, if cohesion is ignored. These quantities are clearly not comparable and,
according, to the results of the present paper seem uncorrelated. In order to take the value of the height h of the
building into account, the following approach is suggested:
1. Assume that the criterion for γ3 must be fulfilled. This results in a minimum value of γ3,i min equal
to the unit value. Introducing Eq. (4), it is possible to obtain a minimum ratio of walls as
γ3,i min = 1.0 ⇔ (Awi / Aw )min × tanφ / β = 1.0 ⇔ (Awi / Aw)min.= β / tanφ (7)
Introducing this result in Eq. (2), the minimum value of γ2,i min reads
γ2,i min = (Awi / Aw)min × 1 / (γ × h) = β / (γ × h × tanφ) (8)

9
Finally, assuming γ equal to 20 kN/m3, tanφ equal to 0.4 and β equal to 0.22 α, the minimum value
of γ2,i min can be simplified to
γ2,i min = 27.5 α / h [m2/MN] (9)
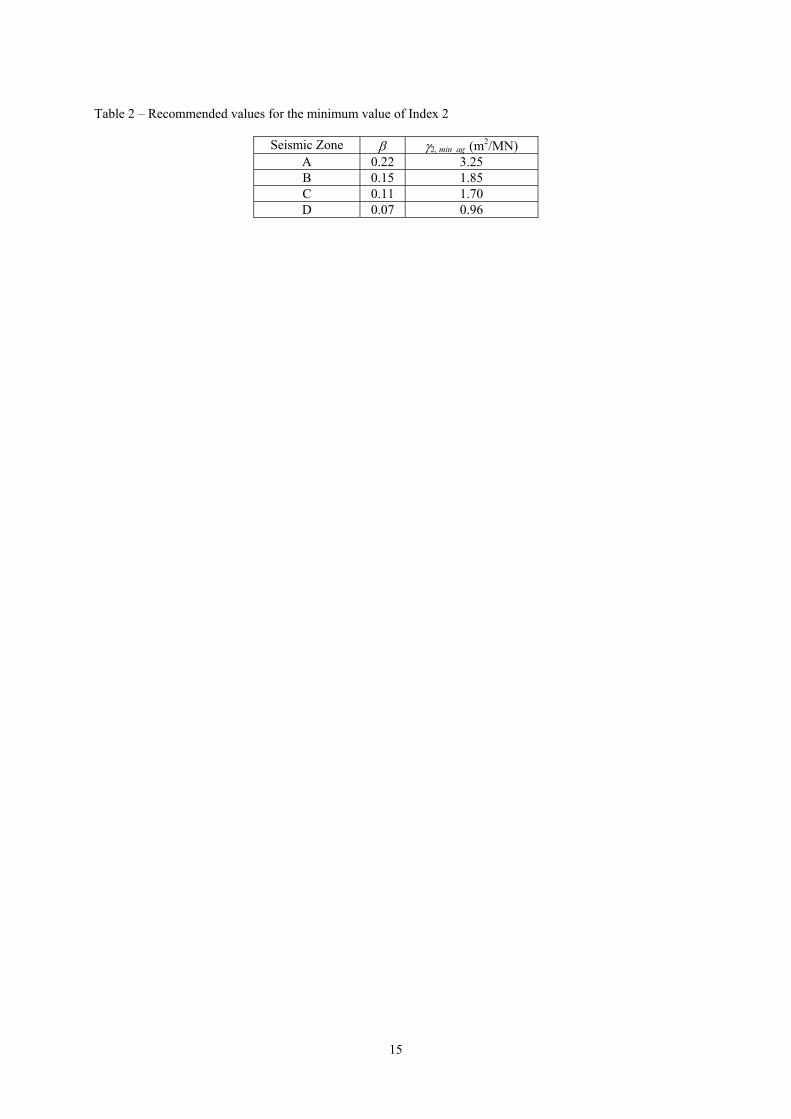
2. Assume that the average value of the height of the buildings in a given seismic zone is correct as a
result of the experience of the ancient builders or the earthquake damage, subsequent iterative
correction of geometry. For the sample of churches adopted in the present study, the equivalent
height of the buildings is shown in Figure 5b, and reads 8.5, 10.4, 8.2 and 8.6 m, respectively for
seismic zones A, B, C and D. With these values of average building height, the values obtained for
γ2,i min_ag are given in Table 2. These results indicate that the value proposed in [7] for high
seismicity cases seems too low.
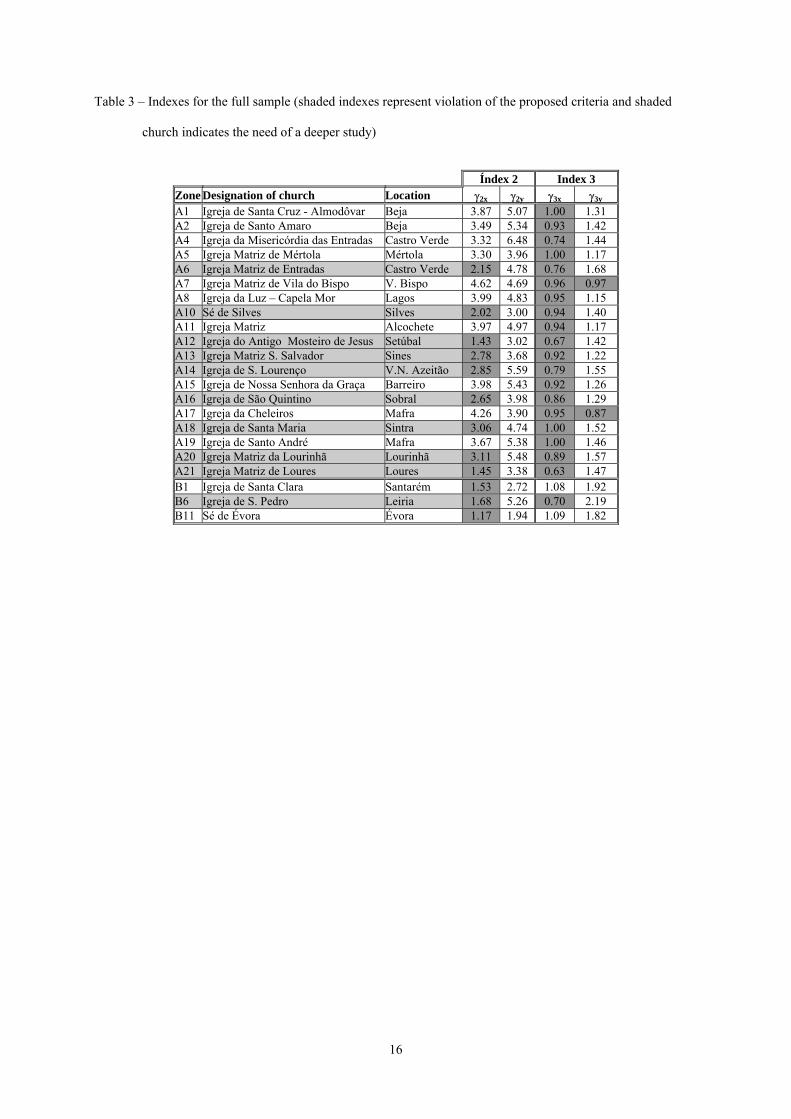
The proposed strategy to perform a preliminary screening and to prioritize deeper studies in historical
masonry structures in earthquake prone countries is to adopt as criteria simultaneously Index 2 and Index 3, such
as that γ2 > γ2, min_αγ and γ3 > 1.0. It is stressed that: (a) the first criterion is different than imposing a maximum
height to the building, because both the walls, the height and the seismicity are involved in the inequality; (b) the
second criterion only takes into account the height of the building if cohesion is different than zero and,
therefore, might provide unreliable results. Application of this strategy to the present sample, leads to the results
shown in Table 3, where 10 churches out of the original 58 sample deserve deeper investigations. Nine churches
(36% of the sample) are located in a high seismicity zone, which seems to reveal a dangerous situation for the
country architectural heritage.
5 Conclusions
This paper presents an investigation about the possibility of using simplified methods of analysis and
simple indexes as indicators for fast screening and decision to prioritize deeper studies in historical masonry
buildings and assess vulnerability to seismic actions. These indexes are based mostly on the in plan dimensions
and height of the buildings. The simplified methods indicate that, in Portugal, the average in plan area of
earthquake resistant walls and average height are independent of the seismicity. This puzzling feature can be
related to the short memory of the ancient builders and the fact that major earthquakes in Portugal have rather
long return periods (over 200 years).
10
In general, the longitudinal direction of the buildings (y) exhibits much lower vulnerability than the
transversal direction (x). For the buildings located in the higher seismicity zone (design ground acceleration of
0.27 g), 36% of sample requires remedial measures or, at least, deeper investigations. In medium and low
seismicity zones, only one building (3% of the sample) was found vulnerable.
A proposal for the usage of simplified methods was made, taking into consideration the in plan area of
the building, its height and seismicity, with the simultaneous verification of two indexes, one related to ratio of
in plan area and weight (γ2), and another related to the maximum base shear force (γ3), such that γ2 > γ2, min_ag and
γ3 > 1.0. Here, γ2, min_ag is a tabulated value function of the local experience of builders and seismicity, ranging
between 0.95 and 3.25 m2/MN for the Portuguese reality.
Acknowledgements
The authors gratefully acknowledge the support of the European-Indian Economic Cross Cultural
Programme, under contract ALA/95/23/2003/077-122, “Improving the Seismic Resistance of Cultural Heritage
Buildings”. The work was also partially supported by project SAPIENS 33935-99 funded by the Portuguese
Science and Technology Foundation (FCT).
References
1 . G.N.D.T., Seismic damage and vulnerability of the churches in Umbria (in Italian), CD-Rom, Presidency
from the Ministry Council 1998.
2 . Barbat, A.H., Yépez, F., Canas, J.A, Damage scenarios simulation for seismic risk assessment in urban
zones, Earthquake Spectra 1996; 12(3): 371-394.
3 Langa, K., Bachmanna, H., On the seismic vulnerability of existing buildings: A case study of the city of
Basel, Earthquake Spectra 2004; 20(1): 43-66.
4 . Lourenço, P.B., Computations of historical masonry constructions, Progress in Structural Engineering and
Materials 2002; 4(3): 301-319.
5. ICOMOS, Recommendations for the analysis, conservation and structural restoration of architectural
heritage, 2001.
6. Giuffrè, A., Seismic damage in historic town centers and attenuation criteria. Annali di Geofisica 1995; 38(5-
6): 837-843.

11
7. Meli, R., Structural engineering of historical buildings (in Spanish). Mexico-City : Fundación ICA, 1998.
8. CEN, Eurocode 8: Design of structures for earthquake resistance, prEN 1998-1. Brussels : CEN, 2003.
9. CEN, Eurocode 6: Design of masonry structures, prEN 1996-1. Brussels : CEN, 2003.
10. M.H.O.P.T., Safety and action code for building and bridges structures (in Portuguese), Legal-Decree no.
235/83. Lisbon : INCM, 1983.
11. DGEMN, Architectural heritage inventory. Lisbon : Direcção Geral de Edifícios e Monumentos Nacionais.
Available from www.monumentos.pt.
12. Roque, J.A., Strengthening and structural rehabilitation of ancient masonry walls (in Portuguese), MSc
Thesis, Guimarães : University of Minho, 2002. Also available from www.civil.uminho.pt/masonry.

12
List of Tables
Table 1 – Indexes for the full sample (shaded values represent violation of the criteria adopted in Section 3)
Table 2 – Recommended values for the minimum value of Index 2
Table 3 – Indexes for the full sample (shaded indexes represent violation of the proposed criteria and shaded
church indicates the need of a deeper study)

13
List of Figures
Figure 1 – Seismic zonation of Portugal [10] and location of the churches (zone A is high seismicity and zone D
is low seismicity)
Figure 2 – Typical inventory form for the churches (non-structural aspects)
Figure 3 – Typical structural performance form for the churches
Figure 4 – Average results for index g1, according to orthogonal directions (line indicates the threshold)
Figure 5 – Index γ2: (a) average results according to orthogonal directions (line indicates the threshold);
(b) average height(s) of the buildings, being the equivalent height defined as hequiv = G / (Aw × γ)
Figure 6 – Average results for index g3, according to orthogonal directions (line indicates the threshold)
14
Table 1 – Indexes for the full sample (shaded values represent violation of the criteria adopted in Section 3)
Índex 1 Índex 2 Index 3 Zone Designation of church Location γ1x γ1y γ2x γ2y γ3x γ3y A1 Igreja de Santa Cruz - Almodôvar Beja 0.14 0.18 3.87 5.07 1.00 1.31 A2 Igreja de Santo Amaro Beja 0.11 0.17 3.49 5.34 0.93 1.42 A3 Igreja da Misericórdia de Beja Beja 0.10 0.11 4.02 4.18 1.15 1.20 A4 Igreja da Misericórdia das Entradas Castro Verde 0.16 0.31 3.32 6.48 0.74 1.44 A5 Igreja Matriz de Mértola Mértola 0.12 0.14 3.30 3.96 1.00 1.17 A6 Igreja Matriz de Entradas Castro Verde 0.11 0.24 2.15 4.78 0.76 1.68 A7 Igreja Matriz de Vila do Bispo V. Bispo 0.15 0.15 4.62 4.69 0.96 0.97 A8 Igreja da Luz – Capela Mor Lagos 0.12 0.14 3.99 4.83 0.95 1.15 A9 Igreja Matriz de Loulé Loulé 0.17 0.15 3.59 3.16 1.32 1.16 A10 Sé de Silves Silves 0.12 0.18 2.02 3.00 0.94 1.40 A11 Igreja Matriz Alcochete 0.13 0.16 3.97 4.97 0.94 1.17 A12 Igreja do Antigo Mosteiro de Jesus Setúbal 0.11 0.24 1.43 3.02 0.67 1.42 A13 Igreja Matriz S. Salvador Sines 0.12 0.15 2.78 3.68 0.92 1.22 A14 Igreja de S. Lourenço V.N. Azeitão 0.09 0.17 2.85 5.59 0.79 1.55 A15 Igreja de Nossa Senhora da Graça Barreiro 0.10 0.14 3.98 5.43 0.92 1.26 A16 Igreja de São Quintino Sobral 0.11 0.16 2.65 3.98 0.86 1.29 A17 Igreja da Cheleiros Mafra 0.16 0.14 4.26 3.90 0.95 0.87 A18 Igreja de Santa Maria Sintra 0.12 0.19 3.06 4.74 1.00 1.52 A19 Igreja de Santo André Mafra 0.13 0.19 3.67 5.38 1.00 1.46 A20 Igreja Matriz da Lourinhã Lourinhã 0.11 0.19 3.11 5.48 0.89 1.57 A21 Igreja Matriz de Loures Loures 0.09 0.20 1.45 3.38 0.63 1.47 A22 Igreja Paroquial de S. Cristóvão Lisboa 0.14 0.17 3.30 4.00 1.27 1.54 A23 Igreja de São Domingos Lisboa 0.19 0.22 3.84 4.35 1.61 1.83 A24 Igreja da Terrugem Sintra 0.13 0.17 4.73 6.03 1.04 1.32 A25 Igreja Matriz de Arruda dos Vinhos A. dos Vinhos 0.12 0.14 3.52 4.05 1.14 1.31 B1 Igreja de Santa Clara Santarém 0.07 0.12 1.53 2.72 1.08 1.92 B2 Igreja Matriz da Golegã Golegã 0.08 0.13 2.34 3.66 1.34 2.10 B3 Igreja Matriz de Arronches Portalegre 0.09 0.14 2.23 3.37 1.22 1.84 B4 Igreja Matriz da Redinha Pombal 0.11 0.17 3.18 5.01 1.07 1.68 B5 Igreja Matriz de S. João Baptista Moura 0.09 0.13 1.86 2.86 1.29 1.99 B6 Igreja de S. Pedro Leiria 0.06 0.20 1.68 5.26 0.70 2.19 B7 Igreja Matriz da Batalha Batalha 0.11 0.15 2.96 4.01 1.28 1.74 B8 Igreja de Sta. Maria dos Olivais Tomar 0.07 0.10 2.75 4.01 1.17 1.71 B9 Igreja da Atalaia Santarém 0.18 0.21 5.32 6.37 1.88 2.25 B10 Igreja de Santa Cruz Santarém 0.12 0.14 2.52 2.83 1.30 1.46 B11 Sé de Évora Évora 0.09 0.15 1.17 1.94 1.09 1.82 C1 Igreja de S. Tiago de Coimbra Coimbra 0.09 0.19 1.72 3.60 1.17 2.45 C2 Igreja Matriz de Vouzela Vouzela 0.11 0.21 2.51 4.68 1.43 2.66 C3 Igreja de Nossa Senhora da Fresta Trancoso 0.11 0.22 2.64 5.55 1.29 2.70 C4 Igreja de São Pedro de Arganil Arganil 0.08 0.14 4.50 7.69 1.55 2.64 C5 Sé velha Coimbra 0.15 0.20 1.64 2.07 1.99 2.52 C6 Igreja Matriz da Lourosa Oliv. Hospital 0.09 0.15 4.17 7.11 1.54 2.63 C7 Igreja da Tocha Cantanhede 0.10 0.18 1.62 2.87 1.32 2.35 C8 Igreja Par. de Figueiró dos Vinhos Leiria 0.10 0.11 2.92 3.09 1.99 2.10 C9 Igreja de S. João deTarouca Viseu 0.07 0.15 3.40 7.10 1.31 2.75 C10 Igreja da Misericórdia do Sabugal Guarda 0.10 0.15 3.17 4.81 1.63 2.46 C11 Igreja de S. Miguel de Urrô Arouca 0.10 0.22 2.83 6.03 1.37 2.92 D1 Igreja da Misericórdia Freixo E. Cinta 0.15 0.11 2.52 1.89 3.63 2.72 D2 Igreja de Algosinho Mogadouro 0.14 0.21 4.52 6.45 3.02 4.31 D3 Igreja do Tabuado Marco 0.15 0.17 2.72 3.07 2.55 2.87 D4 Igreja Matriz de Armamar Armamar 0.13 0.18 2.96 4.18 3.00 4.23 D5 Igreja de N. Sra da Orada Melgaço 0.12 0.23 2.29 4.53 1.95 3.86 D6 Igreja de S. Miguel do Castelo Guimarães 0.11 0.24 3.02 6.58 2.20 4.79 D7 Igreja de Almacave Lamego 0.15 0.18 2.86 3.44 3.13 3.75 D8 Igreja de S. Martinho de Cedofeita Porto 0.24 0.28 2.77 3.24 3.69 4.32 D9 Igreja de Santo Cristo de Outeiro Vimioso 0.15 0.17 2.03 2.25 3.64 4.04 D10 Igreja de N. Sra da Azinheira Chaves 0.10 0.25 2.83 7.25 1.91 4.91 D11 Igreja de S. Fins de Friestas Viana 0.11 0.24 3.07 6.90 2.84 6.38
15
Table 2 – Recommended values for the minimum value of Index 2
Seismic Zone β γ2, min_ag (m2/MN) A 0.22 3.25 B 0.15 1.85 C 0.11 1.70 D 0.07 0.96
16
Table 3 – Indexes for the full sample (shaded indexes represent violation of the proposed criteria and shaded
church indicates the need of a deeper study)
Índex 2 Index 3 Zone Designation of church Location γ2x γ2y γ3x γ3y A1 Igreja de Santa Cruz - Almodôvar Beja 3.87 5.07 1.00 1.31 A2 Igreja de Santo Amaro Beja 3.49 5.34 0.93 1.42 A4 Igreja da Misericórdia das Entradas Castro Verde 3.32 6.48 0.74 1.44 A5 Igreja Matriz de Mértola Mértola 3.30 3.96 1.00 1.17 A6 Igreja Matriz de Entradas Castro Verde 2.15 4.78 0.76 1.68 A7 Igreja Matriz de Vila do Bispo V. Bispo 4.62 4.69 0.96 0.97 A8 Igreja da Luz – Capela Mor Lagos 3.99 4.83 0.95 1.15 A10 Sé de Silves Silves 2.02 3.00 0.94 1.40 A11 Igreja Matriz Alcochete 3.97 4.97 0.94 1.17 A12 Igreja do Antigo Mosteiro de Jesus Setúbal 1.43 3.02 0.67 1.42 A13 Igreja Matriz S. Salvador Sines 2.78 3.68 0.92 1.22 A14 Igreja de S. Lourenço V.N. Azeitão 2.85 5.59 0.79 1.55 A15 Igreja de Nossa Senhora da Graça Barreiro 3.98 5.43 0.92 1.26 A16 Igreja de São Quintino Sobral 2.65 3.98 0.86 1.29 A17 Igreja da Cheleiros Mafra 4.26 3.90 0.95 0.87 A18 Igreja de Santa Maria Sintra 3.06 4.74 1.00 1.52 A19 Igreja de Santo André Mafra 3.67 5.38 1.00 1.46 A20 Igreja Matriz da Lourinhã Lourinhã 3.11 5.48 0.89 1.57 A21 Igreja Matriz de Loures Loures 1.45 3.38 0.63 1.47 B1 Igreja de Santa Clara Santarém 1.53 2.72 1.08 1.92 B6 Igreja de S. Pedro Leiria 1.68 5.26 0.70 2.19 B11 Sé de Évora Évora 1.17 1.94 1.09 1.82

17
Figure 1 – Seismic zonation of Portugal [10] and location of the churches (zone A is high seismicity and zone D
is low seismicity)
Oporto
Lisbon
18
PT1- Church of Santa Cruz, Almodôvar – Beja, Portugal
(a)
(b)
(c) Geometry: (a) photo; (b) plan; (c) cross-section
[Source: DGEMN - General Directorate for Monuments and Sites] National Classification: Construction of Public Interest (IIP) Construction period: 16th, 17th, 18th (construction supposedly initiated in 1501, with possible inauguration in 1740 according to the date engraved in the doorsill of the sacristy door) Description: Longitudinal plan with rectangular nave with small side-chapels, quadrilateral bell-tower at the left, polygonal apse and rectangular sacristy at the left. Stepped volumes with a distinct double-sloping roof, over the church, and a prismatic spire, over the bell-tower. Main façade in a single gable wall, with a single opening: a portal with three semicircular archivolts of torso colonettes. Side bell-tower with two levels, with window openings in the upper part with semicircular archivolt. Back façade highlighted by the lower volume of the chancel, polygonal and with stepped buttresses. Interior with three naves, of four spans, separated by pointed arches and ashlar columns. The main nave, three times large than the side naves, has wood lath-work ceilings. Triumphal arch over the columns. Chancel with roof in star ribbed vault, supported in brackets.
Load-bearing walls in rendered stone masonry. Double-sloping roof with a timber structure. Since 1962, DGEMN has carried out minor conservation works. Previous Seismic Damage: It is likely that the 1755 earthquake hit the structure but any possible damage is not documented, due to the fact that Almodôvar is an isolated rural settlement, with few inhabitants and low regional importance.
Figure 2 – Typical inventory form for the churches (non-structural aspects)
19
PT1- Church of Santa Cruz. Almodôvar – Beja. Portugal
Simplified Methods:
In- plan area ratio Area to weight ratio Base shear ratio
x direction y direction x direction y direction x direction y direction
0.14 0.18 3.87 5.07 1.0 1.31
Other Key Structural Features:
VAULT IN MAIN SPACE
Yes No. Specify: Only in the ceiling of the chancel.
TYPE
Barrel Crossed Domed Other. Specify: Star ribbed vault
GEOMETRICAL DATA (meters)
Span s Rise r Thickness at key t r / s (-) t / s (-)
DATA FOR COLUMNS IN MAIN SPACE (meters and kN)
Free height L Cross-section1 Slenderness λ = L / (Inertia / Area)0.5(-)
Vertical load Euler critical load Thickness / height. if applicable (-)
DATA FOR PERIMETER WALLS IN MAIN SPACE (meters)
Maximum free height Equivalent thickness2 Thickness / height (-)
MAGNITUDE OF SEISMIC LOADING (m/s2)
PGA for Type 13 PGA for Type 2
1 0.50 x 1.25 or φ0.90 or Ix0.55 (for other shapes, lowest inertia) 2 Takes into account buttresses and openings to calculate the equivalent thickness 3 Type 1 (moderate magnitude and close epicenter) and Type 2 (large magnitude and far away epicenter)
Figure 3 – Typical structural performance form for the churches
x
x
5.0 3.0 0.22
2.7 φ0.30 36
5.20 0.55
2.7 1.6
150 1615
1/9.5
1/9
1/1.7 1/15
20
0.00
0.05
0.10
0.15
0.20
0.25
A B C D
Seismic Zone
Inde
x 1
Direction X Direction Y
Figure 4 – Average results for index γ1, according to orthogonal directions (line indicates the threshold)
21
0.00
1.00
2.00
3.00
4.00
5.00
6.00
A B C D
Seismic Zone
Inde
x 2
[m2/
MN
]
Direction X Direction Y
(a) Figure 5 – Index γ2: (a) average results according to orthogonal directions (line indicates the threshold);
(b) average height of the buildings defined as hequiv = G / (Aw × γ)

22
0.00
2.00
4.00
6.00
8.00
10.00
12.00
A B C D
Seismic Zone
Ave
rage
Hei
ght (
m)
Geometrical Equivalent
(b)
Figure 5 – Index γ2: (a) average results according to orthogonal directions (line indicates the threshold);
(b) average height(s) of the buildings, being the equivalent height defined as hequiv = G / (Aw × γ)
23
0.00
0.50
1.00
1.50
2.00
2.50
3.00
3.50
4.00
4.50
A B C D
Seismic Zone
Inde
z 3
Direction X Direction Y
Figure 6 – Average results for index γ3, according to orthogonal directions (line indicates the threshold)