simplified mathematical model of proton exchange …¬ed mathematical model of proton exchange...
TRANSCRIPT

Simplified mathematical model of proton exchange membranefuel cell based on horizon fuel cell stack
Ibrahim M. M. SALEH1, Rashid ALI1, Hongwei ZHANG1
Abstract This paper presents a simplified zero-dimen-
sional mathematical model for a self-humidifying proton
exchange membrane (PEM) fuel cell stack of 1 kW. The
model incorporates major electric and thermodynamic
variables and parameters involved in the operation of the
PEM fuel cell under different operational conditions.
Influence of each of these parameters and variables upon
the operation and the performance of the PEM fuel cell are
investigated. The mathematical equations are modeled by
using Matlab–Simulink tools in order to simulate the
operation of the developed model with a commercial
available 1 kW horizon PEM fuel cell stack (H-1000),
which is used for the purposes of model validation and
tuning of the developed model. The model can be extrap-
olated to higher wattage fuel cells of similar arrangements.
New equation is presented to determine the impact of using
air to supply the PEM fuel cell instead of pure oxygen upon
the concentration losses and the output voltage when useful
current is drawn from it.
Keywords Proton exchange membrane (PEM) fuel cell,
Activation losses, Ohmic losses, Concentration losses,
Cathode–anode model, Membrane hydration model
1 Introduction
A fuel cell is a device which directly converts the energy
in the reactants into electricity. The efficiency of energy
conversion-production for the fuel cell is comparatively
higher than internal combustion engines because there is no
intermediate thermal conversion process similar to the
internal combustion engines or gas turbines [1].
The increasing demand for electrical energy has resulted
in increased production which in turn has increased
harmful emissions, which is the core of the growing con-
cern on the global warming [2]. The pollutants such as
carbon dioxide, nitrous oxides, and sulphur dioxide which
are produced form combusting hydrocarbon fuels are
eliminated in the case of the fuel cells. Also the absence of
intermediate mechanical conversion process makes a fuel
cell a quiet device [3]. Compared to other types of fuel
cells, proton exchange membrane (PEM) fuel cells have
several other features such as low corrosion, low weight
and compact size, which make them suitable for mobile
and stationary applications. The operational temperatures
of the PEM fuel cell range between 30 and 100 �C and
dynamical response is faster than the solid oxide fuel cell
which operates at temperatures over 700 �C [4–6].
The electrochemical model in [7] of the group of Ballard
developers is adopted to develop a novel dynamic model to
simulate and predict the transient response of the cell
voltages, flow rates of hydrogen and oxygen, temperature
of the cell, and temperatures/pressures of the anode and
cathode channels under sudden changes in the load current
CrossCheck date: 18 Februry 2016
Received: 7 July 2015 / Accepted: 18 February 2016 / Published
online: 15 April 2016
� The Author(s) 2016. This article is published with open access at
Springerlink.com
& Ibrahim M. M. SALEH
[email protected]; [email protected]
Rashid ALI
Hongwei ZHANG
1 Materials and Engineering Research Institute, Sheffield
Hallam University, Sheffield, UK
123
J. Mod. Power Syst. Clean Energy (2016) 4(4):668–679
DOI 10.1007/s40565-016-0196-5

of the PEM fuel cell [8–11]. The model incorporates the
capacitance impact of charge double layer. A dimensional
isothermal steady-state model is developed in [12] for the
polymer electrolyte fuel cell with Nafion 117 membrane to
measure the impact of water transport mechanisms on the
performance of the fuel cell. While another attempt is
carried in [13] to investigate and determine the conduc-
tivity of Nafion 117 membrane as the function of drawn
current densities. The model in [1] is developed by [14] in
order to produce a time dependent model for the fuel cell.
The model has considered the heat transfer between the
fuel cell body, gas channels, and cooling water, calculating
the condensation and evaporation and modelling the water
content, dragged water through membrane, water at the
cathode. A non-linear dynamic model in [15] is developed
for the PEM fuel cells, using electrochemical-thermody-
namic and zero-dimensional fluid mechanics principles.
The output voltage of the stack has been modelled based on
load current and the fuel cell operating conditions such as
temperature, air pressure and partial pressure of oxygen,
humidity of the membrane. A non-isothermal one dimen-
sional model of a PEM fuel cell in [16] is developed to
investigate and examine the effect of design and operating
conditions upon the performance, water management, and
thermal response of the PEM fuel cells. In [17], it is pro-
posed a simple dynamic electrical model of a PEM fuel cell
by extending the static current–voltage behavior of the
model to implicit the impact of the temperature on the
performance of the fuel cell. The model performance has
been validated using an experimental data of a 500 W
commercial PEM fuel cell stack. A dynamic model of a
1.2 kW PEM fuel cells is developed in [18] that can be
used for optimal operational strategies development and
control design of the fuel cell based power systems. The
model parameters are adjusted and validated with a 1.2 kW
Ballard fuel cell stack. The proposed model contributes in
predicting both steady and transient states under variable
loads, also the impact of water flooding and purging
hydrogen. A new dynamic model of 20 cells stack is pre-
sented in [19] that considers the impact of temperature and
the two phases of water (gas and liquid) in the gas diffusion
layer which plays significant role in the transporting water
and reactants in order to investigate starting up and tran-
sient behavior of the model under different conditions of
load current, temperature, and coolant flow rate. It is pro-
posed a lumped model for the PEM fuel cells in [20] based
on zero dimensional linear equations to determine the
impacts of various operating and design parameters such as
input temperature, pressure, stoichiometric ratio, thickness
of membrane and gas diffusion layer on the performance of
the fuel cell. While it is developed a three-dimensional
multi-phase fuel cell model in [21] to predict the impacts of
operating parameters such as operating pressure and
temperature of the fuel cell, relative humidity of reactant
gases, and air stoichiometric ratio on the performance of
the PEM fuel cells operates under steady-state conditions.
A mathematical model of a 750 W PEM fuel cell is
developed in [22] to predict the behavior of the fuel cells
under steady-state and transient conditions. The dynamics
of the charge double layer capacitance, dynamics of anode
and cathode channel are all integrated into a single model
and the transient responses of the PEM fuel cell model for a
resistive load and for short-long operation time are
analyzed.
Although many fuel cell models are available in litera-
tures, but most of these models estimate the output voltage
of the fuel cell for a particular set of operating conditions
and some often for a limited dynamic variations. The
proposed model in this paper is a simplified zero-dimen-
sional mathematical model for a self-humidifying 1 kW
PEM fuel cell developed by modeling the major electric
and thermodynamic variables and parameters. Considera-
tion is given to changing environmental conditions, chan-
ges in the dynamical properties of the fluids in the supply-
return manifolds and inside the anodes and cathodes of the
fuel cell stack, properties such as pressure, temperature and
flow rates.
Hence, the proposed model can determine the impact of:
load current, changes in the pressure and temperature of the
surroundings, stack operating temperature, water vapour
across the membrane, relative humidity in the cathodes and
anodes and the water content in the electrolyte membrane,
thickness of the membrane and the size of membrane active
area, and the volume of the cathode and anode up on the
performance and output power of the fuel cell stack, the
usage of pure oxygen or fresh air is considered as well.
Thus, this model could be used by the interested
researchers as a generic model and simulation platform of a
self-humidifying PEM fuel cell with an output power
varying from 50 W to 1 kW, extrapolation to higher
powers is also possible.
The mathematical equations are modelled by using
Matlab–Simulink tools in order to simulate the operation of
the developed model with a commercially available 1 kW
horizon PEM fuel cell stack (H-1000) which is used as an
experimental device in running the test physically in order
to validate and tune the developed model.
2 Irreversible losses of PEM fuel cell
The output power of the fuel cell depends on its current–
voltage relationship at any operating point on the polari-
sation curve. The output voltage of the PEM fuel cell in
turn depends on pressure and temperature of the reactants
(i.e. fuel and air), mass flow rate of the reactants, and hence
Simplified mathematical model of proton exchange membrane fuel cell based on horizon fuel… 669
123
their concentrations at the electrodes, which determines the
thermodynamic properties of the reactants inside the stack
and hence the behaviour and response of the electro-
chemical reaction. The output voltage of the PEM fuel cell
drops as the current is drawn from the fuel cell. The
magnitude of output voltage of the fuel cell is less than the
open circuit voltage due to three main irreversible losses:
activation losses, ohmic losses and concentration losses.
A simplified models of relationships between the acti-
vation, ohmic, and concentration losses and the operating
temperature, pressure, and concentration of oxygen are
presented in various researches [8, 23]. To determine the
impact of activation losses on the output voltage of the
PEM fuel cell, the empirical electrochemical relationship
developed by [8, 24] will be used in this study to determine
the impact of temperature, concentration of oxygen, and
drawn current upon the activation voltage losses, as pre-
sented by (1) and (2).
Vact ¼ f1 þ f2T þ f3T lnðCO2Þ þ f4T lnðIÞ ð1Þ
where T is the stack temperature in kelvin which is nearly
equal to cell temperature; I is the total current drawn from
the fuel cell; CO2is the concentration of oxygen at the
catalyst interface; fn is the empirical parametric coefficient
based on the experimental data, which may vary from one
stack to another or cell to another depends on the geo-
metrical design and the materials used in the construction
of the PEM fuel cell [23]. The values of fn are determined
from the experimental data table developed by [8, 24]
f1 = -0.944 V
f2 = 3.54 9 10-3 V/K
f3 = 80 9 10-5 V/K
f4 = -1.96 9 10-4 V/K
The value of CO2in (1) can be determined based on
Henry’s Law [25].
CO2¼ PO2
5:08� 106 exp �498T
� � ð2Þ
where PO2is the pressure of oxygen in the cathode side.
Theoretically, for PEM fuel cell, the flow of electrons is
equal to the flow of ions. The electronic resistivity depends
on the materials of electrodes and bipolar plates, and it is
almost considered to be approximately constant particu-
larly over temperatures range from 50 to 90 �C of PEM
fuel cell operation, and hence can be ignored. Ionic resis-
tivity is more complicated and is not constant over oper-
ating temperature, because the resistance of the electrolyte
to the conduction of ions depends on many factors which
include materials characteristics of the membrane, water
content and its distribution in the membrane, fuel cell
temperature, and drawn current from the fuel cell [24].
Voltage drop due to ohmic losses is defined as the sum of
electronic and ionic resistance losses.
Vohm ¼ �I Rions þ Relectronsð Þ ð3Þ
where Rions and Relectrons are the ionic and electronic
resistivity.
By ignoring electronic resistivity in order to determine
the impact of membrane resistivity on the output voltage of
the PEM fuel cell, Eq. (3) becomes
Vohm ¼ � IRions ð4Þ
In [24, 26], it is developed an empirical model of ionic
resistivity of membrane Rions as a function to the
membrane specific resistivity Rm, membrane active area
A and thickness of membrane l. Rm is function to cell
temperature, current, membrane active area A, and k which
is semi-empirical variable representing water content in the
membrane. The value of Rm is not unique which changes
from membrane to another based on the membrane
dimensions and membrane preparation procedure, even in
the same family of Nafion membrane.
Rions ¼Rml
Afc
ð5Þ
Rm ¼181:6 1þ 0:03 I
Afc
� �þ 0:062 T
303
� �2 IAfc
� �2:5� �
k� 0:634� 3 IAfc
� �h iexp 4:18 T�303
T
� �� ð6Þ
where Afc is the membrane active area of the fuel cell; k is
the number of water molecules in the structure of mem-
brane. The value of k is influenced by the membrane fab-
rication processes, operation time (i.e. time being in
service), cell relative humidity, and the stoichiometric ratio
of the supplied gases [24]. Values of k are determined
equal to zero for a dry membrane, 14 for saturated, and 23
for supersaturated membrane [12, 26].
During fuel cell operation, and when current is drawn
from it, oxygen and hydrogen are consumed at the elec-
trodes causing a reduction in the concentrations and the
pressures of the reactants. Hence, the concentration losses
occur as a result of the reduction in the concentration of the
reactants at the surface of the electrodes particularly at high
current demand. In addition, the failure in maintaining the
required mass flow rate of reactants to the electrode
interface will lead to drop in the concentrations and con-
sequently causing drop in the cell voltage. The magnitude
of change in the concentration of reactants depends on [7,
23, 27]: � drawn current from the fuel cell; ` how fast the
reactants gases can be replenished (flow rate of the reac-
tants); ´ geometrical design of the flow channels; ˆ dif-
fusion characteristics of gas diffusion layer and the
electrodes; ˜ efficient recirculation of air around the
cathode in order to remove the extra water.
It has been claimed that oxygen starvation occurs when
the partial pressure of oxygen falls below a critical level at
670 Ibrahim M. M. SALEH et al.
123
any location in the air channel of the cathode leading to a
rapid drop in the cell voltage, which in severe cases can
cause a hot spot, or even burn on the surface of a mem-
brane [28]. The impact of concentration losses upon the
output voltages of the hydrogen–oxygen PEM fuel cell
when useful current is drawn is determined by [27].
Vcon ¼3RT
4Fln 1� i
im
�ð7Þ
where R is the universal gas constant (R =
8.31447 kPa m3/kmol K); F is the Faraday’s constant
(96485 Coulombs/mol). In case of the fuel cell is
supplied with fresh air rather than pure oxygen which is
the most common, Eq. (7) can be re-derived to describe the
impact of concentration losses upon the output voltage of
the hydrogen-air PEM fuel cell when useful current is
drawn from it as
Vcon ¼3RT
4Fln 1� i
im
�� 1:5607
RT
4Fð8Þ
The output voltage of the PEM fuel cell is subject to
various losses, and could be expressed by
Vfc ¼ n Eoc þ Vact þ Vohm þ Vconð Þ ð9Þ
where n is the number of cells connected in series in the
stack; EOC is the open circuit voltage of the PEM fuel cell.
It has been derived previously for a liquid state of water
produced by the fuel cell and given by [29].
Eoc ¼ 1:228� ½0:85� 10�3ðT � 298:15Þ�þ
4:3086� 10�5T ln PH2ðPO2
Þ12
� �h i ð10Þ
3 Mathematical modelling of gases flow in PEMfuel cell
The stack of PEM fuel cells must be operated with other
components in order to form an integrated fuel cell power
system. These components are mainly divided into four sys-
tems as it has been reported by [30]: hydrogen supply system,
air supply system, cooling system, humidification system.
In this research, horizon fuel cell stack system (H-1000)
is adopted as an experimental prototype, which is designed
by the manufacturer to be self-humidified fuel cell stack.
Therefore, water will not be added to the streams of sup-
plied hydrogen and air in order to humidify the fuel cells
[31]. Hydrogen supply system consists of a tank of pres-
surised pure hydrogen, inlet flow control valve, outlet
purge valve. While air supply system consists of air supply
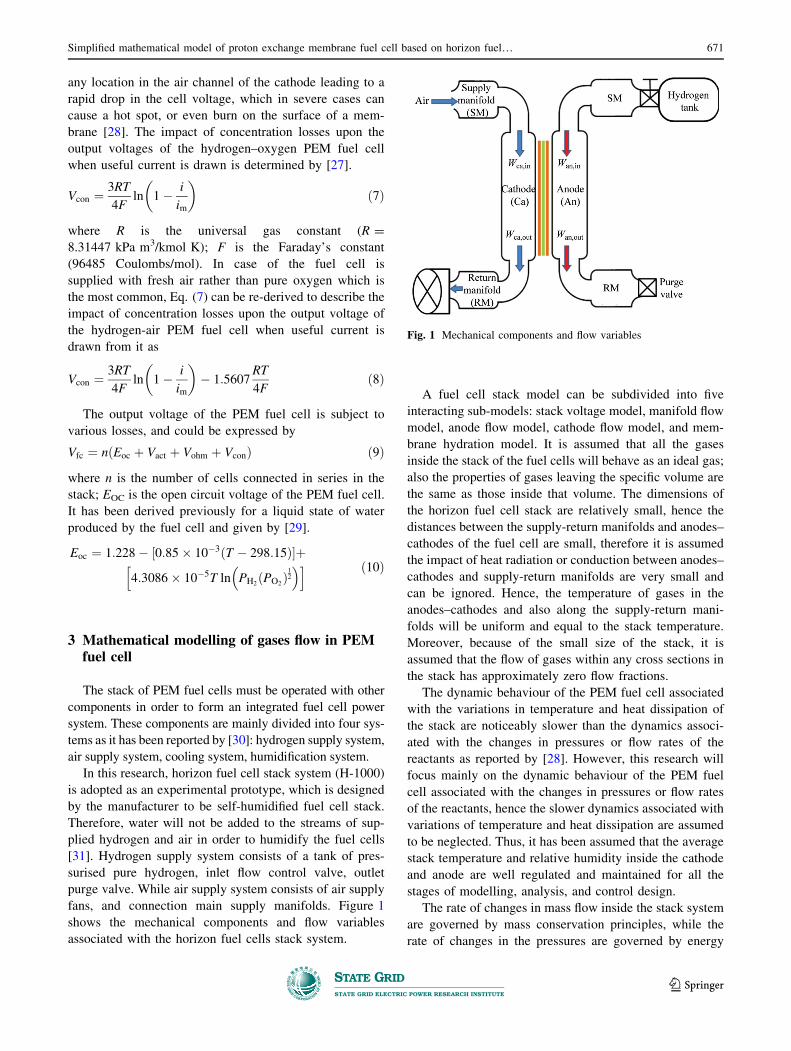
fans, and connection main supply manifolds. Figure 1
shows the mechanical components and flow variables
associated with the horizon fuel cells stack system.
A fuel cell stack model can be subdivided into five
interacting sub-models: stack voltage model, manifold flow
model, anode flow model, cathode flow model, and mem-
brane hydration model. It is assumed that all the gases
inside the stack of the fuel cells will behave as an ideal gas;
also the properties of gases leaving the specific volume are
the same as those inside that volume. The dimensions of
the horizon fuel cell stack are relatively small, hence the
distances between the supply-return manifolds and anodes–
cathodes of the fuel cell are small, therefore it is assumed
the impact of heat radiation or conduction between anodes–
cathodes and supply-return manifolds are very small and
can be ignored. Hence, the temperature of gases in the
anodes–cathodes and also along the supply-return mani-
folds will be uniform and equal to the stack temperature.
Moreover, because of the small size of the stack, it is
assumed that the flow of gases within any cross sections in
the stack has approximately zero flow fractions.
The dynamic behaviour of the PEM fuel cell associated
with the variations in temperature and heat dissipation of
the stack are noticeably slower than the dynamics associ-
ated with the changes in pressures or flow rates of the
reactants as reported by [28]. However, this research will
focus mainly on the dynamic behaviour of the PEM fuel
cell associated with the changes in pressures or flow rates
of the reactants, hence the slower dynamics associated with
variations of temperature and heat dissipation are assumed
to be neglected. Thus, it has been assumed that the average
stack temperature and relative humidity inside the cathode
and anode are well regulated and maintained for all the
stages of modelling, analysis, and control design.
The rate of changes in mass flow inside the stack system
are governed by mass conservation principles, while the
rate of changes in the pressures are governed by energy
Fig. 1 Mechanical components and flow variables
Simplified mathematical model of proton exchange membrane fuel cell based on horizon fuel… 671
123
conservation principles [28, 32]. Also, the values of the
parameters used in our model are either drawn from freely
available literature or determined. These values are based
on the dimensions and properties of the horizon fuel cell
stack system as presented in Appendix 1.
3.1 Air fan flow calculations
The horizon fuel cell stack system is designed to have
four fans installed at the exit outlet of the return manifolds
of cathodes. The fans are configured as ducted inlet, free
outlet, working as suction devices at the outlet of the return
manifolds of cathodes. The rotational speed of four axial
fans and the frequency of purging for outlet hydrogen valve
are controlled by a controller device in order to maintain
enough operational pressure at the cathode and anode, and
also to provide sufficient flow of air and hydrogen leading
to maintain certain level of stack temperature and retaining
the continuity of electrochemical reaction [31].
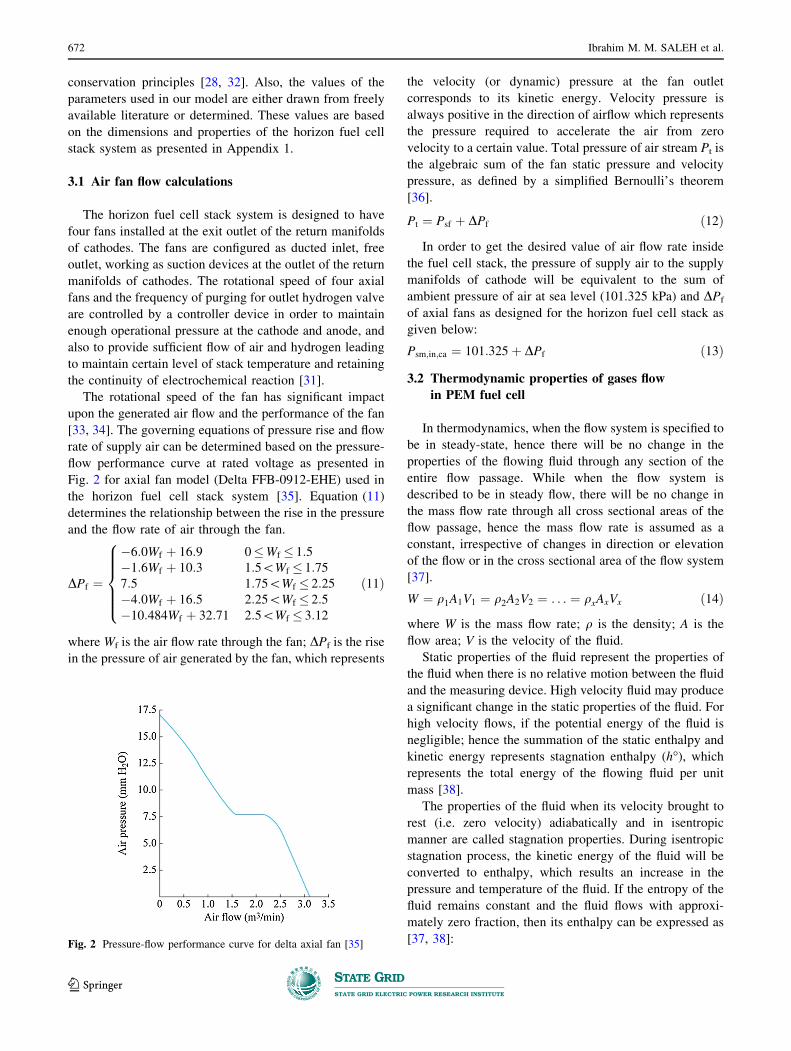
The rotational speed of the fan has significant impact
upon the generated air flow and the performance of the fan
[33, 34]. The governing equations of pressure rise and flow
rate of supply air can be determined based on the pressure-
flow performance curve at rated voltage as presented in
Fig. 2 for axial fan model (Delta FFB-0912-EHE) used in
the horizon fuel cell stack system [35]. Equation (11)
determines the relationship between the rise in the pressure
and the flow rate of air through the fan.
DPf ¼
�6:0Wf þ 16:9 0�Wf � 1:5�1:6Wf þ 10:3 1:5\Wf � 1:757:5 1:75\Wf � 2:25�4:0Wf þ 16:5 2:25\Wf � 2:5�10:484Wf þ 32:71 2:5\Wf � 3:12
8>>>><
>>>>:
ð11Þ
where Wf is the air flow rate through the fan; DPf is the rise
in the pressure of air generated by the fan, which represents
the velocity (or dynamic) pressure at the fan outlet
corresponds to its kinetic energy. Velocity pressure is
always positive in the direction of airflow which represents
the pressure required to accelerate the air from zero
velocity to a certain value. Total pressure of air stream Pt is
the algebraic sum of the fan static pressure and velocity
pressure, as defined by a simplified Bernoulli’s theorem
[36].
Pt ¼ Psf þ DPf ð12Þ
In order to get the desired value of air flow rate inside
the fuel cell stack, the pressure of supply air to the supply
manifolds of cathode will be equivalent to the sum of
ambient pressure of air at sea level (101.325 kPa) and DPf
of axial fans as designed for the horizon fuel cell stack as
given below:
Psm;in;ca ¼ 101:325þ DPf ð13Þ
3.2 Thermodynamic properties of gases flow
in PEM fuel cell
In thermodynamics, when the flow system is specified to
be in steady-state, hence there will be no change in the
properties of the flowing fluid through any section of the
entire flow passage. While when the flow system is
described to be in steady flow, there will be no change in
the mass flow rate through all cross sectional areas of the
flow passage, hence the mass flow rate is assumed as a
constant, irrespective of changes in direction or elevation
of the flow or in the cross sectional area of the flow system
[37].
W ¼ q1A1V1 ¼ q2A2V2 ¼ . . . ¼ qxAxVx ð14Þ
where W is the mass flow rate; q is the density; A is the
flow area; V is the velocity of the fluid.
Static properties of the fluid represent the properties of
the fluid when there is no relative motion between the fluid
and the measuring device. High velocity fluid may produce
a significant change in the static properties of the fluid. For
high velocity flows, if the potential energy of the fluid is
negligible; hence the summation of the static enthalpy and
kinetic energy represents stagnation enthalpy (h�), whichrepresents the total energy of the flowing fluid per unit
mass [38].
The properties of the fluid when its velocity brought to
rest (i.e. zero velocity) adiabatically and in isentropic
manner are called stagnation properties. During isentropic
stagnation process, the kinetic energy of the fluid will be
converted to enthalpy, which results an increase in the
pressure and temperature of the fluid. If the entropy of the
fluid remains constant and the fluid flows with approxi-
mately zero fraction, then its enthalpy can be expressed as
[37, 38]:Fig. 2 Pressure-flow performance curve for delta axial fan [35]
672 Ibrahim M. M. SALEH et al.
123

h� ¼ cpT� ¼ cpT þ V2
2¼ hþ V2
2ð15Þ
cp ¼k
k � 1Rs ð16Þ
where cp is the specific heat of the fluid; Rs is the specific
constant of the fluid. For an ideal gas dh = cpdT,
h-h = cp(T-T). With a datum temperature of 0 K,
yields with (h = cpT) [37]. For a steady state flow of
fluid flowing adiabatically through a flow system with
constant passage flow area, where there were no heat or
work interactions and no changes in the potential energy or
elevation of the fluid, hence the stagnation enthalpy of the
fluid remains constant during a steady state flow process
(h�1 = h�2).
h�1 ¼ h1 þV21
2¼ h2 þ
V22
2¼ h�2 ð17Þ
When the flowing fluid is brought to complete stop; then
stagnation enthalpy at state 2 will be equal to the fluid
static enthalpy at this state as given below:
h1 þV21
2¼ h2 ¼ h�2 ð18Þ
The density of the fluid varies as it moves down towards
downstream side of the flow system, from the definition of
stagnation properties, total temperature (stagnation
temperature T�), total pressure (stagnation pressure P�),and total density (stagnation density q�) of the fluid at a
certain point can be determined as given below [37, 38]:
T� ¼ T þ V2
2 cpð19Þ
P� ¼ Pþ qV2
2ð20Þ
q� ¼ qT�
T
� 1k�1
ð21Þ
P�
P¼ T�
T
� kk�1
ð22Þ
where T, P and q are static properties of temperature,
pressure and density of the fluid, respectively; T�, P�, andq� are the properties of temperature, pressure, and density
of the fluid under isentropic stagnation state; k is the con-
stant of specific heats ratio (cp/cv) for air at temperature
15 �C which is equal to 1.4 for dry air and 1.409 for
hydrogen; V2/2cp is the dynamic temperature of the fluid
which is equivalent to the temperature rise during such
process. For low-speed flows, the static temperature and
stagnation temperature are approximately the same [38].
In case of fluid flows through a continuous flow system
have a non-consistent passage area such as diffuser or
nozzle. Due to high rates of flow through the system, there
will be no significant heat transfer between the fluid and the
surroundings, and the flow may be considered to be adia-
batic. Also if it is assumed that the flow is frictionless with
negligible elevation impact, then the flow can be consid-
ered to be isentropic. Hence under these conditions, the
stagnation enthalpy will remain constant along the flow
passage, as presented in (23) [37].
ho1 ¼ ho2 ¼ . . . ¼ hox ¼ Constant ð23Þ
The change in the flow area of the nozzle will change
the pressure of the fluid and hence flow velocity. If the flow
is assumed to be steady and unidirectional, and the gas is
assumed to behave in an adiabatic and isentropic manner,
hence stagnation enthalpy will remain constant at any point
through the nozzle. Then, the velocity of the fluid at any
point in the nozzle is determined below [37]:
V ¼ffiffiffiffiffiffiffiffiffiffiffiffiffiffiffiffiffiffiffiffi2 ðho � hÞ
p¼
ffiffiffiffiffiffiffiffiffiffiffiffiffiffiffiffiffiffiffiffiffiffiffiffiffi2 cpðTo � TÞ
qð24Þ
By substituting (16) and (22) in (24) and rearranging,
yields with,
V ¼
ffiffiffiffiffiffiffiffiffiffiffiffiffiffiffiffiffiffiffiffiffiffiffiffiffiffiffiffiffiffiffiffiffiffiffiffiffiffiffiffiffiffiffiffiffiffiffiffiffiffiffiffiffiffiffiffiffiffiffiffi
2k
k � 1
�RsTo 1� P
Po
�k�1k
" #vuut ð25Þ
Since the flow of the fluid is assumed to be adiabatic and
isotropic, and the stagnation enthalpy remains constant;
hence the stagnation temperature and pressure will remain
constant as well. Thus velocity of the fluid in (25) can be
determined in terms of initial stagnation temperature and
pressure. For steady flow flowing through constant passage
area with constant temperature, then (14) can be repre-
sented as
q1V1 ¼ q2V2 ¼P1
RsTV1 ¼
P2
RsTV2 ð26Þ
P1V1 ¼ P2V2 ð27Þ
Due to the lack of experimental data and the
difficulties to measure the variation of pressures,
densities, and temperatures of the flowing reactants in
the supply-return manifolds, anodes, and cathodes of the
fuel cell stack, gases are assumed to behave as an ideal
gas with constant specific heats and zero flow fractions.
Moreover, and particularly in the supply-return manifolds
of the stack, gases are assumed to subject to the
isentropic stagnation state. Equations (19), (20), (21),
(25), and (27) will be used to determine the pressure,
temperature, and velocity of gas leaving the supply
manifold of anode and cathode of the fuel cell stack.
While under assumption of steady flow, the mass flow
rate of gas entering the supply manifold is assumed to be
equal to the mass flow rate of gas leaving it.
Simplified mathematical model of proton exchange membrane fuel cell based on horizon fuel… 673
123
3.3 Cathode flow model
The dimensions of the horizon fuel cell stack are
relatively small and the distances between the supply-
return manifolds and anodes–cathodes of the fuel cells
are small as well. Hence, it is assumed that the multiple
cathodes in the stack are all lumped as one stack cathode
volume, which represents the sum of volumes of each
individual cathode’s volume in the stack. And the
supply manifold of cathode sm lumps all the volumes of
passages and connections between the inlet of air and
the cathodes, while return manifold rm lumps all the
volumes of passages and connections between the cath-
odes of the fuel cells and the exit of air of the fuel cell
stack.
The flow rate of supplied air to the manifold of cathode
Wsm,in is equal to Wf, while the pressure of supplied air
Psm,in is equal to 101.325 ? DPf as determined in (11) and
(13). The temperature of air exit the supply manifold of
cathode is assumed to be equal to the temperature of sup-
plied air which is equal to the ambient temperature. While
the temperature of air at any cross section in the cathode is
assumed to be equal to the exit air of cathode, which is
considered to be equal to stack temperature Tst.
The rate flow of gas passes through a nozzle is a func-
tion of the upstream and downstream pressure of the noz-
zle. Thus, the mass flow rate of fluid between two volumes
can be determined by using linearized nozzle equation
given in [30, 32]. Hence, the mass flow rate of air flows
between the exit of supply manifold and the cathode is
determined as
Wsm;out;ca ¼ Ksm;out;ca Psm;out;ca � Pca;in
� �ð28Þ
where Pca,in is the pressure of air enter the cathode;
Wsm,out,ca is assumed to be equal to Wsm,in,ca under
condition of steady flow; Ksm,out,ca is the nozzle constant
of supply manifold outlet which represents the ratio of
mass flow rate of air to the pressure. Ksm,out,ca for the
horizon fuel cell stack is determined and presented in
Appendix 1. The mass of a mixture of gases is equal to the
sum of masses of individual components in the mixture
[38]. The principle of mass conservation states that the rate
of change of fluid mass inside the volume is equal to the
net rate of fluid mass flows into the volume. Hence, the rate
of change in the mass of air inside the cathode of the fuel
cell is determined as below [15].
dmca
dt¼ dmO2
dtþ dmN2
dtþ dmw;ca
dtð29Þ
dmO2
dt¼ WO2;in �WO2;out �WO2;rct ð30Þ
dmN2
dt¼ WN2;in �WN2;out ð31Þ
dmw;ca
dt¼ Ww;gen �Ww;mbr �Ww;out ð32Þ
where mca is the mass of gases inside the cathode; mO2, mN2
and mw are mass of oxygen, nitrogen, and water vapour
respectively in the cathode; Ww,gen is the mass flow of
produced water as a result of electrochemical reaction;
WO2;rct is the mass flow of reacted oxygen in the cathode;
Ww,mbr is the mass flow of water vapour across the
electrolyte membrane. Mass flow rate of air enter the
cathode and mass flow rate of air exit the cathode are
determined by the equations given below:
Wca;in ¼ WO2;in þWN2;in ð33Þ
Wca;out ¼ WO2;out þWN2;out þWw;out ð34Þ
By substituting (30)–(34) in (29) and rearranging, yields
with
dmca
dt¼ Wca;in �Wca;out �WO2;rct þWw;gen �Ww;mbr ð35Þ
Using ideal gas law,
dP
dt¼ RT
V
dmdt
M¼ RT
V
W
Mð36Þ
where M is the molar mass of gas; W is the mass flow rate
of flowing gas.
dPca
dt¼ RTst
Vca
Wca;in
Mair;in�Wca;out
Mca;out�WO2;rct
MO2
þWw;gen �Ww;mbr
Mw
�
ð37ÞdPca
dt¼ dPca;in
dt� dPca;out
dt
þ RTst
Vca
Ww;gen �Ww;mbr
Mw
�WO2;rct
MO2
�ð38Þ
where Mair, MO2and Mw are the molar mass of air, oxygen
and water vapour respectively; Vca is the volume of
cathode.
WO2;rct and Ww,gen are determined by [27]
WO2;rct ¼ MO2
nIst
4Fð39Þ
Ww;gen ¼ Mw
nIst
2Fð40Þ
where the molar mass of oxygen is 32 9 10-3 kg/mol; the
molar mass of water is 18.02 9 10-3 kg/mol; Ist is the
674 Ibrahim M. M. SALEH et al.
123
current drawn from the stack. For steady flow, the rate of
change in the mass of flowing fluid through specific area
would be zero (i.e. dm/dt = 0), hence dP/dt = 0 [39], then
by taking Laplace transform for (30) and rearranging,
yields with
Pca;out ¼ Pca;in þRTst
Vca
mw;gen � mw;mbr
Mw
� mO2;rct
MO2
�ð41Þ
From (39) and (40), if at any specific second of time, the
mass flow rate of reacted oxygen WO2;rct and produced
water in the cathode are equal to the mass of that
component m at that time, which can be substituted in
(41) to determine the value of air pressure at the exit of
cathode. Since it is assumed that the multiple cathodes in
the stack are all lumped as one stack cathode volume, and
the flow of air supplied to the cathode is mainly consists of
21 % of oxygen and 79 % of nitrogen Hence, the partial
pressure of oxygen in the cathode is assumed to be
approximately equal to 21 % of the average sum of input
and output air pressure of cathode as determined below.
PO2¼ 0:21
Pca;in þ Pca;out
2
�ð42Þ
3.4 Membrane hydration model
Water content in the membrane and the mass flow rate
of water across the membrane are assumed to be uniform
over the two sides of membrane, the mass flow rate of
water vapour across the membrane is given by [28, 30]
Ww;mbr ¼ MwAfcn ndi
F� Dw
uca � uan
l
�ð43Þ
where i is current density of the fuel cell (i.e. i = Ist/Afc);
nd is the electro-osmotic drag coefficient which represents
the number of water molecules dragged with each proton of
hydrogen transported form anode to the cathode side; Dw is
the diffusion coefficient; uca and uan are the relative
humidity in the cathode and anode; l is the thickness of the
membrane. The difference in relative humidity between the
cathode and anode leads to back diffusion of water mole-
cules from cathode to anode as presented in the second
term of (43), and the coefficients Dw and nd are function to
the membrane water content k.In [30], it is reported that the value of water content in
the electrolyte membrane varies between 0 and 14 which is
equivalent to the relative humidity of 0 %–100 % respec-
tively. The electro-osmotic drag coefficient nd is deter-
mined by
nd ¼ 0:0029k2 þ 0:05k� 3:4� 10�19 ð44Þ
In [24], it is reported that water content in membrane is
influenced by the procedure of membrane preparation, age
of the membrane (i.e. time in service), relative humidity
and membrane water activity, and stoichiometric ratio of
the supplies gases. The amount of water content k is
determined in [12, 26] as
k ¼0:043þ 17:81a� 39:85a2 þ 36:0a3 0\ a� 1
14þ 1:4ða� 1Þ 1\ a� 3
8<
:
ð45Þ
a ¼ CwRT
Psat
ð46Þ
where a is the water activity in the membrane; Cw is the
molar concentration of water in the electrolyte membrane;
Psat is the water saturation pressure. Since it has been
assumed that the temperature and relative humidity are
constant, km is constant as well and its value will be
presumed to be equal to 7.0 which represent the moist
status of the membrane. Moreover, the impact of back
diffusion of water will be ignored, and (43) can be re-
presented as
Ww;mbr ¼Mwnnd
FIst ð47Þ
3.5 Anode flow model
Since the distances between the supply-return manifolds
and anodes–cathodes of the fuel cells are small, it is
assumed that multiple anodes are all lumped as one stack
anode volume, which represents the sum of volumes of
each individual anode’s volume in the stack. And the
supply manifold sm of anode lumps all the volumes of
passages and connections between hydrogen supply outlet
and the anodes, while return manifold rm lumps all the
volumes of passages and connections between anode exit
outlet and the exit outlet of hydrogen of the stack. It is also
assumed that the impact of back diffusion of water mole-
cules from cathode to anode is null. Thus, anode chamber
will be occupied by hydrogen gas only.
Mass flow rate between two volumes can be determined
via using linearized nozzle equation given in [30, 32], then
the mass flow rate of hydrogen at the exit of the supply
manifold of anode is determined by
Wsm;out;an ¼ Ksm;out;an Psm;out;an � Pan;in
� �ð48Þ
where Pan,in is the pressure of hydrogen enter the anode;
Wsm,out,an is assumed to be equal to Wsm,in,an under
condition of steady flow; Ksm,out,an is the nozzle constant
of supply manifold outlet of anode, which represents the
ratio of mass flow rate of hydrogen to the pressure, and its
value is determined and presented in Appendix 1. The rate
of change in the mass of hydrogen inside the anode of the
fuel cell is determined as
Simplified mathematical model of proton exchange membrane fuel cell based on horizon fuel… 675
123
dman
dt¼ Wan;in �Wan;out �WH2;rct ð49Þ
where Wan,in and Wan,out are the mass flow rate of hydrogen
entering and leaving the anode; WH2;rct is the mass flow of
the reacted hydrogen as a result of electrochemical reaction
as determined by [27]
WH2;rct ¼ MH2
nIst
2Fð50Þ
where MH2is the molar mass of pure hydrogen. For steady
flow, the rate of change in mass of flowing hydrogen
through any specific area in the anode would be zero (i.e.
dmH2/dt = 0) [39], then (49) can be represented as
Wan;out ¼ Wan;in �WH2;rct ð51Þ
By substituting (51) in (36), and rearranging, yields
with,
dPan;out
dt¼ dPan;in
dt� RTst
VanMH2
WH2;rct ð52Þ
Taking Laplace transform for (52), yields with,
Pan;out ¼ Pan;in �RTst
VanMH2
mH2;rct ð53Þ
where Van is the volume of anode.
From (50), if at any specific second of time, the mass
flow rate of reacted hydrogen WH2;rct in the anode is equal
to the mass of that component m at that time, which can be
substituted in (53) to determine the value of gas pressure at
the exit of the anode. Since it is assumed that the multiple
anodes in the stack are all lumped as one stack anode
volume. Hence, the pressure of hydrogen in the anode is
assumed to be approximately equal to the average sum of
input and output anode pressure as determined below.
PH2¼ Pan;in þ Pan;out
2ð54Þ
The flow of hydrogen is necessary to maintain a
minimum pressure difference between anode and cathode
and also providing sufficient hydrogen to the reaction. A
purge valve is installed at the exit outlet of return manifold
of anode in order to remove the produced water from the
cathode and also to reduce the anode pressure if necessary.
However, flow rate of hydrogen can be controlled based on
the feedback pressure difference between cathode and
anode as presented by [40].
The derived and developed equations above are imple-
mented via using Matlab–Simulink tools in order to
determine the pressures of hydrogen and oxygen in the
anode and cathode respectively, yields with determining
the output voltage of the PEM fuel cell stack. And the
horizon PEM fuel cell stack is used as a prototype device in
running the test physically in the laboratory in order to
validate and tune the developed mathematical model with
the output results of the test.
4 Initial validation of developed model of PEMfuel cell
The horizon PEM fuel cell stack was tested under
standard pressure and 23 �C operating room temperature.
The stack was operated for about 25 min under different
levels of load current varied between 1 and 17 A in steps of
1 A, with ab approximate holding time of one and a half
minutes. One Temperature sensor is installed at the exit
outlet of the fan in order to measure the temperature of the
stack.
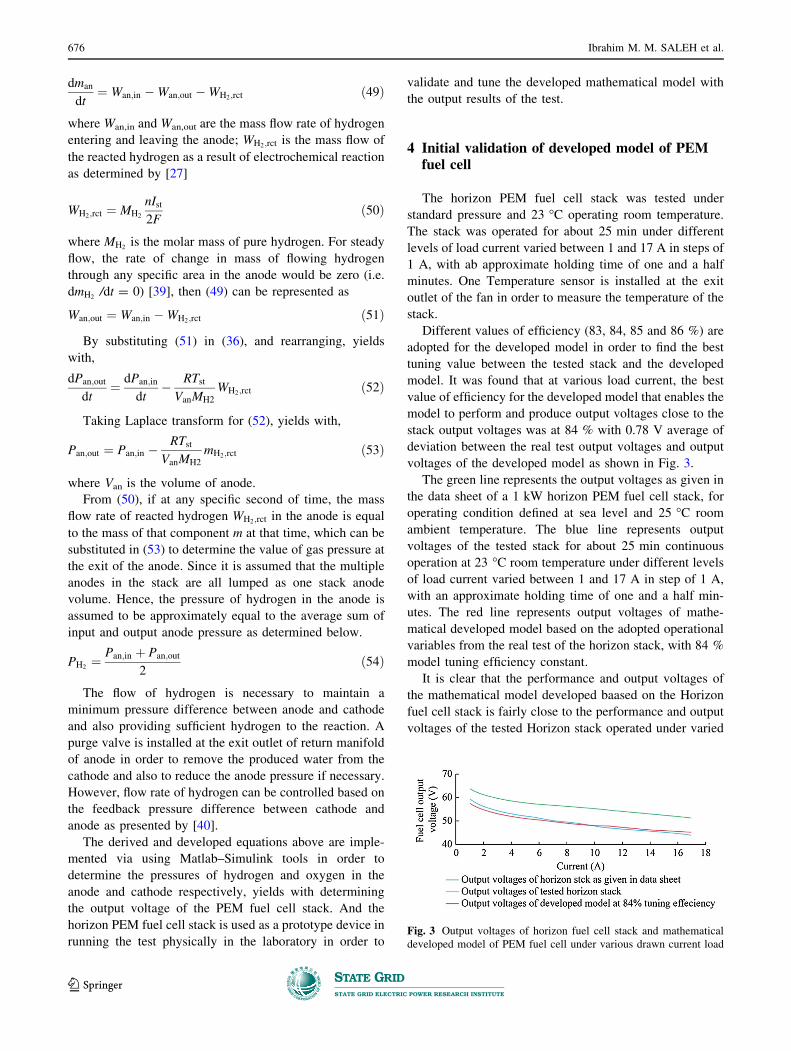
Different values of efficiency (83, 84, 85 and 86 %) are
adopted for the developed model in order to find the best
tuning value between the tested stack and the developed
model. It was found that at various load current, the best
value of efficiency for the developed model that enables the
model to perform and produce output voltages close to the
stack output voltages was at 84 % with 0.78 V average of
deviation between the real test output voltages and output
voltages of the developed model as shown in Fig. 3.
The green line represents the output voltages as given in
the data sheet of a 1 kW horizon PEM fuel cell stack, for
operating condition defined at sea level and 25 �C room
ambient temperature. The blue line represents output
voltages of the tested stack for about 25 min continuous
operation at 23 �C room temperature under different levels
of load current varied between 1 and 17 A in step of 1 A,
with an approximate holding time of one and a half min-
utes. The red line represents output voltages of mathe-
matical developed model based on the adopted operational
variables from the real test of the horizon stack, with 84 %
model tuning efficiency constant.
It is clear that the performance and output voltages of
the mathematical model developed baased on the Horizon
fuel cell stack is fairly close to the performance and output
voltages of the tested Horizon stack operated under varied
Fig. 3 Output voltages of horizon fuel cell stack and mathematical
developed model of PEM fuel cell under various drawn current load
676 Ibrahim M. M. SALEH et al.
123
levels of load current, which provides initial satisfaction
about the validity and accuracy of the proposed developed
model in this paper.
Further testing experiments are already carried out in
order to enhance the accuracy of the proposed developed
model with the changes in the operational variables. The
results of the these new running tests and their data analysis
will be presented and discussed in a separate journal paper,
in order to avoid prolongation.
5 Conclusion
A simplified zero-dimensional mathematical model of
PEM fuel cell has been developed based on a 1 kW horizon
PEM fuel cell stack by modelling the major electric and
thermodynamic variables and parameters involved in the
operation of the PEM fuel cell with the association of the
influence of the environment and conditions of the fuel cell
operation. A 1 kW horizon PEM fuel cell stack has been
used as a prototype device in running the test physically in
order to validate and tune the developed mathematical
model with the output results of the test. Initial test results
are presented in this work.
Acknowledgments Authors would like to thank Dr. George Pis-
sanidis and Leonine Kunzwa from School of Engineering and
Technology at the University of Hertfordshire for their cooperation
and technical supports during the task of testing the fuel cell stack in
their Fuel Cell Laboratory.
Open Access This article is distributed under the terms of the
Creative Commons Attribution 4.0 International License (http://
creativecommons.org/licenses/by/4.0/), which permits unrestricted
use, distribution, and reproduction in any medium, provided you give
appropriate credit to the original author(s) and the source, provide a
link to the Creative Commons license, and indicate if changes were
made.
Appendix 1
According to the specifications of the horizon fuel cell
stack, the dimensions of the stack are
26.7 9 21.6 9 8.0 cm, and the dimensions of assembled
fuel cells are 21.6 9 19.6 9 4.0 cm. Therefore, the esti-
mated volume of whole stack is approximately equal to
4614 cm3, and the estimated volume for the assembled of
72 fuel cells is approximately equal to 1693 cm3, which
represents the total volume of anodes and cathodes. The
difference between whole stack volume and total volume
of anodes–cathodes represents the volume of the supply-
return manifolds, which is approximately equal to
2921 cm3. Thickness of electrolyte membrane is
25 9 10-4 cm, and thickness of assembly bipolar plates for
anode–cathode is approximately 0.05 cm. And maximum
current production capacity is 400–500 mA/cm2 at
0.6 V/cell [31].
The area of single fuel cell is 19.6 9 4.0 = 78.4 cm2.
The area of supply manifolds of cathodes is
21.6 9 19.6 = 423.4 cm2. And the area of supply mani-
folds of anodes is 19.6 9 4.0 = 78.4 cm2.
Volume of anodes and cathodes for a stack of 72 cells
can be approximately estimated from the dimensional
properties of the stack, as determined below:
The thickness of Single cell is 21.6/72 = 0.3 cm. The
thickness of Single Anode–Cathode is
0:3� 0:05� 25� 10�4 ¼ 0:2475 cm. The volume of
Single Anode is 0:2475� 19:6� 4=2 ¼ 9:702 cm3. The
volume of Stack Anode is 9:702� 72 � 699 cm3.
Hence, volume of the fuel cell stack cathode is
699 cm3. For the horizon fuel cell stack, in order to
produce maximum current 24 A at 43.2 V, maximum
flow rate of supplied hydrogen to the stack is 14 L/min
at pressure 55 kPa, and maximum flow rate of supplied
air is 1.95 m3/min at pressure of 1 atm (101.325 kPa)
and ambient temperature 15 �C (288 K), for air density
equals to 1.225 kg/m3 [31, 41]. As it has been defined
previously, the constant Ksm,out represents the nozzle
constant of supply manifold outlet, which is the ratio of
flow rate of gas to the pressure.
Ksm;out ¼W
P
For ideal gas law
PV ¼ NRT ¼ m
MRT
Assuming that at any specific second of time, the mass
flow rate W of hydrogen or air will be equal to the mass of
that component m at that time. Then, by replacing m in the
equation of ideal gas above by W, yields with
PV ¼ W
MRT
Ksm;out ¼W
P¼ MV
RTC
where T is standard temperature; V is the volume; M is the
molar mass of gas; C is the correction constant which will
be used to tune the flow of the gas in our model with the
actual flow of the horizon fuel cell stack. Since air flows
from supply manifold to the cathode (i.e. flows between
two different volumes) is going to occupy the volume of
cathode, then by substituting the value of cathodes volume
(as estimated above 699 cm3) to estimate the value of
Ksm,out,ca, at standard temperature 15 �C, and for C = 100.
Yields with,
Simplified mathematical model of proton exchange membrane fuel cell based on horizon fuel… 677
123

Ksm;out;ca ¼MairVca
RTstC ¼ 28:97� 699� 10�6
8:31447� 288� 100
¼ 8:457� 10�4
Similarly,
Ksm;out;an ¼ MH2Van
RTstC ¼ 2:02�699�10�6
8:31447�288� 100 ¼ 0:59� 10�4
Universal gas constant is 8.31447 kJ/kmol�K =
8.31447 kPa�m3/kmol�K. And specific gas constant of air
Rair and hydrogen RH2are determined as
Rair ¼8:31447
28:97¼ 0:287 kJ/kg � K
RH2¼ 8:31447
2:016¼ 4:125 kJ/kg � K
At standard temperature 15 �C, the constant of specific
heats ratio k = cp/cv which is equal to 1.4 for dry air and
1.409 for hydrogen.
cp ¼k
k � 1Rs
cpair ¼1:4
1:4� 1� 0:287 ¼ 1:0045
cpH2¼ 1:409
1:409� 1� 4:125 ¼ 14:21
References
[1] Golbert J, Lewin DR (2004) Model-based control of fuel cells:
(1) regulatory control. J Power Sources 135(1/2):135–151
[2] Qiu J, Dong ZY, Zhao JH et al (2015) A low-carbon oriented
probabilistic approach for transmission expansion planning.
J Mod Power Syst Clean Energ 3(1):14–23. doi:10.1007/s40565-
015-0105-3
[3] El-Sharkh MY, Rahman A, Alam MS et al (2004) A dynamic
model for a stand-alone PEM fuel cell power plant for resi-
dential applications. J Power Sources 138(1/2):199–204
[4] Rodatz P, Paganelli G, Sciarretta A et al (2005) Optimal power
management of an experimental fuel cell/supercapacitor-pow-
ered hybrid vehicle. Control Eng Pract 13(1):41–53
[5] Bordons C, Arce A, del Real AJ (2006) Constrained predictive
control strategies for PEM fuel cells. In: Proceedings of the 2006
American control conference, Minneapolis, MN, USA, 14–16
Jun 2006, pp 2486–2491
[6] Chen SL, Bocarsly AB, Benziger J (2005) Nafion-layered sul-
fonated polysulfone fuel cell membranes. J Power Sources
152(1):27–33
[7] Pathapati PR, Xue X, Tang J (2005) A new dynamic model for
predicting transient phenomena in a PEM fuel cell system.
Renew Energy 130(1):1–22
[8] Amphlett JC, Mann RF, Peppley BA et al (1996) A model
predicting transient responses of proton exchange membrane
fuel cells. J Power Sources 61(1):183–188
[9] Amphlett JC, Baumert RM, Mann RF et al (1994) Parametric
modelling of the performance of a 5-kW proton-exchange
membrane fuel cell stack. J Power Sources 49(1):349–356
[10] Amphlett JC, Baumert RM, Mann RF et al (1995) Performance
modeling of the ballard mark IV solid polymer electrolyte fuel
cell, I: mechanistic model development. J Electrochem Soc
142(1):1–8
[11] Amphlett JC, Baumert RM, Mann RF et al (1995) Performance
modeling of the ballard mark IV solid polymer electrolyte fuel
cell, II: empirical model development. J Electrochem Soc
142(1):9–15
[12] Springer TE, Zawodzinski TA, Gottesfeld S (1991) Polymer
electrolyte fuel cell model. J Electrochem Soc 138(8):2334–2342
[13] Buchi FN, Scherer GG (1996) In-situ resistance measurements
of Nafion� 117 membranes in polymer electrolyte fuel cells.
J Electroanal Chem 404(1):37–43
[14] Yi JS, Nguyen TV (1998) An along-the-channel model for
proton exchange membrane fuel cells. J Electrochem Soc
145(4):1149–1159
[15] Pukrushpan JT, Stefanopoulou AG, Peng H (2002) Modeling
and control for PEM fuel cell stack system. In: Proceedings of
the 2002 American control conference, Vol 4, Anchorage, UK,
USA, 8–10 May 2002, pp 3117–3122
[16] Rowe A, Li XG (2001) Mathematical modeling of proton
exchange membrane fuel cells. J Power Sources 102(1/2):82–96
[17] Pasricha S, Shaw SR (2006) A dynamic PEM fuel cell model.
IEEE Trans Energy Conver 21(2):484–490
[18] del Real AJ, Arce A, Bordons C (2007) Development and
experimental validation of a PEM fuel cell dynamic model.
J Power Sources 173(1):310–324
[19] Park SK, Choe SY (2008) Dynamic modeling and analysis of a
20-cell PEM fuel cell stack considering temperature and two-
phase effects. J Power Sources 179(2):660–672
[20] Youssef ME, Al-Nadi KE, Khalil MH (2010) Lumped model for
proton exchange membrane fuel cell (PEMFC). Int J Elec-
trochem Sci 5:267–277
[21] Yuan W, Tang Y, Pan MQ et al (2010) Model prediction of
effects of operating parameters on proton exchange membrane
fuel cell performance. Renew Energ 35(3):656–666
[22] Seyezhai R, Mathur BL (2011) Mathematical modeling of pro-
ton exchange membrane fuel cell. Int J Comput Appl 102(5):1–6
[23] Abul-Hawa AA, Ebaid MS, Bhinder FS et al (2006) Control
strategy for polymer electrolyte membrane fuel cell systems. In:
Proceedings of the 2006 UKACC international conference
on control, Glasgow, UK, 30 Aug 1 Sept 2006, p 94
[24] Mann RF, Amphlett JC, Hooper MAI et al (2000) Development
and application of a generalised steady-state electrochemical
model for a PEM fuel cell. J Power Sources 86(1):173–180
[25] Khan MJ, Iqbal MT (2005) Dynamic modeling and simulation
of a small wind-fuel cell hybrid energy system. Renew Energ
30(3):421–439
[26] Pasaogullari U, Wang CY (2005) Modeling polymer electrolyte
fuel cells with large density and velocity changes. J Electrochem
Soc 152(2):A445–A453
[27] Larminie J, Dicks A (2003) Fuel cell systems explained, 2nd
edn. Wiley, New York
[28] Pukrushpan JT, Stefanopoulou AG, Peng H (2004) Control of
fuel cell breathing. IEEE Control Syst 24(2):30–46
[29] Saleh IMM, Calay RK, Ali R (2013) Modelling and examining
open circuit voltage for PEM fuel cell. J Electr Eng 13(3):140–146
[30] Pukrushpan JT, Peng H, Stefanopoulou AG et al (2002) Simu-
lation and analysis of transient fuel cell system performance
based on a dynamic reactant flow model. In: Proceedings of the
ASME international mechanical engineering congress & expo-
sition (IMECE’02), Orleans, LA, USA, 17–22 Nov 2002,
pp 637–648
[31] H-1000 fuel cell stack-user manual. Horizon Educational, Paris,
France, 2011
[32] Grujicic M, Chittajallu KM, Law EH et al (2004) Model-based
control strategies in the dynamic interaction of air supply and
fuel cell. Proc Inst Mech Eng A-J Power Energy 218(7):487–499
678 Ibrahim M. M. SALEH et al.
123
[33] Eck B (1973) FANS: design and operation of centrifugal, axial-
flow and cross-flow fans. Pergamon Press, Oxford
[34] Improving fan system performance: A sourcebook for industry.
Industrial energy efficiency sourcebooks. DOE/GO-102003-
1294. Air Movement and Control Association International, Inc,
The United States Department of Energy, Washington, DC,
USA, 2003
[35] Specification for approval. Delta Electronics, Inc, Taoyuan
Hsien, Taiwan, China, 2005
[36] Jones WP (2001) Air conditioning engineering, 5th edn. But-
terworth-Heinemann, Oxford
[37] Doolittle JS, Hale FJ (1984) Thermodynamics for engineers.
Wiley, New York
[38] Cengel YA, Boles MA (2008) Thermodynamics: an engineering
approach, 6th edn. McGraw-Hill, New York
[39] Batchelor GK (1967) An introduction to fluid dynamics. Cam-
bridge University Press, Cambridge
[40] Pukrushpan JT, Peng H, Stefanopoulou AG (2004) Control-
oriented modeling and analysis for automotive fuel cell systems.
J Dyn Syst-T ASME 126(1):14–25
[41] H-1000XP fuel cell stack-user manual. Horizon Educational,
Paris, France, 2011
Ibrahim M. M. SALEH is currently a Ph.D research student at
Sheffield Hallam University, Materials Engineering Research
Institute. He optioned his B.Sc in Electrical and Electronic Engi-
neering in 1996, and his M.Sc with Distinction in the field of
Electrical Engineering and Power Electronics from the University of
Bradford in 2007. His experience extends over more than twelve
years in different professional fields, such as maintenance and
operation, site and project engineer, coordination and consultancy.
Rashid ALI joined Sheffield Hallam University in 2014. Currently he
is a senior Lecturer in Flight Simulation and Control in the
Department of Engineering and Mathematics. Before joining Shef-
field Hallam, he worked as a senior lecturer at Hertfordshire
University (2004–2014) and a director of RALI Consultants Limited
(1988–2004). He obtained his Ph.D in Flight Control Systems in 1985
following his B.Sc in Mathematics and BTech(Hons) in Aeronautical
Engineering from Loughborough University.
Hongwei ZHANG joined Sheffield Hallam University in 2007.
Currently he is a Principal Lecturer in Control Systems and the
Subject Group Leader of the Automation and Operations Group.
Before joining Sheffield Hallam, h worked as a Research Associate at
The University of Manchester (2001–2003) and then a Lecturer in
Control Engineering at North East Wales Institute, University of
Wales (2003–2006).
Simplified mathematical model of proton exchange membrane fuel cell based on horizon fuel… 679
123