simplymap canada research guide - york university
TRANSCRIPT

October 2016
SimplyMap Canada Research Guide
Contents
What is SimplyMap? ........................................................................................................................................................................ 1 What can I do with SimplyMap? ...................................................................................................................................................... 1 Get Started Using SimplyMap .......................................................................................................................................................... 1 Understanding the Geography of the Census ................................................................................................................................... 1 SimplyMap Scenarios ....................................................................................................................................................................... 1
Scenario One (Locations Analysis) .............................................................................................................................................. 1 A) Generating a Location Analysis report ................................................................................................................................. 2
B) Creating a map of the chosen CSDs for a visual analysis of the data ................................................................................... 6
Scenario Two (Competitors Analysis) .......................................................................................................................................... 8 A) Creating a map ..................................................................................................................................................................... 8
B) Downloading a list of competitors in spreadsheet format based on business points on a map ....................................... 13
C) Creating a map of incomes in Milton area ......................................................................................................................... 15
Scenario Three (Ring Study) ...................................................................................................................................................... 18 Ring study report showing total spending on children’s/early teens’ footwear .................................................................... 18
Scenario Four (PRIZM5 Lifestage Group Analysis) .................................................................................................................. 22 A) Map illustrating relative concentration of the PRIZM5 lifestage group in Toronto ........................................................... 22
B) Showing competitors on a map ......................................................................................................................................... 25
What is SimplyMap? SimplyMap is a web-based mapping application that enables the creation of maps, ring studies, rankings and reports using online demographic, business and marketing data. The information enhances market and business research by supporting the generation of reports and analysis relating to business planning and development activities.
What can I do with SimplyMap? ● Make a map (map)● Compare variables in a table (Standard Report)● Rank locations based on a variable (Rank Wizard)● Create a demographic analysis (Ring Study)● View and compare data for a location (Location Analysis Wizard)● Create a demographic and psychographic analysis of consumers (PRIZM5 data)
Get Started Using SimplyMap SimplyMap is accessible via the library homepage: www.library.yorku.ca (off-campus, Passport York credentials are required). Type SimplyMap in the grey Library Resources search box and click the Find button. Select the “Click to access this resource” link to open SimplyMap. While it is possible to log in as a guest, first time users are advised to create an account. Once you have an account you can proceed to login.
Understanding the Geography of the Census A lot of the data variables in SimplyMap are from the Census which is structured by Census Geography which uses census specific terminology. Census sub-divisions is a rough equivalent to a city or municipality, census tracts is a small unit within a subdivision, and census division is a rural designation and a rough equivalent to a county or regional municipality.
SimplyMap Scenarios Here are five scenarios illustrating how to use SimplyMap to search for data and create tables and maps to support market analysis and business planning requirements.
The scenarios are: 1. Locations Analysis2. Competitors Analysis3. Ring Study4. PRIZM5 Lifestage Group Analysis (Psychographic analysis)
Scenario One (Locations Analysis)
Creating a demographic profile of a target market by analyzing a geographic area based on various data variables can help to determine if a location is suited for a particular line of business.
1
A new outdoor lifestyle magazine is being considered in British Columbia (B.C.), for urban and rural dwellers. It is important to track spending on magazines in the province while also generating data on spending on recreation equipment to create the location analysis. Of particular interest are those areas of B.C. where spending on recreation equipment is at least $1500 a month.
Scenario One will generate the following: ● Location Analysis Report - Part A● Map of Census Subdivisions (CSD) for visual analysis- Part B
A) Generating a Location Analysis report
The steps outlined below illustrate how to create a location analysis report for British Columbia, showing the average spending on recreation equipment, and average spending on magazines.
Follow the steps below to produce a location analysis report:
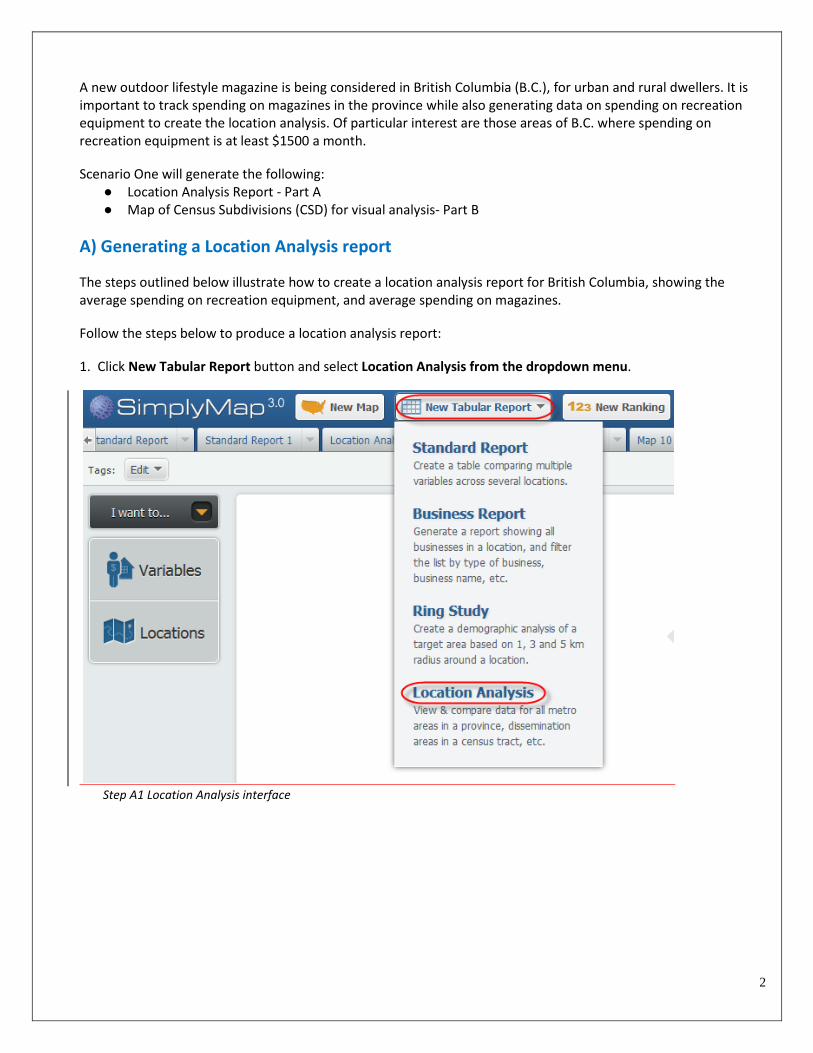
1. Click New Tabular Report button and select Location Analysis from the dropdown menu.
Step A1 Location Analysis interface
2
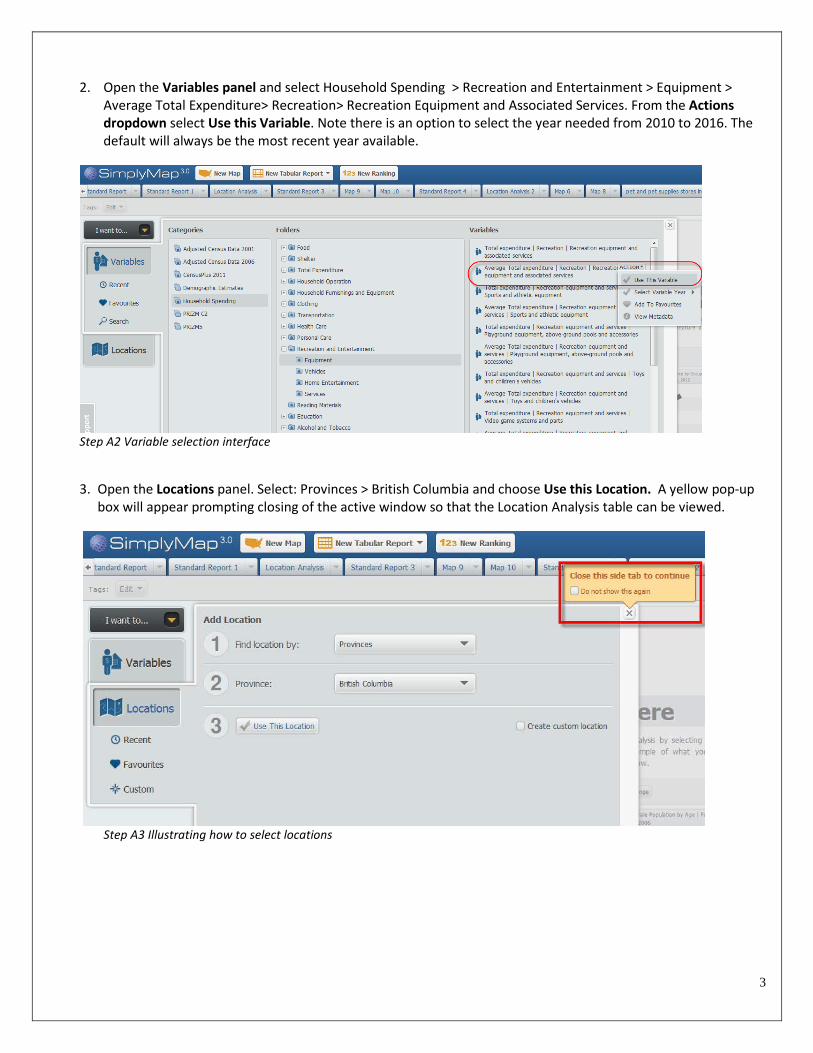
2. Open the Variables panel and select Household Spending > Recreation and Entertainment > Equipment >Average Total Expenditure> Recreation> Recreation Equipment and Associated Services. From the Actionsdropdown select Use this Variable. Note there is an option to select the year needed from 2010 to 2016. Thedefault will always be the most recent year available.
Step A2 Variable selection interface
3. Open the Locations panel. Select: Provinces > British Columbia and choose Use this Location. A yellow pop-upbox will appear prompting closing of the active window so that the Location Analysis table can be viewed.
Step A3 Illustrating how to select locations
3
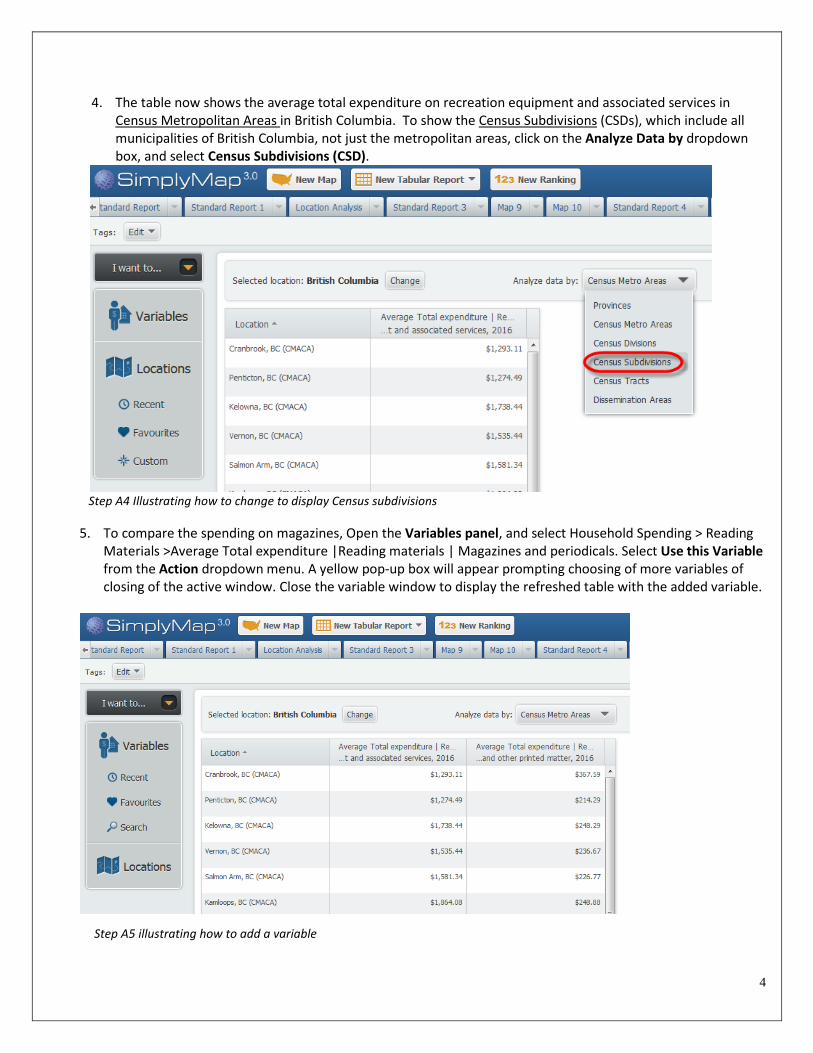
4. The table now shows the average total expenditure on recreation equipment and associated services inCensus Metropolitan Areas in British Columbia. To show the Census Subdivisions (CSDs), which include allmunicipalities of British Columbia, not just the metropolitan areas, click on the Analyze Data by dropdownbox, and select Census Subdivisions (CSD).
Step A4 Illustrating how to change to display Census subdivisions
5. To compare the spending on magazines, Open the Variables panel, and select Household Spending > ReadingMaterials >Average Total expenditure |Reading materials | Magazines and periodicals. Select Use this Variablefrom the Action dropdown menu. A yellow pop-up box will appear prompting choosing of more variables ofclosing of the active window. Close the variable window to display the refreshed table with the added variable.
4
Step A5 illustrating how to add a variable
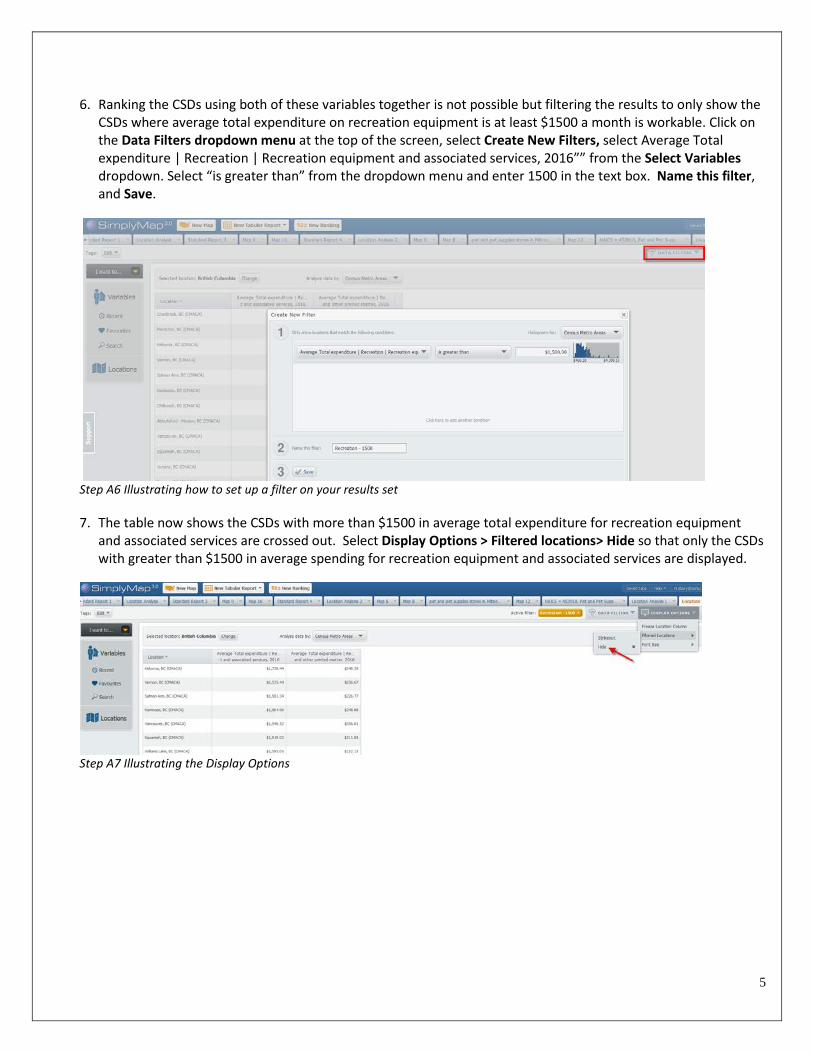
6. Ranking the CSDs using both of these variables together is not possible but filtering the results to only show theCSDs where average total expenditure on recreation equipment is at least $1500 a month is workable. Click onthe Data Filters dropdown menu at the top of the screen, select Create New Filters, select Average Totalexpenditure | Recreation | Recreation equipment and associated services, 2016”” from the Select Variablesdropdown. Select “is greater than” from the dropdown menu and enter 1500 in the text box. Name this filter,and Save.
Step A6 Illustrating how to set up a filter on your results set
7. The table now shows the CSDs with more than $1500 in average total expenditure for recreation equipmentand associated services are crossed out. Select Display Options > Filtered locations> Hide so that only the CSDswith greater than $1500 in average spending for recreation equipment and associated services are displayed.
Step A7 Illustrating the Display Options
5
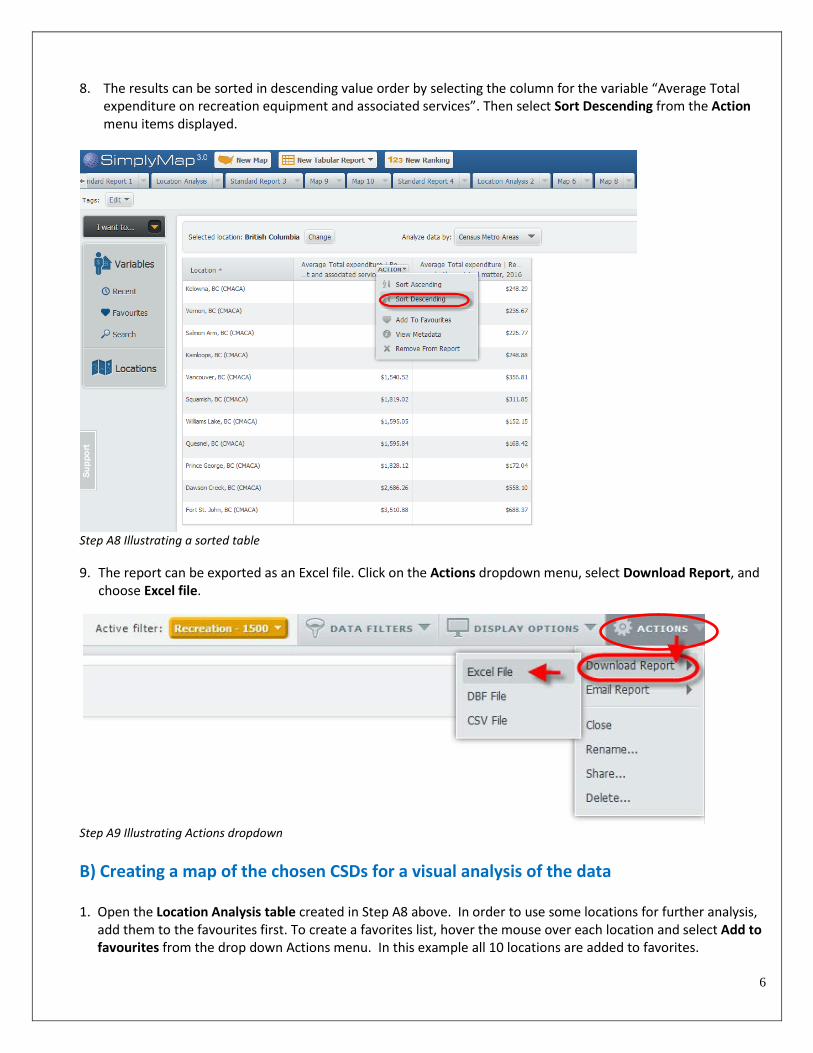
8. The results can be sorted in descending value order by selecting the column for the variable “Average Totalexpenditure on recreation equipment and associated services”. Then select Sort Descending from the Actionmenu items displayed.
Step A8 Illustrating a sorted table
9. The report can be exported as an Excel file. Click on the Actions dropdown menu, select Download Report, andchoose Excel file.
Step A9 Illustrating Actions dropdown
B) Creating a map of the chosen CSDs for a visual analysis of the data
1. Open the Location Analysis table created in Step A8 above. In order to use some locations for further analysis,add them to the favourites first. To create a favorites list, hover the mouse over each location and select Add tofavourites from the drop down Actions menu. In this example all 10 locations are added to favorites.
6
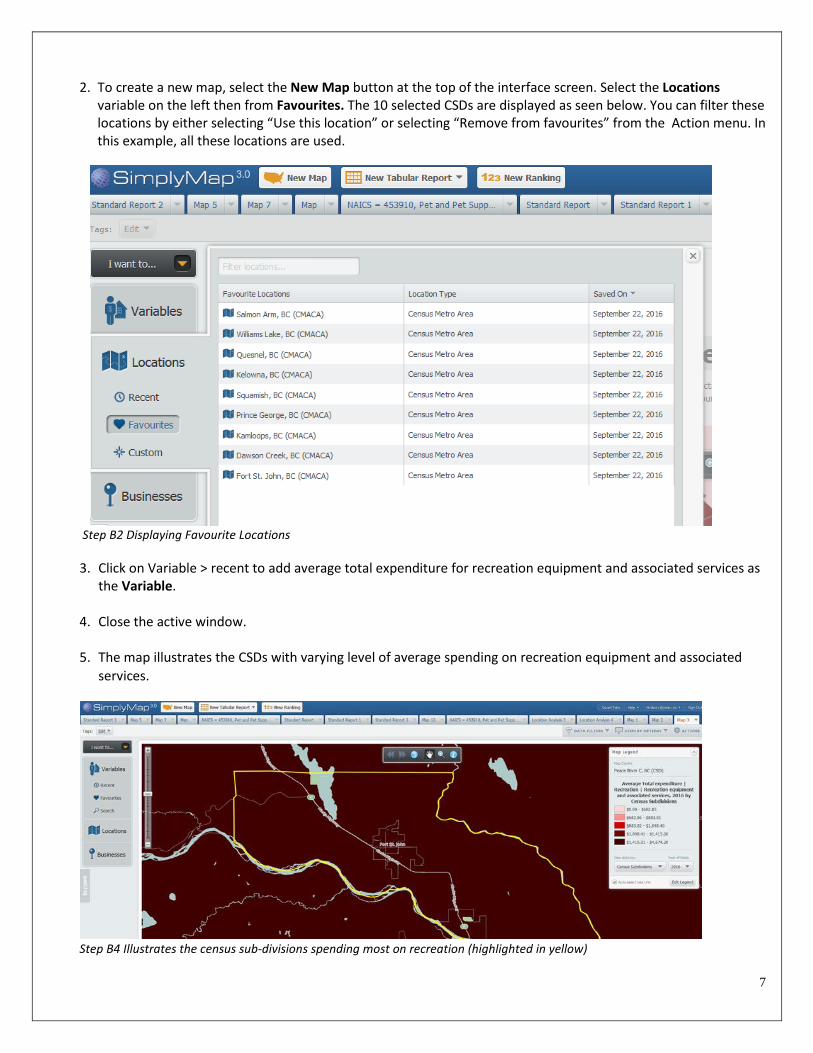
2. To create a new map, select the New Map button at the top of the interface screen. Select the Locationsvariable on the left then from Favourites. The 10 selected CSDs are displayed as seen below. You can filter theselocations by either selecting “Use this location” or selecting “Remove from favourites” from the Action menu. Inthis example, all these locations are used.
Step B2 Displaying Favourite Locations
3. Click on Variable > recent to add average total expenditure for recreation equipment and associated services asthe Variable.
4. Close the active window.
5. The map illustrates the CSDs with varying level of average spending on recreation equipment and associatedservices.
Step B4 Illustrates the census sub-divisions spending most on recreation (highlighted in yellow)
7

Scenario Two (Competitors Analysis)
When considering a business and scouting locations, research on spending patterns is important as is information on competitors.
Scenario Two examines the concept of establishing a pet store. Milton is being considered as a potential location because it is a growing population that has both rural /agricultural communities. To create a Competitor Analysis it is necessary to track total spending on pets and related pet products and simultaneously identify the locations of all pet stores in the area. Income will be an important variable to determine whether the store can offer more expensive products.
Scenario Two will generate the following:
Outputs ● Map of locations of competitors in the category, e.g. Pet Food/Pet Supplies● Map of total spending on pets and related pet products● Download list of competitors into a spreadsheet● Bonus/Additional - Download report for the Milton area with the list of top ten highest income
dissemination areas, and a list of dissemination areas with the top ten levels of total pet expenses.
A) Creating a mapThe steps outlined below demonstrate how to generate a map that illustrates total spending on pets and related pet goods, and locations of competitors in the category, e.g. Pet Food/Pet Supplies. This also facilitates the generation of a map of franchise competitors, e.g. Pet Valu.
Follow the steps below to produce a map:
1. Click New Map from the top of the interface screen.2. Open the Variables panel on the left.3. Select Household Spending > Household Operation > Pet Expenses > Total expenditure Ι Household operation Ι
Purchase of pets and related pet goods. Select the arrow on the Action dropdown and select Use this variableand select variable year (2016 is the default).
Step A3 Illustrating variable selection
8
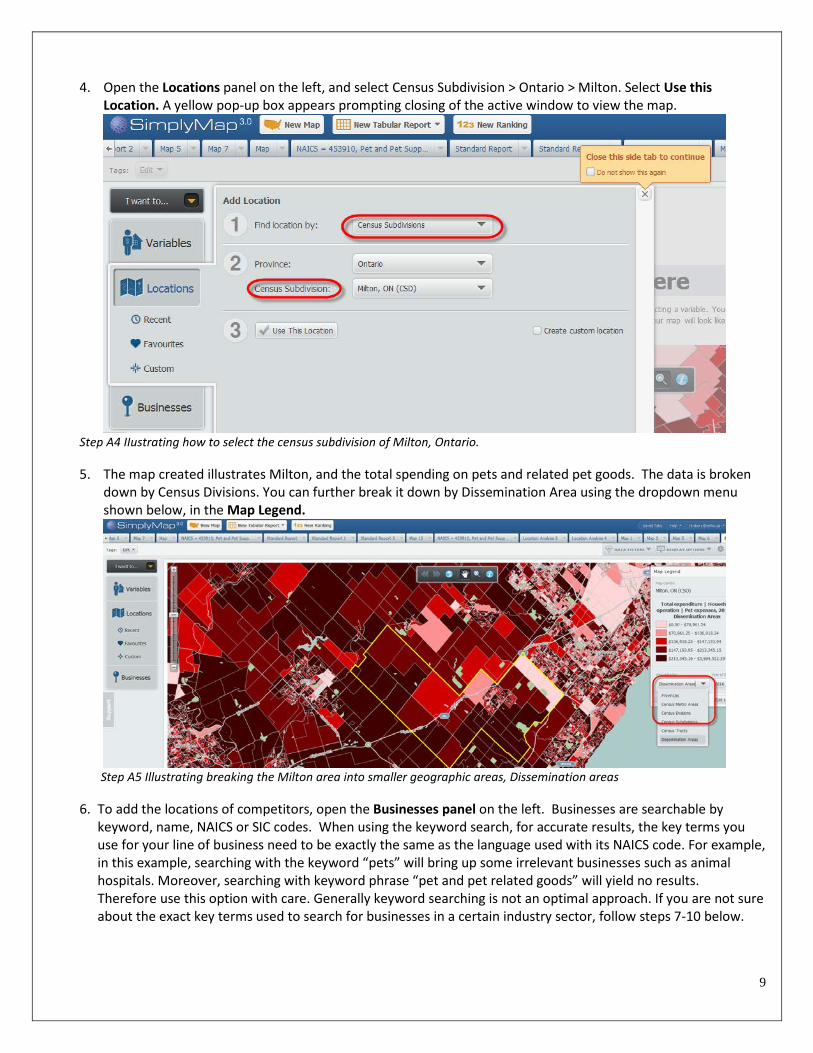
4. Open the Locations panel on the left, and select Census Subdivision > Ontario > Milton. Select Use thisLocation. A yellow pop-up box appears prompting closing of the active window to view the map.
Step A4 IIustrating how to select the census subdivision of Milton, Ontario.
5. The map created illustrates Milton, and the total spending on pets and related pet goods. The data is brokendown by Census Divisions. You can further break it down by Dissemination Area using the dropdown menushown below, in the Map Legend.
Step A5 Illustrating breaking the Milton area into smaller geographic areas, Dissemination areas
6. To add the locations of competitors, open the Businesses panel on the left. Businesses are searchable bykeyword, name, NAICS or SIC codes. When using the keyword search, for accurate results, the key terms youuse for your line of business need to be exactly the same as the language used with its NAICS code. For example,in this example, searching with the keyword “pets” will bring up some irrelevant businesses such as animalhospitals. Moreover, searching with keyword phrase “pet and pet related goods” will yield no results.Therefore use this option with care. Generally keyword searching is not an optimal approach. If you are not sureabout the exact key terms used to search for businesses in a certain industry sector, follow steps 7-10 below.
9
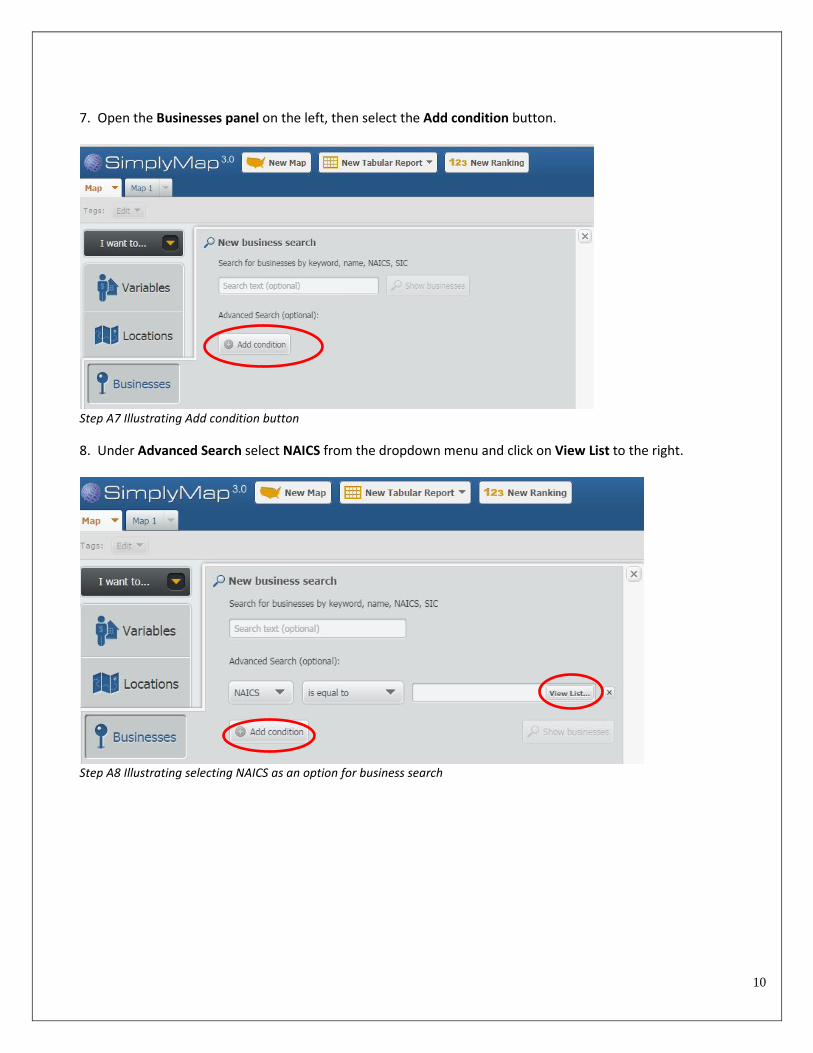
7. Open the Businesses panel on the left, then select the Add condition button.
Step A7 Illustrating Add condition button
8. Under Advanced Search select NAICS from the dropdown menu and click on View List to the right.
Step A8 Illustrating selecting NAICS as an option for business search
10
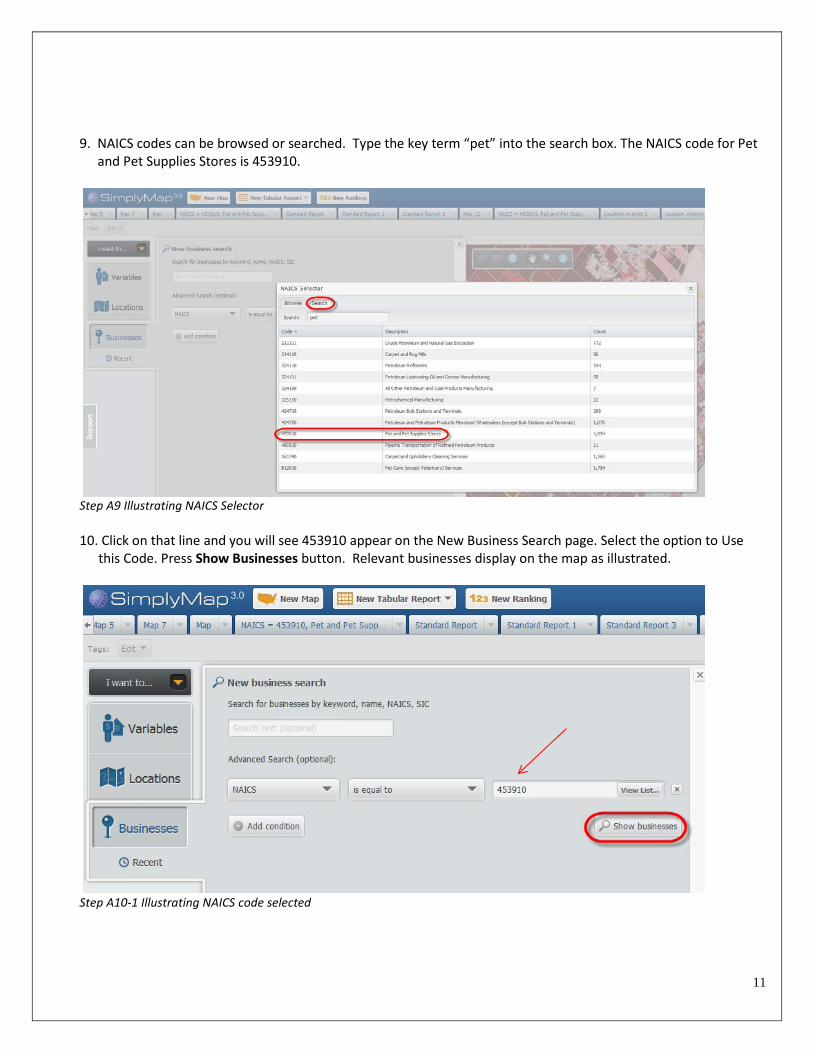
9. NAICS codes can be browsed or searched. Type the key term “pet” into the search box. The NAICS code for Petand Pet Supplies Stores is 453910.
Step A9 Illustrating NAICS Selector
10. Click on that line and you will see 453910 appear on the New Business Search page. Select the option to Usethis Code. Press Show Businesses button. Relevant businesses display on the map as illustrated.
Step A10-1 Illustrating NAICS code selected
11
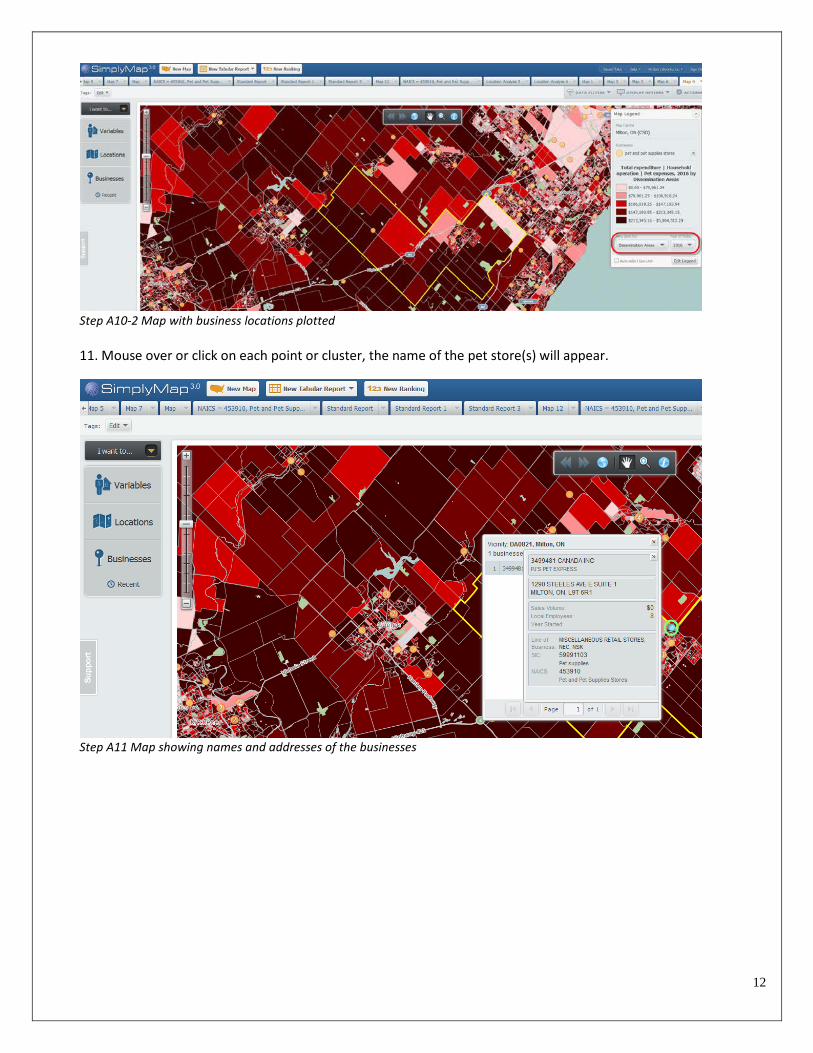
Step A10-2 Map with business locations plotted
11. Mouse over or click on each point or cluster, the name of the pet store(s) will appear.
Step A11 Map showing names and addresses of the businesses
12

B) Downloading a list of competitors in spreadsheet format based on business points ona map
1. A list of Pet and Pet Supplies stores in Milton can be created from the map. Under the Actions menu on the topright of the screen, select Make Report from Businesses. This will generate a list of the pet stores, along withother information such as an address, telephone number, total sales, number of employees etc. The list can bedownloaded or emailed as an Excel, DBF, or CSV file, under the Actions menu.
Step B1-1 Illustrating menu selection to create a business list from plotted map
Step B1-2 Table showing business list and output options under Actions menu
13
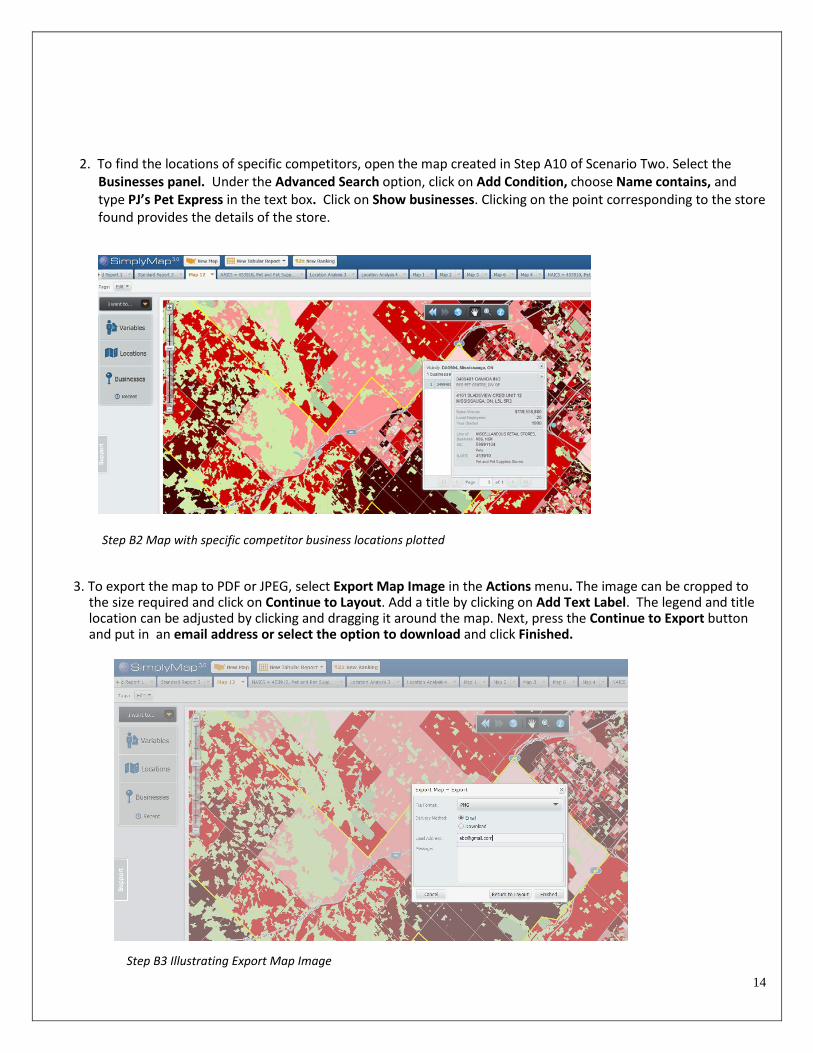
2. To find the locations of specific competitors, open the map created in Step A10 of Scenario Two. Select theBusinesses panel. Under the Advanced Search option, click on Add Condition, choose Name contains, andtype PJ’s Pet Express in the text box. Click on Show businesses. Clicking on the point corresponding to the storefound provides the details of the store.
Step B2 Map with specific competitor business locations plotted
3. To export the map to PDF or JPEG, select Export Map Image in the Actions menu. The image can be cropped tothe size required and click on Continue to Layout. Add a title by clicking on Add Text Label. The legend and titlelocation can be adjusted by clicking and dragging it around the map. Next, press the Continue to Export buttonand put in an email address or select the option to download and click Finished.
14 Step B3 Illustrating Export Map Image

C) Creating a map of incomes in Milton area
Generating lists of the ten dissemination areas (DAs) within Milton with the highest average income, and a list of DAs with the highest total spending on pet expenses helps inform where to locate a new store. These lists can be cross-referenced against the map of competitors.
1. Click New Map button. Open the Variables panel, and select Demographic Estimates > Household Income > InCurrent Year Dollars > Household Income| Average Household Income (Current Year $), select Use ThisVariable from the Action menu.
2.Open the Locations panel on the left, and select Census Subdivision > Ontario > Milton. Select Use this Location.A yellow pop-up box appears prompting closing of the active window to view the map. The map will show theaverage household income in Milton by Census Subdivision. It can be further analyzed by Dissemination Area inthe Map Legend.
15
Step C2 Illustrating average household income in Milton by dissemination areas

3. To compare the areas with the highest average income and highest total pet spending, select New TabularReport – Location Analysis. The variables for selection are Average Household Income, and Total spending onpets and related pet goods. These variables can be selected from Recent under the Variables button, if formersteps in this scenario were followed, and the variables have recently been used.
Open the Locations panel. Select Census Subdivision > Province: Ontario > Milton or select Milton, ON (CSD)from Recent under the Locations button if this location has recently been used. Select Use this Location. Ayellow pop-up box will appear prompting closing of the active window so that the Location Analysis table can beviewed.
16
Step C3 Table listing two variables
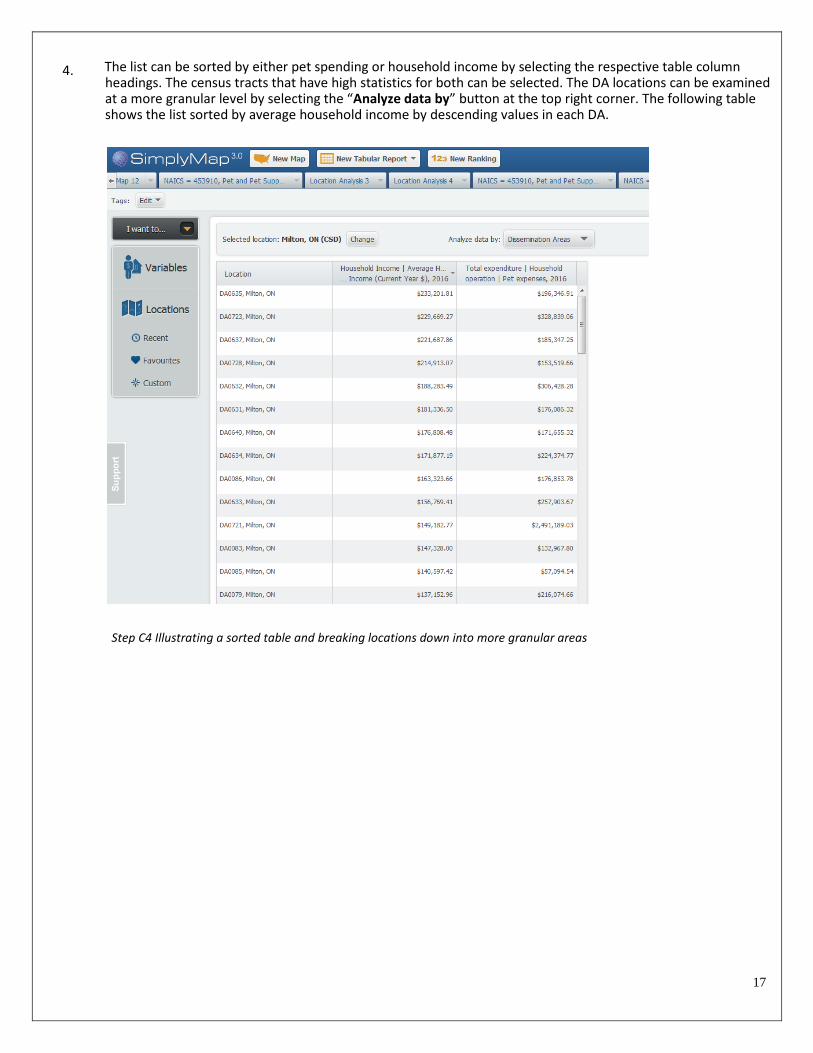
4. The list can be sorted by either pet spending or household income by selecting the respective table columnheadings. The census tracts that have high statistics for both can be selected. The DA locations can be examinedat a more granular level by selecting the “Analyze data by” button at the top right corner. The following tableshows the list sorted by average household income by descending values in each DA.
17
Step C4 Illustrating a sorted table and breaking locations down into more granular areas
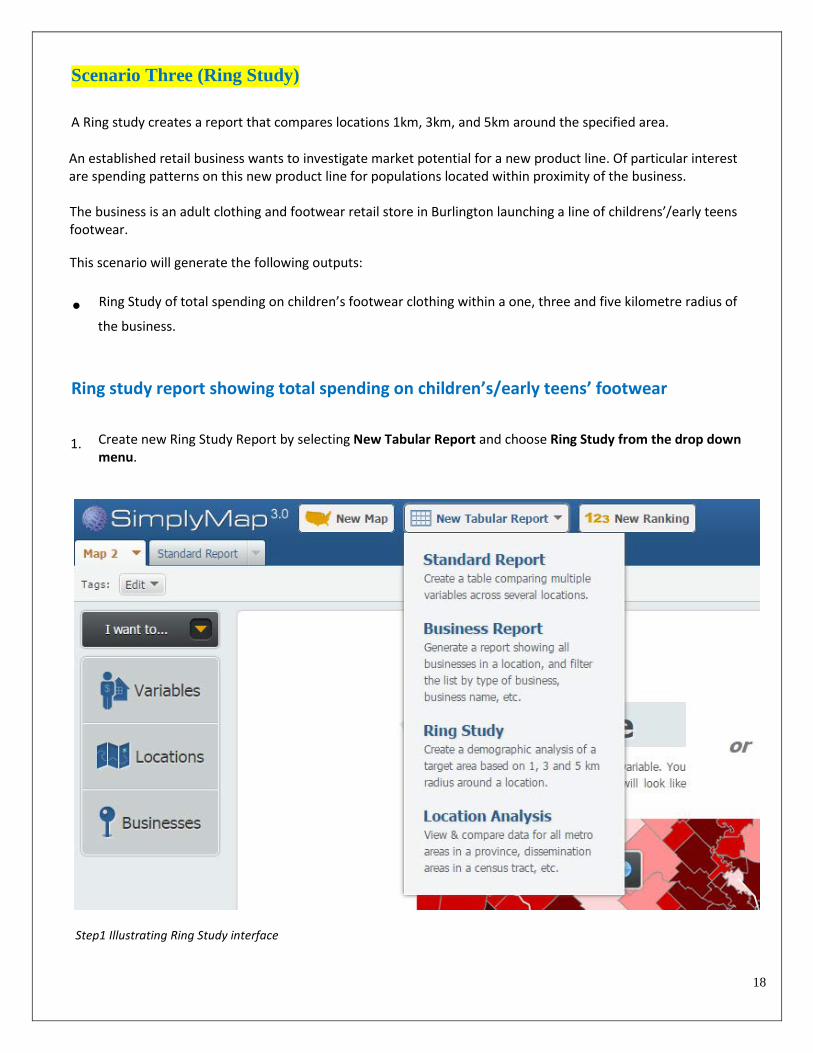
Scenario Three (Ring Study)
A Ring study creates a report that compares locations 1km, 3km, and 5km around the specified area.
An established retail business wants to investigate market potential for a new product line. Of particular interest are spending patterns on this new product line for populations located within proximity of the business.
The business is an adult clothing and footwear retail store in Burlington launching a line of childrens’/early teens footwear.
This scenario will generate the following outputs:
● Ring Study of total spending on children’s footwear clothing within a one, three and five kilometre radius of
the business.
Ring study report showing total spending on children’s/early teens’ footwear
1. Create new Ring Study Report by selecting New Tabular Report and choose Ring Study from the drop downmenu.
18
Step1 Illustrating Ring Study interface
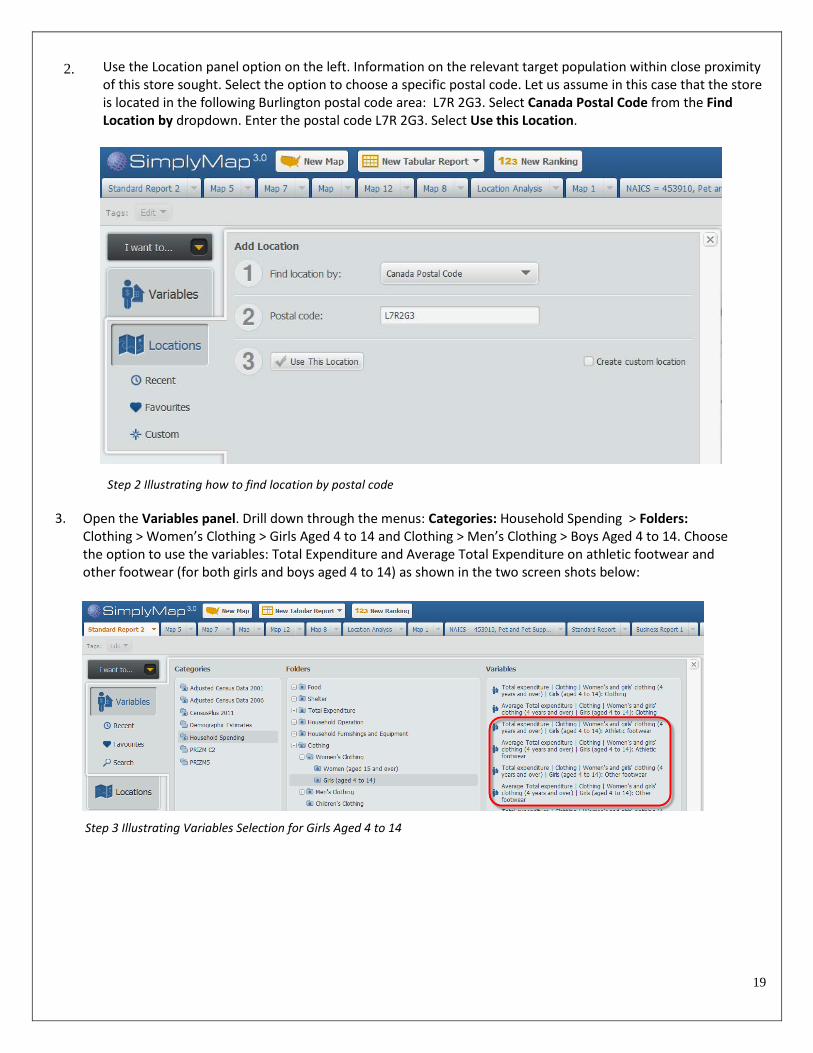
2. Use the Location panel option on the left. Information on the relevant target population within close proximityof this store sought. Select the option to choose a specific postal code. Let us assume in this case that the storeis located in the following Burlington postal code area: L7R 2G3. Select Canada Postal Code from the FindLocation by dropdown. Enter the postal code L7R 2G3. Select Use this Location.
19
Step 2 Illustrating how to find location by postal code
Open the Variables panel. Drill down through the menus: Categories: Household Spending > Folders: Clothing > Women’s Clothing > Girls Aged 4 to 14 and Clothing > Men’s Clothing > Boys Aged 4 to 14. Choose the option to use the variables: Total Expenditure and Average Total Expenditure on athletic footwear and other footwear (for both girls and boys aged 4 to 14) as shown in the two screen shots below:
3.
Step 3 Illustrating Variables Selection for Girls Aged 4 to 14
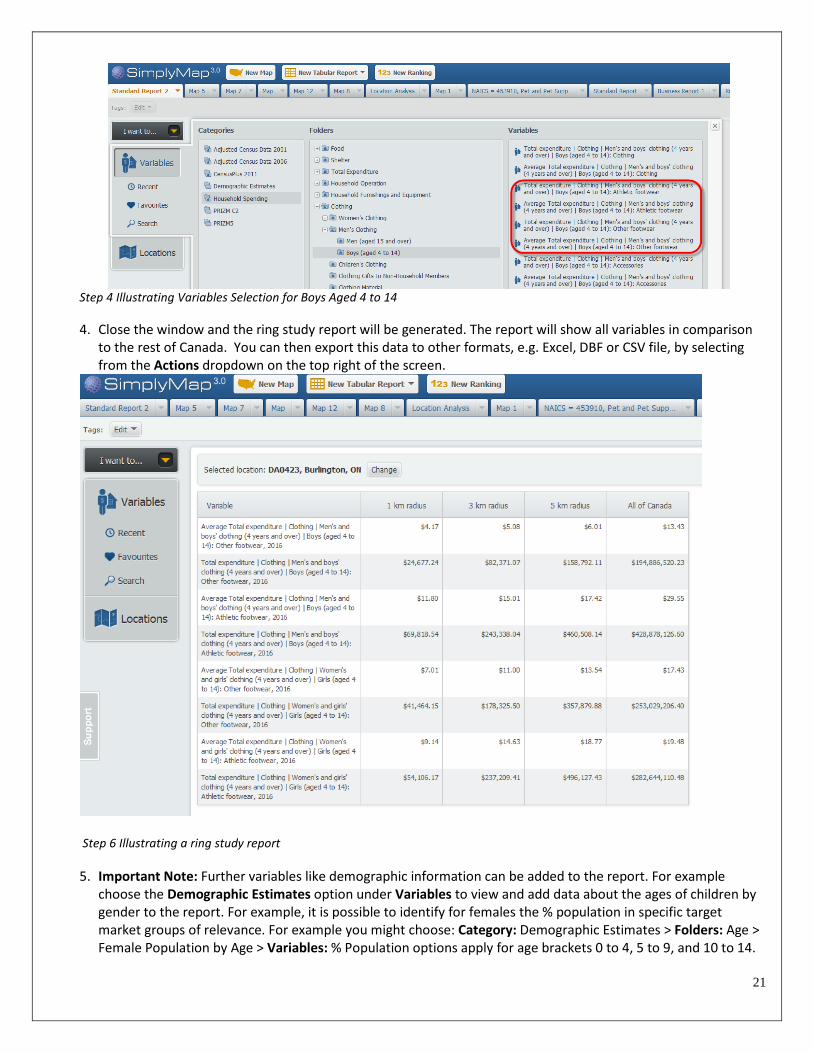
Step 4 Illustrating Variables Selection for Boys Aged 4 to 14
4. Close the window and the ring study report will be generated. The report will show all variables in comparisonto the rest of Canada. You can then export this data to other formats, e.g. Excel, DBF or CSV file, by selectingfrom the Actions dropdown on the top right of the screen.
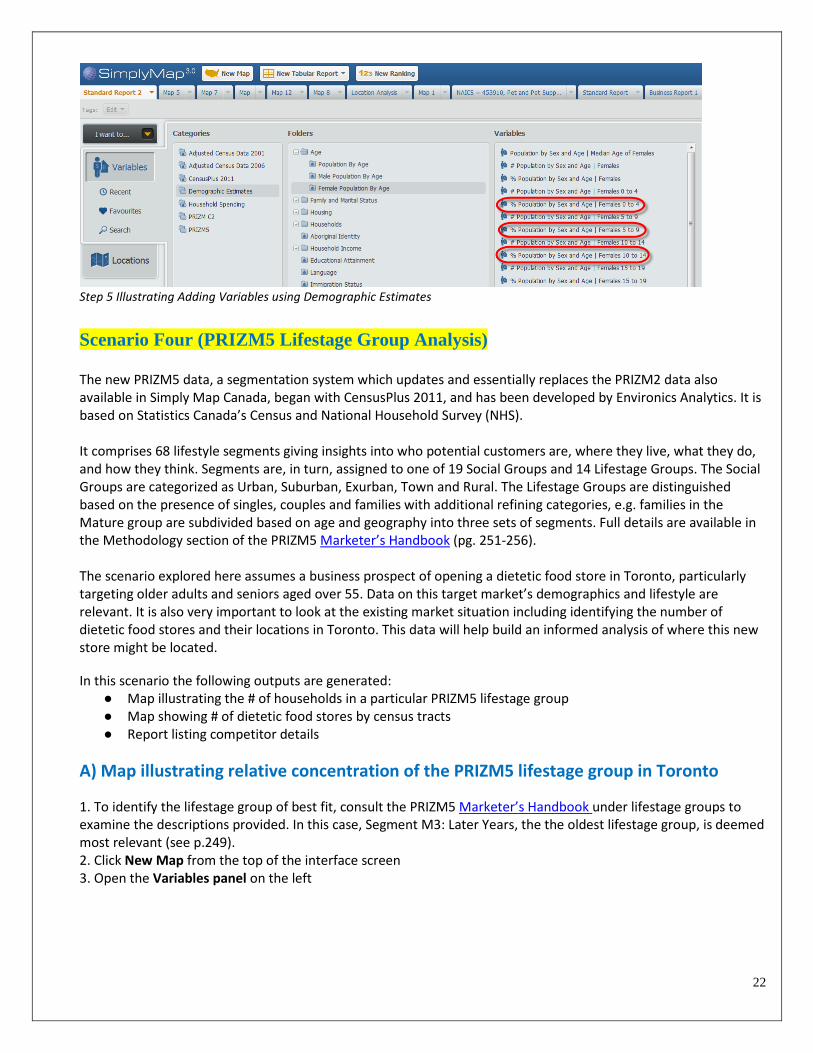
Step 6 Illustrating a ring study report
5. Important Note: Further variables like demographic information can be added to the report. For examplechoose the Demographic Estimates option under Variables to view and add data about the ages of children bygender to the report. For example, it is possible to identify for females the % population in specific targetmarket groups of relevance. For example you might choose: Category: Demographic Estimates > Folders: Age >Female Population by Age > Variables: % Population options apply for age brackets 0 to 4, 5 to 9, and 10 to 14.
21
Step 5 Illustrating Adding Variables using Demographic Estimates
Scenario Four (PRIZM5 Lifestage Group Analysis)
The new PRIZM5 data, a segmentation system which updates and essentially replaces the PRIZM2 data also available in Simply Map Canada, began with CensusPlus 2011, and has been developed by Environics Analytics. It is based on Statistics Canada’s Census and National Household Survey (NHS).
It comprises 68 lifestyle segments giving insights into who potential customers are, where they live, what they do, and how they think. Segments are, in turn, assigned to one of 19 Social Groups and 14 Lifestage Groups. The Social Groups are categorized as Urban, Suburban, Exurban, Town and Rural. The Lifestage Groups are distinguished based on the presence of singles, couples and families with additional refining categories, e.g. families in the Mature group are subdivided based on age and geography into three sets of segments. Full details are available in the Methodology section of the PRIZM5 Marketer’s Handbook (pg. 251-256).
The scenario explored here assumes a business prospect of opening a dietetic food store in Toronto, particularly targeting older adults and seniors aged over 55. Data on this target market’s demographics and lifestyle are relevant. It is also very important to look at the existing market situation including identifying the number of dietetic food stores and their locations in Toronto. This data will help build an informed analysis of where this new store might be located.
In this scenario the following outputs are generated: ● Map illustrating the # of households in a particular PRIZM5 lifestage group● Map showing # of dietetic food stores by census tracts● Report listing competitor details
A) Map illustrating relative concentration of the PRIZM5 lifestage group in Toronto
1. To identify the lifestage group of best fit, consult the PRIZM5 Marketer’s Handbook under lifestage groups toexamine the descriptions provided. In this case, Segment M3: Later Years, the the oldest lifestage group, is deemed most relevant (see p.249). 2. Click New Map from the top of the interface screen3. Open the Variables panel on the left
22
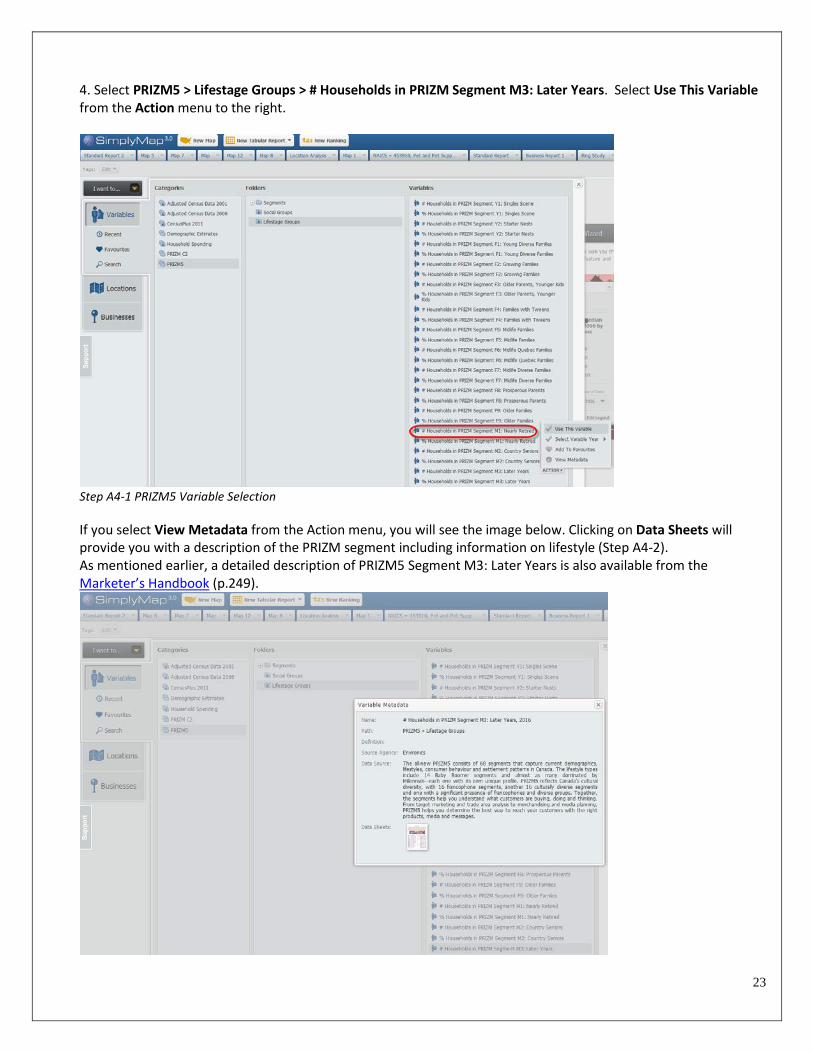
4. Select PRIZM5 > Lifestage Groups > # Households in PRIZM Segment M3: Later Years. Select Use This Variablefrom the Action menu to the right.
Step A4-1 PRIZM5 Variable Selection
If you select View Metadata from the Action menu, you will see the image below. Clicking on Data Sheets will provide you with a description of the PRIZM segment including information on lifestyle (Step A4-2). As mentioned earlier, a detailed description of PRIZM5 Segment M3: Later Years is also available from the Marketer’s Handbook (p.249).
23

Step A4-2 Illustrating View Metadata option from the Action dropdown menu
Step A4-2 Illustrating the details of data sheets
5. Close the data sheet window and open the Location panel on the left. Select Census Subdivisions > Ontario, >Toronto, ON (CSD), then click on Use This Location. A yellow pop-up box will appear prompting closing of the active window so that the map can be viewed:
Step A5-1 Illustrating location selection
24
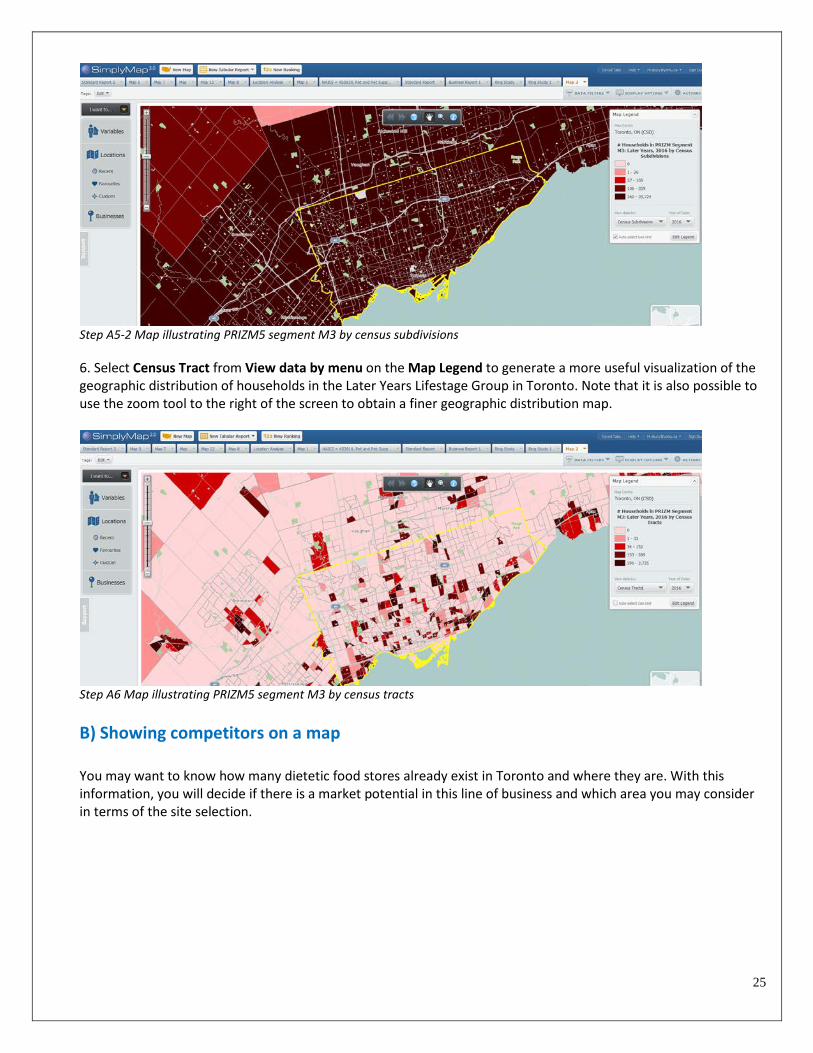
Step A5-2 Map illustrating PRIZM5 segment M3 by census subdivisions
6. Select Census Tract from View data by menu on the Map Legend to generate a more useful visualization of thegeographic distribution of households in the Later Years Lifestage Group in Toronto. Note that it is also possible to use the zoom tool to the right of the screen to obtain a finer geographic distribution map.
Step A6 Map illustrating PRIZM5 segment M3 by census tracts
B) Showing competitors on a map
You may want to know how many dietetic food stores already exist in Toronto and where they are. With this information, you will decide if there is a market potential in this line of business and which area you may consider in terms of the site selection.
25
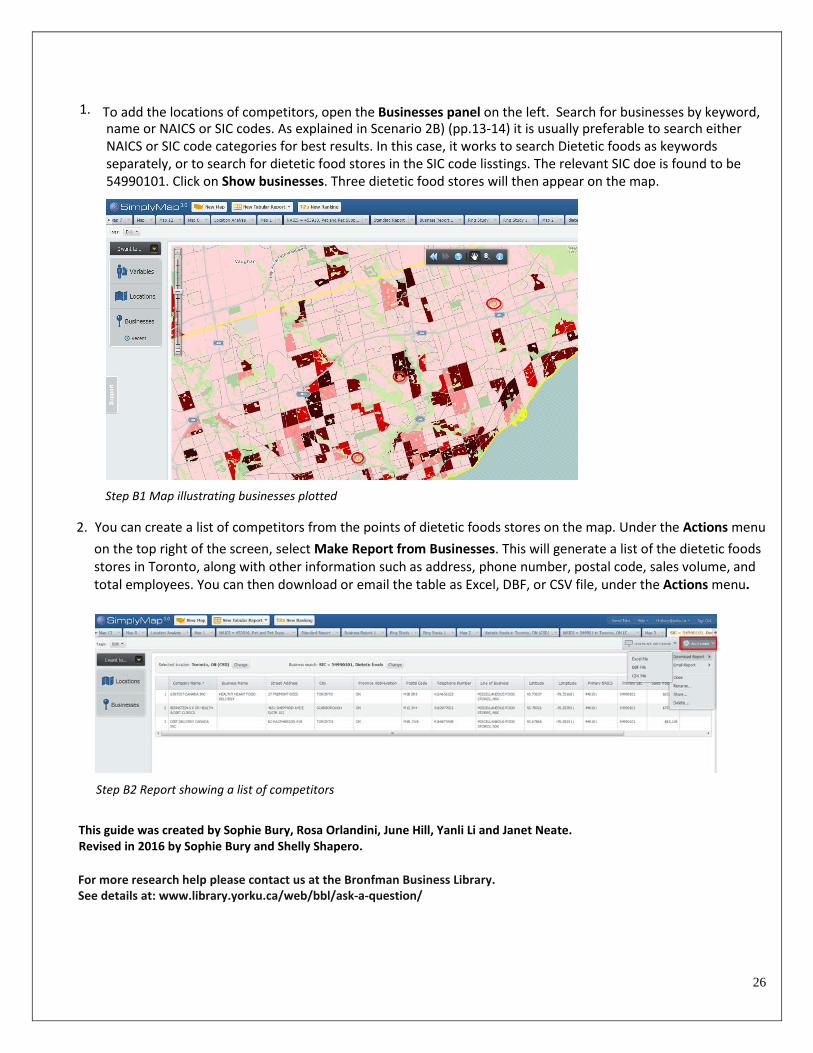
1. To add the locations of competitors, open the Businesses panel on the left. Search for businesses by keyword,
Step B1 Map illustrating businesses plotted
2. You can create a list of competitors from the points of dietetic foods stores on the map. Under the Actions menuon the top right of the screen, select Make Report from Businesses. This will generate a list of the dietetic foodsstores in Toronto, along with other information such as address, phone number, postal code, sales volume, andtotal employees. You can then download or email the table as Excel, DBF, or CSV file, under the Actions menu.
Step B2 Report showing a list of competitors
26
This guide was created by Sophie Bury, Rosa Orlandini, June Hill, Yanli Li and Janet Neate. Revised in 2016 by Sophie Bury and Shelly Shapero.
For more research help please contact us at the Bronfman Business Library. See details at: www.library.yorku.ca/web/bbl/ask-a-question/
name or NAICS or SIC codes. As explained in Scenario 2B) (pp.13-14) it is usually preferable to search eitherNAICS or SIC code categories for best results. In this case, it works to search Dietetic foods as keywordsseparately, or to search for dietetic food stores in the SIC code lisstings. The relevant SIC doe is found to be54990101. Click on Show businesses. Three dietetic food stores will then appear on the map.