simulation analysis of fabric heat transfer based on
TRANSCRIPT

Simulation analysis of fabric heat transfer based on unsteady state conditions
Jiying Chen1, a, Shuanghe Chi1, a, Chuixiong Wu2,b, Tingrui Wang3,a
1China University of Petroleum(East China),College of Pipeline and Civil Engineering, Qindao,Shandong, 266580,China
2Shandong University,School of Physics,Jinan,250100,China
3China University of Petroleum(East China),College of Mechanical and Electronic Engineering, Qindao,Shandong, 266580,China
[email protected] [email protected]
Keywords: Fabric, Analysis simulation of heat transfer, Unsteady conditions
Abstract. The thermal conductivity test is mainly carried out under normal temperature conditions, and there are few reports on the thermal conductivity test at low temperature and high temperature. In this paper, the fabric heat transfer simulation based on non-steady state conditions is analyzed.
1. Introduction
With the development of material technology, high-performance fabric fibers are mainly used in technical fields requiring high temperature resistance, low temperature resistance and high mechanical properties. Therefore, it is necessary to study the thermal insulation properties of fabrics at high and low temperatures. In general, the harder the heat transfer of the fabric (ie, the smaller the thermal conductivity), the better its thermal insulation performance. Thermal conductivity is the main technical indicator reflecting the thermal insulation properties of materials. In addition to the fabric's composition, structure, humidity, etc., the thermal conductivity of the fabric is also closely related to the ambient temperature. With the increase of temperature, the thermal conductivity of different fabrics has different changes. At present, the thermal conductivity test is mainly carried out under normal temperature conditions, and there are few reports on the thermal conductivity test at low temperature and high temperature. In this paper, the fabric heat transfer simulation based on non-steady state conditions is analyzed.
2. Simulation analysis of fabric heat transfer based on non-steady state conditions
A. Heat transfer mechanism of fabric The fabric is a translucent material composed of air and fibers, so the heat conduction inside the
fabric is mainly divided into molecular heat conduction, phonon heat conduction and photon heat conduction. The fabric is a porous material composed of fibers and air with a large number of minute voids, and the internal heat transfer process includes heat conduction, heat convection, heat radiation, and latent heat transfer accompanying water vapor transport. It has been shown that when the temperature of the porous material is less than 300 ° C, the influence of heat radiation can be ignored. When the outside air pressure is lower than 105 N/m 2 and the temperature is lower than 1000 K, and the porosity of the porous material is less than 0.95 and the thickness is less than 5 cm, the natural convection inside the porous medium is negligible. Moreover, the heat source of the hot wire method is relatively stable, the heat flow rate is low, the temperature of the sample is mild, the influence of heat convection and heat radiation is reduced, and the non-steady state other test methods are excluded to emit a strong or transient pulse type thermal disturbance during the test.
2018 2nd International Conference on Systems, Computing, and Applications (SYSTCA 2018)
Copyright © (2018) Francis Academic Press, UK DOI: 10.25236/systca.18.094--456--
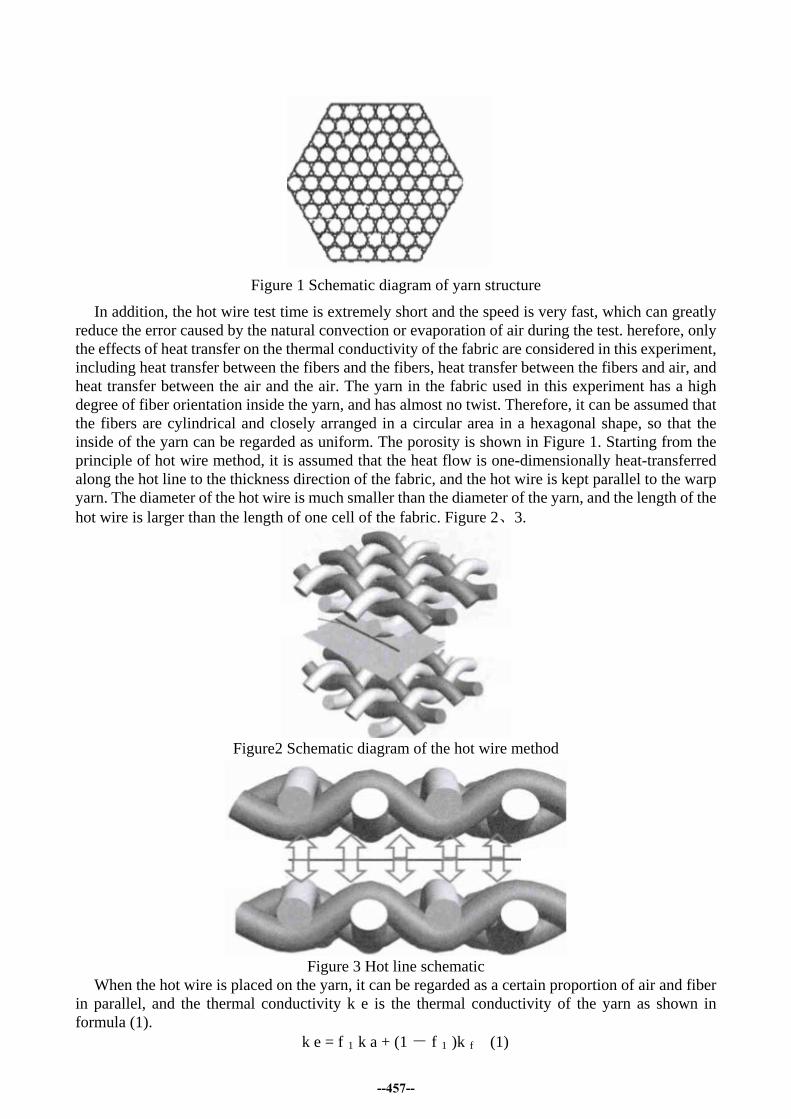
Figure 1 Schematic diagram of yarn structure
In addition, the hot wire test time is extremely short and the speed is very fast, which can greatly reduce the error caused by the natural convection or evaporation of air during the test. herefore, only the effects of heat transfer on the thermal conductivity of the fabric are considered in this experiment, including heat transfer between the fibers and the fibers, heat transfer between the fibers and air, and heat transfer between the air and the air. The yarn in the fabric used in this experiment has a high degree of fiber orientation inside the yarn, and has almost no twist. Therefore, it can be assumed that the fibers are cylindrical and closely arranged in a circular area in a hexagonal shape, so that the inside of the yarn can be regarded as uniform. The porosity is shown in Figure 1. Starting from the principle of hot wire method, it is assumed that the heat flow is one-dimensionally heat-transferred along the hot line to the thickness direction of the fabric, and the hot wire is kept parallel to the warp yarn. The diameter of the hot wire is much smaller than the diameter of the yarn, and the length of the hot wire is larger than the length of one cell of the fabric. Figure 2、3.
Figure2 Schematic diagram of the hot wire method
Figure 3 Hot line schematic
When the hot wire is placed on the yarn, it can be regarded as a certain proportion of air and fiber in parallel, and the thermal conductivity k e is the thermal conductivity of the yarn as shown in formula (1).
k e = f 1 k a + (1 - f 1 )k f (1)
--457--

When the hot wire is placed between the two yarns, the hot wire contact area contains a part of the yarn and part of the air. Assuming that the hot channel is air and the yarn is connected in series, the thermal conductivity k e ' can be calculated according to the formula (2) according to the harmonic averaging method:
2 2
11'
e
e f fk k
kα
−+
= (2)
formula (1)、(2):k a ———Air thermal conductivity,W/(m·k); k f ———Thermal conductivity of fiber,W/(m·k); f 1 ———Ratio of air in the yarn,%; f 2 ———Porosity of fabric,% For the sake of simplicity of calculation, the fibers in the yarn are closely arranged, taking f 1 =1,
so equations (1) and (2) are simplified to equations (3) and (4): k e = k f (3)
fkfkffkk
ek )21(2'
−+=
αα
(4)
From the formulas (3) and (4), it can be seen that as the thermal conductivity of the fiber increases, the thermal conductivity of the fabric also increases. The thermal conductivity of the fabric is closely related to the thermal conductivity of the fiber and air.
B. Mathematical model construction of fabric heat transfer The analysis of fabric structure from the microscopic point of view is currently the main research
approach, and the classification theory is the commonly used microscopic analysis method. Using the classification principle, the capillary medium model is used to describe the porous medium, the fractal network is used to simulate the fracture network, the capillary medium model is used to describe the matrix medium, and the theoretical model of the gas flow permeability in the constructed double porous medium is derived. Since the gas permeability is expressed as a function of the structural parameters of the porous medium, there is no empirical constant in the model, so more physical mechanisms can be revealed than the empirical model. Based on the thermal-mass coupling, a fractal mathematical model of the pore size distribution of porous media was developed, as shown in the following equation:
=−+∂
∂+
∂
∂ ∗→ ))((
)(2)(
gvglt
ff
t
ll CTCShC ε
vερ
xll
lx
lll
xtD
∂
∂+
∂
∂∂∂ )(
)()(1 ερεα
ερt
(5)
=−+∂
∂+
∂
∂ ∗→ ))((
)()(1 gvglt
ff
t
gg CTCShCC ε
vε
∂
∂
∂∂
x
ggg
xg
CD
)(1 εt
(6)
−∂
∂+
∂
∂=
∂
∂
t
ffl
t
ffav
tV
Cl
ClTC
)()(21
εv
εv α
][))((XTK
xCTCShl mixgvgl ∂
∂∂∂
+−∗→α (7)
--458--

1=++ fgl εεε (8)
In the introduction of the fractal dimension and void fraction parameters, and the initial conditions and boundary conditions are specified, the water vapor concentration distribution between the voids, the volume fraction of the liquid water, the temperature change of the porous fiber material and the relative molecular mass distribution of water are numerically simulated. . From a microscopic point of view, the internal structure of the fabric is treated as a regular shape. Taking textile as the research object and taking the heat transfer of fabric as the theoretical guidance, the effects of fiber thermal conductivity, fabric structure and ambient temperature on the heat transfer performance of the fabric were studied. The above studies show that the geometric structure of the fabric largely affects the transfer performance of heat inside the tissue, so the establishment of the heat transfer model of the three-dimensional structure of the coated fabric is the top priority of future research work.
(a) Plain fabric mesh (b) Satin fabric mesh division
Figure 4 Meshing results
Table 1 Change rate of thermal conductivity of each fabric at different temperatures
project Thermal conductivity change rate (%)
Aramid fabric Fiberglass fabric Basalt fiber fabric
Carbon fiber fabric
TR/℃
200 ~150 1.60 1.29 1.09 0.59
150 ~100 6.31 2.48 3.14 3.47
100 ~50 6.16 4.67 4.22 5.18
0 ~-50 2.61 2.45 12.73 25.07
--459--

Table 2 Fabric structural parameters and test results
Sample No.
Fabric organizatio
n
Warp number
(tex)
Weft number
(tex)
Fabric is dense (/10 cm)
Weft density
of fabric (/10 cm)
Fabric thickness (mm)
Crow value
(Clo)
Warmth rate
(%)
1 Twill 13.91 15.5 420 308 0.15 0.054 20.4 2 plain weave 12.58 12.58 550 298 0.22 0.134 23 3 plain weave 16.69 16.69 650 306 0.23 0.189 24.8 4 Twill 15.5 9.3 670 308 0.19 0.097 22.3 5 Twill 12.4 12.58 630 320 0.24 0.163 24.2 6 Twill 15.5 12.29 550 316 0.21 0.096 22.2 7 Twill 9.25 3.16 220 338 0.09 0.034 17.9 8 plain weave 12.4 18.6 558 268 0.27 0.205 25.3 9 Twill 12.4 12.4 178 216 0.1 0.029 17.5
10 Twill 15.63 9.43 526 310 0.16 0.078 21.5 11 Twill 12.65 9.49 588 376 0.19 0.134 23 12 Twill 12.69 12.62 560 314 0.18 0.084 21.9 13 plain weave 12.58 14.58 540 374 0.18 0.084 24.7 14 plain weave 12.6 12.58 586 372 0.24 0.163 24.2 15 Twill 11.81 15.72 532 352 0.22 0.145 23.3 16 plain weave 10.2 8.9 634 360 0.13 0.064 21.3 17 plain weave 12.96 12.47 506 370 0.2 0.102 22.5
SVM uses mathematical methods and optimization techniques to provide unique advantages in solving small sample, nonlinear, and high-dimensional pattern recognition problems. The heat transfer of fabric is a nonlinear process. Based on the analysis of the factors affecting fabric heat transfer, a SVM model for predicting fabric heat transfer is established by SVM method, and the model parameter selection and optimization problems are discussed. Among the 17 groups of samples, 15 groups were randomly selected as training samples, and the remaining 2 groups were used as prediction samples to predict the warmth rate and the Krox value of the fabric. The experimental results show that the prediction error is less than 5% and the correlation coefficient is 0.9999, which has higher prediction accuracy. The resulting SVM model provides a new and effective tool for fabric heat transfer simulation based on non-steady state conditions.
3. Conclusion
Given the same outside condition, with air layer thickness increasing, heat transfer spends more time to reach equilibrium. At the same time, the temperature of the fabric surface, as well as the decline magnitude decreases gradually. The convection steps up heat transfer reaching equilibrium, the surface temperature of the fabric declines with convection heat transfer coefficient rising. Considering the complex heat transfer in the air layer, the equivalent thermal conductivity of the air can be corrected. Increasing the equivalent thermal conductivity of air benefits the heat transfer covering longer.
References
[1]Wang Hongmei, Zheng Zhenrong, Zhang Nannan, Zhang Yushuang, Zhao Xiaoming. Advances in Numerical Simulation of Heat and Moisture Transfer of Porous Fabrics[J]. Journey of Textiles, 2016, 37 (11): 159-165.
[2]Wang Hongmei, Zheng Zhenrong, Zhang Nannan, Zhao Xiaoming. Numerical Simulation of the effect of Structure Density on Thermal Insulation Perfomance of Glass Fiber Fabrics[J]. Journal of Engineering Thermophysics, 2016,37(12): 2653-2659.
--460--

[3]Zhang Yiqiang, Chen Yang, Fan Yanjuan and Yang Yunchuan. Simulated Analysis of the Effect of Air Layer on Heat Transfer of Fabrics[J]. Journal of Zhejiang University of Science and Technology (Natural Science Edition), 2017,37 (05): 616-620.
[4]Wu Jiajia, Tang Hong. Finite Element Analysis of Fabric Heat Transfer Using ABAQUS[J]. Journal of Textile, 2016,37(09): 37-41.
[5]Tian Miao, Li Jun. Application of Numerical Simulation in Performance Evaluation of Thermal Protective Clothin [J]. Journal of Textile, 2015,36(01): 158-164.
--461--