simulation-based deployment configuration of smart indoor
TRANSCRIPT
Simulation-Based Deployment Configuration ofSmart Indoor Spaces
Shadan GolestanDept. of Computing Science
University of AlbertaEdmonton, [email protected]
Alexandr PetcoviciDept. of Computing Science
University of AlbertaEdmonton, Canada
Ioanis NikolaidisDept. of Computing Science
University of AlbertaEdmonton, Canada
Eleni StrouliaDept. of Computing Science
University of AlbertaEdmonton, [email protected]
Abstract—Evaluating deployment scenarios for sensor–drivenapplications in indoor spaces can be a tedious and labour–intensive task. To mitigate the cost of comparatively evaluat-ing sensor deployment configurations and alternatives requiredby these applications, we present an integrated methodologythat enables the modeling, simulation, and evaluation of al-ternative candidate deployments, as well as, the fine–tuning ofthe corresponding sensor–driven applications. We illustrate ourmethodology by applying it to the task of configuring an indoorlocalization ambient-intelligence application. We explain how ourmethodology models the real–world environment and the candi-date sensor deployment, simulates the occupants’ activities andthe sensors’ run-time behavior, and evaluates, through a varietyof metrics, the effectiveness of the application under differentdeployment configurations. We evaluate our methodology on tworeal–world localization application scenarios corresponding totwo, drastically different, spaces.
Index Terms—Smart Home, Sensor Deployment Evaluation,Simulation, Quality of Information (QoI) Analysis
I. INTRODUCTION AND BACKGROUND
Smart indoor environments, such as residential, commercialand public buildings, are among the prevailing sensor-enabledapplications today. Equipped with several sensor nodes, thesesmart indoor spaces recognize and analyze different activitiesof occupants, such as Activities of Daily Living (ADLs) forhealth-care purposes [1], people localization [2] for under-standing space usage, and space occupancy in order to, e.g.,increase energy efficiency of buildings [3].
The ability to effectively configure and evaluate the deploy-ment of the required sensors in the physical environment isa key prerequisite [4] for this fast–growing family of appli-cations, with direct impact to the health, security, and safetyof end users. However, this process can be very burdensome,time-consuming and error-prone [5], involving multiple trial-and-error deployments of multiple sensor nodes configurablethrough tedious low–level interfaces. Alternatively, when onlya single configuration is designed and deployed, the applica-tion may end up not performing as expected.
Several proposals have been put forward in order to reducethe effort of comparatively exploring multiple deployment con-figurations. Several studies focused on optimization algorithmsfor WSN deployment from different application-agnostic per-spectives, e.g., maximizing coverage [6], [7] and minimizing
energy consumption [8]. These optimization approaches followgeneral strategies, typically assuming that the WSN nodes canbe placed relatively freely within a space, ignoring the fact thatthere exist multiple, often implicit, constraints, such as notdisturbing the aesthetics of the space, or not interfering withexisting elements of the space (HVAC conduits, high voltagecircuits, fire-extinguishing equipment, etc.).
Our work, while not dismissing the use of analytical tech-niques such as optimization, focuses on two categories of toolsthat can be used for pre-deployment evaluation. Simulatorsare, by far, the most popular approach for WSN deploymentevaluation. There is a wide range of simulators such as [9]–[11] mainly focusing on low–level aspects of the network, e.g.message passing, protocols. However, context–aware simula-tors provide high–level analysis of WSNs, which is desirablefor smart-home applications, and may incorporate severaltechniques such as pattern recognition, machine learning, anddomain-specificity, such as health care scenario simulators.Table I compares several state-of-the-art simulators.
Emulators are a combination of hardware implementationand software simulation in order to mimic a real–world WSN,but under controlled conditions. MiNT [18] is an example em-ulator that offers small–size testbeds for faster evaluation. Al-though emulators provide more realistic evaluation techniques,the costs of developing and evolving WSN configurations inemulators is higher.
Going beyond simple coverage and/or energy criteria, ef-forts have been made to introduce middleware systems withQuality of Context (QoC) support for IoT applications [19].Three parameters are mainly involved in QoC [20]: Quality ofInformation (QoI), Quality of distribution Service (QoS), andQuality of Devices (QoD). For example, Nazário et al. [21]used up-to-dateness, precision, completeness, and significancevariables to quantify the QoC parameter in order to evaluatean e–health sensor platform, using Siafu. They found thatthe QoC parameter can assist in detecting abnormal WSNbehaviors related to the mentioned variables.
Less attention has been paid to high–level evaluation ofsensor-enabled applications: our contribution is a methodologyto aid the developer interpret how QoC impacts the overallapplication behavior. The presented integrated methodologytakes advantages of context–aware simulation environments978-1-5386-4980-0/19/$31.00 ©2019 IEEE
358
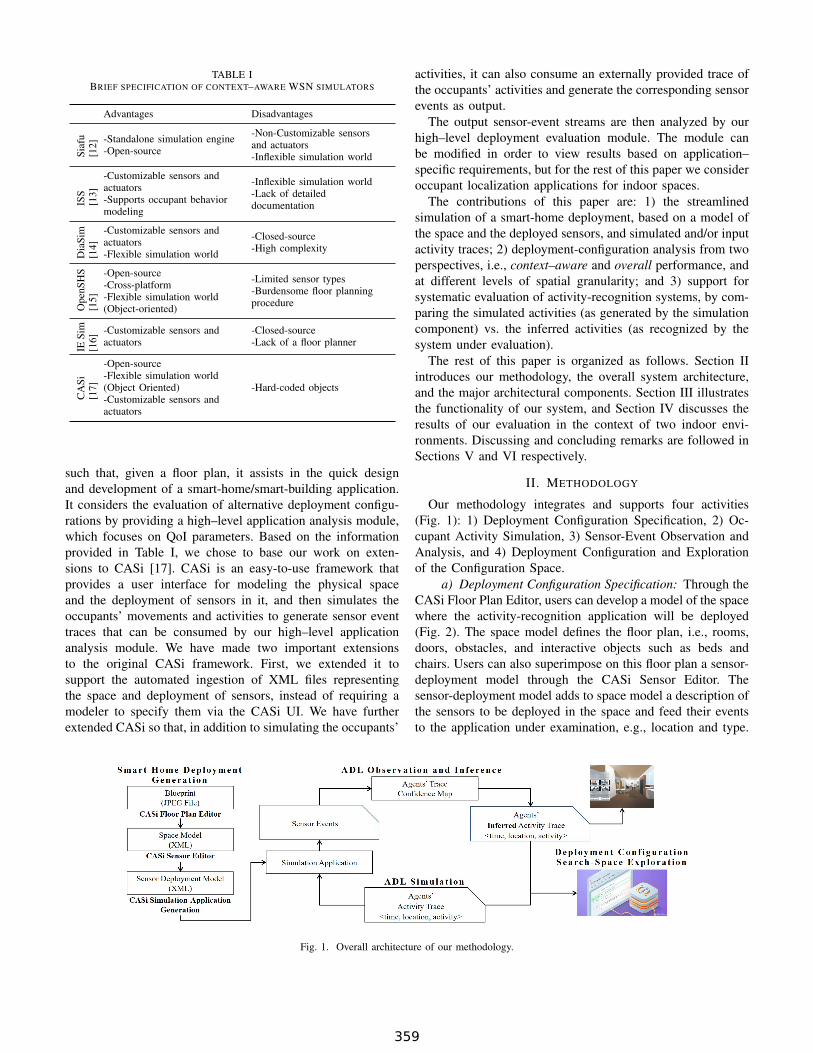
TABLE IBRIEF SPECIFICATION OF CONTEXT–AWARE WSN SIMULATORS
Advantages Disadvantages
Siaf
u[1
2] -Standalone simulation engine-Open-source
-Non-Customizable sensorsand actuators-Inflexible simulation world
ISS
[13]
-Customizable sensors andactuators-Supports occupant behaviormodeling
-Inflexible simulation world-Lack of detaileddocumentation
Dia
Sim
[14]
-Customizable sensors andactuators-Flexible simulation world
-Closed-source-High complexity
Ope
nSH
S[1
5]
-Open-source-Cross-platform-Flexible simulation world(Object-oriented)
-Limited sensor types-Burdensome floor planningprocedure
IESi
m[1
6]
-Customizable sensors andactuators
-Closed-source-Lack of a floor planner
CA
Si[1
7]
-Open-source-Flexible simulation world(Object Oriented)-Customizable sensors andactuators
-Hard-coded objects
such that, given a floor plan, it assists in the quick designand development of a smart-home/smart-building application.It considers the evaluation of alternative deployment configu-rations by providing a high–level application analysis module,which focuses on QoI parameters. Based on the informationprovided in Table I, we chose to base our work on exten-sions to CASi [17]. CASi is an easy-to-use framework thatprovides a user interface for modeling the physical spaceand the deployment of sensors in it, and then simulates theoccupants’ movements and activities to generate sensor eventtraces that can be consumed by our high–level applicationanalysis module. We have made two important extensionsto the original CASi framework. First, we extended it tosupport the automated ingestion of XML files representingthe space and deployment of sensors, instead of requiring amodeler to specify them via the CASi UI. We have furtherextended CASi so that, in addition to simulating the occupants’
activities, it can also consume an externally provided trace ofthe occupants’ activities and generate the corresponding sensorevents as output.
The output sensor-event streams are then analyzed by ourhigh–level deployment evaluation module. The module canbe modified in order to view results based on application–specific requirements, but for the rest of this paper we consideroccupant localization applications for indoor spaces.
The contributions of this paper are: 1) the streamlinedsimulation of a smart-home deployment, based on a model ofthe space and the deployed sensors, and simulated and/or inputactivity traces; 2) deployment-configuration analysis from twoperspectives, i.e., context–aware and overall performance, andat different levels of spatial granularity; and 3) support forsystematic evaluation of activity-recognition systems, by com-paring the simulated activities (as generated by the simulationcomponent) vs. the inferred activities (as recognized by thesystem under evaluation).
The rest of this paper is organized as follows. Section IIintroduces our methodology, the overall system architecture,and the major architectural components. Section III illustratesthe functionality of our system, and Section IV discusses theresults of our evaluation in the context of two indoor envi-ronments. Discussing and concluding remarks are followed inSections V and VI respectively.
II. METHODOLOGY
Our methodology integrates and supports four activities(Fig. 1): 1) Deployment Configuration Specification, 2) Oc-cupant Activity Simulation, 3) Sensor-Event Observation andAnalysis, and 4) Deployment Configuration and Explorationof the Configuration Space.
a) Deployment Configuration Specification: Through theCASi Floor Plan Editor, users can develop a model of the spacewhere the activity-recognition application will be deployed(Fig. 2). The space model defines the floor plan, i.e., rooms,doors, obstacles, and interactive objects such as beds andchairs. Users can also superimpose on this floor plan a sensor-deployment model through the CASi Sensor Editor. Thesensor-deployment model adds to space model a description ofthe sensors to be deployed in the space and feed their eventsto the application under examination, e.g., location and type.
Fig. 1. Overall architecture of our methodology.
359

Fig. 2. The CASi floor plan editor shows rooms (large polygons), doors (reddots), obstacles/objects (grey polygons) and their interactive sides (red lines).
Finally, users are able to establish an MQTT broker [22] inorder to send sensor events to another host for further analysis,through the CASi Simulation-Application Generation. Weextended the original CASi framework, with an intermediatelayer, through which the user interface produces a serializedrepresentation of the model in XML. Models in this format canbe input to the CASi Simulation-Application Generation mod-ule to generate a simulation. In this manner users can easilyclone and modify models to produce a family of simulations,each one with slightly different sensor deployments.
b) Occupant Activity Simulation: This module takes asinput a simulated activity trace, in the form of a stream of<time, location, activity> tuples, and converts it to the formatexpected by the CASi Simulation Application. The SimulationApplication also reads as input the XML file describing thespace and sensor-deployment models. The output of Simula-tion Application is a stream of sensor events, subsequentlypassed to the Observation and Analysis module by means ofthe MQTT broker.
c) Sensor-Event Observation and Analysis: This modulerepresents the activity-recognition systems that our methodol-ogy is designed to support by enabling the simulation of theirperformance in different deployment scenarios. The underlyingassumption is that these subject systems, henceforth systems-under-test, infer the agents’ activity traces based on the inputstream of sensor events, as produced by the simulation moduledescribed above. In this paper, we illustrate our methodologyusing as "system-under-test" our own Smart-Condo™ local-ization system described in [23].
d) Deployment Configuration and Exploration of theConfiguration Space: By running the simulation and com-paring the inferred activity trace produced by the system-under-test and against the synthetic ground truth, input to thesimulation, our methodology enables the developers of thesystem-under-test to evaluate the system in different sensor-deployment scenarios. This module computes two differentindicators, i.e., overall performance, and contextual-awarenessperformance (described next), represented as error metrics andvisualized at different levels of granularity. The visualizationis by means of heatmaps, to capture the space-/position-relatedrelative performance of the specific sensor deployment.
Overall Error Heatmap (OEH): We define OEH as an
N ×M matrix, where N and M correspond to the length andwidth of the space in integer multiples of a reference lengthunit (equal to 1 meter in our examples). Each element in thematrix, ei,j (0 ≤ i < N, 0 ≤ j < M ) represents the averagelocalization error resulting from the given sensor deploymentconditioned on the occupant location being at grid point (i, j).Clearly, the metric cannot be defined if the occupant wasalways relatively far from (i, j) with respect to its syntheticground-truth location. Specifically:
ei,j =ΣP
p=1ΣTp
t=1{||(xest, yest)pt − (xgt, ygt)
pt || ∗A
pt }
ΣPp=1Σ
Tp
t=1Apt
(1)
Apt =
{1, if ||(i, j)− (xgt, ygt)
pt || ≤r
0, otherwise,
where P is the number of occupants in the simulation; Tp isthe (discretized) total amount of time of occupant p simulation(i.e., being present in the simulated space); (xest, yest)
pt and
(xgt, ygt)pt are the estimated and synthetic ground-truth loca-
tion of the occupant p in time t. Apt is a gating function that
infers that the occupant was at grid point (i, j) if their syntheticground-truth location is no further then r from from (i, j). rdepends on (and is set equal to) the radius of the deployedmotion sensors and it represents an intrinsic uncertainty dueto the sensing range of the sensors.
Contextual–Aware Error Heatmap (CAEH): This indica-tor is a time-average alternative of the OEH indicator (whichis event-average). In other words, if an occupant is rarely at alocation and the error is high when at that location, the error isof no particular importance. On the contrary, high error mattersin highly visited locations. A designer may be willing to accepta high OEH at some locations if the CAEH at those locationsis low. Specifically, CAEH, e
′
i,j , is defined as follows:
e′
i,j =ΣP
p=1ΣTp
t=1{||(xest, yest)pt − (xgt, ygt)
pt || ∗A
pt }
ΣPp=1Σ
Tp
t=11(2)
It should be noted that Eq.(2) considers the importanceof each coordinate based on the average behavior of theoccupants.
Fig. 3. Floor plan and motion sensor locations (dots) for the two real-worldspaces. The radius of motions sensors is 60 cm.
360
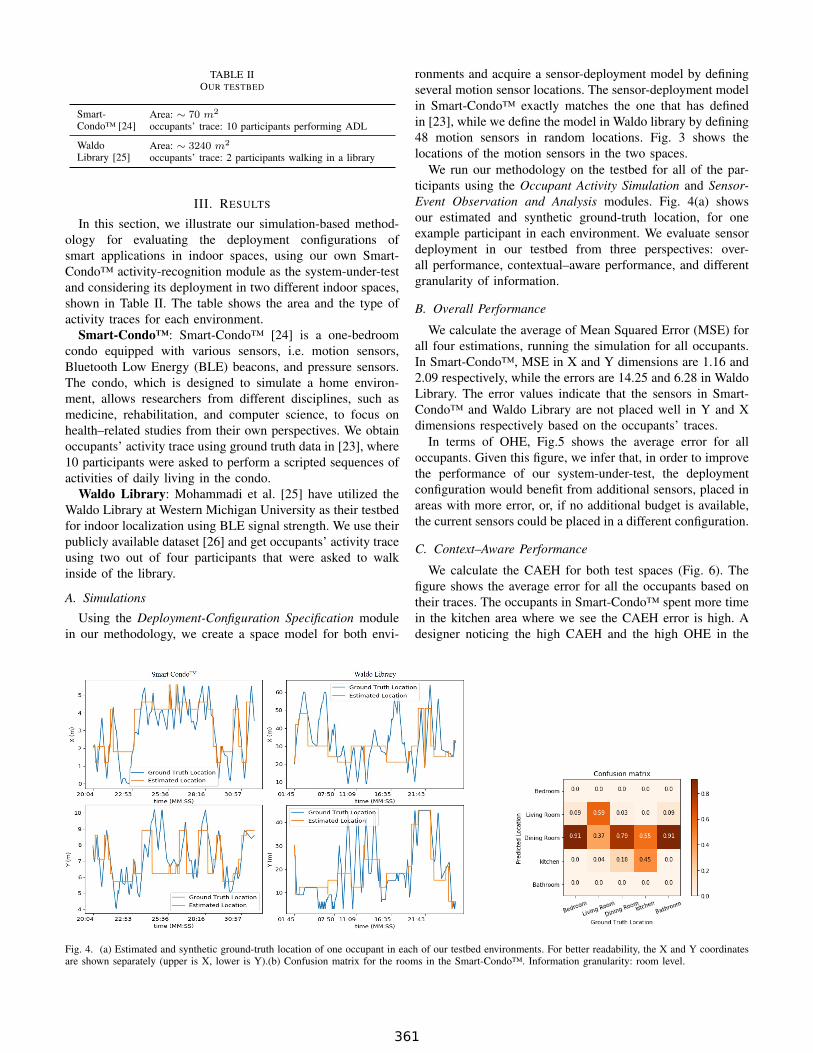
TABLE IIOUR TESTBED
Smart-Condo™ [24]
Area: ∼ 70 m2
occupants’ trace: 10 participants performing ADL
WaldoLibrary [25]
Area: ∼ 3240 m2
occupants’ trace: 2 participants walking in a library
III. RESULTS
In this section, we illustrate our simulation-based method-ology for evaluating the deployment configurations ofsmart applications in indoor spaces, using our own Smart-Condo™ activity-recognition module as the system-under-testand considering its deployment in two different indoor spaces,shown in Table II. The table shows the area and the type ofactivity traces for each environment.
Smart-Condo™: Smart-Condo™ [24] is a one-bedroomcondo equipped with various sensors, i.e. motion sensors,Bluetooth Low Energy (BLE) beacons, and pressure sensors.The condo, which is designed to simulate a home environ-ment, allows researchers from different disciplines, such asmedicine, rehabilitation, and computer science, to focus onhealth–related studies from their own perspectives. We obtainoccupants’ activity trace using ground truth data in [23], where10 participants were asked to perform a scripted sequences ofactivities of daily living in the condo.
Waldo Library: Mohammadi et al. [25] have utilized theWaldo Library at Western Michigan University as their testbedfor indoor localization using BLE signal strength. We use theirpublicly available dataset [26] and get occupants’ activity traceusing two out of four participants that were asked to walkinside of the library.
A. Simulations
Using the Deployment-Configuration Specification modulein our methodology, we create a space model for both envi-
ronments and acquire a sensor-deployment model by definingseveral motion sensor locations. The sensor-deployment modelin Smart-Condo™ exactly matches the one that has definedin [23], while we define the model in Waldo library by defining48 motion sensors in random locations. Fig. 3 shows thelocations of the motion sensors in the two spaces.
We run our methodology on the testbed for all of the par-ticipants using the Occupant Activity Simulation and Sensor-Event Observation and Analysis modules. Fig. 4(a) showsour estimated and synthetic ground-truth location, for oneexample participant in each environment. We evaluate sensordeployment in our testbed from three perspectives: over-all performance, contextual–aware performance, and differentgranularity of information.
B. Overall Performance
We calculate the average of Mean Squared Error (MSE) forall four estimations, running the simulation for all occupants.In Smart-Condo™, MSE in X and Y dimensions are 1.16 and2.09 respectively, while the errors are 14.25 and 6.28 in WaldoLibrary. The error values indicate that the sensors in Smart-Condo™ and Waldo Library are not placed well in Y and Xdimensions respectively based on the occupants’ traces.
In terms of OHE, Fig.5 shows the average error for alloccupants. Given this figure, we infer that, in order to improvethe performance of our system-under-test, the deploymentconfiguration would benefit from additional sensors, placed inareas with more error, or, if no additional budget is available,the current sensors could be placed in a different configuration.
C. Context–Aware Performance
We calculate the CAEH for both test spaces (Fig. 6). Thefigure shows the average error for all the occupants based ontheir traces. The occupants in Smart-Condo™ spent more timein the kitchen area where we see the CAEH error is high. Adesigner noticing the high CAEH and the high OHE in the
Fig. 4. (a) Estimated and synthetic ground-truth location of one occupant in each of our testbed environments. For better readability, the X and Y coordinatesare shown separately (upper is X, lower is Y).(b) Confusion matrix for the rooms in the Smart-Condo™. Information granularity: room level.
361
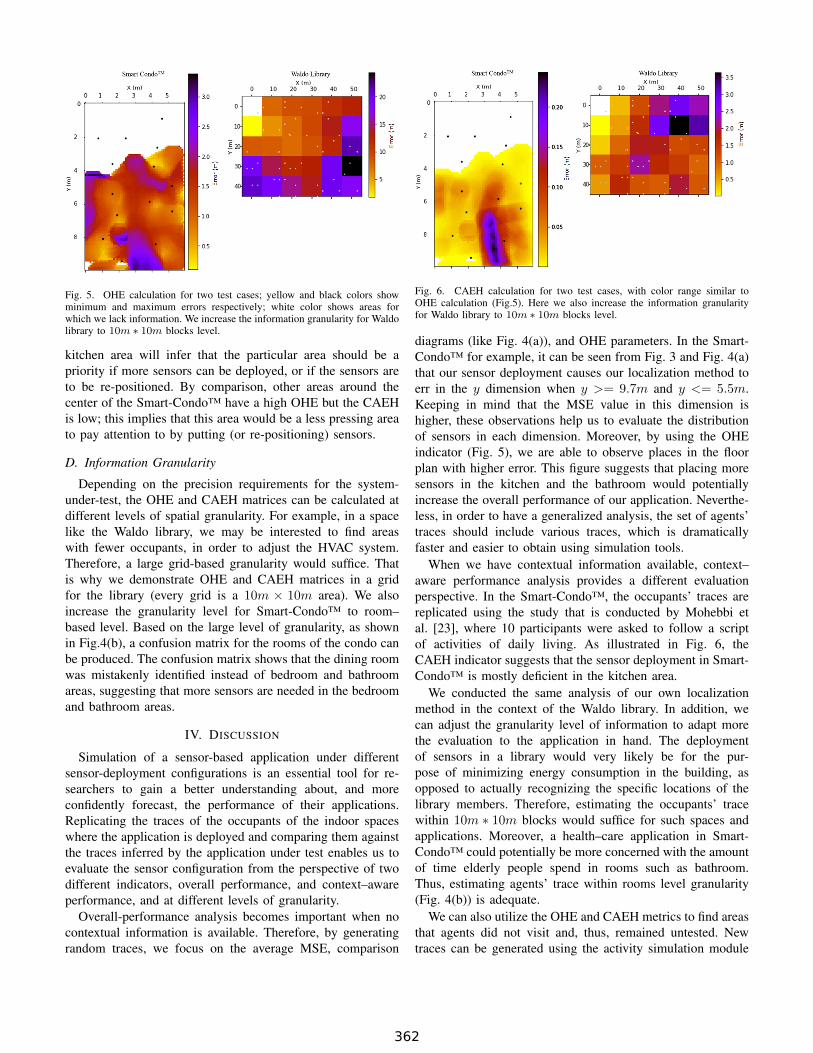
Fig. 5. OHE calculation for two test cases; yellow and black colors showminimum and maximum errors respectively; white color shows areas forwhich we lack information. We increase the information granularity for Waldolibrary to 10m ∗ 10m blocks level.
kitchen area will infer that the particular area should be apriority if more sensors can be deployed, or if the sensors areto be re-positioned. By comparison, other areas around thecenter of the Smart-Condo™ have a high OHE but the CAEHis low; this implies that this area would be a less pressing areato pay attention to by putting (or re-positioning) sensors.
D. Information Granularity
Depending on the precision requirements for the system-under-test, the OHE and CAEH matrices can be calculated atdifferent levels of spatial granularity. For example, in a spacelike the Waldo library, we may be interested to find areaswith fewer occupants, in order to adjust the HVAC system.Therefore, a large grid-based granularity would suffice. Thatis why we demonstrate OHE and CAEH matrices in a gridfor the library (every grid is a 10m × 10m area). We alsoincrease the granularity level for Smart-Condo™ to room–based level. Based on the large level of granularity, as shownin Fig.4(b), a confusion matrix for the rooms of the condo canbe produced. The confusion matrix shows that the dining roomwas mistakenly identified instead of bedroom and bathroomareas, suggesting that more sensors are needed in the bedroomand bathroom areas.
IV. DISCUSSION
Simulation of a sensor-based application under differentsensor-deployment configurations is an essential tool for re-searchers to gain a better understanding about, and moreconfidently forecast, the performance of their applications.Replicating the traces of the occupants of the indoor spaceswhere the application is deployed and comparing them againstthe traces inferred by the application under test enables us toevaluate the sensor configuration from the perspective of twodifferent indicators, overall performance, and context–awareperformance, and at different levels of granularity.
Overall-performance analysis becomes important when nocontextual information is available. Therefore, by generatingrandom traces, we focus on the average MSE, comparison
Fig. 6. CAEH calculation for two test cases, with color range similar toOHE calculation (Fig.5). Here we also increase the information granularityfor Waldo library to 10m ∗ 10m blocks level.
diagrams (like Fig. 4(a)), and OHE parameters. In the Smart-Condo™ for example, it can be seen from Fig. 3 and Fig. 4(a)that our sensor deployment causes our localization method toerr in the y dimension when y >= 9.7m and y <= 5.5m.Keeping in mind that the MSE value in this dimension ishigher, these observations help us to evaluate the distributionof sensors in each dimension. Moreover, by using the OHEindicator (Fig. 5), we are able to observe places in the floorplan with higher error. This figure suggests that placing moresensors in the kitchen and the bathroom would potentiallyincrease the overall performance of our application. Neverthe-less, in order to have a generalized analysis, the set of agents’traces should include various traces, which is dramaticallyfaster and easier to obtain using simulation tools.
When we have contextual information available, context–aware performance analysis provides a different evaluationperspective. In the Smart-Condo™, the occupants’ traces arereplicated using the study that is conducted by Mohebbi etal. [23], where 10 participants were asked to follow a scriptof activities of daily living. As illustrated in Fig. 6, theCAEH indicator suggests that the sensor deployment in Smart-Condo™ is mostly deficient in the kitchen area.
We conducted the same analysis of our own localizationmethod in the context of the Waldo library. In addition, wecan adjust the granularity level of information to adapt morethe evaluation to the application in hand. The deploymentof sensors in a library would very likely be for the pur-pose of minimizing energy consumption in the building, asopposed to actually recognizing the specific locations of thelibrary members. Therefore, estimating the occupants’ tracewithin 10m ∗ 10m blocks would suffice for such spaces andapplications. Moreover, a health–care application in Smart-Condo™ could potentially be more concerned with the amountof time elderly people spend in rooms such as bathroom.Thus, estimating agents’ trace within rooms level granularity(Fig. 4(b)) is adequate.
We can also utilize the OHE and CAEH metrics to find areasthat agents did not visit and, thus, remained untested. Newtraces can be generated using the activity simulation module
362
so that to make sure our sensor deployment is evaluatedcompletely.
V. CONCLUSION AND FUTURE PLANS
Sensors are increasingly utilized for smart indoor envi-ronments, in residential and commercial buildings, to obtainknowledge about the occupant behavior and activities in orderto optimize the performance of the building and improveoccupant comfort. We proposed a methodology for simulatingand evaluating the performance of such applications, underdifferent sensor-deployment configurations. We evaluate thesystem-under-test with corresponding sensor deployment sce-narios, comparing the synthetic ground-truth activity tracesagainst the inferred traces produced by the application-under-test. The evaluation metrics include overall and context–awareperformance, potentially at different information-granularitylevels. We demonstrated our methodology for two examplespaces. Our methodology provides informative evidence aboutthe performance of an application.
An important drawback of using any simulator is thatsimulated sensors do not faithfully replicate the actual sensorbehavior in the real world. In real environments, the operationof the sensors is degraded due to noise (partly caused by theenvironment) or the aging of the sensor hardware. In the future,we intend to utilize probabilistic models in order to modelnon–stationary behaviors in sensor models.
REFERENCES
[1] P. Pirzada, N. White, and A. Wilde, “Sensors in smart homes forindependent living of the elderly,” in 2018 5th International Multi-TopicICT Conference (IMTIC), April 2018, pp. 1–8.
[2] J. Shin, H. Kim, D. Lee, Y. Ko, K. Lee, S. Hahm, and T. Kwon,“Indoor localization in home environments using appearance frequencyinformation,” in 2017 IEEE International Conference on Systems, Man,and Cybernetics (SMC), Oct 2017, pp. 2718–2723.
[3] O. Ardakanian, A. Bhattacharya, and D. Culler, “Non-intrusivetechniques for establishing occupancy related energy savings incommercial buildings,” in Proceedings of the 3rd ACM InternationalConference on Systems for Energy-Efficient Built Environments, ser.BuildSys ’16. New York, NY, USA: ACM, 2016, pp. 21–30. [Online].Available: http://doi.acm.org/10.1145/2993422.2993574
[4] M. Zorzi, A. Gluhak, S. Lange, and A. Bassi, “From today’s intranetof things to a future internet of things: a wireless- and mobility-related view,” IEEE Wireless Communications, vol. 17, no. 6, pp. 44–51,December 2010.
[5] X. Zheng, C. Julien, M. Kim, and S. Khurshid, “Perceptions on the stateof the art in verification and validation in cyber-physical systems,” IEEESystems Journal, vol. 11, no. 4, pp. 2614–2627, Dec 2017.
[6] K. Chakrabarty, S. S. Iyengar, H. Qi, and E. Cho, “Grid coverage forsurveillance and target location in distributed sensor networks,” IEEETransactions on Computers, vol. 51, no. 12, pp. 1448–1453, Dec 2002.
[7] S. S. Dhillon and K. Chakrabarty, “Sensor placement for effectivecoverage and surveillance in distributed sensor networks,” in 2003 IEEEWireless Communications and Networking, 2003. WCNC 2003., vol. 3,March 2003, pp. 1609–1614 vol.3.
[8] A. Chamam and S. Pierre, “On the planning of wireless sensor net-works: Energy-efficient clustering under the joint routing and coverageconstraint,” IEEE Transactions on Mobile Computing, vol. 8, no. 8, pp.1077–1086, Aug 2009.
[9] R. Barr and et al., “JiST: Embedding simulation time into a virtualmachine,” in IN EUROSIM CONGRESS ON MODELLING AND SIM-ULATION, 2004.
[10] S. Park, A. Savvides, and M. B. Srivastava, “SensorSim: Asimulation framework for sensor networks,” in Proceedings ofthe 3rd ACM International Workshop on Modeling, Analysis andSimulation of Wireless and Mobile Systems, ser. MSWIM ’00. NewYork, NY, USA: ACM, 2000, pp. 104–111. [Online]. Available:http://doi.acm.org/10.1145/346855.346870
[11] S. Sundresh, W. Kim, and G. Agha, “SENS: A sensor, environmentand network simulator,” in Proceedings of the 37th AnnualSymposium on Simulation, ser. ANSS ’04. Washington, DC,USA: IEEE Computer Society, 2004, pp. 221–. [Online]. Available:http://dl.acm.org/citation.cfm?id=987679.987699
[12] KIT, “Siafu: An open source context simulator,” Onlinehttp://siafusimulator.org/, Accessed Jun. 2018.
[13] T. V. Nguyen, J. G. Kim, and D. Choi, “ISS: The interactive smarthome simulator,” in 2009 11th International Conference on AdvancedCommunication Technology, vol. 03, Feb 2009, pp. 1828–1833.
[14] W. Jouve, J. Bruneau, and C. Consel, “DiaSim: A parameterized simu-lator for pervasive computing applications,” in 2009 IEEE InternationalConference on Pervasive Computing and Communications, March 2009,pp. 1–3.
[15] N. Alshammari, T. Alshammari, M. Sedky, J. Champion, and C. Bauer,“OpenSHS: Open smart home simulator,” Sensors, vol. 17, no. 5, 2017.[Online]. Available: http://www.mdpi.com/1424-8220/17/5/1003
[16] J. Synnott, L. Chen, C. D. Nugent, and G. Moore, “The creation ofsimulated activity datasets using a graphical intelligent environmentsimulation tool,” in 2014 36th Annual International Conference of theIEEE Engineering in Medicine and Biology Society, Aug 2014, pp.4143–4146.
[17] J. Cassens, F. Schmitt, T. Mende, and M. Herczeg, “CASi – a genericcontext awareness simulator for ambient systems,” in Ambient Intelli-gence, F. Paternò, B. de Ruyter, P. Markopoulos, C. Santoro, E. vanLoenen, and K. Luyten, Eds. Berlin, Heidelberg: Springer BerlinHeidelberg, 2012, pp. 421–426.
[18] P. De, A. Raniwala, S. Sharma, and T. Chiueh, “MiNT: a miniaturizednetwork testbed for mobile wireless research,” in Proceedings IEEE 24thAnnual Joint Conference of the IEEE Computer and CommunicationsSocieties., vol. 4, March 2005, pp. 2731–2742 vol. 4.
[19] B. d. T. P. Gomes, L. C. M. Muniz, F. J. da Silva e Silva, D. V. dosSantos, R. F. Lopes, L. R. Coutinho, F. O. Carvalho, and M. Endler,“A middleware with comprehensive quality of context support forthe internet of things applications,” Sensors, vol. 17, no. 12, 2017.[Online]. Available: http://www.mdpi.com/1424-8220/17/12/2853
[20] T. Buchholz and M. Schiffers, “Quality of context: What it is and whywe need it,” in In Proceedings of the 10th Workshop of the OpenViewUniversity Association: OVUA ’03, 2003.
[21] D. C. Nazário, A. de Andrade, L. Borges, W. R. Ramos, J. L. Todesco,and M. A. R. Dantas, “An enhanced quality of context evaluatingapproach in the e-health sensor platform,” in Proceedings of the11th ACM Symposium on QoS and Security for Wireless and MobileNetworks, ser. Q2SWinet ’15. New York, NY, USA: ACM, 2015, pp.1–7. [Online]. Available: http://doi.acm.org/10.1145/2815317.2815320
[22] “Mqtt,” http://mqtt.org/, accessed: 2018-12-07.[23] P. Mohebbi, E. Stroulia, and I. Nikolaidis, “Sensor-data fusion for
multi-person indoor location estimation,” Sensors, vol. 17, no. 10,2017. [Online]. Available: http://www.mdpi.com/1424-8220/17/10/2377
[24] “Smartcondo™,” https://www.ualberta.ca/health-sciences-education-research/simulation-experiences/hserc-spaces/smart-condo, accessed:2018-12-09.
[25] M. Mohammadi, A. Al-Fuqaha, M. Guizani, and J. Oh, “Semisuperviseddeep reinforcement learning in support of iot and smart city services,”IEEE Internet of Things Journal, vol. 5, no. 2, pp. 624–635, April 2018.
[26] “BLE RSSI dataset for indoor localization and navigation data set,”https://archive.ics.uci.edu/ml/datasets/BLE+RSSI+Dataset+for+Indoor+localization+and+Navigation, accessed: 2018-12-09.
363