simulation-based voip performance …etd.lib.metu.edu.tr/upload/12616517/index.pdf · table 4.5 :...
TRANSCRIPT

SIMULATION-BASED VOIP PERFORMANCE EVALUATION UNDER DIFFERENT
TRAFFIC AND CODEC CONDITIONS
A THESIS SUBMITTED TO
THE GRADUATE SCHOOL OF NATURAL AND APPLIED SCIENCES
OF
MIDDLE EAST TECHNICAL UNIVERSITY
BY
BERK ÜNLÜ
IN PARTIAL FULFILLMENT OF THE REQUIREMENTS
FOR
THE DEGREE OF MASTER OF SCIENCE
IN
ELECTRICAL AND ELECTRONICS ENGINEERING
SEPTEMBER 2013

Approval of the thesis
SIMULATION-BASED VOIP PERFORMANCE EVALUATION UNDER
DIFFERENT TRAFFIC AND CODEC CONDITIONS
submitted by BERK ÜNLÜ in partial fulfillment of the requirements for the degree of Master
of Science in Electrical and Electronics Engineering Department, Middle East Technical
University by,
Prof. Dr. Canan Özgen
Dean, Graduate School of Natural and Applied Sciences
Prof. Dr. Gönül Turhan Sayan
Head of Department, Electrical and Electronics Engineering
Assoc. Prof. Dr. Şenan Ece Schmidt
Supervisor, Electrical and Electronics Engineering Dept., METU
Examining Committee Members:
Prof. Dr. Semih Bilgen
Electrical and Electronics Engineering Dept., METU
Assoc. Prof. Dr. Şenan Ece Schmidt
Electrical and Electronics Engineering Dept., METU
Assoc. Prof. Dr. Cüneyt Bazlamaçcı
Electrical and Electronics Engineering Dept., METU
Assoc. Prof. Dr. İlkay Ulusoy
Electrical and Electronics Engineering Dept., METU
Prof. Dr. Veysi İşler _____________
Computer Engineering Dept., METU
Date: 13.09.2013

iv
I hereby declare that all information in this document has been obtained and presented
in accordance with academic rules and ethical conduct. I also declare that, as required
by these rules and conduct, I have fully cited and referenced all material and results that
are not original to this work.
Name, Last name : BERK ÜNLÜ
Signature :
v
ABSTRACT
SIMULATION-BASED VOIP PERFORMANCE EVALUATION UNDER DIFFERENT
TRAFFIC AND CODEC CONDITIONS
Ünlü, Berk
M.Sc., Department of Electrical and Electronics Engineering
Supervisor: Associate Prof. Dr. Şenan Ece Güran Schmidt
September 2013, 50 pages
One of today’s most popular multimedia applications that needs more investigation and
optimization is Voice over Internet Protocol (VoIP). Simulation tools are essential to test
existing network technologies and develop new ones. They are effectively used for network
analysis and solving design and optimization problems. The focus of this thesis is an extensive
simulation study to evaluate the achieved Quality of Service (QoS) support by VoIP traffic
under different network topologies, traffic profiles, codecs and queuing mechanisms. To this
end, firstly we performed a comparative evaluation of network simulators. Accordingly, we
selected ns-2 as our simulation tool because of its wide library of network components and
traffic types and its open source facilities. Next, we defined a number of different scenarios
guided by previous works in the literature. We conducted a set of simulation experiments with
ns-2 and evaluated the VoIP performance parameters such as delay, jitter and packet loss ratio
under these scenarios.
Keywords: Network Simulation, Network Simulation Tools, VoIP, VoIP Performance
Evaluation.
vi
ÖZ
FARKLI TRAFİK VE KODLAYICI KOŞULLARI ALTINDA BENZETİM TABANLI
VOIP BAŞARIMI İNCELENMESİ
Ünlü, Berk
Yüksek Lisans, Elektrik ve Elektronik Mühendisliği Bölümü
Tez Yöneticisi: Doç. Dr. Şenan Ece Güran Schmidt
Eylül 2013, 50 sayfa
Günümüzün daha fazla araştırma ve iyileştirmeye ihtiyacı olan en popüler çoklu ortam
uygulamalarından biri Voice over Internet Protocol (VoIP) ‘dir. Benzetim araçları var olan ağ
teknolojilerini test etmek ve yenilerini geliştirmek için gereklidir. Bu araçlar, ağ analizlerinde
ve tasarım ve iyileştirme sorunlarını çözmede etkin bir şekilde kullanılmaktadırlar. Bu tezin
odağı, farklı ağ topolojileri, trafik profilleri, kodekler ve kuyruk mekanizmaları altındaki VoIP
trafiği tarafından elde edilen Hizmet Kalitesi desteğini değerlendirmek için yapılan geniş çaplı
çalışmalardır. Bu amaçla, ilk olarak ağ benzetim araçlarının karşılaştırmalı bir
değerlendirmesini yaptık. Buna bağlı olarak, geniş ağ eleman kütüphanesi ve trafik çeşitleri
ile açık kaynak özelliğinden dolayı ns-2 ‘yi benzetim aracımız olarak seçtik. Daha sonra,
literatürdeki önceki çalışmaların ışığında birkaç farklı senaryo tanımladık. Ns-2 ile birtakım
benzetim deneyleri yürüttük ve gecikme, gecikmedeki değişim ve paket kayıp oranı gibi VoIP
başarım değişkenlerini değerlendirdik.
Anahtar Kelimeler: Ağ Benzetimi, Ağ Benzetim Araçları, VoIP, VoIP Performans İncelemesi.

vii
To My Family…

viii
ACKNOWLEDGEMENTS
This thesis work is one of the most important achievements throughout my life. I know that
without the people I have to thank, it would be impossible for me to success.
First of all, I am grateful and wish to send my thanks and gratitude to my supervisor, Assoc.
Prof. Dr. Şenan Ece SCHMIDT for her unlimited help, supervision, leading, guidance from
beginning till the end of this thesis work. I would like to thank Res. Asst. Bilge Kaan GÖRÜR
and METU – TSK MODSIMMER for their support during my study. Moreover, I would like
to express my appreciation to TÜBİTAK BİDEB for their support of my M. Sc. study with
their scholarship.
Finally, I would like to thank my lovely mother, father and my precious friends, for their
limitless supports, all encouragements and their deep belief in me, my thesis work and
throughout all my education life.
ix
TABLE OF CONTENTS
ABSTRACT ............................................................................................................................. v
ÖZ ......................................................................................................................................... vi
ACKNOWLEDGEMENTS .................................................................................................. viii
TABLE OF CONTENTS ........................................................................................................ ix
LIST OF FIGURES ................................................................................................................. x
LIST OF TABLES .................................................................................................................. xi
LIST OF ABBREVATIONS ................................................................................................. xii
CHAPTERS
1 INTRODUCTION ........................................................................................................ 1
2 A COMPARATIVE EVALUATION OF NETWORK SIMULATORS ..................... 3
2.1 Discrete Event Simulation and Classification of Network Simulators ................. 4
2.2 Desirable Features of Network Simulators ........................................................... 6
2.3 Overview of Frequently Used Network Simulators .............................................. 8
2.4 Comparison of the Selected Network Simulators ............................................... 10
3 VoIP TRAFFIC .......................................................................................................... 13
3.1 VoIP Traffic Model for Simulation ..................................................................... 18
3.2 Previous Works on VoIP Simulation .................................................................. 19
4 VoIP EVALUATION WITH SIMULATION ........................................................... 25
4.1 VoIP Evaluation under Ns-2 ............................................................................... 25
4.2 VoIP Evaluation under AABGS ......................................................................... 43
5 CONCLUSION .......................................................................................................... 45
REFERENCES ...................................................................................................................... 47

x
LIST OF FIGURES
FIGURES
Figure 2.1 : Principle of Discrete Event Simulation (Adapted from [4]) ………………….…..4
Figure 3.1 : A Simple Two State Process of VoIP Model……………………..…………..….18
Figure 3.2 : Experimental Diagram of the Study (Adapted from [40]) ………………...…….19
Figure 3.3 : OPNET Network Topology in the Study (Adapted from [42])……………...…...22
Figure 3.4 : Simulation Topology of First VoIP Experiment (Adapted from [43]……………23
Figure 3.5 : Simulation Topology of Second VoIP Experiment (Adapted from [43])..............23
Figure 4.1 : Topology of 2-Node Ns-2 Scenario……………………………………………..26
Figure 4.2 : Topology of 6-Node Ns-2 Scenario……………………………………………..27
Figure 4.3 : Topology of 10-Node Ns-2 Scenario……………………..……………………..27
Figure 4.4 : 30% Load Scenario Queuing Delay Frequency Distribution of Experiment 2…..30
Figure 4.5 : 60% Load Scenario Queuing Delay Frequency Distribution of Experiment 2…..30
Figure 4.6 : 90% Load Scenario Queuing Delay Frequency Distribution of Experiment 2…..31
Figure 4.7 : G.723 Queuing Delay Frequency Distribution of Experiment 3….……………..33
Figure 4.8 : G.729 Queuing Delay Frequency Distribution of Experiment 3………………...33
Figure 4.9 : G.711 Queuing Delay Frequency Distribution of Experiment 3………………...34
Figure 4.10 : Queuing Delay Frequency Distribution of Experiment 4………………………36
Figure 4.11 : DropTail Queuing Delay Frequency Distribution of Exp. 5 ………...…………38
Figure 4.12 : RED (Minth:5, Maxth:20) Queuing Delay Frequency Distribution of Exp. 5 ..…39
Figure 4.13 : RED (Minth:5, Maxth:20) Queuing Delay Frequency Distribution of Exp. 5…..39
Figure 4.14 : Queuing Delay Frequency Distribution of Experiment 6………………………41

xi
LIST OF TABLES
TABLES
Table 2.1 : Comparison of the Selected Network Simulation Tools ………………...………10
Table 3.1 : Delay Limits For One-Way Transmission (Adapted from [26]) …………..…….15
Table 4.1 : Properties of Ns-2 Experiment Scenarios ………………………………………..26
Table 4.2 : VoIP Performance Metrics Comparison Table of Experiment 2..………………..29
Table 4.3 : VoIP Performance Metrics Comparison Table of Experiment 3..………………..32
Table 4.4 : VoIP Performance Metrics Comparison Table of Experiment 4..………………..35
Table 4.5 : VoIP Performance Metrics Comparison Table of Experiment 5..………………..38
Table 4.6 : VoIP Performance Metrics Comparison Table of Experiment 6..………………..40

xii
LIST OF ABBREVATIONS
AABGS : Information Security Simulation for Military Networks (Askeri Ağlar için Bilgi
Güvenliği Simülasyonu)
ADY : Network Supported Ability (Ağ Destekli Yetenek)
DoS : Denial of Service
FIFO : First In First Out
FTP : File Transfer Protocol
GUI : Graphical User Interface
IP : Internet Protocol
ITU-T : International Telecommunication Union
MLPP : Multi-level Precedence and Pre-emption
MOS : Mean Opinion Score
NeSSi2 : Network Security Simulator
NGN : Next Generation Networks
Ns-2 : Network Simulator-2
OMNeT++ : Objective Modular Network Testbed in C++
OPNET : Optimized Network Engineering Tools
PSTN : Public Switched Telephone Network
RED : Random Early Detection
RTT : Round Trip Time
SIP : Session Initiation Protocol
SLA : Service Level Agreement
TCP : Transmission Control Protocol
VoIP : Voice over Internet Protocol
1
CHAPTER 1
INTRODUCTION
In various fields of life, the data networks have begun to play a critical role in the
communication and to provide various services. Today’s information necessities have caused
many difficulties in the design of new networks. Consequently, the importance of network
design and optimization has grown so much to enhance these critical issues.
A network simulator is a tool which is mostly used for testing existing technologies or making
new designs. It is possible to measure the performance of networks and observe if the virtual
technology is proper to use in real life. Network simulators can show output of the tested
technology in terms of various metrics like delay, throughput, jitter, packet loss, etc. Using a
network simulator before the realization saves long times, huge amount of money and work.
Therefore, network simulators are very efficient in design and optimization of networks. Some
of the well-known network simulators widely used for academic and commercial purposes are
ns-2, OPNET and OMNeT++. These simulators are mostly free to use. They support kinds of
technologies and provide environment for new designs.
Lately, the more data network use has become popular the more telecommunication services
have tried to adapt into this new development. Several certain examples can be given such as
rapidly developing internet based services such as VoIP, IPTV, etc. These services use the
“converged networks” which can be defined as the combination of different traffic types such
as voice, video and data into a single network [1].
Some of the multimedia applications like Voice over Internet Protocol (VoIP) which is one of
the widely used protocols of today, need certain Quality of Service (QoS) for providing a good
experience to the end users. Video and audio files have been transmitted separately by
connection-oriented networks for years. These networks have the priority for providing
maximum quality and reliability of service. However, for packet–switched networks, that
becomes an important problem for providing a good quality to users.
Furthermore, there are more complicated issues for these systems such as retransmission of
packets, delay, jitter, packet arrival orders and loss. These high-level expectations are
considered for not only small networks but also very large scale and distant network
connections.
When customers use services such as VoIP, they consider the price and the quality of service
that is promised from providers. Likewise, service providers consider their revenue and giving
right decisions about providing user demanded technologies. Thus, a service level agreement
2
(SLA) is signed between the customers and the service providers [2]. As a result, the
performance of these services become important for both sides. Network service providers
should seek efficient ways to satisfy customer demands without having any damage.
In this thesis, we aim to perform a comparative study on VoIP by using network simulation
tools. Firstly, we investigated most used network simulation tools and compared their
capabilities. Then, we evaluated the performance of VoIP traffic with network simulation
tools. We identified a number of different VoIP simulation scenarios which are guided by the
previous works in the literature. We conducted those simulations under ns-2 and investigated
the packet loss ratio, delay and jitter of VoIP. We aimed to observe the effects of different
load conditions on the bottleneck link, different codec schemes, different background traffic
scenarios and queuing types in the routers. Moreover, we pointed out the importance of active
queuing management and priority based queuing on improving the performance of VoIP.
The remainder of this thesis is constructed as follows. In Chapter 2, we made a comparative
evaluation of network simulators. We mentioned the discrete event model, types of simulators
and the desirable features of them. We discussed the selected network simulators and
compared them in terms of these features. In Chapter 3, we introduce the VoIP traffic
properties and the performance metrics for the VoIP applications. Furthermore, we discussed
the previous works on VoIP performance evaluations. In Chapter 4, we identify the different
scenarios to evaluate the VoIP performance and provide the corresponding results and
discussions under ns-2. Chapter 5 concludes our work.
3
CHAPTER 2
A COMPARATIVE EVALUATION OF NETWORK SIMULATORS
A network simulation tool consists of hardware and software components and is designed to
make predictions about the virtual network decisions and behavior. Users who want to create
a new computer network design or improve and administrate existing computer networks need
a network simulation tool to simplify their work and should observe the results and mistakes
before carrying their studies to the real networks. Thus, network simulators are preferred by
many researchers and developers to test their new protocols or hardware on current networks.
Network simulation tools like ns-2 and OMNeT++, are mostly used for academic and scientific
researches. Besides there are simulators used for commercial purposes. OPNET can be given
as an example to this category.
There are many advantages why it is preferred to simulate new technologies on virtual
networks before the realizing them. According to [3], first one is the economic reason.
Researchers can test or develop their new technologies on network simulators without actually
setting up their scenario or obtaining any other new hardware or equipment. All wiring such
as fiber optics, Ethernet and copper cables or actual routers, switches, end-user computers can
be counted in these equipment. Another advantage is that results can be reproduced again and
again without any loss of long times, money and effort. Also they are free of uncontrollable
real life factors that users have to deal with. Final reason to choose network simulators is that
it is very easy to change the topology, scale, any device or parameter when it is necessary.
Despite all that good points, network simulators has some disadvantages. As mentioned in the
advantages part, while working with a network simulator some of the uncontrollable real life
factors such as additional traffics, noises or unexpected errors are neglected to simplify the
simulation. Therefore, obtained results are clearer to analyze. However, these effects can be
modeled to simulation tools with adding extra settings but usually not preferred not to make
the simulation more complex. Hence, virtual simulation results can differ from the observed
real network results. Another disadvantage of using network simulators is memory constraints.
When simulating large scaled networks or using additional features on it, a long simulation
time may be needed and the system may have difficulty in working because of the fact that a
lot of resources and memory are used to run these complex scenarios [3].
In the rest of this chapter first of all discrete event simulation model and classification of
network simulators are explained briefly. Then it is followed by desirable features of network
simulators section. Following that, three network simulators ns-2, OPNET and OMNeT++ that
we selected because of their popularity are overviewed shortly. Finally, comparison of those
tools is made.
4
2.1 Discrete Event Simulation and Classification of Network Simulators
Discrete Event Simulation
Discrete event simulation is the most used technique in the computer networking. The most
important elements of this type simulation are “events” that the state of the model can only
change at these discrete points [4]. Discrete event simulation is very popular among network
simulation tools and almost all of them use this as base model because of several reasons. First
of all, this model is appropriate for most of the computer systems and easy to implement.
Besides, “repeatability” which is an important simulation feature for computer networking is
supported by this simulation type.
According to the [4], the principle of discrete event simulation can be summarized as
following. The simulation model follows events one by one and these events may trigger some
changes in the system state as well as new generated events, therefore they are called as event
notices in the future. There is a structure in the model named “future event list” that events are
recorded in as “event notices”. These notices consist of two data at least. First one is “time”
which means the system time when this event will happen and other one is the “type” which
identifies the event kind. Feature event list should have some important functions such as
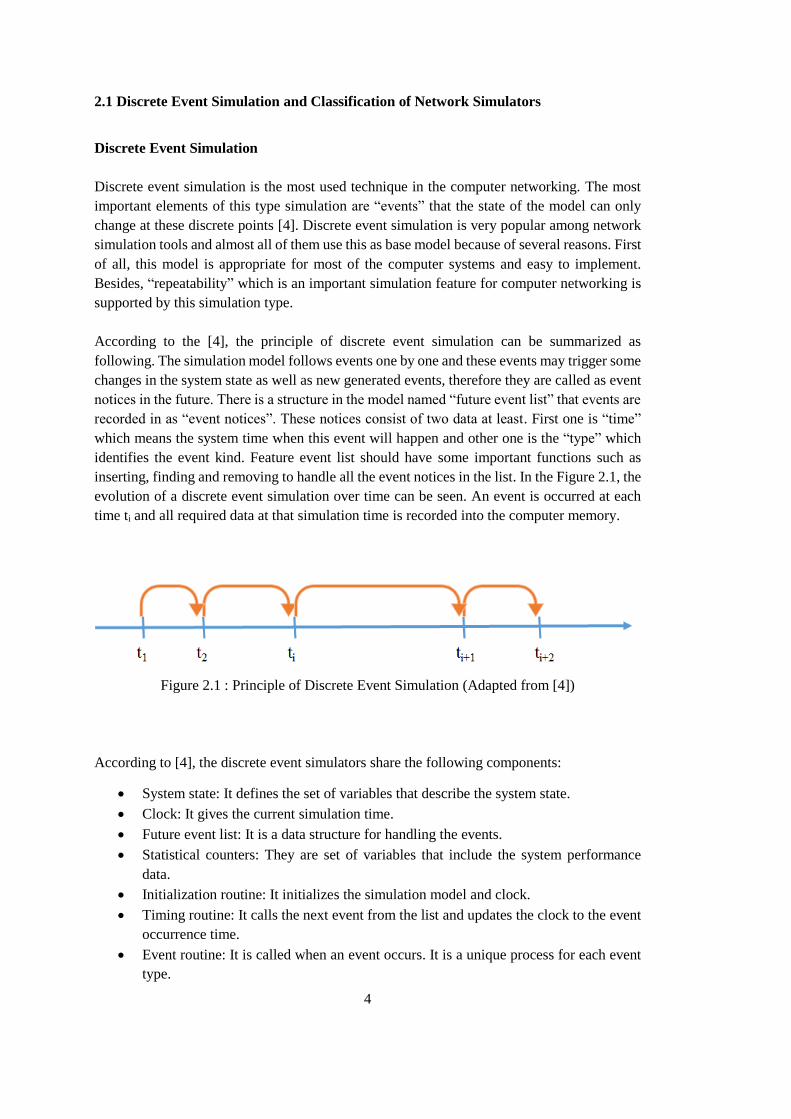
inserting, finding and removing to handle all the event notices in the list. In the Figure 2.1, the
evolution of a discrete event simulation over time can be seen. An event is occurred at each
time ti and all required data at that simulation time is recorded into the computer memory.
Figure 2.1 : Principle of Discrete Event Simulation (Adapted from [4])
According to [4], the discrete event simulators share the following components:
System state: It defines the set of variables that describe the system state.
Clock: It gives the current simulation time.
Future event list: It is a data structure for handling the events.
Statistical counters: They are set of variables that include the system performance
data.
Initialization routine: It initializes the simulation model and clock.
Timing routine: It calls the next event from the list and updates the clock to the event
occurrence time.
Event routine: It is called when an event occurs. It is a unique process for each event
type.

5
The core algorithm of the discrete event simulator can be diagrammed as shown in Fig 1.2 of
the reference [4]. In this algorithm there are three main parts which are initialization, event
processing loop and output. In the initializing part clock, entities and state variables are
introduced and set. Following that part, simulator comes to the event loop. In this part, next
event is called from the future event list and related handler is called. In this routine, there will
be certain changes in the existing variables, entities and statistics. Moreover, new event notices
can be generated. Finally, when the simulator is about to finish events it enters the termination
part. In this part, simulation computes the final results and presents them as outcomes.
Network simulation tools can be classified into two categories according to simulation
modeling type, which are packet based and flow based [5].
Packet Based Network Simulators
In the packet based simulations, network performance metrics like delay, bandwidth or routing
measurements are calculated for each packet generated or used by the simulator. It is
advantageous when examining the simulation packet by packet. However, usage of such a
simulator in large network topologies is not convenient due to the long simulation processing
times. In this kind of simulators, target result achievement is more important than the waiting
times of the simulation run. Ns-2 [6], OMNeT++ [7] and OPNET [8] are some of the well-
known packet based network simulators.
Flow Based Network Simulators
On the other hand flow based simulators work at application level and consider only the
characteristics of the traffic from one end point to another. In this kind of simulators,
performance metrics such as bandwidth, delay and packet loss are calculated between network
end points. Unlike the packet based simulators, they are advantageous for large scaled
simulations due to the fact that they only deal with traffic flows, not every packet. There are
very few well-known commonly used flow based simulators in literature such as PeerSim [9],
P2PSim [10], QueryCycle [11] and etc.
Such studies like [12] and [13] state that there are two main methods for transfer of flow based
model to the simulation environment. First of them is based on discrete event model and one
change in the data flow rate in a network interface will cause an event. Also, one data rate
change affects another and thus, all data rates in the interface will be updated. This method
has a downside that, event explosion may occur in such systems. Event explosion, which is
also known as “ripple effect”, is a major problem for flow based models. When the flow rates
between some events are assumed to be constant in a multisource system, output rate is
expected to have a manageable characteristic. When the events occur more frequently than
usual, there will be an extra event load sent to output and it will cause unexpected characteristic
in output rate. Therefore, performance of the system will be reduced [12]. On the other hand,
it has an advantage of being easy integrable to the discrete event model based simulators.
Second method is the calculation of data rates and other important instantaneous network
6
values in the interface periodically. It is difficult to implement this approach in discrete event
model based simulators but it does not cause event explosions. Periodicity concept of this
method refers to the time interval to calculate the instantaneous system conditions and make
decisions to lead the rest of the simulation according to the simulation properties. Choosing of
the period for calculations is very essential. The more period value increases, the faster
simulator gets in real time but the consistency of results will decrease. The more period value
decreases the more consistency increases whereas simulation gets slower. Due to the fact that
obtaining realistic results is the main critical point for network simulators, period value should
be chosen carefully. In the flow based model, inaccuracy with the period value depends on the
traffic variables in the network. For example, if the traffic rate in a flow stays stable for a long
time, choosing a long period will not cause a significant inaccuracy in the results. However, a
selected long period for traffics that vary a lot in a short time will result in inaccurate
performances.
In addition to that there are some studies such as [14] for hybrid simulation techniques. The
study attempts to combine, both advantageous parts of packet based and flow based simulators
by modeling the background traffic as flow based and foreground traffic as packet based. Thus,
they aim for a better packet level analysis with the help of less important but more realistic
background traffic. In the study [14] it is concluded that, results are obtained 20 times faster
with reasonable latency and jitter values when compared with pure packet based simulation.
2.2 Desirable Features of Network Simulators
In order to satisfy user demands, network simulation tools should possess number of desirable
features as stated in [15] and [16]. These important features can be listed as follows:
Accuracy
It is normal to have some differences between simulated and real values. However, these
deviations should not affect the obtained results dramatically. Hence, results of virtual network
simulation should be as close as possible to the real network results. However for some of the
simulations, protocol behavior is more important rather than accuracy of results. For example,
for a study about Random Early Detection (RED), the Round Trip Time (RTT) calculation for
a packet is not fixed and essential. In contrast with that, when comparing throughputs of two
data links, true RTT calculation becomes very important to obtain correct results.
Analytical Capability
To use the network simulator efficiently for researches, in addition to the numerical values,
users should obtain graphical plots like histograms, different kinds of curves or comparative
graphics in the simulation results. It will be more convenient to analyze and compare the
outcomes by this feature.
7
Efficient Modeling and Protocol Support
A research may have different topologies with different kinds of networks, network
components, protocol mechanisms or applications. Thus, a network simulation tool should
have an efficient modeling that it provides different modeling options for networks from room
networks to global networks. In addition, it should provide various kinds of network
components such as routers, switches, nodes and links with different bandwidths in the model
library. Moreover, it should support different kinds of protocols and applications such as TCP,
HTTP, FTP, etc.
System Limitations
Due to the limited resource of computers such as memory and processing time, scale of the
simulated network or number of necessary protocol agents are limited to a level. In order to
produce efficient simulations and scale to large and practical scenarios, network simulators
should not use unnecessary resources.
License and Accessibility
Due to the fact that network simulation tools are widely and frequently used by different kinds
of purposes, accessing to these tools become as an important problem. A good networking tool
should be free and easily accessible for academic and research uses. In addition to that
understanding what the simulator did, error debugging and accessing to the source code of
these network tools should be possible whenever it is needed.
User Friendliness and Documentation
It is important to have a simple graphical user interface (GUI) in a network simulation tool.
Furthermore, a well-written documentation about using the simulation tool, including all
capabilities and impairments in it will help the users to use the simulator more efficiently. As
a result, a user friendly network simulator with a well-designed GUI and good guide can help
researches to create simulations and advance in their studies fast.
Scalability
Most of the today’s networking technology use large scaled structures with long distances and
thousands of end nodes. A network simulation tool should provide a good scalability to
provide the “multi-node future technology”. Also, there should not be a maximum node
number limit when the future simulation improvements are considered.
Extensibility
Needs for networks designs are growing day by day. To supply new demands in computer
networks, existing protocols, models and topologies should be improved or re-designed. To
provide such a process, network simulation tools play a big role to achieve success. Thus,
source codes of these tools should be easy to understand and open to extensibility and users
8
should be capable of adding new protocols or application models to these tools or customize
existing models in accordance with the needs.
2.3 Overview of Frequently Used Network Simulators
In this section, an overview of commonly used network simulators is given. Ns-2, OMNeT++
and OPNET network simulators are chosen, due to their usage in the academia. Also, most of
the network research materials, books and reference papers used these network simulation
tools in comparative studies [17]. In addition to that according to the statistics, it is clearly
observed that, ns-2 and OPNET simulation tools are the most cited simulation tools among all
in the IEEE Journals and Conference Publications (ns-2 has 1436 citations and OPNET has
1352 according to the search by tool [18] on July 2013). Moreover, OMNeT++ is chosen in
addition to these tools owing to the fact that, according to the same statistics in last decade, a
growing popularity in the usage of OMNeT++ in lately studies is observed (approximately
100 citations according to the search by tool [18] on July 2013).
Ns-2 (Network Simulator-2)
Ns-2 which is a very popular and free network simulator among all the simulation tools is
preferred by researches frequently because of its capabilities and ease of use. It has become
the de facto standard for the academic researches for last years. It is a discrete event-based
simulator and began as ns (Network Simulator) in 1989 with the purpose of general network
simulation where the core of this simulator and most of its network protocol models are written
in C ++, and users write their scripts with the OTcl, an object-oriented extension of the Tcl
[6]. C++ and OTcl languages are combined together because of the fact that, C++ is good for
implementations, however it is not adequate for visualization. It is not simple to make
necessary modifications, add different components and adjust different parameters without a
user friendly support. In addition to that ns-2 has a separation in control and data path
implementations. To implement the detailed protocol C++ language is used, whereas OTcl
language provides users with controlling the scenario and scheduling the events. Thus,
combining these two languages becomes very efficient for users [19]. Use of the simulator can
be summarized as follows. First, users write their scripts using the OTcl language. After,
related classes are called from the ns library and events are scheduled and processed in
accordance with the script. At the end of the simulations, it is possible to see detailed results
at the packet level. However, users should use some additional programs like Network
Animator (NAM) to visualize the data. Moreover, ns-2 provides various kinds of available
features and additional protocols which are already implemented. It runs on several forms of
UNIX (FreeBSD, Linux, SunOS, and Solaris) and can be extended to Windows platforms
using a virtual machine so that it is like running under Linux. At the time of writing this thesis,
current stable release of ns-2 is ns-2.35 as of November 2011.
To provide newest technologies in both wired and wireless networks and increase the
performance of the existing version when studying with large scale topologies, a next
9
generation version of ns-2, namely ns-3 has been introduced lately. However due to the fact
that ns-3 is still in progress and does not support an extensive protocol support yet, it is not
considered in the scope of this thesis.
OMNeT++ (Objective Modular Network Testbed in C++)
Like ns-2, OMNeT++ is an open source discrete event simulator. Use of the tool is growing
day by day and it has become quite popular for academic and educational researches.
OMNeT++ is an extensible, modular, component-based C++ simulation library and
framework, primarily for building network simulators that include wired and wireless
communication networks, on-chip networks and queuing networks [7]. Its modules are
interconnected in a hierarchical nested method, means that every module is composed of
various different modules which have the ability of messaging between each other. These
modules are used for defining algorithms and adding new capabilities to the simulator. New
modules are developed by C++ programming language and its class libraries (consists of
simulation kernel, topology or random number generator classes, etc.) [15]. Working principle
of the simulator can be summarized as follows. Users create their own topology and models
using the component-based structure. After, related classes and component models are called
from simulation class library and model component library of the simulator in accordance with
the main simulation code. At the end of the simulation it is possible to analyze the results with
GUI tools. Moreover, OMNeT++ simulator works on Linux, Unix-like systems and Windows
versions too. OMNeT++ 4.3 is the last release on March 2013, at the time of writing this thesis.
OPNET (Optimized Network Engineering Tools)
Unlike ns-2 and OMNeT++, OPNET is the most widely used commercial network simulation
tool. Also it has some limited free versions for academic use. But the capability of those
versions is very low when compared with full versions. Like previous tools, it is a discrete-
event network simulator which first proposed by MIT in 1986 and is written in C++ language
[8]. It differs from ns-2 with available different network hardware models. It has lots of
supported protocols in to provide an enhancement environment for the users. It has a good
GUI to simplify the development of new models, protocols and components. Users can
simulate existing scenarios as well as their own designs which are usually written in C or C++
codes. Working principle of the OPNET can be summarized as follows. First, users write their
own codes in C++ programming language or choose existing models and scenario settings
with the help of user interface. After, according to these models and settings, events are
scheduled and handled one by one. At the end, it is possible to observe results in various kinds
of data graphs (such as throughput, jitter, delay, etc.). Moreover, it runs on Windows
platforms, Linux and Solaris platforms. OPNET IT Guru 9.1 commercial and academic
editions are the last releases at the time of writing this thesis.
10
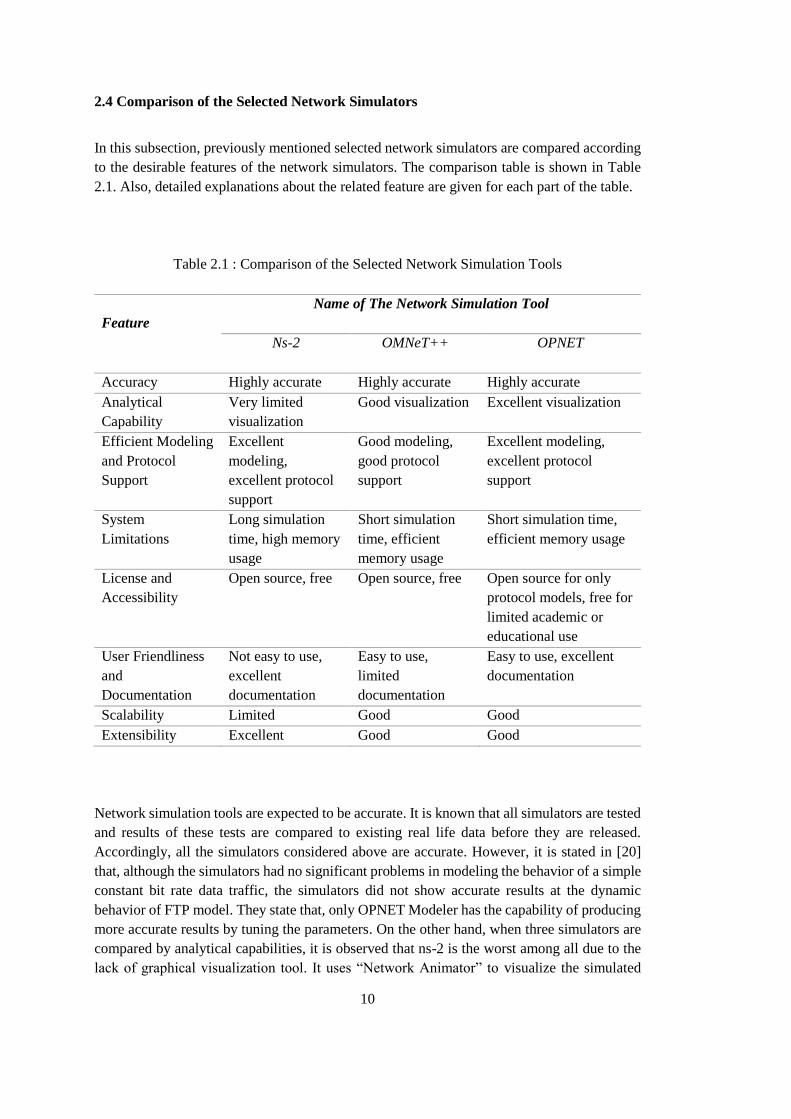
2.4 Comparison of the Selected Network Simulators
In this subsection, previously mentioned selected network simulators are compared according
to the desirable features of the network simulators. The comparison table is shown in Table
2.1. Also, detailed explanations about the related feature are given for each part of the table.
Table 2.1 : Comparison of the Selected Network Simulation Tools
Feature
Name of The Network Simulation Tool
Ns-2 OMNeT++ OPNET
Accuracy Highly accurate Highly accurate Highly accurate
Analytical
Capability
Very limited
visualization
Good visualization Excellent visualization
Efficient Modeling
and Protocol
Support
Excellent
modeling,
excellent protocol
support
Good modeling,
good protocol
support
Excellent modeling,
excellent protocol
support
System
Limitations
Long simulation
time, high memory
usage
Short simulation
time, efficient
memory usage
Short simulation time,
efficient memory usage
License and
Accessibility
Open source, free Open source, free Open source for only
protocol models, free for
limited academic or
educational use
User Friendliness
and
Documentation
Not easy to use,
excellent
documentation
Easy to use,
limited
documentation
Easy to use, excellent
documentation
Scalability Limited Good Good
Extensibility Excellent Good Good
Network simulation tools are expected to be accurate. It is known that all simulators are tested
and results of these tests are compared to existing real life data before they are released.
Accordingly, all the simulators considered above are accurate. However, it is stated in [20]
that, although the simulators had no significant problems in modeling the behavior of a simple
constant bit rate data traffic, the simulators did not show accurate results at the dynamic
behavior of FTP model. They state that, only OPNET Modeler has the capability of producing
more accurate results by tuning the parameters. On the other hand, when three simulators are
compared by analytical capabilities, it is observed that ns-2 is the worst among all due to the
lack of graphical visualization tool. It uses “Network Animator” to visualize the simulated
11
networks and needs an external program like “xgraph” or “gnuplot” to convert the simulation
data to meaningful graphics. All of simulators have large component libraries and protocol
model types. Their libraries are expanding with the new versions of these simulators. However,
OMNeT++ is not very efficient due to the fact that it is still on progress and does not support
all of the new protocols. Unlimited version of OPNET is commercial, therefore ns-2 is
advantageous in terms of efficient modeling.
It is observed that, the more network scale gets larger, the more simulator speed decreases and
memory usage increases. Also it is observed that OMNeT++ and OPNET operate better than
ns-2 by terms of system limitations when compared by the study of simulations under different
sized and loaded network topologies. Another important feature is, being a free and open-
source simulation tool for users. OPNET is the only commercial one among three simulators,
and limited source is open. In contrast, it provides best user friendliness and documentation
according to the literature search. Even though there are lots of documents about ns-2, it is the
most difficult tool to learn due to the lack of GUI. Even though OMNeT++ provides a good
GUI, because of the fact that it is not used as widely as others, there is not adequate
documentation about it. Scalability is another important issue for these tools. None of them
provides a very-large scalable network (more than 1000s nodes). Generally a flow-based
architecture or parallel simulators are chosen for the large scaled network simulations. Also
execution time and memory usage limits the scale factor. OMNeT++ and OPNET are observed
to be more scalable than ns-2 in terms of those limits. Finally, it can be said that ns-2 has the
highest extensibility capability due to its open source feature and basic programming language.

12
13
CHAPTER 3
VoIP TRAFFIC
Voice over IP (VoIP) definition commonly refers to the sum of communication protocols,
technologies, methodologies, and transmission techniques of the voice communications and
the multimedia sessions over Internet Protocol (IP) networks, such as the Internet [21]. Use of
VoIP in different kinds of areas, such as academia, military, industrial and daily
communication is rapidly growing day by day. Many advantages of using VoIP, such as cost
saving and accessibility, are the main reason of this increase. In addition to its wide use in
many important developed areas, there is also a huge individual use. Several international
service providers are already offering VoIP services in low prices for public use, like Google,
Yahoo, Skype, or Gizmo Project as stated in [22]. Thus, these services have taken the place of
traditional communication services like telephony, voice mail and fax, nowadays.
“International Call Volumes and Growth Rates” graph which shows the growths of traditional
time division multiplex (TDM) and VoIP traffics separately is given in reference [23]. This
analysis has been made by Telegeography, a telecommunications market research and
consulting firm that conducts in-depth research studies of the telecom industry. Their study
reports that international telephone traffic which is the combination of TDM and VoIP traffics
reached to 490 billion minutes in 2012. However, growth rate of these calls is decreasing by
the years and average growth is below the 13% for the last two decades.
On the other hand, when the growth rate of the VoIP traffic is analyzed, it can be clearly seen
that VoIP traffic share continues to grow rapidly unlike the TDM. “Effect of the Skype” graph
in [23] shows how Skype use has affected this growth by the years. According to
Telegeography, international Skype-to-Skype voice and video traffic grew 44% in 2012, to
167 billion minutes (51 billion minutes more than the growth rate in 2011). It can be concluded
that people are likely to use these VoIP services instead of traditional voice communication
for last years. When the traffic share of the other VoIP applications are considered too, we can
say that use of the traditional services like telephony will be very low in the near future and
Internet based peer-to-peer services will dominate the future voice communication.
Moreover, there are lots of organizations like military that use VoIP in their infrastructures as
mentioned before. These organizations are generally located worldwide and have started to
carry their voice communication infrastructure from TDM to Next Generation Networks
(NGN) which is based on VoIP applications [24]. Some of the usefulness of VoIP has caused
this transition. First of all, costs are low due to the transition of both data and telephony on a
single build-up line which is advantageous for these organizations. In addition to that a well-
designed IP network can provide more resilience than TDM networks. IP networks are simple

14
to deploy and control in comparison to traditional communication networks. Therefore, VoIP
has become an important favorable application for most of the organizations lately.
VoIP services should satisfy some performance requirements to provide a good QoS for users.
First one of them is delay which can be called as mouth-to-ear delay. It is defined as the time
passed between the moment when sender utters a word and receiver hears [25]. Second
requirement is jitter. Jitter can defined as variation of the delays that are observed for a period
of time. To achieve a good quality in VoIP, it is important to deliver each packet in a stable
time. Another requirement is packet loss, which is commonly seen in voice applications.
Finally, it can be said that bandwidth is one of the most considerable performance metrics for
VoIP. These metric explanations and its normal values are summarized as following:
Delay
Delay is one of the biggest troubles in voice transmission networks. In such networks, end-to-
end delay is desired as minimum and it should not be effective on continuous communication.
According to [25], the delay has five different components:
Encoding delay: It is the time interval needed to encode the voice signal, it is defined
by the voice codec.
Packetization delay: It is the time interval needed to packetize the voice frames.
Network delay: It is the combination of transmission, propagation and queuing
delays.
Playback delay: It is the delay caused by the playback buffer of the receiver’s side,
it helps to smooth jitter metric of voice packets.
Decoding delay: It is the time interval needed for reconstructing the voice.
Also the survey [25] states that, there are two main reasons that increase the delay in a network.
First of them is residing of the user in a different network. If the user is residing in another
PSTN or IP network, then voice packets need to be converted to the specific format of that
network. Therefore, there will be an extra delay because of this conversion. Another reason
stated is that, if a user is resided behind a residential gateway which means the device connects
a local area network to a wide area network, the sent packets are first collected at the gateway
and then transmitted to the Internet. Also, if capacity is exceeded at the links packets are
buffered, thus these cause the queuing delay. A delay which cannot be prevented may cause
some bad effects on voice transmission. For example, an echo-impairment in a voice
transmission becomes more effective or there may be a decrease in the quality of speech. Table
3.1 shows delay limits for one-way transmission on connections with adequate controlled echo
according to ITU-T (International Telecommunication Union – Telecommunication
Standardization Sector) Recommendation G.114 [26].

15
Table 3.1 : Delay Limits for One-Way Transmission (Adapted from [26])
End-to-end Delay (ms)
Quality
0-150 Acceptable for most users
150-400 Acceptable but has impact
400 and above Unacceptable
Jitter
As mentioned before, jitter is the variation between the arrivals of the packets to the end node.
Jitter mostly occurs because of network congestion and long queuing delays. To have a good
quality conversation without any gaps, jitter should be at the minimum level. When human ear
sensitivity is considered, a jitter below 30 ms is the best for the voice communications.
According to [27], 30 – 75 ms can be acceptable depending on the delay budget, type of used
voice codec and voice packet size.
Packet Loss
Packet loss is another important metric on voice communication. To have a meaningful and
high-quality conversation, having a very low-rated packet loss is desired. Packet loss occurs
due to the several reasons, such as network congestion and dropping due to late arrival of the
packet to the destination. To decrease the effects of packet loss, some forward error correction
techniques can be used. They are implemented with some algorithm in transmitted packets so
that, in case of an error, receiver can detect and correct those information bit errors. It is stated
in [28] that, for VoIP applications, more than %99 of delivery ratio is required.
Bandwidth
Bandwidth defines the size of the link capacity. Streaming videos, or making uninterrupted
video calls need a large bandwidth, therefore it should be optimized in an effective way. It is
stated in [29] that, “Several compression/decompression (codec) algorithms recommended by
the ITU-T can reduce the amount of bandwidth needed for one VoIP circuit to a fraction of
the traditional 64 Kbps of bandwidth reserved for calls in circuit-switched networks”. Thus,
using an appropriate codec and communication link play a big role on having a good voice
quality.
On the other hand, there are some specific needs for VoIP service used in organizations which
differ from the commercial network requirements as stated in [24]. Some of these requirements
are important for both organizations and public uses such as security and survivability. These
needs can be listed as following:

16
Call Control Capability
Generally VoIP networks use Session Initiation Protocol (SIP) or H.248 for call signaling.
However, organization specific networks need more than that. Hence, there are some
extensions for these VoIP services for example Multi-level Precedence and Pre-emption
(MLPP), used by US government department of defense. It is an important and critical
standard for organizations and provides the high priority packets to deliver first when there is
an emergency case. Thus, even though there is congestion in the networks, military packets
should be transmitted fast and safely. A protocol like that is an absolute need for organizations
like military to communicate urgent in case of a state of emergency in the country.
Security
Security of transmitted packets is an essential issue for both commercial and public networks.
Communication packets of organizations are expected to carry important information in it,
thus security factor becomes a great concern for them. To satisfy that, choosing of the
information channels, protocols, interfaces and links becomes very critical. Moreover, high
efficient encryption techniques should be deployed and security tunnels should be used to
communicate between end-users. According to [30], need-to-prevent VoIP security threads
consist of four different categories as following:
Service Availability: It is one of the most significant threads for VoIP systems. In
case of such an attack able to access service availability, system will be affected in a
bad way easily. Consequently, it affects customers and quality of service directly.
These types of threads can be controlled by hackers by sending worms, viruses or
denial-of-service attacks (DoS). If this security issue cannot be prevented, there will
be huge revenue losses, long system downtimes, and decrease in productivity and
maintenance costs.
Service Integrity: It is the type of thread that actually based on stealing a VoIP phone
identity and then performing illegal works to gain unjustified benefit or denigrate the
service provider company. For example, with a stolen ID, a hacker could record an
IPTV content and then sell it illegally.
Spam: It is one of the biggest concerns about the growing internet telephony uses.
Lots of unwanted messages are sent to the users by this way. If it is not prevented, it
will cause unexpected performance decreases in a lot of extra load and system delays.
Eavesdropping: It is another essential need-to-prevent issue for proprietary
information. Some techniques used by hackers that provide accessing the media paths
or signals will cause to a leakage in the secret information.
17
Survivability
Another important performance metric for organization specific VoIP networks is
survivability. It is expected that under any condition, voice data packets should achieve the
success of delivering to correct destination in accordance with the desired performance
metrics. Also, network compounds should resist to the attacks over the network and prevent
unauthorized access attempts. This kind of protection can be ensured by deployment of
security applications and firewalls.
IPv6
IPv6 is the latest alternative to the traditional IPv4. In contrast to old version, IPv6 has larger
address spaces in its field. It solves most addressing problems in the network systems. Due to
the fact that it is more efficient and useful, IPv6 have been begun to use for latest network
implementations. To keep up with developing technology and have the ability to communicate
with other IPv6 based systems, organization networks should have IPv6 capable equipment.
Moreover, use of IPv6 is helpful for improving security, mobility and dynamic addressing
issues.
High Definition VoIP
High definition VoIP is one of the topics becoming popular lately. According to the study [31]
applying the high definition VoIP application with latest technology codecs make the results
more satisfying. Required bandwidth for a typical HD-VoIP is 50 Hz ~ 7 kHz whereas for a
narrowband VoIP it is only 300 Hz ~ 3.4 kHz. In addition, delay should be less than traditional
VoIP and it can be achieved by those codecs. High definition VoIP may be a critical issue for
organizations. For example, some of the letters sound very similar to each other. When
communicating in organizations like military, these little nuances may cause fatal
misunderstandings.
RED (Random Early Detection)
There are many active queuing management technologies in implementation, which provides
packet dropping when the queue is full. According to [27], RED is one of the most widely
used implement among them. Random early detection is an algorithm that in case of any packet
drop condition, packets are dropped according to the precedence. There should be such
queuing algorithms for organizations to make sure that in a dropping condition, important
organization level packets should be the latest ones to drop.
In conclusion, VoIP is becoming very important in every field of communication. Therefore,
this application should be more studied and analyzed in depth. Due to the fact that, most of the
companies that use VoIP such as Skype [32], does not share their sources to public or analysis
of VoIP performance needs more information. Also, to obtain the information about VoIP,
building a real test bed with real components is very difficult, expensive and inconvenient.
Thus, network simulation tools play a big role on these studies and various kinds of simulations
on VoIP subject are needed.

18
3.1 VoIP Traffic Model for Simulation
In order to simulate a realistic VoIP application, a network simulation tool with a good VoIP
traffic model is required. There are lots of studies about finding the best traffic model for VoIP
simulation. Some of the studies like [33] and [34] generate their model according to the
statistics that are gathered from reliable international network company sources and after
analysis, they compare or multiplex them with analytical models. In the light of these studies,
different kinds of traffic models are developed and tested for closeness to the obtained
statistics. According to [35], ON/OFF model is the most used model for simulating the VoIP.
This model can be thought as a two-state process and these states are talk-spurt (ON) and
silence (OFF) states [36]. It is shown in Figure 3.1.
Figure 3.1 : A Simple Two State Process of VoIP Model
To determine the ON/OFF state transitions, several distributions are used in the literature such
as exponential, Gamma, log-normal, Weibull and Pareto. When the experiments about the
comparison of these distributions in the study [37] are analyzed, it can be seen these 5
distributions show similar results for the results of probability distribution function of the ON
period. Whereas, when the same experiment is held for OFF period, it is observed that, log-
normal distribution performs best among all. G.711 voice codec scheme which is one of the
most used techniques in voice communication is used for these tests. There are other voice
codecs widely used in literature such as G.723 and G.729. It is also stated in [37] that, effect
of the parameters such as choice of voice codec, implementation of silence compressor and
type of the voice communication will have certain effects on the characteristics of these
distributions. Besides that, for the voice packet generation in the talk-spurt state, most of the
studies use the constant bit rate. However there are some studies that develop different models
for inter-arrival times [38].
19
3.2 Previous Works on VoIP Simulation
There are lots of studies about VoIP evaluation and its performance in literature. Most of them
concerns about the performance metrics such as delay, jitter, bandwidth etc. and then perform
comparisons between different scenarios. These studies are mostly statistical and depend on
the opinion of users, results are generally obtained in the terms of mean opinion score (MOS).
According to [39], in the experiments use MOS, experimenters state their opinions about the
performance of the study with a value in the scale of 1-5 where “5“ denotes the best quality
and “1” the worst. After the collection of the opinions, arithmetic mean of the sum is
calculated, then with reference to the obtained results, performance tables and graphs are
prepared and it is decided that whether the study is verified or not.
In the literature, despite of the fact that there are a lots of study about VoIP performance
evaluation, there are no studies of the large scaled (1000s nodes) wired VoIP and organization
specific implementations. However, there are such previous works about evaluating VoIP
network performance which can be considered as base models of network topologies,
implementation and scenario ideas for this thesis. These studies can be summarized as follows:
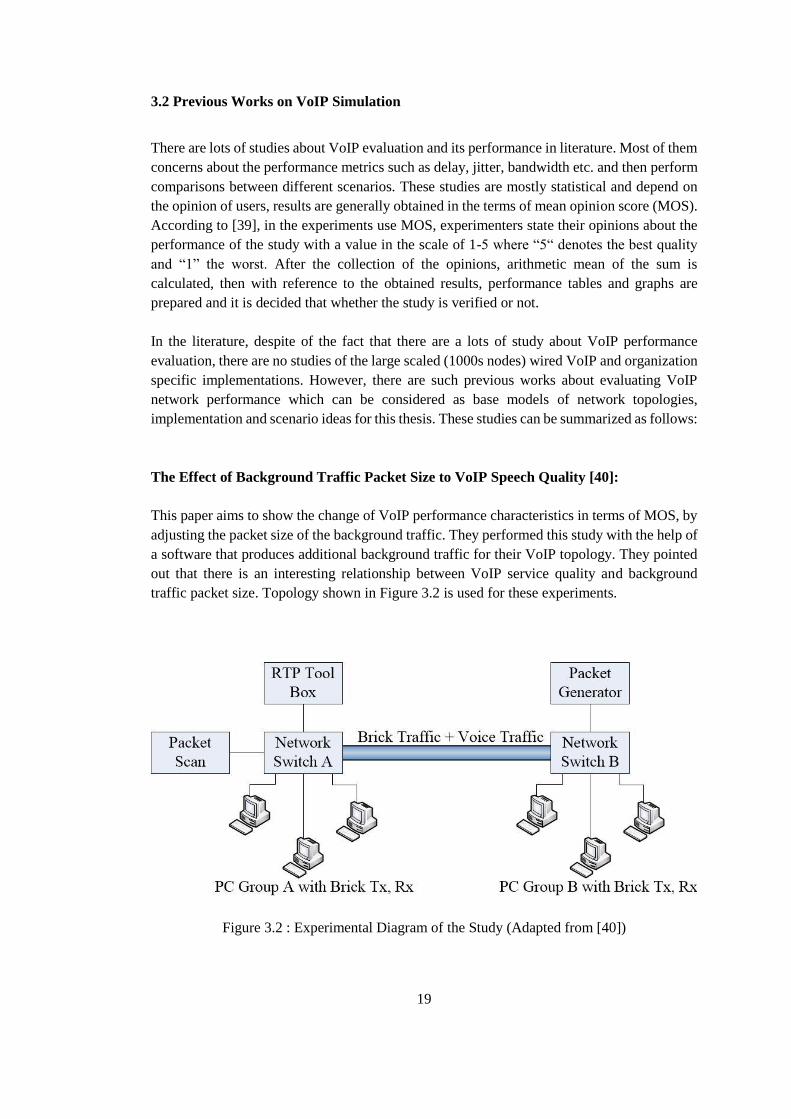
The Effect of Background Traffic Packet Size to VoIP Speech Quality [40]:
This paper aims to show the change of VoIP performance characteristics in terms of MOS, by
adjusting the packet size of the background traffic. They performed this study with the help of
a software that produces additional background traffic for their VoIP topology. They pointed
out that there is an interesting relationship between VoIP service quality and background
traffic packet size. Topology shown in Figure 3.2 is used for these experiments.
Figure 3.2 : Experimental Diagram of the Study (Adapted from [40])
20
In the experiment, two switches are used (A, B) and all links are chosen as 100 Mbit Ethernet
with full utilization. VoIP traffic is produced by RTP Tool Box and Packet Generator, while
background traffic is produced by Bricks software as TCP traffic. They used three different
packet sizes (64 B, 800 B and 1500 B) and investigate how they affect the VoIP performance.
Also, four different voice codecs (G.711, G.726, G.729 and GSM) are compared to obtain best
result. First, they examine the MOS of VoIP without background traffic. An overall of 60 calls
are used and it is observed that they perform very close to standard however G.711 performed
best among all. Next, they examine the effect of TCP background traffic packet size
adjustment on VoIP performance. After their experiments, they resulted that a crowded
background traffic with smaller packet size is more effective on VoIP performance. They state
that MOS of voice quality sharply reduces (to the level of 3.08 for G.711 voice codec) due to
the fact that as packet size of background traffic gets smaller, more packets are generated by
the software. This causes long queues and packet drops in the network switch buffers. As a
result they state that VoIP performance reduces with more crowded background traffics.
Performance Studies of VoIP over Ethernet LAN [41]:
[41] is a thesis work that investigates the performance of VoIP traffic characteristics over
Ethernet LANs. In the scope of the study, the effect of increasing the number of VoIP clients,
voice codec schemes, and traffic distribution on system performance are considered. VoIP
performance is evaluated under different topologies such as home office (small scale) and
campus networks. OPNET simulation tool is used for performing the scenarios. Simulation
assumptions for the study are given as following:
The local area networks operate at 100 Mb/s with full utilization throughout the
simulations.
There is no other network traffic besides VoIP traffic in this study. Each simulation
experiment considers 8 minutes of simulation time.
This study also assumes that there are only peer-to-peer voice calls throughout the
simulation, which means there is no voice conferencing.
CISCO 2612 router, 3Com switch and G.711 codec scheme are selected as default for
simulations.
In the experimental part, it is observed that the adjustable parameters such as VoIP client
number, voice codec and traffic distribution can significantly affect the characteristic of QoS
parameters of VoIP application. The topology that is studied consists of a sender node, a
receiver node, a gateway, and a router which are all interconnected by a switch. Performed
experiments and obtained results can be summarized as following:
Impact of increasing VoIP clients: In this experiment, client number is initialized
from 2 nodes and increased to 400. It is reported that, Ethernet delay stays very low
(1.6 ms) until 20 nodes, increases to 9 ms for 120 nodes and rapidly reaches above 1
second for 200 to 400 nodes. Also, end to end delay is investigated. It has been
reported that until 120 nodes it stays at 150 ms, however for 400 nodes it reaches to
1.5 second which is not acceptable. Moreover, jitter is investigated. It is reported that
21
from 2 to 20 nodes, jitter stays less than 1 ms. As the number of clients increase to
400, jitter approaches to the 6 ms.
Impact of Encoder Schemes: G.711, G.723 and G.729 codecs are compared for same
20 node network topology and scenario parameters. Voice frames per packet is chosen
5 as default. At the end of the experiment it is reported that G.711 performs best for
that topology when performance metrics are considered.
Impact of Traffic Arrival Distributions: In this experiment, exponential, Poisson
and constant traffic distributions for VoIP are compared for 20 node wired network
with same parameters. According to the results, it is reported that they show quite
same characteristics for jitter whereas there are slight differences in Ethernet delays
which can be ignored due to they are all around 1 ms. Exponential distribution is
observed best in terms of end to end delay among all. However, all the results are very
similar, it is concluded that choice of distribution is not very effective on VoIP
performance.
On the deployment of VoIP in Ethernet networks: Methodology and case study [42]:
In this study, a step by step methodology on how to deploy VoIP application in networks
successfully is explained. Aim of the study is obtaining assessment of network support and
readiness. In the scope of the study, after defining the QoS parameters and needed calculations
and analysis are made and then both utilized. To do that, queuing theory is used for analysis
and OPNET is chosen for simulation environment. It is pointed out that analysis and
simulation results show very similar characteristics. Performed experiment and obtained
results can be summarized as following:
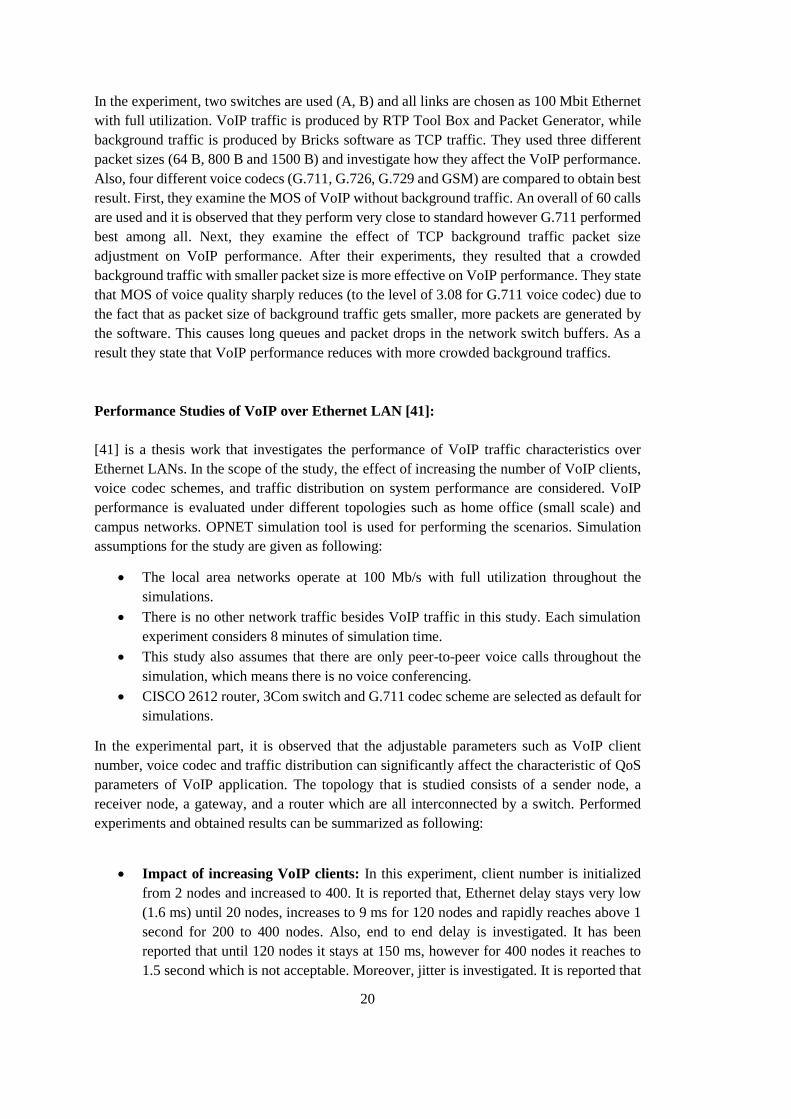
To perform the experiment, a topology as seen in Figure 3.3 is set up in OPNET. In this
topology, VoIP gateway is modeled as an Ethernet workstation and enterprise servers are
modeled as Ethernet servers. All network equipment are connected with 100 Base-T links.
Moreover, floor LAN networks consist of one VoIP server, one VoIP client and one
background traffic source/sink node which are all interconnected by a switch.
22
Figure 3.3 : OPNET Network Topology in the Study (Adapted from [42])
For the scenario, duration of the OPNET simulation run was set to 8 minutes. After running
the simulation, delay and traffic volume which are most relevant graphs for study are observed.
According to the results, it can be said that, approximately 61,500 pps (packet-per-second)
VoIP traffic is achieved. Due to the addition of three calls every 2 seconds, the traffic graph
shows a mismatch at some point and packet droppings are started. This point is observed after
4 min 48 sec exactly. After relevant calculations, it is remarked that system actually can
provide up to 33,000 pps VoIP traffic successfully. Also, when delay graphs are considered,
it is reported that delay stays less than 80 ms for 4 min 54 sec and it is acceptable. After that
point, delay increases sharply. However, when compared it can be said that network bandwidth
plays more significant role in bounding the traffic volume for VoIP applications.
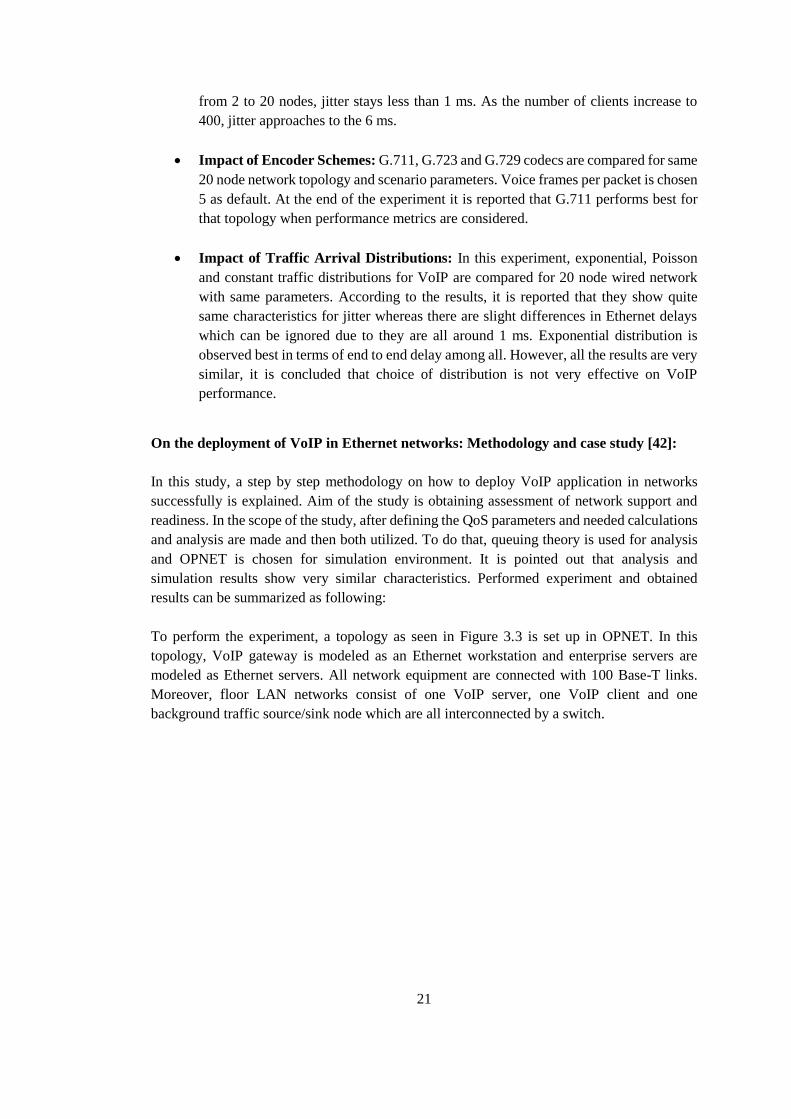
Analysing the Characteristics of VoIP Traffic [43]:
This study focuses on the analysis of characteristics of real VoIP data collected from a
deployed Cisco VoIP phone system and a SIP based phone system. It has an importance of
being the first VoIP analysis experiment based on deployment of real network systems. They
measured and simulated the VoIP performance metrics (delay, jitter and packet loss) to help
the analysis of VoIP quality. They developed a traffic generator and simulate the VoIP traffic
according to the obtained data. They investigate the characteristics of VoIP metrics with and
without a background traffic respectively. It is one of the few papers that use ns-2 simulation
tool for analysis of the constructed network topology. They examine two different scenarios,
first they simulated multiple VoIP calls on a backbone link. Second, they simulate a real
network environment with different traffic loads.
23
Figure 3.4 : Simulation Topology of First VoIP Experiment (Adapted from [43])
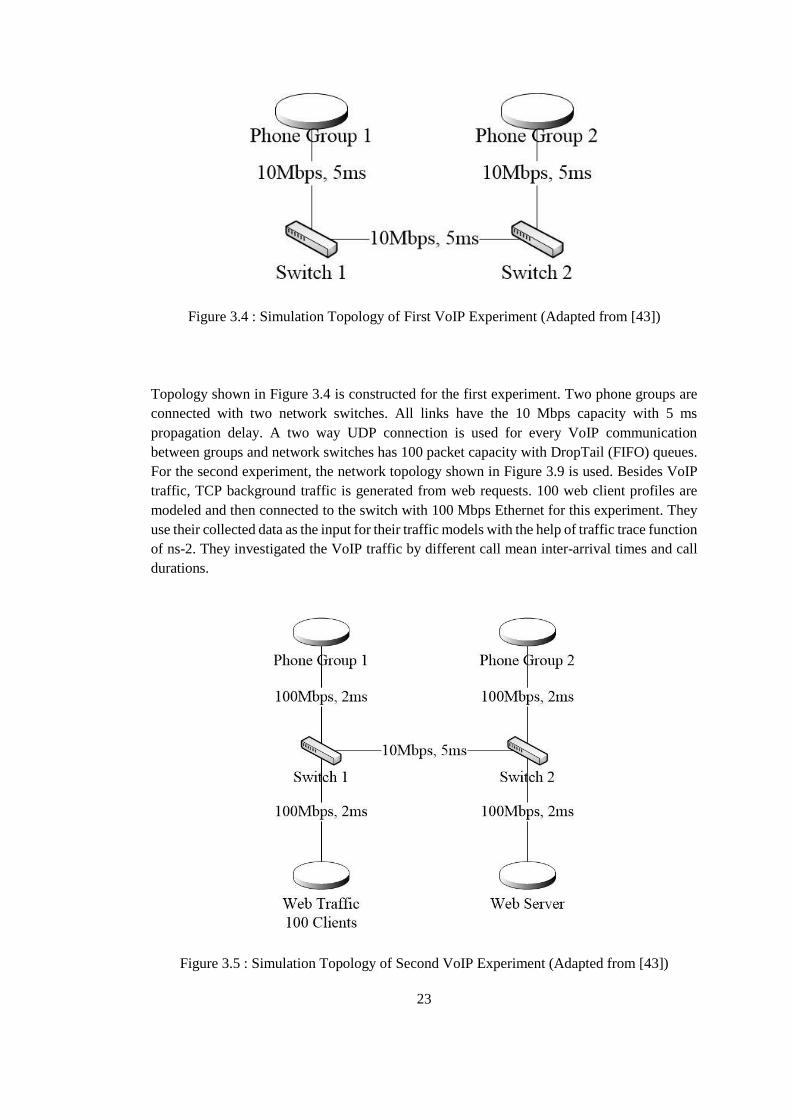
Topology shown in Figure 3.4 is constructed for the first experiment. Two phone groups are
connected with two network switches. All links have the 10 Mbps capacity with 5 ms
propagation delay. A two way UDP connection is used for every VoIP communication
between groups and network switches has 100 packet capacity with DropTail (FIFO) queues.
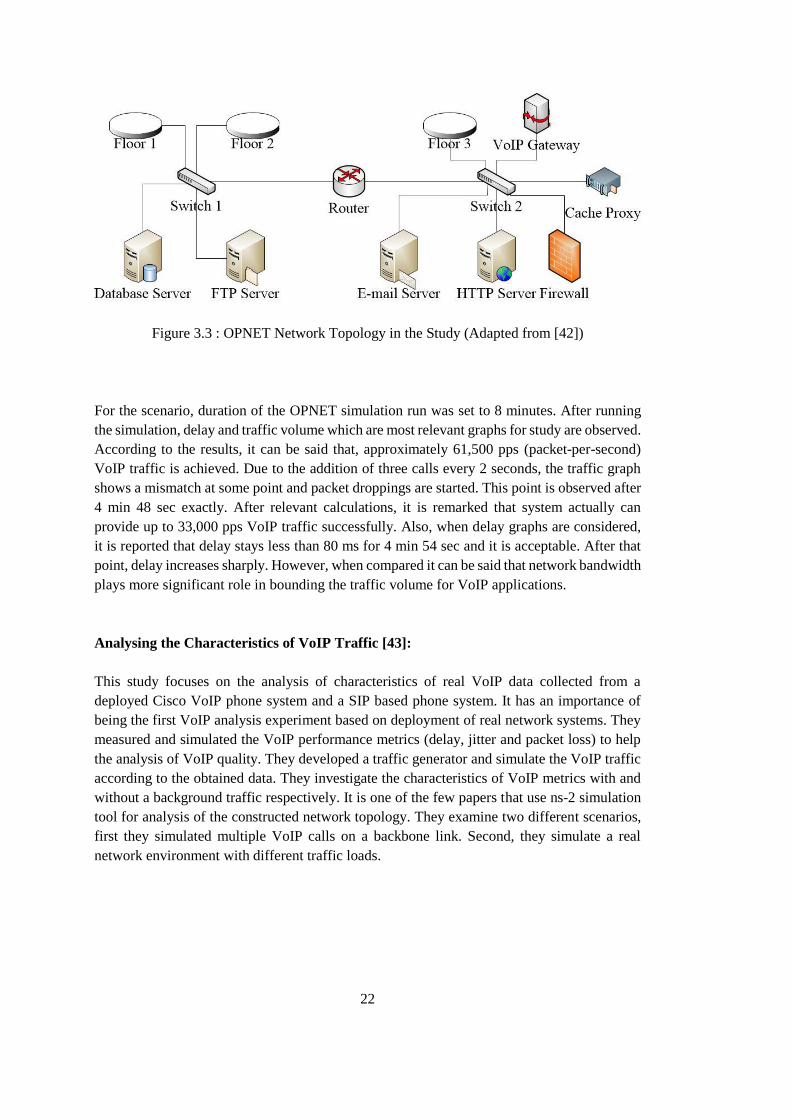
For the second experiment, the network topology shown in Figure 3.9 is used. Besides VoIP
traffic, TCP background traffic is generated from web requests. 100 web client profiles are
modeled and then connected to the switch with 100 Mbps Ethernet for this experiment. They
use their collected data as the input for their traffic models with the help of traffic trace function
of ns-2. They investigated the VoIP traffic by different call mean inter-arrival times and call
durations.
Figure 3.5 : Simulation Topology of Second VoIP Experiment (Adapted from [43])
24
After the first experiment, they observed following results. In the case of 5 sec mean inter-
arrival time, majority of packets have a delay bigger than 15.5 ms and jitter less than 1 ms.
The longer conversations last, the more delay and jitter are observed. For 20 sec mean inter-
arrival time case, they observed that fewer packets have a delay bigger than 15.5 ms and jitter
bigger than 0.1 ms. For 375 sec mean inter-arrival time, system is not considered to be busy
and delay is very stable at 15.5 ms where jitter is almost 0. As a result, it can be said that the
more system gets busy, the more packets have bigger delay and jitter which cause decrease in
VoIP quality. Also, they measured the packet loss and observed that when the system is busy,
more packets are dropped. 5 sec case caused the most packet loss among all scenarios.
For the second experiment, they investigated the effect of background traffic load on VoIP
performance. Topology shown in Figure 3.5 has been used. They simulated 20%, 40% and
80% TCP background traffic load cases and found that when the background traffic load
increases, more packets have higher delays and jitters. Even in 80% case, delay stayed between
15 ms and 16 ms and jitter at 10 ms which are acceptable for VoIP requirements. Also they
observed a 0.3% packet loss for 80% load case. From this experiment, it can be said that when
the background TCP traffic load is under 80%, VoIP quality is tolerable for this topology.
25
CHAPTER 4
VoIP EVALUATION WITH SIMULATION
In this chapter, we perform an evaluation of the VoIP application. We aim to examine the
VoIP performance by simulating different topologies. These topologies and its parameters are
selected considering the previous works and literature. Firstly, we ran simulations under ns-2
network simulation tool because of the fact that it is the most used free network tool in the
literature and there are not much studies about simulation of the VoIP application in wired
network topologies by using ns-2. After that, we aim to perform a simulation of VoIP
application in larger topologies by another simulation tool, AABGS due to its large scale
network and protocol support. Hence, our objective is observing the performance of VoIP in
more crowded networks and evaluating its results under different topologies.
4.1 VoIP Evaluation under Ns-2
We created a number of different scenarios by varying node number, background traffic,
component properties and simulation parameters. Table 4.1 shows the properties of examined
scenarios in this part. We adapted these scenarios from the previous VoIP works. We aimed
to observe the changes in the characteristics of VoIP performance metrics (delay, jitter,
throughput and packet loss) by comparing the base and adjusted scenarios. Further information
and reason for selection of each scenario are given in the related parts.
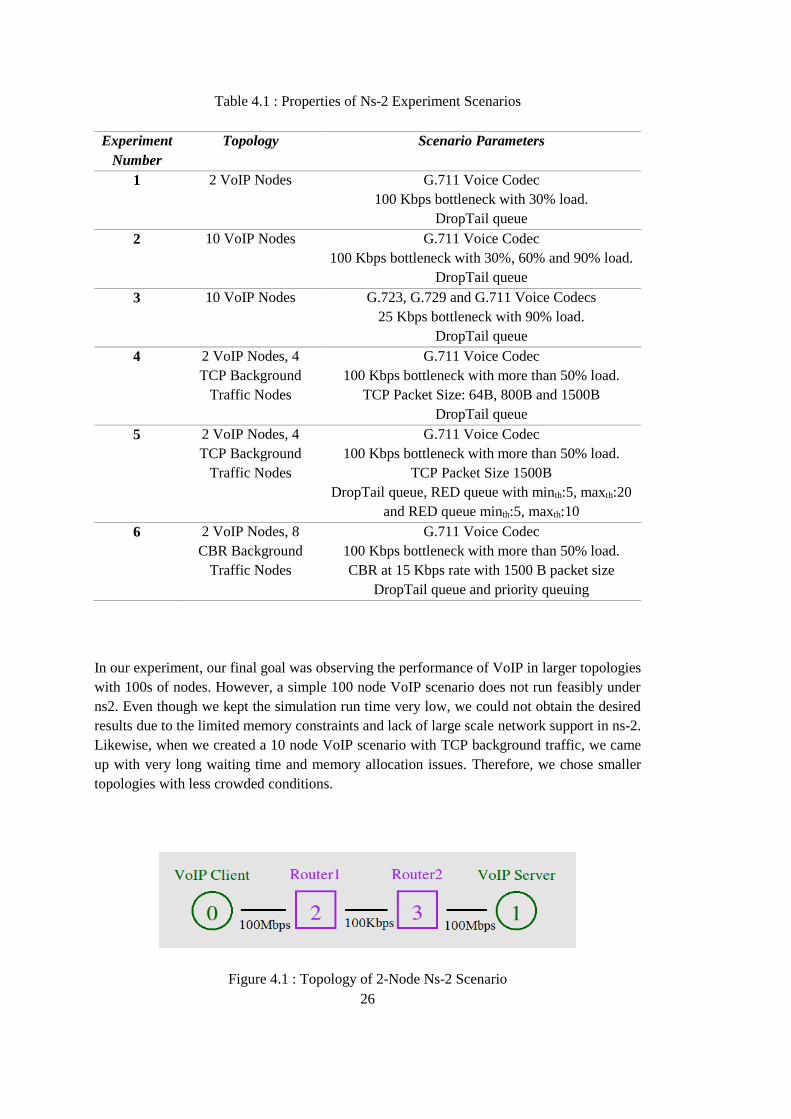
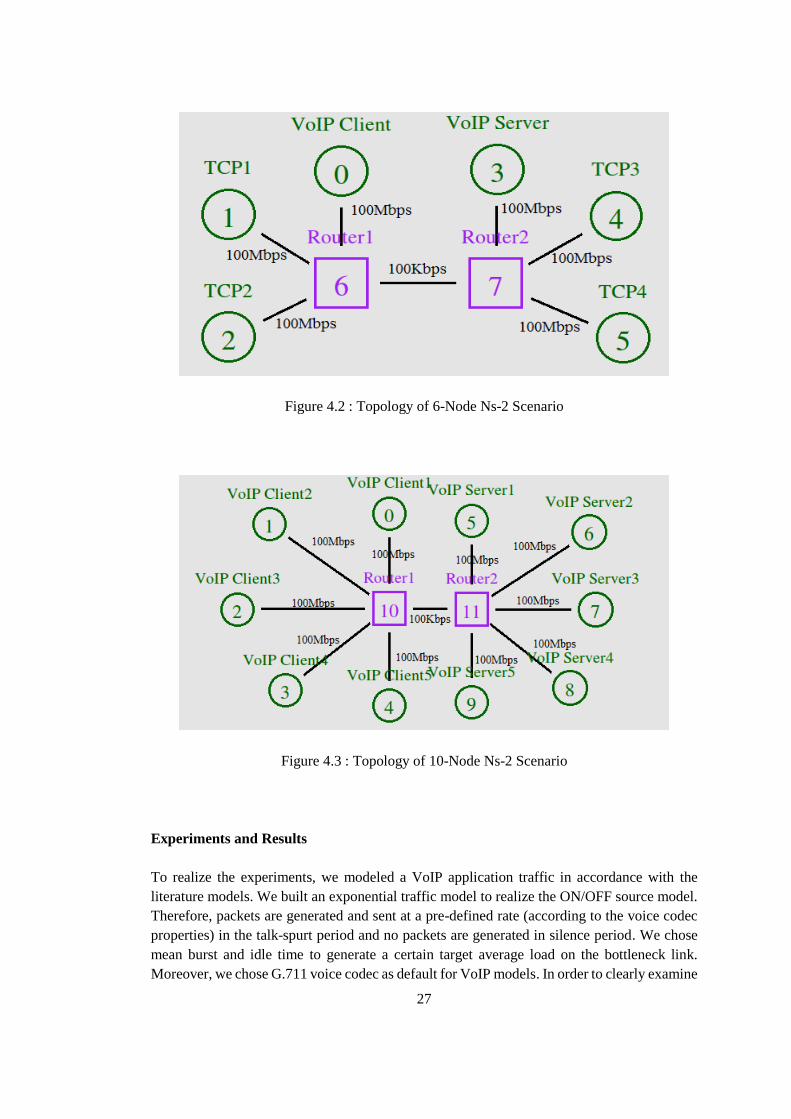
Firstly, we used a simple two-node VoIP topology to build a base model as seen in Figure 4.1.
We used two routers and 100 Mbps Ethernet links (with 2 ms propagation delay, DropTail
(First In First Out - FIFO) queue as default) to connect end nodes to routers. We created a 6-
node topology as seen in Figure 4.2 for VoIP performance with TCP background. Also, we
used a 10-node topology as seen in Figure 4.3 to investigate more crowded VoIP traffic
scenarios. In all these topologies we aim to see the effects of the network congestion and the
resulting queuing by introducing a low capacity bottleneck link between the routers. The links
of the client nodes are chosen to be high capacity to eliminate any queuing delays on these
links.
26
Table 4.1 : Properties of Ns-2 Experiment Scenarios
Experiment
Number
Topology Scenario Parameters
1 2 VoIP Nodes G.711 Voice Codec
100 Kbps bottleneck with 30% load.
DropTail queue
2 10 VoIP Nodes G.711 Voice Codec
100 Kbps bottleneck with 30%, 60% and 90% load.
DropTail queue
3 10 VoIP Nodes G.723, G.729 and G.711 Voice Codecs
25 Kbps bottleneck with 90% load.
DropTail queue
4 2 VoIP Nodes, 4
TCP Background
Traffic Nodes
G.711 Voice Codec
100 Kbps bottleneck with more than 50% load.
TCP Packet Size: 64B, 800B and 1500B
DropTail queue
5 2 VoIP Nodes, 4
TCP Background
Traffic Nodes
G.711 Voice Codec
100 Kbps bottleneck with more than 50% load.
TCP Packet Size 1500B
DropTail queue, RED queue with minth:5, maxth:20
and RED queue minth:5, maxth:10
6 2 VoIP Nodes, 8
CBR Background
Traffic Nodes
G.711 Voice Codec
100 Kbps bottleneck with more than 50% load.
CBR at 15 Kbps rate with 1500 B packet size
DropTail queue and priority queuing
In our experiment, our final goal was observing the performance of VoIP in larger topologies
with 100s of nodes. However, a simple 100 node VoIP scenario does not run feasibly under
ns2. Even though we kept the simulation run time very low, we could not obtain the desired
results due to the limited memory constraints and lack of large scale network support in ns-2.
Likewise, when we created a 10 node VoIP scenario with TCP background traffic, we came
up with very long waiting time and memory allocation issues. Therefore, we chose smaller
topologies with less crowded conditions.
Figure 4.1 : Topology of 2-Node Ns-2 Scenario
27
Figure 4.2 : Topology of 6-Node Ns-2 Scenario
Figure 4.3 : Topology of 10-Node Ns-2 Scenario
Experiments and Results
To realize the experiments, we modeled a VoIP application traffic in accordance with the
literature models. We built an exponential traffic model to realize the ON/OFF source model.
Therefore, packets are generated and sent at a pre-defined rate (according to the voice codec
properties) in the talk-spurt period and no packets are generated in silence period. We chose
mean burst and idle time to generate a certain target average load on the bottleneck link.
Moreover, we chose G.711 voice codec as default for VoIP models. In order to clearly examine

28
the effect of traffic characteristics, we provided a high traffic load with using a bottleneck link
for all scenarios. After running all of the experiments, we obtained output files which contain
the information about generated packets in simulation time. We used trace file programs
named “tracegraph” and “ns-2 visual trace analyzer” to obtain performance graphs from long
output files and then we analyzed them to obtain the average delay and jitter values for the
VoIP traffic results and percentage throughputs. We only took the network delays into account
in the end-to-end delay calculations (transmission, propagation and queuing delay). Delay,
jitter, throughput and loss ratio metrics are obtained from the information that is collected from
packets of one traffic source due to the fact that all the same traffic sources show the similar
characteristics. The queuing delay frequency distributions that we present below are calculated
from the output trace. In these plots, transmission and propagation delays are extracted from
the total delay values. We aimed to point out the queuing delay values which are suffered by
most of the VoIP packets at that scenario. Moreover, we calculated confidence intervals for
all average end-to-end delay and jitter values. To this end, we calculated the mean and standard
deviation values from transmitted packets of the one VoIP source. In the tables, n denotes the
number of samples, g denotes the confidence level and ∆ denotes the confidence interval.
1) In the first experiment, we examined a two node VoIP communication which can be
considered as a base model for the rest of the experiments. We used the topology seen
in Figure 4.1. This topology consists of one VoIP client, one VoIP server and two
routers with a 100 Kbps bottleneck link. We used G.711 voice codec scheme for the
experiment which has a 64 Kbps data rate and 160 B packet size. We started the
experiment with 30% loaded bottleneck link and increased the load to observe the
change in the metrics. As it is expected due to the lack of any other traffic, we observed
that the end-to-end delay only consists of propagation and transmission delays for all
load cases. Propagation delays are 2 ms for three links (6 ms total) and we observed
the transmission delay as 12.8 ms which can be calculated by dividing packet length
(160 Byte) to link capacity (100 Kbps, delay of 100 Mbps links are so small, therefore
they are neglected). We did not observe any jitter or packet loss.
2) In the second experiment, we aimed to compare different bottleneck load conditions
on VoIP performance metrics. We examined a 10 node VoIP topology as shown in
Figure 4.2. This topology consists of 5 VoIP clients and 5 VoIP server nodes. We used
G.711 voice codec parameters (64 Kbps sending rate, 160 Byte packet size). We ran
the simulation for 1000 seconds to observe stable results. We performed three
different bottleneck link conditions. First, we generated a 30% traffic load on the
bottleneck (6% traffic load for each VoIP source). To provide that we configured the
mean burst and idle time parameters of exponential VoIP traffic sources appropriately.
We set mean burst time to 60 ms and mean idle time to 580 ms to obtain a 6 Kbps
throughput from each VoIP source. After, we generated a 60% traffic load on the
bottleneck (12% traffic load for each VoIP source). To provide that we set mean burst
time to 120 ms and mean idle time to 520 ms to obtain a 12 Kbps throughput from
each VoIP source. Lastly, we generated a 90% traffic load on the bottleneck (18%
traffic load for each VoIP source). To provide that we set mean burst time to 180 ms
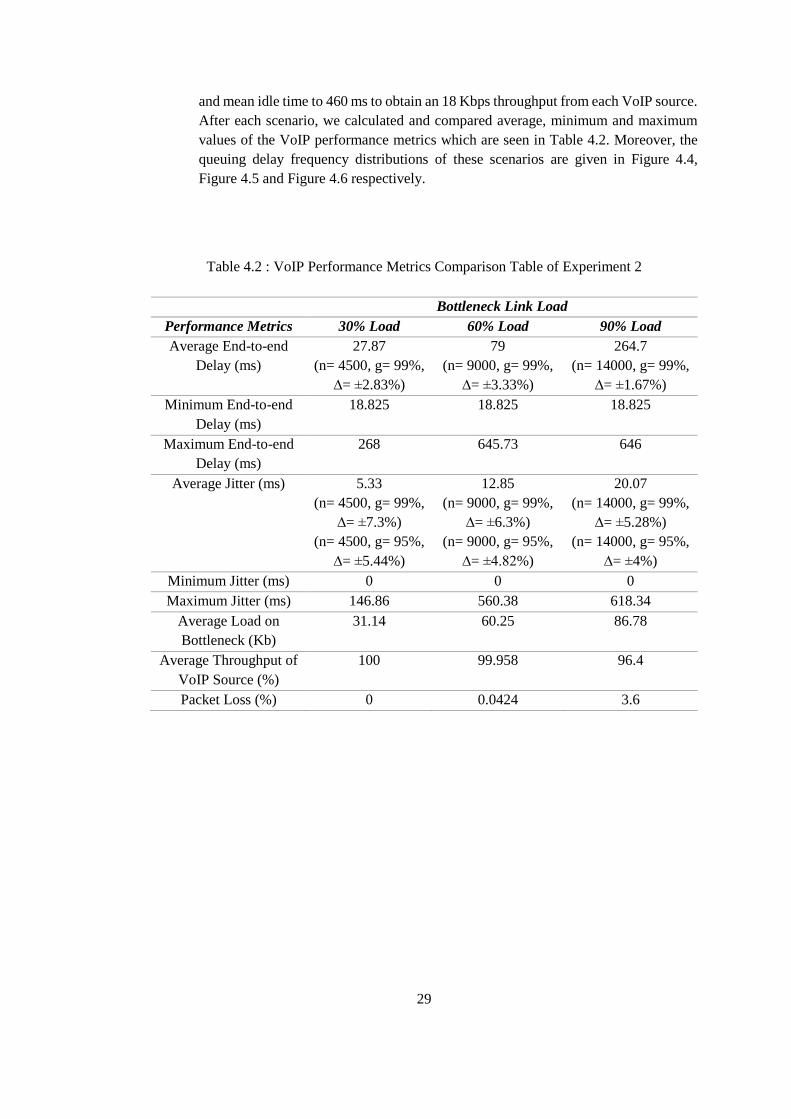
29
and mean idle time to 460 ms to obtain an 18 Kbps throughput from each VoIP source.
After each scenario, we calculated and compared average, minimum and maximum
values of the VoIP performance metrics which are seen in Table 4.2. Moreover, the
queuing delay frequency distributions of these scenarios are given in Figure 4.4,
Figure 4.5 and Figure 4.6 respectively.
Table 4.2 : VoIP Performance Metrics Comparison Table of Experiment 2
Bottleneck Link Load
Performance Metrics 30% Load 60% Load 90% Load
Average End-to-end
Delay (ms)
27.87
(n= 4500, g= 99%,
∆= ±2.83%)
79
(n= 9000, g= 99%,
∆= ±3.33%)
264.7
(n= 14000, g= 99%,
∆= ±1.67%)
Minimum End-to-end
Delay (ms)
18.825 18.825 18.825
Maximum End-to-end
Delay (ms)
268 645.73 646
Average Jitter (ms) 5.33
(n= 4500, g= 99%,
∆= ±7.3%)
(n= 4500, g= 95%,
∆= ±5.44%)
12.85
(n= 9000, g= 99%,
∆= ±6.3%)
(n= 9000, g= 95%,
∆= ±4.82%)
20.07
(n= 14000, g= 99%,
∆= ±5.28%)
(n= 14000, g= 95%,
∆= ±4%)
Minimum Jitter (ms) 0 0 0
Maximum Jitter (ms) 146.86 560.38 618.34
Average Load on
Bottleneck (Kb)
31.14 60.25 86.78
Average Throughput of
VoIP Source (%)
100 99.958 96.4
Packet Loss (%) 0 0.0424 3.6

30
Figure 4.4 : 30% Load Scenario Queuing Delay Frequency Distribution of Experiment 2
Figure 4.5 : 60% Load Scenario Queuing Delay Frequency Distribution of Experiment 2
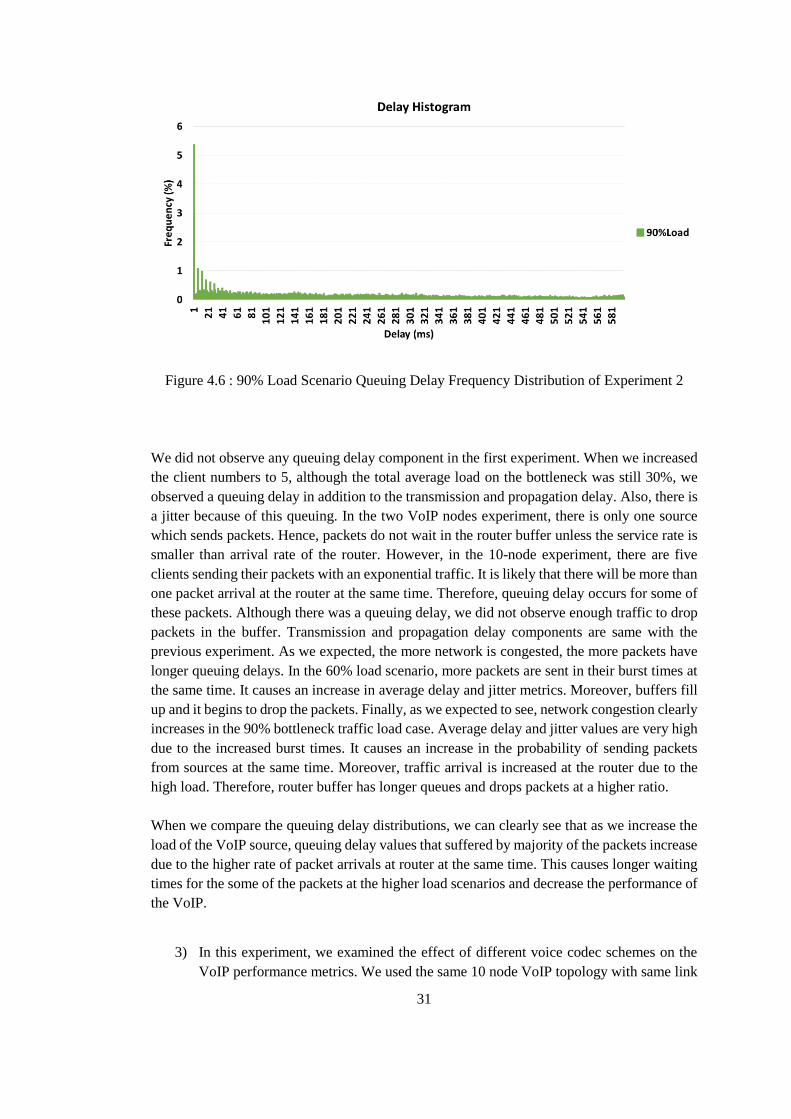
31
Figure 4.6 : 90% Load Scenario Queuing Delay Frequency Distribution of Experiment 2
We did not observe any queuing delay component in the first experiment. When we increased
the client numbers to 5, although the total average load on the bottleneck was still 30%, we
observed a queuing delay in addition to the transmission and propagation delay. Also, there is
a jitter because of this queuing. In the two VoIP nodes experiment, there is only one source
which sends packets. Hence, packets do not wait in the router buffer unless the service rate is
smaller than arrival rate of the router. However, in the 10-node experiment, there are five
clients sending their packets with an exponential traffic. It is likely that there will be more than
one packet arrival at the router at the same time. Therefore, queuing delay occurs for some of
these packets. Although there was a queuing delay, we did not observe enough traffic to drop
packets in the buffer. Transmission and propagation delay components are same with the
previous experiment. As we expected, the more network is congested, the more packets have
longer queuing delays. In the 60% load scenario, more packets are sent in their burst times at
the same time. It causes an increase in average delay and jitter metrics. Moreover, buffers fill
up and it begins to drop the packets. Finally, as we expected to see, network congestion clearly
increases in the 90% bottleneck traffic load case. Average delay and jitter values are very high
due to the increased burst times. It causes an increase in the probability of sending packets
from sources at the same time. Moreover, traffic arrival is increased at the router due to the
high load. Therefore, router buffer has longer queues and drops packets at a higher ratio.
When we compare the queuing delay distributions, we can clearly see that as we increase the
load of the VoIP source, queuing delay values that suffered by majority of the packets increase
due to the higher rate of packet arrivals at router at the same time. This causes longer waiting
times for the some of the packets at the higher load scenarios and decrease the performance of
the VoIP.
3) In this experiment, we examined the effect of different voice codec schemes on the
VoIP performance metrics. We used the same 10 node VoIP topology with same link
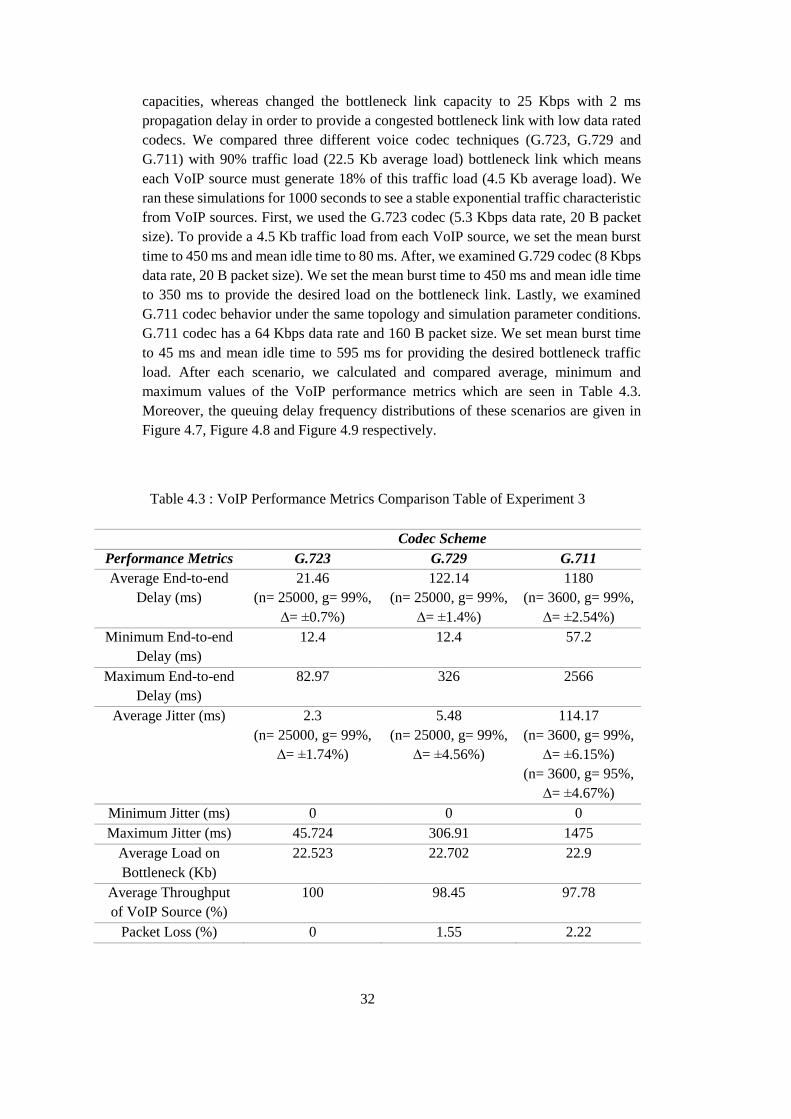
32
capacities, whereas changed the bottleneck link capacity to 25 Kbps with 2 ms
propagation delay in order to provide a congested bottleneck link with low data rated
codecs. We compared three different voice codec techniques (G.723, G.729 and
G.711) with 90% traffic load (22.5 Kb average load) bottleneck link which means
each VoIP source must generate 18% of this traffic load (4.5 Kb average load). We
ran these simulations for 1000 seconds to see a stable exponential traffic characteristic
from VoIP sources. First, we used the G.723 codec (5.3 Kbps data rate, 20 B packet
size). To provide a 4.5 Kb traffic load from each VoIP source, we set the mean burst
time to 450 ms and mean idle time to 80 ms. After, we examined G.729 codec (8 Kbps
data rate, 20 B packet size). We set the mean burst time to 450 ms and mean idle time
to 350 ms to provide the desired load on the bottleneck link. Lastly, we examined
G.711 codec behavior under the same topology and simulation parameter conditions.
G.711 codec has a 64 Kbps data rate and 160 B packet size. We set mean burst time
to 45 ms and mean idle time to 595 ms for providing the desired bottleneck traffic
load. After each scenario, we calculated and compared average, minimum and
maximum values of the VoIP performance metrics which are seen in Table 4.3.
Moreover, the queuing delay frequency distributions of these scenarios are given in
Figure 4.7, Figure 4.8 and Figure 4.9 respectively.
Table 4.3 : VoIP Performance Metrics Comparison Table of Experiment 3
Codec Scheme
Performance Metrics G.723 G.729 G.711
Average End-to-end
Delay (ms)
21.46
(n= 25000, g= 99%,
∆= ±0.7%)
122.14
(n= 25000, g= 99%,
∆= ±1.4%)
1180
(n= 3600, g= 99%,
∆= ±2.54%)
Minimum End-to-end
Delay (ms)
12.4 12.4 57.2
Maximum End-to-end
Delay (ms)
82.97 326 2566
Average Jitter (ms) 2.3
(n= 25000, g= 99%,
∆= ±1.74%)
5.48
(n= 25000, g= 99%,
∆= ±4.56%)
114.17
(n= 3600, g= 99%,
∆= ±6.15%)
(n= 3600, g= 95%,
∆= ±4.67%)
Minimum Jitter (ms) 0 0 0
Maximum Jitter (ms) 45.724 306.91 1475
Average Load on
Bottleneck (Kb)
22.523 22.702 22.9
Average Throughput
of VoIP Source (%)
100 98.45 97.78
Packet Loss (%) 0 1.55 2.22
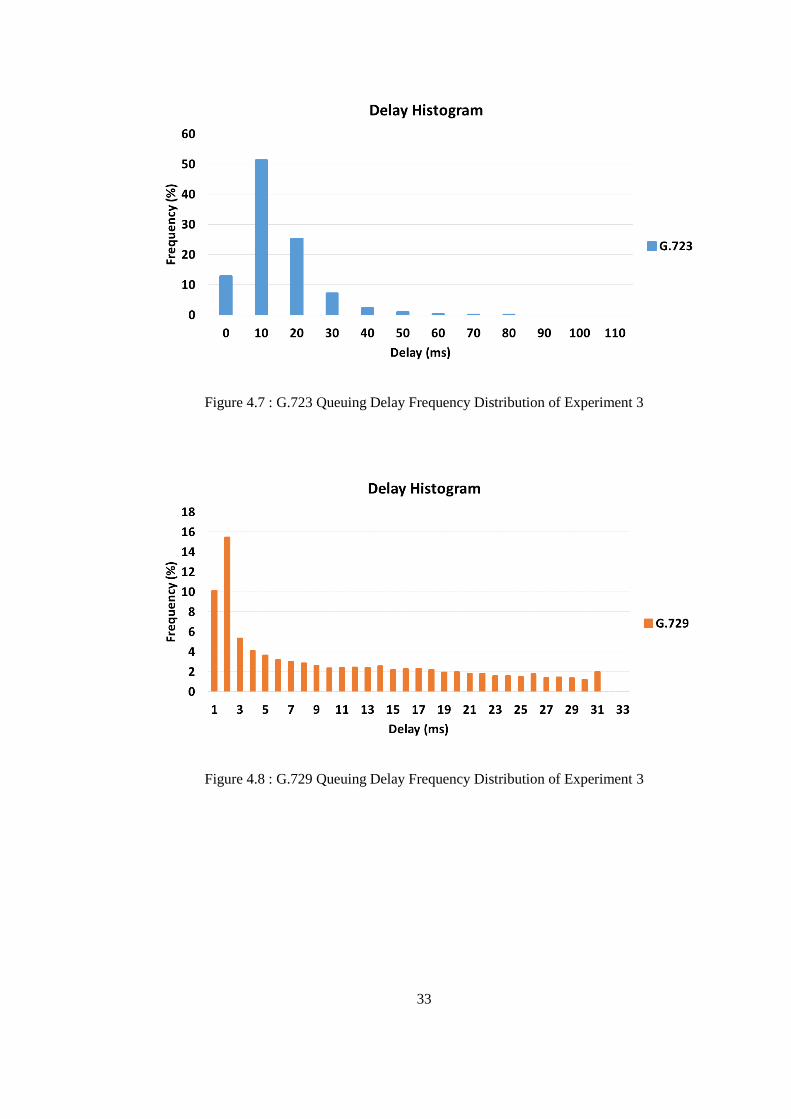
33
Figure 4.7 : G.723 Queuing Delay Frequency Distribution of Experiment 3
Figure 4.8 : G.729 Queuing Delay Frequency Distribution of Experiment 3

34
Figure 4.9 : G.711 Queuing Delay Frequency Distribution of Experiment 3
Results show that G.711 voice codec compresses the voice the least among all examined voice
codec techniques. Due to the fact that it has the highest data rate, it generates very high traffic
load in comparison with the other codecs. Therefore, as it is clearly seen from the plots, it does
not provide good voice quality conditions for this topology. Buffers are highly loaded for
G.711 whereas there were only a few packets in the queues for G.723. Thus, voice packets
suffer from longer queuing delays due to the long waiting times at buffers. Also, its longer
packet size cause higher transmission delays and longer waiting times at the buffers for other
packets. As a result, it can be said that G.711 voice codec will not be a proper choice for low
bandwidth congested networks due to its low VoIP performance. Also, G.729 performs better
than G.711 but worse than G.723. G.729 codec generates more packets than G.723 with same
packet size. Thus, this instantaneous packet generation at each burst period causes higher
congestion on the network and makes the voice packets wait in the queue for longer times.
Moreover, this congestion causes higher packet dropping ratio. Because of the fact that, it
provides a good average end-to-end delay and jitter values without any packet drops, G.723
voice codec can be considered as a good choice for this topology. Transmission delay for
G.711 is 160x8/25000 = 51.2 ms whereas 20x8/25000 = 6.4 ms for G.723 and G.729, also
total propagation delay is 6 ms for all scenarios. These are not very big numbers when
compared with queuing delay, however for a high voice quality milliseconds are very
important as well.
When we compare the queuing delay frequency distribution plots, we can see that majority of
G.723 codec packets have a very small delay value in comparison with other codecs. Majority
of G.729 codec packets show similar results with G.723 but due to the increase in load packets
suffer from queuing delay approximately up to 330 ms. G.711 codec which has a data rate and
packet size eight times more than G.729 cause packets suffer from queuing delays up to 2.5
seconds due to the long waiting times in the queues.
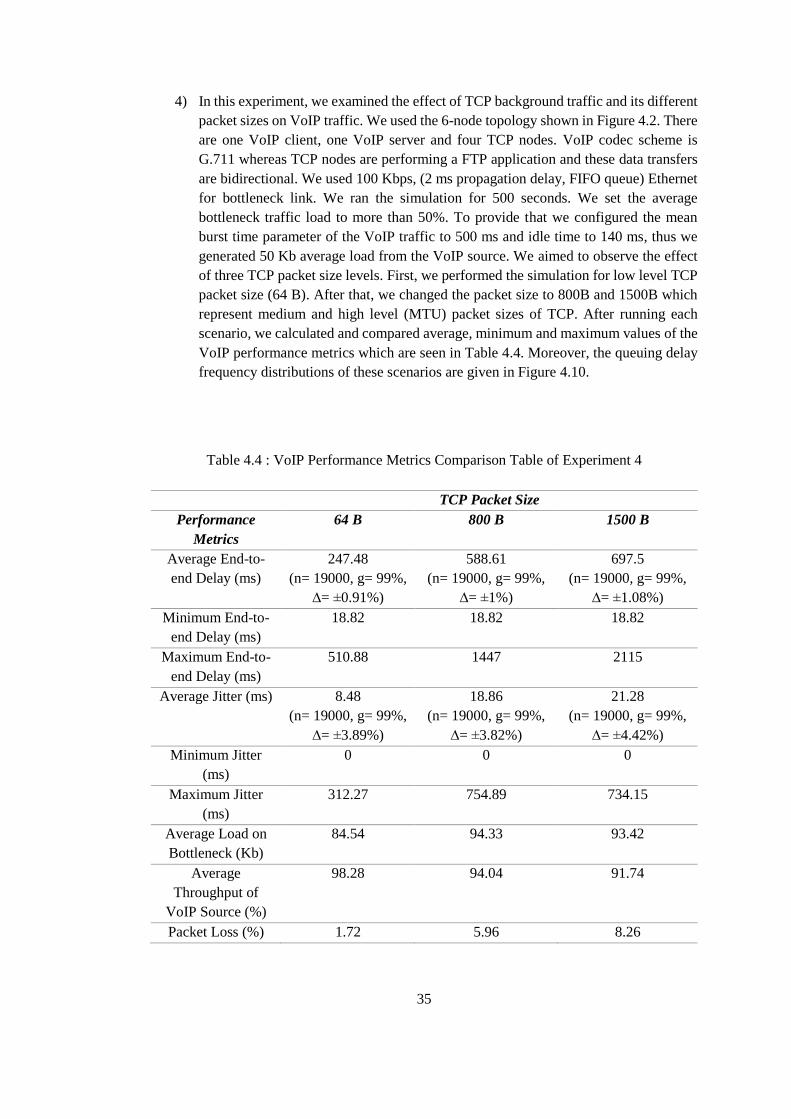
35
4) In this experiment, we examined the effect of TCP background traffic and its different
packet sizes on VoIP traffic. We used the 6-node topology shown in Figure 4.2. There
are one VoIP client, one VoIP server and four TCP nodes. VoIP codec scheme is
G.711 whereas TCP nodes are performing a FTP application and these data transfers
are bidirectional. We used 100 Kbps, (2 ms propagation delay, FIFO queue) Ethernet
for bottleneck link. We ran the simulation for 500 seconds. We set the average
bottleneck traffic load to more than 50%. To provide that we configured the mean
burst time parameter of the VoIP traffic to 500 ms and idle time to 140 ms, thus we
generated 50 Kb average load from the VoIP source. We aimed to observe the effect
of three TCP packet size levels. First, we performed the simulation for low level TCP
packet size (64 B). After that, we changed the packet size to 800B and 1500B which
represent medium and high level (MTU) packet sizes of TCP. After running each
scenario, we calculated and compared average, minimum and maximum values of the
VoIP performance metrics which are seen in Table 4.4. Moreover, the queuing delay
frequency distributions of these scenarios are given in Figure 4.10.
Table 4.4 : VoIP Performance Metrics Comparison Table of Experiment 4
TCP Packet Size
Performance
Metrics
64 B 800 B 1500 B
Average End-to-
end Delay (ms)
247.48
(n= 19000, g= 99%,
∆= ±0.91%)
588.61
(n= 19000, g= 99%,
∆= ±1%)
697.5
(n= 19000, g= 99%,
∆= ±1.08%)
Minimum End-to-
end Delay (ms)
18.82 18.82 18.82
Maximum End-to-
end Delay (ms)
510.88 1447 2115
Average Jitter (ms) 8.48
(n= 19000, g= 99%,
∆= ±3.89%)
18.86
(n= 19000, g= 99%,
∆= ±3.82%)
21.28
(n= 19000, g= 99%,
∆= ±4.42%)
Minimum Jitter
(ms)
0 0 0
Maximum Jitter
(ms)
312.27 754.89 734.15
Average Load on
Bottleneck (Kb)
84.54 94.33 93.42
Average
Throughput of
VoIP Source (%)
98.28 94.04 91.74
Packet Loss (%) 1.72 5.96 8.26

36
Table 4.4 (Continued)
TCP Packet Size
Performance
Metrics
64 B 800 B 1500 B
Average
Throughput of one
TCP Source (%)
96.69 91.585 88.2
Packet Loss of One
TCP Source (%)
3.31 8.415 11.8
Figure 4.10 : Queuing Delay Frequency Distribution of Experiment 4
In the first scenario, we examined a very small TCP packet size. We observed that for
approximately same bottleneck loads, smaller VoIP topology with TCP background shows
worse characteristics when compared with the 10-node VoIP topology. One reason causes the
bad characteristics is extra traffic of 40 Bytes acknowledgement (ACK) packets transferred
for each TCP packet. While UDP packets (VoIP) do not use any retransmission control
mechanisms, TCP connection uses Automatic Repeat Requests (ARQ) for all damaged and
lost packets. Retransmission of these packets causes more congestion on the links, therefore,
there will be additional delays, jitters and losses for VoIP packets. As we increased the packet
size of the TCP, VoIP packets suffered from bigger delay and jitter values. In addition to the
ACK packet transmissions and retransmission mechanism, longer packets occupy more
storage in the buffers, therefore VoIP packets wait longer times in the queue or likely to be
dropped more. We can see that average load on the bottleneck is increased with bigger TCP
packet size. When the traffic load increases, there will be more congestion on the routers and
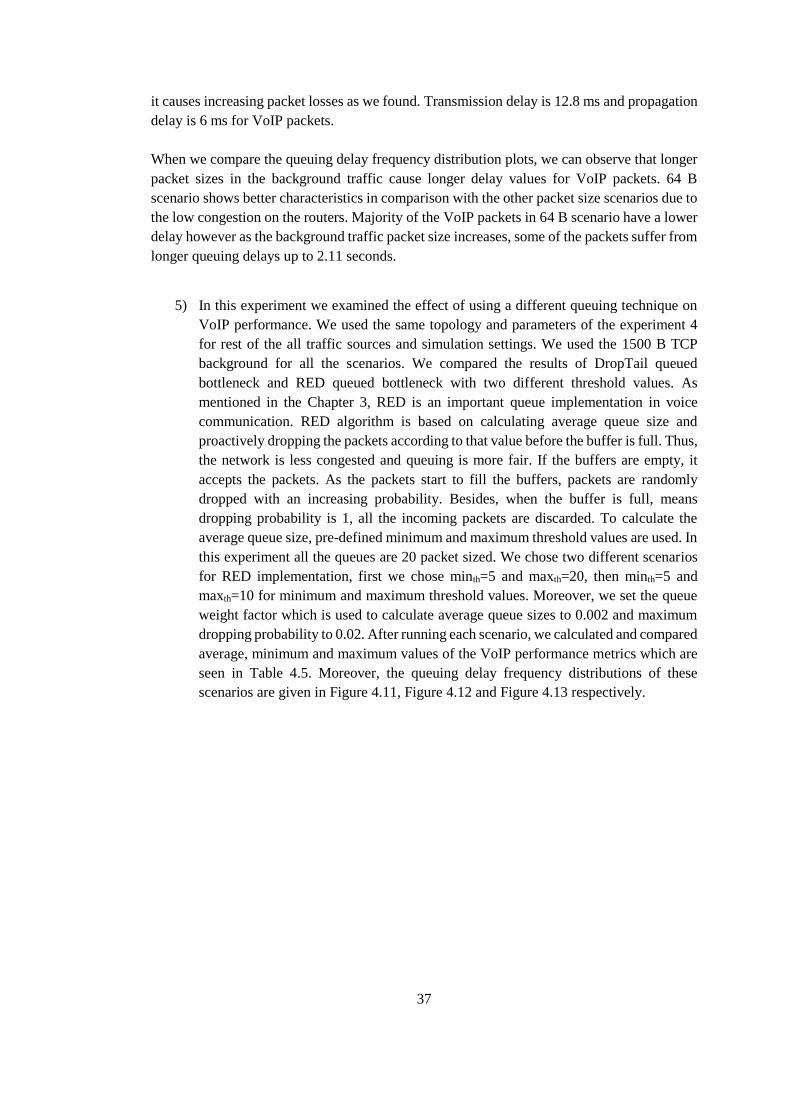
37
it causes increasing packet losses as we found. Transmission delay is 12.8 ms and propagation
delay is 6 ms for VoIP packets.
When we compare the queuing delay frequency distribution plots, we can observe that longer
packet sizes in the background traffic cause longer delay values for VoIP packets. 64 B
scenario shows better characteristics in comparison with the other packet size scenarios due to
the low congestion on the routers. Majority of the VoIP packets in 64 B scenario have a lower
delay however as the background traffic packet size increases, some of the packets suffer from
longer queuing delays up to 2.11 seconds.
5) In this experiment we examined the effect of using a different queuing technique on
VoIP performance. We used the same topology and parameters of the experiment 4
for rest of the all traffic sources and simulation settings. We used the 1500 B TCP
background for all the scenarios. We compared the results of DropTail queued
bottleneck and RED queued bottleneck with two different threshold values. As
mentioned in the Chapter 3, RED is an important queue implementation in voice
communication. RED algorithm is based on calculating average queue size and
proactively dropping the packets according to that value before the buffer is full. Thus,
the network is less congested and queuing is more fair. If the buffers are empty, it
accepts the packets. As the packets start to fill the buffers, packets are randomly
dropped with an increasing probability. Besides, when the buffer is full, means
dropping probability is 1, all the incoming packets are discarded. To calculate the
average queue size, pre-defined minimum and maximum threshold values are used. In
this experiment all the queues are 20 packet sized. We chose two different scenarios
for RED implementation, first we chose minth=5 and maxth=20, then minth=5 and
maxth=10 for minimum and maximum threshold values. Moreover, we set the queue
weight factor which is used to calculate average queue sizes to 0.002 and maximum
dropping probability to 0.02. After running each scenario, we calculated and compared
average, minimum and maximum values of the VoIP performance metrics which are
seen in Table 4.5. Moreover, the queuing delay frequency distributions of these
scenarios are given in Figure 4.11, Figure 4.12 and Figure 4.13 respectively.
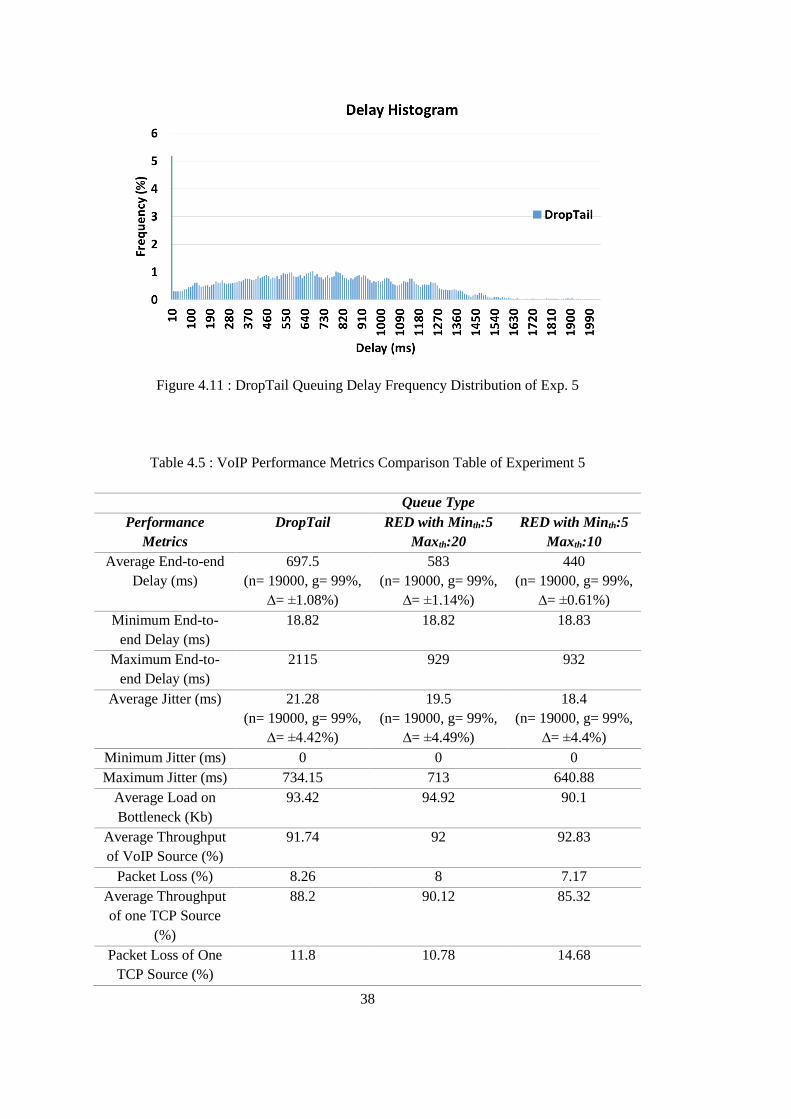
38
Figure 4.11 : DropTail Queuing Delay Frequency Distribution of Exp. 5
Table 4.5 : VoIP Performance Metrics Comparison Table of Experiment 5
Queue Type
Performance
Metrics
DropTail RED with Minth:5
Maxth:20
RED with Minth:5
Maxth:10
Average End-to-end
Delay (ms)
697.5
(n= 19000, g= 99%,
∆= ±1.08%)
583
(n= 19000, g= 99%,
∆= ±1.14%)
440
(n= 19000, g= 99%,
∆= ±0.61%)
Minimum End-to-
end Delay (ms)
18.82 18.82 18.83
Maximum End-to-
end Delay (ms)
2115 929 932
Average Jitter (ms) 21.28
(n= 19000, g= 99%,
∆= ±4.42%)
19.5
(n= 19000, g= 99%,
∆= ±4.49%)
18.4
(n= 19000, g= 99%,
∆= ±4.4%)
Minimum Jitter (ms) 0 0 0
Maximum Jitter (ms) 734.15 713 640.88
Average Load on
Bottleneck (Kb)
93.42 94.92 90.1
Average Throughput
of VoIP Source (%)
91.74 92 92.83
Packet Loss (%) 8.26 8 7.17
Average Throughput
of one TCP Source
(%)
88.2 90.12 85.32
Packet Loss of One
TCP Source (%)
11.8 10.78 14.68

39
Figure 4.12 : RED (Minth:5, Maxth:20) Queuing Delay Frequency Distribution of Exp. 5
Figure 4.13 : RED (Minth:5, Maxth:10) Queuing Delay Frequency Distribution of Exp. 5
As it can be seen from the results table, using RED queue implementation provides better
performance metrics when compared with DropTail queue. Because of its dropping algorithm,
packet drops increase as the threshold range gets smaller. Smaller threshold range means,
average queue size of the buffer is smaller and packet dropping probability is higher in this
case. Moreover, we can see from the lower average delay and jitter values that, packet sending
is more fair for RED queuing rather than the DropTail. Due to the fact that packets are dropped
randomly instead of drops from tail, VoIP packets wait less for departure of long TCP packets.
Thus, VoIP throughput increases and TCP throughput decreases as the threshold range of RED

40
implementation gets smaller. Transmission and propagation delays are same with the
experiment 4.
When we analyze the queuing delay histograms, we can clearly see that implementing an
active queuing management like RED provides lower delays for majority of the packets. There
are some packets that suffer a 2 seconds delay in the DropTail scenario whereas in the RED
scenarios highest delay is 0.93 seconds. As the threshold range gets smaller, majority of
packets have lower delays because of the fact that dropping probability is higher and there will
be less packets to wait in the queue. In our experiment, although we observed that smaller
threshold provides lower queuing delays, our results are not very different due to the limited
queue sizes. The effect of small range threshold can be more clearly seen with longer queue
capacities.
6) In this experiment, we examined the effect of priority level on VoIP performance. As
we mentioned in the Chapter 3, it is important to deliver VoIP packets fast and safely
for some organizations. To simulate this feature, we used class based queuing (CBQ)
implementation of ns-2. In this method, special bandwidth allocations, different delays
and priority levels can be assigned to the flows. When a high priority packets comes,
CBQ puts that packets in front of the queue instead of tail. Thus, higher priority
packets never suffer from long delays or packet losses. We used 10-node topology
with 100 Kbps bottleneck link as shown in Figure 4.3. We used one VoIP client, one
VoIP source and eight background nodes. These background nodes generate constant
bit rate (CBR) traffic at 30 Kbps with 1500 B packet size. We set the VoIP source
parameters in accordance with the G.711 codec as to generate 5 Kb VoIP traffic (mean
burst time 50 ms, mean idle time 590 ms). After running each scenario, we calculated
and compared average, minimum and maximum values of the VoIP performance
metrics which are seen in Table 4.6. Moreover, the queuing delay frequency
distributions of these scenarios are given in Figure 4.14.
Table 4.6 : VoIP Performance Metrics Comparison Table of Experiment 6
Queue Type
Performance Metrics Non-CBQ CBQ
Average End-to-end Delay (ms) 2525
(n= 3200, g= 99%,
∆= ±0.57%)
53.68
(n= 4300, g= 99%,
∆= ±1.66%)
Minimum End-to-end Delay (ms) 125.244 18.82
Maximum End-to-end Delay (ms) 3140 96.8
Average Jitter (ms) 79.3
(n= 3200, g= 99%,
∆= ±6.01%)
(n= 3200, g= 95%,
∆= ±4.57%)
17.8
(n= 4300, g= 99%,
∆= ±4.19%)
Minimum Jitter (ms) 0 0

41
Table 4.6 (Continued)
Queue Type
Performance Metrics Non-CBQ CBQ
Maximum Jitter (ms) 613.57 78.17
Average Load on Bottleneck (Kb) 99.94 99.92
Average Throughput of VoIP Source (%) 74.36% 100%
Packet Loss (%) 25.64% 0
Average Throughput of one CBR Source
(%)
92.1% 85.6%
Packet Loss of One CBR Source (%) 7.9% 14.4%
Figure 4.14 : Queuing Delay Frequency Distribution of Experiment 6
When we compare the performance metrics of VoIP packets, we can clearly see that
implementing a priority based queuing plays a big role on the voice traffic. CBQ scenario has
much more better characteristics than non-CBQ scenario due to the increased priority of the
VoIP packets. We did not see an important queuing delay and jitter due to the fact that as soon
as VoIP packets come to the buffer, instead of waiting the whole packet transmission in the
queue, they are put in front of the queue and they only wait for the current transmission of the
packet. Thus, they’re never dropped and packet loss is zero. Transmission delay and
propagation delay are same with the experiment 4.
When the queuing delay frequency distributions are compared we can see a big difference
between two scenarios. Majority of the packets have no delays due to the fact that they don’t
wait unnecessarily in the queues in CBQ scenario whereas most of the packets have longer
queuing delays up to 3 seconds because of the long CBR packets waiting in the queue in the
non-CBQ scenario.
42
Comments
To conclude we can say that, different topologies with different traffic type applications and
component parameters have a big effect on VoIP characteristics. Due to the limits of ns-2 tool,
we could not extend our networks to very big scales, but observed the congestion cases with
the help of bottleneck scenarios. There will be certain change in these characteristics for the
VoIP evaluation in large scaled (100s or 1000s of nodes) networks.
Firstly we examined the two node topology as a base experiment. After, we examined 10 node
topologies for different bottleneck traffic loads. We found that exponential traffic source
parameters have an important role on VoIP characteristics. As we increased the load, we
observed more congestion on the bottleneck link which causes worse VoIP characteristics. As
previously mentioned in Chapter 3, VoIP performance metrics have some limitations for good
voice quality. According to these values, we can say that 30% and 60% load scenarios are
acceptable and provide a good voice quality whereas 90% load scenario is not convenient for
that topology.
After that, we examined the effect of three different voice codecs on VoIP performance. We
observed that, as the compression rate of the voice codec gets higher, performance of VoIP
becomes better. It can be said that, G.723 voice codec, which has a 5.3 Kbps data rate, is the
most convenient for large scaled and congested VoIP networks. We observed that high
compressing G.723 and G.729 codecs are more appropriate for the congested scenarios
whereas G.711 is not. However, for the high quality multimedia services, a high rate codec
use with large bandwidths should be more convenient for not to lose so much quality when
compressing the packets.
Furthermore, we examined the effect of three different packet sized TCP backgrounds on VoIP
performance. We observed that, as we increase the TCP packet size value, we higher delay
and jitter values due to the more crowded traffic. The results show that 1500 B TCP packets
affected the VoIP traffic worst. Also, we observed that packet loss ratio gets higher when the
TCP packet size increases. For a high congested background traffic, VoIP parameters should
be chosen carefully in order not to have bad voice qualities.
In the queuing management comparison experiment, we found that an active queuing
management implementation such as RED, shows better characteristics on the voice
performance. It can be said that deploying a low range threshold RED will reduce the delay
and jitter values of voice packets whereas dropping probability increases.
Lastly, we examined the effect of packet priority on VoIP performance with deploying a class
based queuing technique. When we set VoIP packets as the most important packets in the
network, they are delivered with very low delay and jitter values, also without any loss.
However, in real life networks there will be another important packets in the system and VoIP
packets will not be transmitted as well as in the simulation. Combining RED and CBQ
techniques will reduce the packet dropping probability whereas increase the performance of
the VoIP packets. Thus, best optimization for VoIP performance will be an appropriate
combination of these implementations.

43
4.2 VoIP Evaluation under AABGS
Despite the detailed simulation data provided by ns-2, it is not possible to run simulation with
large number of nodes due to the increasing number of events that slow down the execution
and consume very large amounts of memory. For example, a simple 10 node VoIP scenario
with TCP background traffic has an output data file with more than 1 million lines for 60
seconds simulation run time. It makes it impossible to collect measurements for each packet
because of the fact that ns-2 is a packet-level network simulator.
To this end, we investigated “Askeri Ağlar için Bilgi Güvenliği Simulasyonu” (AABGS),
which refers to “Information Security Simulation for Military Networks”. It is a flow-based
simulation work designed in the scope of the investigation of the network supported ability
(Ağ Destekli Yetenek – ADY), for developing technology in battle fields, threats and military
requirements [44]. It was developed by a project cooperation group that includes METU –
TSK MODSIMMER. AABGS simulation work is constructed over the simulation platform
NeSSi2 (Network Security Simulator) [45] that has been developed by Berlin Technical
University.
Flow Based Model
NeSSi2 network security simulator runs packet based, discrete event model simulations. At
each time unit (tick), it performs planned simulation events in accord with the discrete event
model. However, in the AABGS design progress, when the topologies with 1000s nodes have
been considered, it has been decided that handling all packets one by one will be difficult and
flow based model will be more helpful instead. In the flow based model, packets are not
analyzed in details one by one, instead of that flow based model considers arriving and
departing data rates of each network interface. In this kind of model, values such as these data
rates, queue length and data loss in the interface are calculated according to mathematical
expressions periodically. These expressions can be differential equations according to the used
models.
Experiment Setups with AABGS
Before starting to study with AABGS, firstly we aimed to simulate a base topology similar to
our first ns-2 experiment. To this end, we conducted a simple 2-node VoIP topology scenario
which consists of 1 VoIP client and 1 VoIP server nodes interconnecting with a router. We
selected minimum packet size as 125 B and maximum packet size as 150 B. VoIP model of
AABGS uses Generalized Pareto distribution for ON/OFF periods, we set its shape parameters
to its default values (for ON period: k=0.28, s=1.7 and OFF period: k=-0.35, s=1.2). The
packet inter-arrival times are Poisson distributed, we set the mean parameter of this
distribution to 2 as default. We chose “orta” (medium) as the traffic level to generate a medium
level source traffic. We run the simulation for 500 tick simulation times.
44
Because of the fact that, AABGS simulation does not support standard time units (seconds)
and shows delay and jitter plots in terms of its internal time units (ticks), results can be
observed only in tick units. These ticks are directly related with the event occurrences.
Therefore, we expect to see more frequent tick values in the delay plots when there are more
events. In this test procedure, we aimed to observe this delay characteristic change by adjusting
the link capacity which directly affects the event occurrences. We compared the same 2-node
topology generated with 1 Gbps and 100 Mbps Ethernet links. We kept rest of the simulation
settings and the traffic parameters exactly same in these experiments while only changed the
link capacities.
When we decreased the link capacity 10 times (from 1 Gbps to 100 Mbps), the mean service
rate is also decreased 10 times. It means, for the same arrival rate, packet service process gets
slower comparing with the packet generation in the second scenario. When the mean service
rate is decreased for same arrival rate and fixed sized packet lengths, it means less packets are
served, therefore we expect a reduced event frequency. According to that, we expected to see
more frequent event occurrence in the first scenario in comparison with the second.
Despite this large change in the link capacity, we did not observe any major difference in the
measurements of end-to-end packet delay in the unit of ticks and packet queue sizes. We only
observed changes in random event occurrence times.
Consequently, we were not able to run the VoIP traffic experiments with the large number of
nodes using AABGS project.

45
CHAPTER 5
CONCLUSION
This thesis is mainly focused on the comparative evaluation of the network simulation tools
and evaluating VoIP performance under different scenarios using ns-2. In the scope of this
study, firstly we discussed types of network simulators. We found that most of the network
simulators use discrete event simulation and packet based implementation. Next, we identified
the desirable features of a network simulator which are accuracy, analytical capability,
efficient modeling and protocol support, efficient memory use and low simulation time, ease
in use, scalability and extensibility. We determined the most frequently used network
simulators as ns-2, OMNeT++ and OPNET. After briefly mentioning about most the operation
and the use of these simulators, we compared them in terms of these features. Accordingly,
we listed the advantages and the disadvantages of the selected simulators.
Furthermore, we analyzed the most recent status of the VoIP traffic. The share of VoIP in the
overall Internet traffic is continuously increasing. Hence, it is important that the Quality of
Service provided for the VoIP applications should fulfill certain requirements. To this end, we
introduced the VoIP performance metrics such as delay, jitter, packet loss and bandwidth
together with the required values for these metrics. Furthermore, we discussed the organization
specific VoIP needs like call control capability, security, survivability, IPv6, high definition
VoIP and random early detection. After that, we investigated the common VoIP traffic models
used in literature and found that most of the previous works use a simple two state ON/OFF
model to design VoIP application. Despite different distribution profiles which define ON and
OFF state transitions such as exponential, Pareto, Weibull, Gamma and log-normal exist, our
findings show that the burst characteristics of the respective resultant VoIP traffics are similar.
Finally we investigated a number of previous studies on the VoIP evaluations to define our
experiment scenarios. We realized these scenarios under ns-2 network simulator and evaluated
the results.
We aimed to see the effects of network congestion and queuing results by introducing a low
capacity bottleneck link between routers. We observed that VoIP performance is degraded
badly with highly loaded bottleneck topologies. In addition, we investigated the effect of
different voice codec schemes on VoIP performance. We can conclude that, codecs with
higher compression rates perform better in congested networks. Moreover, we examined the
effect of the background traffic on VoIP. To this end, we employed TCP traffic with three
different packet sizes as background traffic. Our results show that bigger TCP packet sizes
degrade the performance of VoIP in terms of delay, jitter and packet loss metrics.
Subsequently, we examined the effect of the active queuing management on VoIP
performance by deploying a RED queue in the bottleneck link. We observed that RED

46
performed better than DropTail queue in terms of delay and jitter, however packet loss ratio
became higher as we decreased the threshold range of the queue. Finally, we examined the
effect of priority queuing by deploying a class based queue. We observed that high priority
VoIP packets do not suffer from longer delays and any packet losses. Thus, to provide a better
VoIP service quality and organization specific needs choosing the appropriate codecs and
employing buffer management schemes such as active queuing and priority queuing are very
effective.
47
REFERENCES
[1] M. A. Miller, “Voice over IP Technologies: Building the Converged Network”, John Wiley
& Sons, Inc., 2002.
[2] H.Su, C.Wu and M.Yang, “Optimal Quality Adaptation for SLA-Based VoIP Services over
DiffServ/MPLS Networks”, International Conference on New Trends in Information and
Service Science, pp. 734-739, 2009.
[3] J. L. J. Magraner, “A Network Simulator Based on OSPF Routing Protocol for Network
Design and Educational Purposes”, M. Sc. Thesis, University of Puerto Rico, Mayaguez, 2007.
[4] K. Wehrle, M. Güneş, and J. Gross, eds., “Modeling and Tools for Network Simulation”,
Springer, 2010.
[5] R. Bhardwaj, A.Upadhyay, V.S.Dixit, “An Overview on Tools for Peer to Peer Network
Simulation”, International Journal of Computer Applications, Vol. 1(1), pp. 70-76, 2010.
[6] The Network Simulator - ns-2, http://www.isi.edu/nsnam/ns/ , last visited on July 2013.
[7] OMNeT++ Network Simulation Framework, http://www.omnetpp.org/ , last visited on
July 2013.
[8] OPNET Application and Network Performance, http://www.opnet.com/ , last visited on
July 2013.
[9] PeerSim: A Peer-to-Peer Simulation, http://peersim.sourceforge.net/ , last visited on
August 2013.
[10] P2PSim: A Simulator for Peer-to-Peer Protocols, http://pdos.csail.mit.edu/p2psim/ , last
visited on August 2013.
[11] QuerySim, http://querysim.riaforge.org/ , last visited on August 2013.
[12] B. Liu, Y. Guo, J. Kurose, D. Towsley, W. Gong, "Fluid Simulation of Large Scale
Networks: Issues and Tradeoffs", PDPTA, Vol. 99, pp. 2136 – 2142, 1999.
[13] J. Liu, “Packet-Level Integration of Fluid TCP Models In Real-Time Network
Simulation”, Proceedings of the 38th Conference on Winter Simulation, pp. 2162-2169, 2006.
48
[14] C. Kiddle, R. Simmonds, C. Williamson and B. Unger, “Hybrid Packet/Fluid Flow
Network Simulation”, Parallel and Distributed Simulation, Proceedings of The Seventeenth
Workshop on IEEE, pp. 143-152, 2003.
[15] S. Mehta, N. Sulatan, H. Kabir, N. Ullah, and Kwak K. S., “Network and System
Simulation Tools For Next Generation Networks : A Case Study”, Modelling, Simulation and
Identification, 2010.
[16] G. Goel, “A Comparative Study of Network Simulators: NS and OPNET”, PhD Thesis
at University of Southern California, 2004.
[17] X. Xian, W. Shi and H. Huang, “Comparison of OMNeT++ and Other Simulator for WSN
Simulation”, ICIEA 2008: 3rd IEEE Conference on Industrial Electronics and Applications,
pp. 1439-1443, 2008.
[18] IEEE Explore, http://ieeexplore.ieee.org/Xplore/home, last visited on September 2013.
[19] J. Pan, “A Survey of Network Simulation Tools: Current Status and Future
Developments”, http://www.cs.wustl.edu/~jain/cse567-08/ftp/simtools.pdf, last visited on
September 2013.
[20] M. M. Köksal, “A Survey of Network Simulators Supporting Wireless Networks”, Middle
East Technical University, Ankara, TURKEY, 2008.
[21] Fonex Voice over IP – Small Business VoIP Provider, http://www.fonex.com.au/voice-
over-ip/ , last visited on July 2013.
[22] S. Ehlert and S. Petgang, “Analysis and Signature of Skype VoIP Session Traffic”, 4th
IASTED International, 2006.
[23] TeleGeography Report & Database, http://www.telegeography.com/research-
services/telegeography-report-database/index.html , last visited on July 2013.
[24] AudioCodes Application Notes – VoIP in Military Applications,
http://www.audiocodes.com/filehandler.ashx?fileid=64597 , last visited on July 2013.
[25] S. Karapantazis, F. N. Pavlidou, “VoIP: A Comprehensive Survey on A Promising
Technology”, Computer Networks, Vol. 53(12), pp. 2050–2090, 2009.
[26] ITU-R Recommendation G.114, http://www.itu.int/rec/T-REC-G.114-200305-I, last
visited on July 2013.
[27] Telecommunications and Internet Protocol Harmonization over Networks,
http://www.etsi.org/deliver/etsi_tr/101300_101399/101329/01.02.05_60/tr_101329v010205p
.pdf, last visited on July 2013.
49
[28] ITU-T Contribution D. 110, “Subjective Results on Impairment Effects of Packet Loss”,
International Telecommunication Union, 1999.
[29] Cisco White Papers, “Enabling VoIP: Data Considerations and the Evolution of
Transmission Network Design”,http://www.whitepapersdb.com/whitepapers/download/1941,
2006, last visited on September 2013.
[30] L. Angrisani, M. Lelio, P. Morabito, R. S. Moriello and M. Vadursi, “Security in VoIP
Systems: Towards the Design and Implementation of a Reconfigurable Test Bed for Real-
Time Measurements”, IEEE International Workshop on Measurements and Networking
Proceedings (M&N), pp. 22-26, 2011.
[31] C. Han, H. Son, K. Young, L. Sun, “The Development of HD-VoIP Application with
G.711.1 for Smartphone”, ICUMT, 3rd International Congress on. IEEE, 2011.
[32] L. Deri, “Open Source VoIP Traffic Monitoring”, Proceedings of SANE, 2006.
[33] B. Xi, H. Chen, W. S. Cleveland and T. Telkamp, “Statistical Analysis and Modeling of
Internet VoIP Traffic for Network Engineering”, Electronic Journal of Statistics, Vol.4, pp.
58-116, 2010.
[34] F. Gustafson and M. Lindahl, “Evaluation of Statistical Distributions for VoIP Traffic
Modelling”, PhD Thesis at University West, 2009.
[35] E. Z. Filho and K. V. O. Fonseca, “Performance Monitoring of Individual VoIP Flows on
DiffServ Networks”, Telecommunications Symposium, pp. 370-375, 2006.
[36] P. M. Fiorini, “Voice over IP (VOIP) for Enterprise Networks: Performance Implications
& Traffic Models”, Proceedings of the 26th International Computer Measurement Group
Conference, pp. 545-556, 2000.
[37] E. Casilari, H. Montes and F. Sandoval, “Modelling of Voice Traffic Over IP Networks”,
Third International Symposium on Communications Systems Networks and Digital Signal
Processing, pp. 411-414, 2002.
[38] H. Hassan, J. M. Garcia, C. Bockstal, “Aggregate Traffic Models for VoIP Applications”,
Digital Telecommunications, International Conference on. IEEE, pp. 70-70, 2006.
[39] ITU-T Recommendation P.800, http://www.itu.int/rec/T-REC-P.800-199608-I, last
visited on September 2013.
[40] T. Triyason, "The Effect of Background Traffic Packet Size to VoIP Speech
Qyality." Advances in Information Technology. Springer Berlin Heidelberg, pp.175-182,
2010.

50
[41] K. Nisar, N. Sarkar, S. Hassan and D Wu, “Performance Studies of VoIP Over Ethernet
LANs”, International Journal of The Computer, The Internet and Management, Vol. 19(3),
pp. 1-7, 2011.
[42] K. Salah, “On the Deployment of VoIP in Ethernet Networks: Methodology and Case
Study”, Computer Communications, Vol. 9(8), pp. 1039-1054, 2006.
[43] Q. A. He, “Analysing The Characteristics of VoIP Traffic”, PhD Thesis. University of
Saskatchewan, 2007.
[44] Askeri Ağlar için Bilgi Güvenliği Simülasyonu,
http://www.modsimmer.metu.edu.tr/index.php?option=com_content&view=article&id=212:
modelleme-ve-simuelasyon-altyap-projesi&catid=64:emptykatagori, last visited on
September 2013.
[45] NeSSi2, http://www.nessi2.de/ , last visited on September 2013.