simulation model of a single-server order picking
TRANSCRIPT

Introduction System description Aggregation method Proof of concept Case study Conclusions
Simulation model of a single-serverorder picking workstation using
aggregate process times∗
R. Andriansyah, L.F.P. Etman, and J.E. Rooda
Systems Engineering Group, Department of Mechanical EngineeringEindhoven University of Technology
October 29, 2009
∗This work has been carried out as part of the FALCON project under the responsibility of the Embedded
Systems Institute with Vanderlande Industries as the industrial partner. This project is partially supported by theNetherlands Ministry of Economic Affairs under the Embedded Systems Institute (BSIK03021) program.
1 / 18

Introduction System description Aggregation method Proof of concept Case study Conclusions
Outline
1 Introduction
2 System description
3 Aggregation method
4 Proof of concept
5 Case study
6 Conclusions
2 / 18

Introduction System description Aggregation method Proof of concept Case study Conclusions
Motivation and objective
With regards to studies on automated warehouses:• automated storage/retrieval system has been the focus of
most research (Caputo and Pelagagge, 2006).• design oriented research is lacking due to difficulties in
quantifying stochastic behavior (Rouwenhorst et al., 2000).
The objective of this study is:• to develop a performance analysis method for order
picking workstations that requires little but measurableshop-floor data.
3 / 18

Introduction System description Aggregation method Proof of concept Case study Conclusions
System description
Stochastic behavior:
• setup • operator unavailability • breakdown
4 / 18
Introduction System description Aggregation method Proof of concept Case study Conclusions
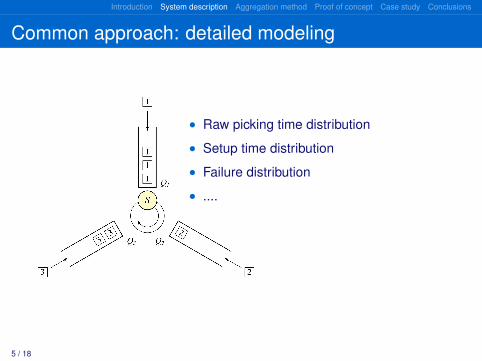
Common approach: detailed modeling
• Raw picking time distribution
• Setup time distribution
• Failure distribution
• ....
5 / 18

Introduction System description Aggregation method Proof of concept Case study Conclusions
Alternative approach: process time aggregation
• The aggregate process time distribution is reconstructedfrom tote arrival times (A) and tote departure times (D)obtained from the shop-floor data.
• We refer to this aggregate process time as the EffectiveProcess Time (EPT).
6 / 18
Introduction System description Aggregation method Proof of concept Case study Conclusions
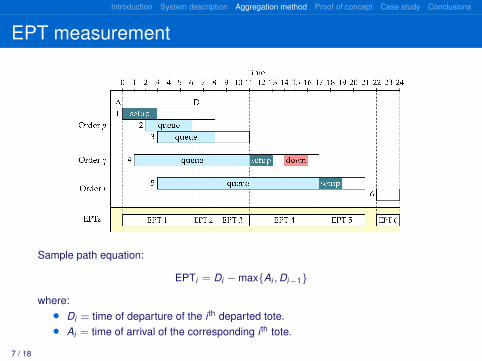
EPT measurement
Sample path equation:
EPTi = Di −max{Ai , Di−1}
where:• Di = time of departure of the i th departed tote.• Ai = time of arrival of the corresponding i th tote.
7 / 18

Introduction System description Aggregation method Proof of concept Case study Conclusions
Proposed aggregate model
Effective process time distribution:
• without 1st tote difference:gamma distribution with mean te andSCV c2
e
• with 1st tote difference:two gamma distributions with meanste,1, te,2+ and SCVs c2
e,1, c2e,2+
8 / 18

Introduction System description Aggregation method Proof of concept Case study Conclusions
Proof of concept - detailed model
• Raw picking time = B ∼ gamma(1.25,14)
• Setup time = S ∼ uniform(10,15)
• Other disturbances:
• Xfailure ∼ exponential(1800)• Xrepair ∼ exponential(120)
This model is used to generate tote arrival times (A) and totedeparture times (D).
9 / 18

Introduction System description Aggregation method Proof of concept Case study Conclusions
Proof of concept - EPTs from the detailed model
0 20 40 60 80 1000
0.1
0.2
0.3
0.4
0.5
0.6
0.7
0.8
0.9
1
x
F(x
)
Empirical CDF
EPTs single bucketEPTs first totesEPTs remaining totes
10 / 18

Introduction System description Aggregation method Proof of concept Case study Conclusions
Proof of concept - aggregate model
A gamma distribution is used to repre-sent the EPT distribution:
• without 1st tote difference (AggA):
• te = 20.081• c2
e = 1.439
• with 1st tote difference (AggB):
• te,1 = 31.148, c2e,1 = 0.590
• te,2+ = 18.688, c2e,2+ = 1.615
11 / 18

Introduction System description Aggregation method Proof of concept Case study Conclusions
Proof of concept - summary of findings†
Table 1. Performance measures (utilization level = 0.9).ϕ̄tote ϕ̄order c2
ϕ̄,tote c2ϕ̄,order
Detail 1521.7 ± 8.6 2117.6 ± 9.3 0.264± 0.002 0.103± 0.002AggA 1500.1 ± 8.6 2096.2 ± 9.0 0.269± 0.003 0.107± 0.002AggB 1519.8 ± 8.2 2118.1 ± 8.6 0.261± 0.002 0.100± 0.002
• Accuracy of AggB has significantly improved over AggA(two-sample t-test at α = 0.05, on various utilization levelsand order size distributions).
• Errors for mean and variability of flow time prediction areless than 0.5% and 3.0%, respectively for both tote andorder flow times.
†Andriansyah, R., Etman, L.F.P., and Rooda, J.E., 2009. Simulation Model of aSingle-Server Order Picking Workstation Using Aggregate Process Times. In:Proceedings 1st International Conference on Advances in System Simulation.
12 / 18

Introduction System description Aggregation method Proof of concept Case study Conclusions
Case study
Work-station
producttotes
Conveyor
producttote
bufferlane
Mini-load
product totes fromreplenishment
order tote
to consolidationemptyproduct tote
take-awayconveyor
operator active order tote
OrderSequencePoint
13 / 18

Introduction System description Aggregation method Proof of concept Case study Conclusions
Aggregate model building
14 / 18

Introduction System description Aggregation method Proof of concept Case study Conclusions
Aggregate model
Closed queueing network model:
15 / 18

Introduction System description Aggregation method Proof of concept Case study Conclusions
Results
Table 2. Prediction error (%).ϕ̄tote ϕ̄order c2
ϕ̄,tote c2ϕ̄,order δtote
WS1 1.0 7.0 1.1 −7.5 12.6WS2 0.7 6.7 1.3 −9.4 11.2WS3 3.9 10.4 −4.5 −15.6 10.7
• The method performs well with a given data set.• Prediction accuracy is being improved by modeling a better
order release strategy.
16 / 18

Introduction System description Aggregation method Proof of concept Case study Conclusions
Conclusions
• The proposed method is accurate for characterizing theeffective process time of an order picking workstation.
• EPT measurement requires only few parameters that canbe directly obtained from shop-floor data.
• Validation using real data from an operating warehouseshows promising results.
Future systems to investigate:• Order picking workstations with overtaking of orders and
multiple active orders.• Automated storage/retrieval systems (miniloads).
17 / 18
Introduction System description Aggregation method Proof of concept Case study Conclusions
Simulation model of a single-serverorder picking workstation using
aggregate process times‡
R. Andriansyah, L.F.P. Etman, and J.E. Rooda
Systems Engineering Group, Department of Mechanical EngineeringEindhoven University of Technology
October 29, 2009
‡This work has been carried out as part of the FALCON project under the responsibility of the Embedded
Systems Institute with Vanderlande Industries as the industrial partner. This project is partially supported by theNetherlands Ministry of Economic Affairs under the Embedded Systems Institute (BSIK03021) program.
18 / 18