simulation of hydrodesulfurization unit for natural gas ... · simulation of hydrodesulfurization...
TRANSCRIPT

ORIGINAL ARTICLE
Simulation of hydrodesulfurization unit for natural gascondensate with high sulfur content
Javad Alaei Kadijani1 • Elhameh Narimani2
Received: 8 January 2015 / Accepted: 2 April 2015 / Published online: 29 April 2015
� The Author(s) 2015. This article is published with open access at Springerlink.com
Abstract The natural gas condensates are composed of
various components of hydrocarbons and some con-
taminants such as hydrogen sulfide, thiols (mercaptans),
and aromatics. Thus, the natural gas condensates could be
considered as a fuel resource. This study concerned the
simulation of an Ultra-Deep Hydrodesulfurization
(UDHDS) unit plus a distillation section to treat a combi-
nation of gas condensate and disulfide oils (DSO) and
produce clean fuel cuts. Gas condensate of South Pars field
of Iran with high sulfur content was applied to obtain clean
fuel cuts. In order to reduce the sulfur content of this
stream to less than 10 ppmw as sulfur, a UDHDS unit was
simulated using Aspen HYSYS software package. The
clean gas condensate leaving the UDHDS unit (with sulfur
content\10 ppmw) contains complex mixtures of hydro-
carbon components called petroleum cuts which are iden-
tified by their boiling points ranges. To obtain the narrow
fractions of butane, light naphtha, heavy naphtha, kerosene,
and gasoil, a fractional distillation system was simulated.
The simulation results revealed that the top products of
distillation column, namely butane, light naphtha, and
heavy naphtha were sulfur free and the sulfur contents of
kerosene and gasoil cuts were 12 and 27 ppmw as sulfur,
respectively.
Keywords Gas condensates � Disulfide oils � Sulfurcontent � Ultra-Deep Hydrodesulfurization unit � Petroleumcuts � Fractional distillation system
Abbreviations
ANN Artificial neural network
DEAmine Diethyl amine
DEDS Diethyl disulfide
DMDS Dimethyl disulfide
DSO Disulfide oil
F.B.P. Final boiling point
FLR Flare
HDA Hydrodearomatization
HDN Hydrodenitrogenation
HDS Hydrodesulfurization
IEA International energy agency
I.B.P. Initial boiling point
OSBL Outside battery limit
Nm3 Cubic meters @ normal condition (0 �C)PFD Process flow diagram
ppmw Parts per million weight
RSM Response surface methodology
TBP True boiling point
UDHDS Ultra-Deep Hydrodesulfurization
VGO Vacuum gasoil
Introduction
Looking at the world’s growing demand for new energy
resources, experts in the field of oil and energy can obvi-
ously realize that oil industry has to find new fuel supplies
and upgrade their qualities. The natural gas condensates can
& Elhameh Narimani
Javad Alaei Kadijani
1 Research Institute of Petroleum Industry (RIPI), Gas
Department, West Boulevard of Azadi Stadium,
P. O. Box 14665-1998, Tehran, Iran
2 School of Chemical Engineering, Iran University of Science
and Technology, P.O. Box 16765-163, Tehran, Iran
123
Appl Petrochem Res (2016) 6:25–34
DOI 10.1007/s13203-015-0107-0

catch their attention as they contain complex mixtures of
hydrocarbon components. Natural gas condensate is known
as a low-boiling mixture of hydrocarbon liquids that are
present as gaseous components in the raw natural gas pro-
duced from many natural gas fields [1]. Therefore, in ad-
dition to crude oil, the natural gas condensate can be an
appropriate resource for oil industry to augment the fuel
production. According to the report of International Energy
Agency (IEA), the South Pars/North Dome field, which is
located in the Persian Gulf, is the world’s largest gas field
and shared between Iran and Qatar. This field holds an es-
timated 1800 trillion cubic feet (51 trillion cubic meters) of
in situ natural gas and some 50 billion barrels (7.9 billion
cubic meters) of natural gas condensates.1 However, the gas
condensate of this field is substantially sour as it is esti-
mated that the sulfur content of gas condensate of South
Pars field is more than 2000 ppmw as sulfur. The sulfur
content of fuels is currently considered as a major factor
contributing to pollution of the atmosphere.
Accordingly, the U.S. Environmental Protection Agency
limited the sulfur content of most diesel fuels to 15 ppm
from a level of 500 ppm in 2006. The similar environmental
regulations in Europe forced petroleum industries to reduce
the sulfur content for on-road diesel fuels from the level of
350–50 ppm by 2005 and to 10 ppm by 2009. Furthermore,
based on the Euro V criterion, the bound for fuels, in terms
of total sulfur content has to be less than 10 ppm as sulfur.
The sulfuric compounds in fossil fuels are divided into non-
aromatic and aromatic compounds. The first group includes
sulfides, disulfides, and mercaptans (thiols) and the second
one includes thiophenes, benzothiophenes, dibenzothio-
phenes, and benzonaphthothiophenes. The former has much
more reactivity than the other sulfuric compounds while the
latter, particularly benzothiophenic and dibenzothiphenic
derivatives, are difficult to desulfurize.
Hydrodesulfurization (HDS) is known as one of the
most efficient methods to reduce the sulfur content of hy-
drocarbons regarding universal criteria. This process can be
extremely effective in removing both types of sulfuric
compounds. In this plant, the reaction takes place under
high temperature and high hydrogen pressure in the pres-
ence of a catalyst. HDS process can accomplish desul-
phurization and in the meanwhile it can remove nitrogen
and metal compounds, and also carry out deoxidation.
Based on the advantages of hydrodesulfurization pro-
cess—removing less than 10 ppm sulfur, decreasing the
amount of environmental pollutants, increasing the age of
catalysts, simple operation of process unit to name but a
few—it is considered as an appropriate method to reduce
the sulfur content of gas condensate [2–7]. There are some
studies investigating the simulation and modeling of HDS
plants. The research conducted by S. Bilal et al. [8] focused
on the simulation of an HDS unit using Aspen HYSYS with
the aim of removing impurities such as sulfur and nitrogen
from raw kerosene. F. Jimenez et al. [9] carried out com-
puter-aided modeling as a tool for the investigation of si-
multaneous Hydrodesulfurization (HDS), Hydrodenitro-
genation (HDN), and Hydrodearomatization (HDA) of a
vacuum gasoil (VGO) in which reactions took place in in-
dustrial reactors. Another study explored the use of different
artificial neural network (ANN) architectures in creating
various models of the HDS process for the prediction of
sulfur removal from naphtha [10]. Ultra-Deep Hydro-
desulfurization (UDHDS) process is considered as one of
the subbranches of the conventional HDS process which is
conducted in the severe process conditions and using dif-
ferent catalyst to obtain the lower amount of sulfur content.
In addition to the HDS unit, a distillation system is re-
quired to obtain clean cuts. However, the order of these two
sections is a problem. Based on a technical recommendation
study report given by HQCEC, the hydrogenation plus
fractionation process to treat naphtha can produce clean
product with high quality and low impurity content com-
pared with the fractionation plus hydrogenation units.
Moreover, the energy consumption of these two plants was
approximately equal. In terms of investment, the system
capacity of hydrogenation plus fractionation process is
slightly higher than that of the fractionation plus hydro-
genation processes [11]. However, in these studies, costs
and problems caused by sour petroleum cuts have been
ignored. Gas condensate of South Pars field is currently sent
to refineries to produce fuel cuts or sold in markets. In both
cases, gas condensate with high sulfur content or sour pet-
roleum cuts can seriously damage pipelines and process
equipment due to corrosion and push up the cost of process.
In the present study, it has been assumed that the primary
design of sulfur removal unit for gas condensate should be
based on the UDHDS plant plus a fractional distillation unit.
Regarding the world’s increasing need for clean fuels as
well as environmental issues resulting from high-sulfur fuel
burning, it was assumed that a new UDHDS unit treating the
natural gas condensate of South Pars field and producing the
ultra-low sulfur fuel cuts from them would attract invest-
ments and get back more interests in the universal markets.
Moreover, this process can protect downstream equipment
from corrosion and cut down costs of maintenance. Fur-
thermore, there is an environmental issue which is related to
the production of disulfide oil. The substance, commonly
known as disulfide oil (DSO), can comprise 17 different
disulfides and trisulfides with monoalkyl chain lengths no
greater than C4. Evidence demonstrates that the lowest
series member, dimethyl disulfide (DMDS), can display the
highest toxicity. DSO possesses high aquatic toxicity,
1 Data are extracted from APS Review Gas Market Trends. April 2,
2007.
26 Appl Petrochem Res (2016) 6:25–34
123

moderate environmental persistence, high repeated dose
toxicity, carcinogenicity, and reproductive/developmental
effects [12].
DSOs (mainly dimethyl and diethyl disulfides) are
formed in considerable amounts in the process of hydro-
carbon demercaptanization in refineries. Presently, there is
no practical application for DSO. Furthermore, destruction
of DSO by combustion would lead to the formation of
sulfur dioxide and carbonyl compounds which can pollute
the atmosphere. Fortunately, DSOs are highly active in the
catalytic reaction with hydrogen and they can be easily
removed and converted to alkanes and hydrogen sulfide in
the hydrodesulfurization process.
Therefore, the aim of this study is the simulation of a
new UDHDS unit plus a distillation section in South Pars
refinery which would treat the natural gas condensate with
high sulfur content and produce clean and sellable fuel
cuts. Moreover, regarding aforementioned problems caused
by DSOs in this refinery, in this simulation a stream of
DSOs was added to gas condensate which was sent to
UDHDS unit as a feed. The simulated UDHDS unit plus
distillation section would treat gas condensate and totally
remove DSOs from this refinery. The results of the present
work can be used to build a new UDHDS unit to treat the
gas condensate of South Pars field and produce clean fuel
cuts. The main difference between this UDHDS process
and conventional UDHDS processes is related to the feed
of this simulated unit which is a combination of gas con-
densate and DSO while the feed of the conventional
UDHDS units is usually petroleum cuts like naphtha, ga-
soil, or kerosene. In this simulation, it was assumed that the
total sulfur content of gas condensate after treatment
should reach less than 10 ppmw as sulfur.
At the end, a distillation column was joined to the
simulation in order to obtain the clean cuts of butane, light
and heavy naphtha, kerosene, and Gasoil from treated gas
condensate.
Methods and materials
The specification of gas condensate based on TBP (True
Boiling Point) used in this study is shown in Table 1. In
addition, Fig. 1 shows the boiling point curve of gas con-
densate. Tables 2 and 3 indicate the non-sulfuric and sul-
furic components of gas condensate.
The feed of UDHDS unit was the gas condensate flow
combined with a stream of DSO. It should be taken into
consideration that at the ambient conditions (temperature
27 �C and atmospheric pressure) DSO is totally dissolvable
in gas condensate. The boiling points and mass contents of
two sulfuric compounds of the DSO used in this study are
shown in Table 4.
It was assumed that the flow of DSO with volumetric rate
of 293 barrels per day (the maximum daily produced rate of
DSO in the South Pars refinery) was mixed with 40,000
barrels per day of gas condensate. This mixed stream was
called feed and it was sent to UDHDS unit. Reducing the
sulfur content of feed flow to less than 10 ppm as sulfur, the
simulated UDHDS unit could completely remove DSO.
Table 1 The specification of gas condensate based on TBP
Volume, % TBP (�C)@760 mmHg
5.18 15
11.49 36.1
53.24 150
63.09 175
73.41 215
81.76 250
87.01 275
95.81 350
100 360
Fig. 1 The boiling point curve of gas condensate
Table 2 The non-sulfuric components of gas condensate
Non-sulfuric Components in Gas
Condensate
Content in gas condensate,
wt%
Propane 0.3295
n-Butane 1.7320
i-Butane 0.7798
n-Pentane 0.0212
i-Pentane 0.1602
Water 0.0080
C6? 96.75
Appl Petrochem Res (2016) 6:25–34 27
123

In order to simulate the UDHDS unit plus a distillation
section to treat gas condensate plus DSO stream, Aspen
HYSYS software package was used. The first step in this
simulation is related to definition of feed stream for the
software. A new case should be generated. Then, before
starting the characterization process, a property package
should be selected and all the non-oil components,
specifically the light ends which are pure components with
low boiling points, components in the boiling point range
of C2 to n-C5 as well as all sulfuric components had to be
added. Next, Enter Basis Environment and Oil Manager
Tabs should be selected, respectively, in order to define oil
characterization and through this section the assay of gas
condensate based on its True Boiling Point (TBP) was
defined. In addition, bulk properties for the sample might
also be supplied. In the cases that a distillation curve is
available, bulk properties can be optional. However, bulk
properties like molecular weight, mass density, Watson
(UOP) K Factor, and bulk viscosities can increase the ac-
curacy of calculations in HYSYS. In this simulation, the
values of molecular weight and mass density for gas con-
densate were 120 and 756 kg/m3, respectively.
Afterwards, the oil should be installed in the flowsheet.
Finally, in the main simulation environments, two streams
of gas condensate and DSO could be created. A brief
process description is described as follows.
Process description
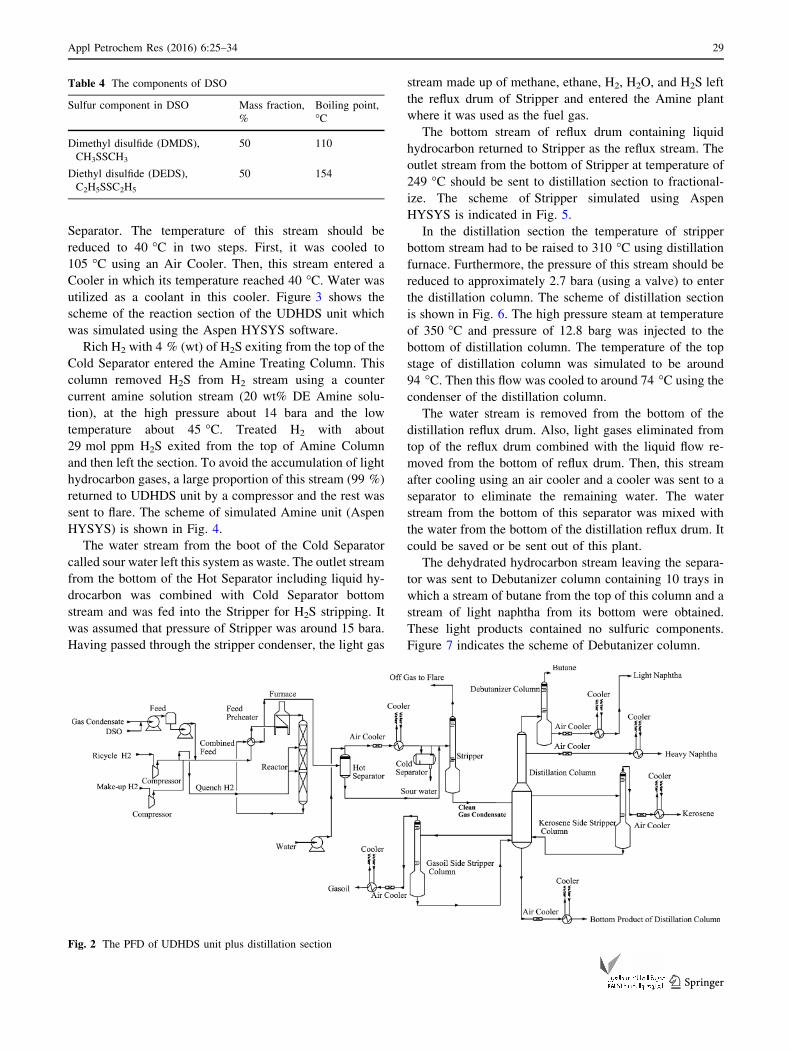
Figure 2 indicates a brief Process Flow Diagram (PFD) of
this process.
According to Fig. 2, a stream of gas condensate with
flow rate of 200,000 kg/hr at the ambient condition (27 �Cof temperature and atmospheric pressure) was mixed with
2000 kg/hr of DSO called feed. The pressure of feed
stream had to be raised to 49 bara using the feed pump.
Then, a hydrogen stream called Make-up H2 stream with
flow rate of 246 kg/hr and 99.9 mol % of purity was sent to
a mixer using a compressor where it combined with a part
of recycle hydrogen with 60 mol % purity from Amine
Unit. The recycle hydrogen stream with flow rate of
30838.76 kg/hr, which was the outlet stream of Amine
Unite, was divided into two equal streams. One of them
was used as a quench stream which should also be divided
into two equal streams and injected into UDHDS Reactor
from two points between beds. Another one was sent to the
mixer to mix with Make-up hydrogen. In order to increase
the pressure of recycle hydrogen to 47 bara, a compressor
was also applied. Then, blended hydrogen was combined
with feed and this stream was called combined feed.
To save energy, heat exchange occurred between the
combined feed and the outlet stream of UDHDS Reactor in
the UDHDS Preheater. Afterward, the hot combined feed
with temperature of 264 �C entered the Furnace. The
temperature of the furnace outlet stream should be kept
constant at 330 �C, which entered the UDHDS Reactor.
This Reactor had quench streams of hydrogen between
beds as reactions were exothermic and these streams could
partially cool down the reactor.
UDHDS Reactor should be a trickle bed reactor. In the
reactor, sulfur compounds were converted to H2S in the
presence of catalyst and hydrogen, with high pressure and
temperature around 40 bara and 330 �C, respectively. Tosimulate the reactor in HYSYS, the general reactor mode
was chosen and the relevant reactions were defined based
on the conversion reactor model. Some of the most im-
portant chemical reactions taking place in this process are
described as follows:
CH3SH + H2 ! CH4 + H2S ð1ÞC2H5SH þ H2 ! C2H6 þ H2S ð2ÞC2H6S2 þ 3H2 ! 2 CH4 þ 2 H2S ð3ÞC4H10S2 þ 3H2 ! 2 C2H6 þ 2 H2S ð4Þ
Reactor outlet stream was cooled in UDHDS Preheater
to around 150 �C. Then, this stream was sent to Hot
Separator. In this separator, a stream of light hydrocarbons
which was rich in H2 (50 % mol) containing H2S (1.1 %
mol) was removed from top of the vessel at 16.5 bara and
147 �C. The pressure of this stream decreased to 16.5 bara
after passing through a valve and Hot Separator. The top
stream of Hot Separator after mixing with water used to
wash ammonium, was cooled to 40 �C and sent to Cold
Table 3 The sulfuric components of gas condensate
Sulfuric components in gas condensate Content in gas condensate
(as sulfur), ppm w
Methyl Mercaptan 20
Ethyl Mercaptan 350
I-Propyl Mercaptan 250
T-Butyl mercaptan 10
N-Propyl mercaptan 100
2-Butyl mercaptan 210
i-Butyl mercaptan 10
N-Butyl mercaptan 100
Linear High molecular weight RSH 570
Sulfides 300
Aryl-Sulfides 75
Benzothiophenes 56
Naphthenic-Benzothiophenes 12
Dibenzothiophenes 59
Sum 2122
28 Appl Petrochem Res (2016) 6:25–34
123
Separator. The temperature of this stream should be
reduced to 40 �C in two steps. First, it was cooled to
105 �C using an Air Cooler. Then, this stream entered a
Cooler in which its temperature reached 40 �C. Water was
utilized as a coolant in this cooler. Figure 3 shows the
scheme of the reaction section of the UDHDS unit which
was simulated using the Aspen HYSYS software.
Rich H2 with 4 % (wt) of H2S exiting from the top of the
Cold Separator entered the Amine Treating Column. This
column removed H2S from H2 stream using a counter
current amine solution stream (20 wt% DE Amine solu-
tion), at the high pressure about 14 bara and the low
temperature about 45 �C. Treated H2 with about
29 mol ppm H2S exited from the top of Amine Column
and then left the section. To avoid the accumulation of light
hydrocarbon gases, a large proportion of this stream (99 %)
returned to UDHDS unit by a compressor and the rest was
sent to flare. The scheme of simulated Amine unit (Aspen
HYSYS) is shown in Fig. 4.
The water stream from the boot of the Cold Separator
called sour water left this system as waste. The outlet stream
from the bottom of the Hot Separator including liquid hy-
drocarbon was combined with Cold Separator bottom
stream and was fed into the Stripper for H2S stripping. It
was assumed that pressure of Stripper was around 15 bara.
Having passed through the stripper condenser, the light gas
stream made up of methane, ethane, H2, H2O, and H2S left
the reflux drum of Stripper and entered the Amine plant
where it was used as the fuel gas.
The bottom stream of reflux drum containing liquid
hydrocarbon returned to Stripper as the reflux stream. The
outlet stream from the bottom of Stripper at temperature of
249 �C should be sent to distillation section to fractional-
ize. The scheme of Stripper simulated using Aspen
HYSYS is indicated in Fig. 5.
In the distillation section the temperature of stripper
bottom stream had to be raised to 310 �C using distillation
furnace. Furthermore, the pressure of this stream should be
reduced to approximately 2.7 bara (using a valve) to enter
the distillation column. The scheme of distillation section
is shown in Fig. 6. The high pressure steam at temperature
of 350 �C and pressure of 12.8 barg was injected to the
bottom of distillation column. The temperature of the top
stage of distillation column was simulated to be around
94 �C. Then this flow was cooled to around 74 �C using the
condenser of the distillation column.
The water stream is removed from the bottom of the
distillation reflux drum. Also, light gases eliminated from
top of the reflux drum combined with the liquid flow re-
moved from the bottom of reflux drum. Then, this stream
after cooling using an air cooler and a cooler was sent to a
separator to eliminate the remaining water. The water
stream from the bottom of this separator was mixed with
the water from the bottom of the distillation reflux drum. It
could be saved or be sent out of this plant.
The dehydrated hydrocarbon stream leaving the separa-
tor was sent to Debutanizer column containing 10 trays in
which a stream of butane from the top of this column and a
stream of light naphtha from its bottom were obtained.
These light products contained no sulfuric components.
Figure 7 indicates the scheme of Debutanizer column.
Table 4 The components of DSO
Sulfur component in DSO Mass fraction,
%
Boiling point,
�C
Dimethyl disulfide (DMDS),
CH3SSCH3
50 110
Diethyl disulfide (DEDS),
C2H5SSC2H5
50 154
Fig. 2 The PFD of UDHDS unit plus distillation section
Appl Petrochem Res (2016) 6:25–34 29
123

The side stream drawn from the 26th tray of the distil-
lation column was called heavy naphtha and it was sulfur
free. This product should be cooled using an air cooler and a
cooler to reach the ambient temperature (27 �C). The sec-
ond side stream of the distillation column drawn from tray
28 was sent to a side stripper called kerosene side stripper.
The steam at temperature of 350 �C and pressure of 13.8
bara (12.8 barg) was fed to the kerosene side stripper.
The bottom product of this column known as kerosene
should be cooled using an air cooler and a cooler to reach
the ambient temperature. The third side stream of the dis-
tillation column exiting from tray 29 went to the gasoil side
stripper. The steam at temperature of 350 �C and pressure
of 13.8 bara entered this column.
The bottom stream of this column called gasoil should
be cooled using an air cooler and a cooler to reach the
ambient temperature. Finally, the small amount of hydro-
carbons called Bottom Product of Distillation column left
the bottom of the distillation column which had to be
cooled to reach the ambient temperature using an air cooler
and a cooler. These clean products of butane, light naphtha,
heavy naphtha, kerosene, gasoil, and condensate can be
stored in the storage tanks.
Results and discussion
Aspen HYSYS software was used to simulate the UDHDS
unit for a mixture of gas condensate and DSO. It was shown
that this process involved three general sections: reaction,
stripping, and distillation. The tray stripper was used to
remove hydrogen sulfide from gas condensate. Based on
the simulation result, Stripper required 20 stages to remove
the significant amount of H2S from the gas condensate.
Moreover, the feed stream entered the stripper from tray 5.
The bottom product of Stripper known as the clean gas
condensate included no H2S and its total sulfur content was
simulated to be less than 10 ppmw as sulfur. Afterward, to
obtain different fractions, this bottom product was sent to a
distillation column involving 30 stages. The gas condensate
is composed of many components with boiling points
covering a great range of temperatures. Each product has a
boiling range having an initial boiling point (I.B.P.) and a
final boiling point (F.B.P.). There are different ranges of
boiling points for different cuts indicated in the literature.
Some of them are shown in Table 5. In the present study,
the boiling point ranges of different cuts were defined basedFig. 3 The scheme of the reaction section of UDHDS unit
Fig. 4 The scheme of the Amine unit
30 Appl Petrochem Res (2016) 6:25–34
123

on the data elicited from the Website of Chevron Company
[14], which is shown in the third column of Table 5.
In order to recognize each cut, the range of its boiling
points should be considered and compared. According to
the data of Table 5 and the range of boiling points of gas
condensate listed in Table 1, the volumetric rate of each
cut could be estimated and used as initial values to simulate
this unit using the Aspen HYSYS software. As a result, it
was assumed that the estimated volumetric rates of light
naphtha, heavy naphtha, kerosene, and gasoil were ap-
proximately 12, 40, 18, and 19 % (volumetric percent) of
gas condensate (40,000 barrel per day), respectively.
The simulation results revealed that five different cuts
were fractionized from the clean gas condensate using
distillation section. The sulfur content of each cut was less
than 30 ppmw as sulfur. The simulation results based
on the mass balance are summarized in Table 6. Regarding
Table 6, it can be concluded that butane, light naphtha, and
heavy naphtha streams were sulfur free. However, kerosene
and gasoil products contained 11 and 27 ppmw as sulfur,
respectively. Furthermore, the bottom product of distilla-
tion column involved approximately 29 ppm as sulfur.
To efficiently understand this process, some of the key
performance indicators of UDHDS Process were summa-
rized in Table 7. H2 consumption is considered as one of
the key performance indicators of this process which was
defined as the ratio of the volumetric rate of required hy-
drogen (at normal condition) to the volumetric rate of feed.
It should be taken into account that H2 consumption was
evaluated based on the rate of hydrogen required to react
with all the sulfuric components of feed and remove them.
To calculate the yield of liquid product on feed, the mass
flow rate of the bottom stream of Stripper called clean gas
condensate was divided by the mass flow rate of feed (a
combination of gas condensate and DSO).
UDHDS process path forward
Using the simulated UDHDS unit plus distillation section,
the South Pars refinery would be able to treat 400,00 barrel
per day of gas condensate and remove about 300 barrels
per day of DSO. Major modification envisaged includes the
optimization of suggested UDHDS process in this study.
Varying different operation conditions and process
variables like temperatures, the number of stages of stripper
and distillation columns, to name but a few, one can opti-
mize this process to obtain the highest performance with the
least cost. Some mathematical methods like Response
Surface Methodology (RSM) and Artificial Neural NetworkFig. 5 The scheme of stripping section
Fig. 6 The scheme of distillation section
Appl Petrochem Res (2016) 6:25–34 31
123

(ANN) can be used as efficient tools to optimize this pro-
cess, in the future studies. In the cases that the lower amount
of sulfur content in gas condensate will be required, some
essential modification can be carried out as follows:
A larger reactor
Reducing LSHV
The larger amount of H2/Oil ratio
Stripper with more stages
Conclusion
The present study was based on the simulation of an in-
dustrial process in which the simulation can be used as a
tool to predict the quality of products of this process. In
order to obtain the ultra-low sulfur gas condensate and
remove DSO stream from the South Pars refinery, a
UDHDS unit was simulated. Not only could the simulated
UDHDS unit reduce the sulfur content of gas condensate
to less than 10 ppmw as sulfur, but it could also remove
DSO which was considered as a serious environmental
issue. Subsequently, to obtain the ultra-low sulfur cuts
from the clean gas condensate, a distillation section in-
volving two side strippers and one debutanizer column
was simulated. The simulation of UDHDS unit and dis-
tillation section was conducted using the Aspen HYSYS
software package. The simulation results showed that five
cuts involving butane, light naphtha, heavy naphtha,
kerosene, and gasoil could be fractionized from gas
condensate using a distillation unit. The sulfur content of
Fig. 7 The scheme of Debutanizer column
Table 5 The boiling point ranges of petroleum cuts in the literature
Petroleum cuts Boiling point ranges, �CReported in the literature
[13] [14] [15]
LPG Up to 30 – –
Light Naphtha 30–100 10–80 39–85
Medium Naphtha 100–150 80–150 85–200
Heavy Naphtha 150–200
Kerosene 150–250 200–260 170–270
Light Gasoil 250–350 260–340 180–340
Heavy Gasoil 350–450
Residue Over 450 Over 340 –
32 Appl Petrochem Res (2016) 6:25–34
123

each product was less than 30 ppmw as sulfur. This study
can be used as a base to establish a UDHDS unit plus
distillation section in this refinery as this process is ca-
pable of solving environmental problems and turning
profit. In addition, it can be considered as the first step for
further studies in order to optimize this process.
Open Access This article is distributed under the terms of the
Creative Commons Attribution 4.0 International License (http://
creativecommons.org/licenses/by/4.0/), which permits unrestricted
use, distribution, and reproduction in any medium, provided you give
appropriate credit to the original author(s) and the source, provide a
link to the Creative Commons license, and indicate if changes were
made.
References
1. Manning FS, Thompson RE (1991). Oilfield Processing of Pet-
roleum (Volume One:Natural Gas). Pennwell Books. ISBN
0-87814-343-2
2. Medde M The Ph.D. thesis in ingegneria industriale universita
degli studi di cagliari, ‘‘experimental analysis and modelling of
gasoil hydrotreatment process’’
3. Sadighi S, Seif Mohaddecy SR, Ghabouli O, Bahmani M (2009)
Revamp of naphtha hydrotreating process in an iranian refinery.
Pet Coal J 51(1):45–50
Table 6 Mass balance
Stream Description Gas
Condensate
DSO Feed Make-
Up H2
Recycle
H2
Quench
H2
Blended
H2
Combined
Feed
Sour Water to
OSBL
Stripper Off-Gas
to FLR
Flow rate (kg/hr) 200,000 2000 202,000 246 30,780 15,390 15,630 217,636 8067 3759
Phase L L L G G G G L-G L G
Pressure (barg) 0 5.4 0 46.5 46 46 46 46 14.2 14
Temperature (oC) 27 50 27.17 198 172 173 173 50 40 42.5
Density (kg/m3) 761 999 754 2.58 13.71 13.71 12.85 122 996.4 21.1
Sulfur Component (as
S), wt%
0.21 60 1.2 0 0 0 0 0.451 0 0
Hydrogen, wt% 0 0 0 99.9 11.1 11.1 12.4 0.8 0 0.8
H2S, wt% 0 0 0 0 0.009 0.009 0.009 0.0006 0.01 6
H2O, wt% 0.01 0 0.01 0 1.1 1.1 1.1 0.09 99.09 0.5
Light Gas, wt% 3 0 2.9 0.1 88.79 88.79 86.49 9.11 0 92
Condensate, wt% 97 0 96.1 0 0 0 0 89.1 0 0
Dimethyldisulfide,
wt%
0 50 0.5 0 0 0 0 0.46 0 0
Diethyldisulfide, wt% 0 50 0.5 0 0 0 0 0.46 0 0
Stream Description Stripper
Bottom
Feed to
distillation
column
to
Debutanizer
Butane Light
Naphtha
Water
to OSBL
Heavy
Naphtha
Kerosene Gasoil Bottom
product of
distillation
column
Flow rate (kg/hr) 191,900 191,900 29,910 3441 26,470 4915 83,520 40,890 35,000 3040
Phase L G L G L L L L L L
Pressure (barg) 15 1.7 1 0.8 1.8 1 1.5 1.5 1.5 1.5
Temperature (�C) 249 310 50 14.25 25 25 25 25 25 25
Density (kg/m3) 531.3 6.8 650 4.7 690.5 1007 742 787 832 821
Sulfur Component (as S), wt% 0.0007 0.0007 0 0 0 0 0 0.0011 0.0027 0.003
Hydrogen, wt% 0 0 0 0 0 0 0 0 0 0
H2S, wt% 0 0 0 0 0 0 0 0 0 0
H2O, wt% 0 0 0.03 0.2 0 100 0.018 0.1 0.075 0.0082
Light Gas, wt% 0.5 0.5 12 99.8 1.24 0 0.1 0 0 0.033
Condensate, wt% 99.44 99.44 87.97 0 98.76 0 88.54 99.9 92.2 95.6
Dimethyl disulfide, wt% 0 0 0 0 0 0 0 0 0 0
Diethyl disulfide, wt% 0 0 0 0 0 0 0 0 0 0
Table 7 Key performance indicators of UDHDS process
H2 Consumption, Nm3/m3of feed 13
Desulfurization, % 99.98
Yield of liquid product on feed, % 95
Appl Petrochem Res (2016) 6:25–34 33
123
4. Gheni SA, Jada’a WA (2012) Inhibitory study for joint reactions
of hydrodesulphurization and hydrodenitrogenation during hy-
drotreating of vacuum gas oil. In: Proceedings of the world
congress on engineering and computer science 2012, vol II.
WCECS, San Francisco, USA
5. Kabe T, Ishihara A, Qian W (1999) Hydrodesulphurization and
Hydrodenitrogenation. Kodansha Ltd., Tokyo, WILEY-VCH
Verlag GmbH, Weinheim
6. Babich IV, Moulijn JA (2003) Science and technology of novel
processes for deep desulfurization of oil refinery streams. Fuel J
82(6):607–740
7. Rang H, Kann J, Oja V (2006) Advances in desulfurization re-
search. Oil Shale 23(2):164–176
8. Bilal S, Mohammed Dabo IA, Mujahid AU, Kasim SA, Nuhu M,
Mohammed A, Abubakar HM, Yahaya UB, Habib A, Abubakar
B, Aminu YZ (2013) Simulation of hydrodesulphurization (HDS)
unit of Kaduna Refining and Petrochemical Company Limited.
Chem Process Eng Res 13:29–35
9. Jimenez F, Kafarov V, Nunez M (2006) Computer-aided mod-
eling for hydrodesulfurization, hydrodenitrogenation and
hydrodearomatization simultaneous reactions in a hydrotreating
industrial process. Comput Aided Chem Eng 21:651–657
10. Arce-Medina E, Paz-Paredesb JI (2009) Artificial neural network
modeling techniques applied to the hydrodesulfurization process.
Math Comput Modelling J 49:207–214
11. Technical Recommendation Study Report for HQCEC Company
12. Morgott D, Lewis C, Bootman J, Banton M (2014) Disulfide oil
hazard assessment using categorical analysis and a mode of ac-
tion determination. Int J Toxicol 33:181S–198S. doi:10.1177/
1091581813504227
13. Al-Assady Q (2009) Characterization of petroleum fractions.
Iraqi J Mech Mater Eng 9(2):223–238
14. Refinery Feedstocks and Products- Properties and Specifications,
Colorado School of Mines, Page: 21, http://inside.mines.edu/
*jjechura/Refining/02_Feedstocks_&_Products.pdf
15. Oil Refinery Processes page: 40, http://www.uma.ac.ir/files/site1/
m_ghorbanpour_6ffe535/refinery_3.pdf
34 Appl Petrochem Res (2016) 6:25–34
123