simulation of markowitz’s portfolio selection using ... · sical markowitz’s portfolio analysis...
TRANSCRIPT

AGNIESZKA ULFIK
Politechnika Cz�stochowska
SIMULATION OF MARKOWITZ’S PORTFOLIO SELECTION USING CELLULAR AUTOMATA
Summary
Paper presents simulation of process selection portfolio elements applying clas-
sical Markowitz’s portfolio analysis theory using parallel computational
environment – cellular automata.
H. Markowitz has published is first paper about portfolio theory in 1952, con-
sidering two criteria: risk and rate ifreturn. After more than half century this theory
still isn’t widely applied in its clear form. The problem is numerical complexity.
Proposed solution to this problem is parallel computational environment – cel-
lular automata with use of artificial intelligence.
There are created models of functioning cellular automata with abilities to real-
ize computation to maximize expected income or minimize risk of stock investment.
In different models cells are communicating with each other in different ways and
exchanging different information. Different models are giving different results with
different data. Simulation of these models, used to select optimal portfolio, are com-
pared. Data used in the simulations come from Warsaw Stock Exchange.
In the beginning of this article is presented classical Markowitz’s portfolio
analysis with all formulas used during computation. In further part are presented
cellular automata with their abilities to realize computation. Later are presented
simulations (with all assumptions) and its results. Simulations are done on data
from polish stock market. All simulations are executed in author computer program
written in Borland C++ Builder. Conclusions are presented at the end of this arti-
cle.
Key words: portfolio selection, portfolio analysis, portfolio management, cellular automata,
simulation, stock market, Warsaw Stock Exchange
1. Introduction
In last few years, polish stock market has strongly developed. On Warsaw Stock Exchange on
14th April 2010 were quoted 379 stock companies (www.gpw.pl). Stock market in Poland is
currently strongly developed and despite late global capital market crisis it is good place for
researches of behaviour of stock prices. Apart from stock, investors on polish capital market can
invest money in bonds, futures contracts and also other financial instruments. The main aim for
investors is to estimate correctly future value of securities and then choose those with the biggest
expected profit. Problem is that very often those securities are characterized by high level of risk.
Investors can reduce this risk by investing in more than one security. One of basic techniques of
capital market analysis is portfolio analysis.

244
Agnieszka Ulfik
Simulation of Markowitz’s portfolio selection using cellular automata
Problem of selection effective portfolio is not simple in spite of existence of theoretical solu-
tion given by Harry Markowitz in 1952. With choosing portfolio investor has to first choose
securities in which he wants to invest, and then establish how the invested capital will divided
among securities.
Markowitz’s portfolio analysis gives investors the best portfolio, depending on their expecta-
tions. Disadvantage of this theory is its numerical complexity. Even thorough we can use very fast
multi threads computers and other types of parallel machines, we still cannot find the best solution
using classical methods in reasonable time of computations. First of all we have to gather many
data and with use of this data calculate expected rate of return and standard deviation for every
security. We also need to calculate coefficients of correlation between all considered companies.
There are ( )
2
1−nn coefficients of correlation, so for 50 stocks we have to count 1 225 coeffi-
cients of correlation, for 100 stocks – 4 950 coefficients and for 379 stocks quoted on 14.04.2010
on Warsaw Stock Exchange, we have to calculate 71 631 coefficients of correlation.
When we will count all necessary characteristics we have to choose portfolio. Number of pos-
sible portfolios is 12 −n, where n is number of stocks. For 5 stocks we can have 31 possible
portfolios, for 10 – already 1 023. For 50 stocks we will have 1 125 899 906 842 623 possible
portfolio, for 100 we will have 1,26*1030
portfolios and for 379 stocks this number will reach
1,23*10114
. Additionally every portfolio can have different percentage of every stock that it
includes. To solve this problem we not only need very fast computers but also special techniques
that will allow to find effective portfolio
Very often the best solution we got as a result of watching nature. The most popular usage of
such processes are genetic algorithms and neural networks. Another one is a cellular automaton.
Cellular automata were created in fortieth of last century to emulate processes occurring in nature.
Soon after this invention, cellular automata occurred very interesting and useful also for engineers.
There are still some researches done to find new application for cellular automata. One of them
can be problem of selection of portfolio in stock market.
2. Cellular Automata
Cellular automata (CA) are discrete models used mainly in physic, mathematics and computa-
bility theory. They were created by Stanisław Ulman and later developed by his colleague also
working at Los Alamos National Laboratory – John von Neumann. CA are structures of the same
cells putted mostly common into lattice. It is usually one, two or three-dimensional and involves
large number of cells (theoretically this number is infinite but reality it is impossible to implement
such model). Every cell has defined type and starting value C(i,j)(t). It also has its algorithm called
function of conversion or evaluation rule – F. This function defines what will be future value of
cell, depending on values of neighbouring cells in current time.
There are two types of neighborhoods in CA: von Neuman’s and Moore’s. Von Neuman’s
neighborhood is made up of four cells adjacent vertically and horizontally. Moore’s neighborhood
are eight cells surrounding specific cell from right, left, top, bottom and four diagonally. In every
iteration current value of every cell is calculated on base of values of adjacent cells from previous
iteration, with evaluation rule, formulated as follows:

245
POLISH ASSOCIATION FOR KNOWLEDGE MANAGEMENT
Series: Studies & Proceedings No. 42, 2011
( )( ) ( )( ) ( ) ( ) ���
��
=+ GtNji
Ctji
CFtji
C ;,
,,
1,
were
( ) ( )( )( ) ( )( ) ( )( )
( )( ) ( )( )
( )( ) ( )( ) ( )( ) ����
�
�
�
�
+++−+
+−
+−−−−
=
,1,1
,,1
,1,1
,1,
,1,
,1,1
,,1
,1,1
,
tji
Ctji
Ctji
C
tji
Ctji
C
tji
Ctji
Ctji
C
tNji
C in Moore’s neighbor-
hood,
or
( ) ( )( )( )
( )( ) ( )( )
( )( ) ����
�
�
�
�
+
+−
−
=
,,1
,1,
,1,
,,1
,
tji
C
tji
Ctji
C
tji
C
tNji
C in von Neumans neighbor-
hood,
and G is the vector of control variables.
The best known example of CA is game “Life” created by John Conway. In this game every
cell receives starting state: it can be active or inactive. This game simulates real environment
where animals can be born or day when they don’t have enough food. In this game there are settled
rules of behaviour of every cell. If it is inactive and three other active cells surround it, it comes to
life so becomes active. If cell is active and in its surrounding are two or three other active cells, it
stays active also. In every different case cell is inactive – it stays inactive if such she was earlier or
she days if earlier conditions are not fulfilled. So simple rules leads to astounding solutions. The
final effect of CA can be systematize as following: CA achieves stable state, in which nothing does
not it change (all cells stay in determinate state); state of CA changes cyclically after some quanti-
ty of iteration; CA achieves chaotic state in which it is hard to find any order; in CA we can find
stable local configurations with long time of life.
The cellular automata are already since a long time applied in many fields of science. In every
issue it is necessary to establish three basic parameters CA as: type of cells creating CA, which
means to establish what kind of information they have to contain; starting value of every cell;
function of conversion which is algorithm deciding what will be the state of cells in current itera-
tion on the base of values of neighbouring cells in previous iteration.
It has been proved that CA can simulate mechanisms occurring at the stock market and how
this simulation can be useful for potential capital market investors using its collective work to
choose effective portfolios, although further researches are needed, especially in time of capital
markets crisis. Structure of CA simulating stock market using collective work of all cells can be
organized in many ways, as it was shown before.

246
Agnieszka Ulfik
Simulation of Markowitz’s portfolio selection using cellular automata
3. Portfolio analysis
According to theory of portfolio analysis we can predict future values of stock basing on his-
torical quotation. From this data is counted rate of return interpreted as expected profit and
standard deviation which is measure of dispersion and is interpreted as risk connected with this
expected profit. Investments are usually interested in shares with large profit and low risk level.
Portfolio analysis studies how these values will change if we will invest in more than one share.
This theory also shows how to choose assets during constructing portfolio to get diversified risk
which means that risk of portfolio would be lower than risk of shares that are this portfolio’s
components.
Harry Markowitz in 1952 had published his first paper about portfolio selection. It has started
a real revolution for capital markets and created completely new technique of making investment
decisions today, called portfolio analysis. Although this theory was showing how to choose the
best stocks to get the highest income with lowest level of risk, it was very hard to apply it in
practice because of computational complexity. After few years another scientist W. Sharp has
simplified this model and made portfolio analysis able to apply in practice. He has added to this
theory two coefficients giving investors a clear hint which stocks are giving better results than a
general tendency on considered market. As factor reflecting market tendency he has suggested
stock exchange index. On stock market in Poland investors most commonly use Warsaw Stock
Exchange Index for this purpose.
4. Rate of return and risk
In classical Markowitz’s model of portfolio selection the most important profiles of assets are
rate of return and standard deviation. These two values have to be calculated for all shares taken
by investor into consideration. Positive value of rate of return is interpreted as expected profit and
negative value – as expected loss. This quantity is count in period of time t with following formu-
la:
1
1
−
+−−=
tP
tDtPtPtR
where:
Rt – the rate of return in period t,
Pt – the price of securities in period t,
Pt -1 – the price of securities in period t -1,
Dt – paid - out dividend in period t.
Rate of return is appointed for every period of time t, there for it becomes function of time.
The real value of income depends on many factors and investor cannot be sure that he will get
calculated profit. This is the reason that we use expression: expected rate of return. It is counted
with following formula:
N
R
R
N
t
t�== 1

247
POLISH ASSOCIATION FOR KNOWLEDGE MANAGEMENT
Series: Studies & Proceedings No. 42, 2011
where:
R – expected rate of return from securities,
Rt – the rate of return in period t,
N – number of all analyzed rates of return.
Definite in this way level of profit or loss always is accompanying the investment risk. Risk in
portfolio analysis is calculated using statistics. Standard deviation is interpreted as amount of risk.
Below is shown formula to calculate variation of stock’s rate of return.
( )�=
−⋅−
=n
t
t RRn
S1
22
1
1
where:
S2 – the variation of rate of return,
R, Rt – as above,
n – number of all analyzed rate of return.
S – standard deviation of rate of return.
5. Map of risk and income
Both values: expected income and risk can be shown on a graph. It is called map of risk and
income. This graph makes possible retrieval companies with possibly lowest risk and largest
income. Figure 1 shows general schema of map risk and income with division into quarters.
Figure 1. Map of risk and income with division into quarters
Source: Own study.
In the center of figure 1 we can see point that shows characteristics of index. In Warsaw Stock
Exchange investors most commonly choose index WIG or WIG20 as an image of an average
R –
rat
e o
f re
turn
II I
(Sindex, Rindex)
III IV
(0, 0) S - risk

248
Agnieszka Ulfik
Simulation of Markowitz’s portfolio selection using cellular automata
situation on stock market. First quarter of map includes securities with risk and rate of return
higher than those characteristics calculated for index. Securities in this quarter are interesting for
aggressive investors, willing to take extra risk but also expecting additional income. Second
quarter is part of map with securities characterized by lower risk than risk of index and rate of
return higher than rate of return calculated for index. Those securities are the most interesting for
all investors, because they most probably will give extra profit without extra risk. Third quarter
contains securities with risk lower than risk calculated for index, but at the same time rate of return
also lower for rate of return calculated for index. This quarter contains securities good for inves-
tors that are very careful and don’t like to take additional risk. Fourth quarter is part of map of risk
and income containing securities worst for all investors, because there are securities with risk
higher than risk calculated for index and rate of return lower than rate of return calculated for
index.
Figure 2 represents map of risk and income for all securities quoted on Warsaw Stock Ex-
change counted with one year history in period from 1st April 2009 till 1st April 2010. Figure 3
represents map of risk and income for all securities quoted on Warsaw Stock Exchange counted
with two years history in period from 1st April 2008 till 1st April 2010. On both figures there is
also marked index WIG, as a central point of those graphs. As it was shown by many authors, too
long history can include information that don’t have any influence on current situation. Because of
that there is no point of calculating rate of return and standard deviation on very long quotation
history, especially of late crisis on financial markets.
Figure 2. Map of risk and income for companies on Warsaw
Stock Exchange and WIG with one year history, form 01.04.2009 to 01.04.2010.
Source: Own study.
���
���
��
��
���
�� �� ���
����������������
� � ����
249
POLISH ASSOCIATION FOR KNOWLEDGE MANAGEMENT
Series: Studies & Proceedings No. 42, 2011
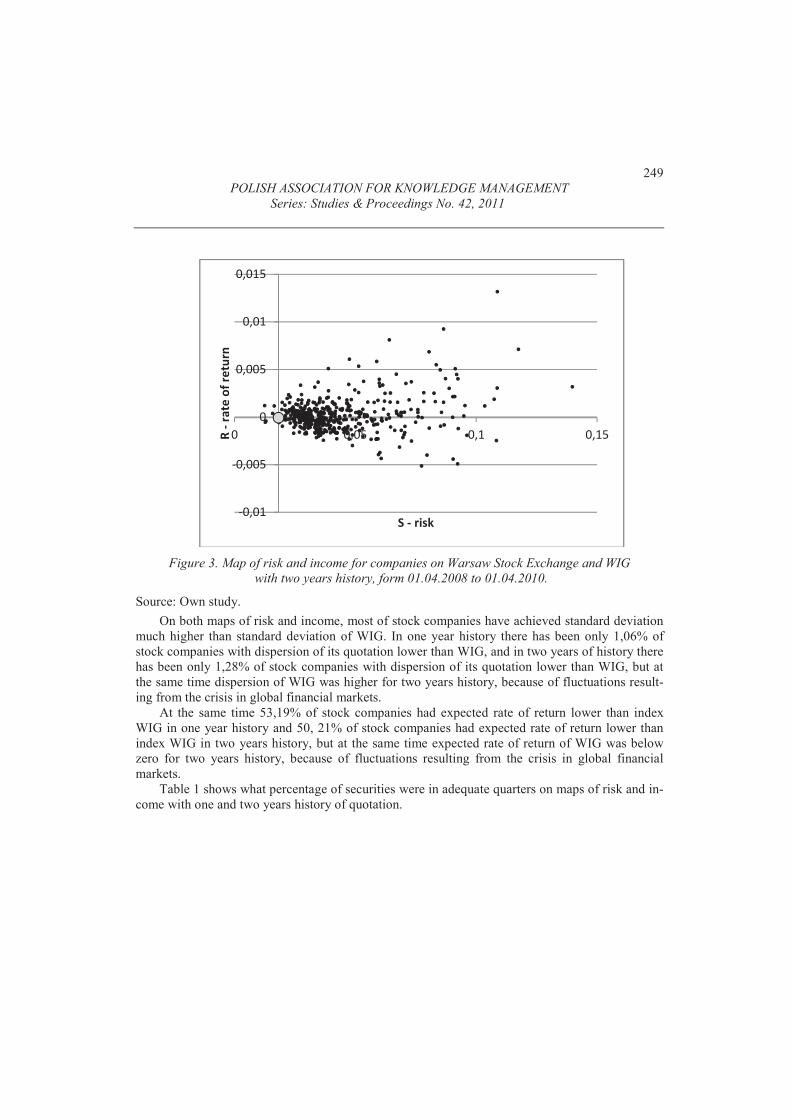
Figure 3. Map of risk and income for companies on Warsaw Stock Exchange and WIG
with two years history, form 01.04.2008 to 01.04.2010.
Source: Own study.
On both maps of risk and income, most of stock companies have achieved standard deviation
much higher than standard deviation of WIG. In one year history there has been only 1,06% of
stock companies with dispersion of its quotation lower than WIG, and in two years of history there
has been only 1,28% of stock companies with dispersion of its quotation lower than WIG, but at
the same time dispersion of WIG was higher for two years history, because of fluctuations result-
ing from the crisis in global financial markets.
At the same time 53,19% of stock companies had expected rate of return lower than index
WIG in one year history and 50, 21% of stock companies had expected rate of return lower than
index WIG in two years history, but at the same time expected rate of return of WIG was below
zero for two years history, because of fluctuations resulting from the crisis in global financial
markets.
Table 1 shows what percentage of securities were in adequate quarters on maps of risk and in-
come with one and two years history of quotation.
���
���
��
��
���
�� �� �������������������
� � ����

250
Agnieszka Ulfik
Simulation of Markowitz’s portfolio selection using cellular automata
Table 1. Percentage of securities in quarters on maps of risk and income
with one and two years history
Quarter of map risk and
income 1 year history 2 years history
I 53,2% 49,4%
II 0% 0,8%
III 1,1% 0,4%
IV 45,7% 49,4%
Source: Own study.
Second quarter of map of risk and income which is the most interesting for investors is empty
or almost empty. It means that investors don’t have easy task, to chose securities to invest.
6. Two element portfolios
Expected rate of return and standard deviation are two basic characteristics of individual secu-
rities. When we consider more than one security there is one more important value. It is the
coefficient of correlation between two securities. It defines connection of rates of return of two
stocks. The coefficient of correlation can be calculated by following formula:
( ) ( )
21
1
2211
12SS
RRRRn
i
ii
⋅
−⋅−
=�
=ρ
where:
12ρ – coefficient of correlation of rates of return of stock 1 and 2,
R1i – rate of return in period i,
R1 – expected rate of return from first stock,
S1 – standard deviation of rate of return first stock,
R2i, R2, S2 – the same for second stock,
n – number of all analyzed rate of return.
Investors are seeking the possibility of investing capital in stocks with high rate of return.
However these securities very often characterize with high level of risk. For investor will be
interesting such investments, in which with growth of rate of return, the risk will go down. The
portfolio analysis gives us such possibility.
Portfolio is set of stock, which we have or we want to buy. The rate of return of portfolio is
the sum of rates of return individual values multiplied by their parts in investment.
BBAAp RxRxR ⋅+⋅=
where:
Rp – the rate of return from two component portfolio,
xA – the part of share A in portfolio,
RA – the rate of return of stock A,
xB, RB – the same for stock B,

251
POLISH ASSOCIATION FOR KNOWLEDGE MANAGEMENT
Series: Studies & Proceedings No. 42, 2011
where 10 ≤≤ Ax , 10 ≤≤ Bx , 1=+ BA xx .
Calculations of risk for two elements investment portfolio are more complicated. Variation of
two component portfolio is define as:
ABBABABBAAp rSSxxSxSxS ⋅⋅⋅⋅⋅+⋅+⋅= 222222
where:
Sp2 – variation of investment portfolio,
xA, xB, RA, RB – as before,
rAB – the coefficient of correlation between the rate of return of stock A and B.
Sp – standard deviation of two component portfolio.
7. Many elements portfolios.
For more than two elements of portfolio, formulas for are as follow:
�=
⋅=N
i
iip RxR1
���− ==
⋅⋅⋅⋅⋅+⋅=N
i
N
j
ijjiji
N
i
iip rSSxxSxS1 11
222 2
Formulas above show computational complexity of problem of selection effective portfolios.
Portfolio is effective when rate of return higher than any other portfolio with the same risk, or
level of risk is lowest from portfolios with the same rate of return.
8. Effective portfolios
As it is written in literature, portfolio is effective when rate of return is higher than for any
other portfolio with the same risk or level of risk is lowest from portfolios with the same rate of
return.
Problem of selection of effective portfolio is not simple in spite of existence of theoretical so-
lution. With choosing portfolio investor has to first choose securities in which he wants to invest,
and then establish how the invested capital will divided among securities.
Sharpe measure of portfolio effectiveness value is also called the Sharpe efficiency of the
portfolio. It is quotient of risk premium achieved by the portfolio and risk of the total portfolio
which has been taken. It can be calculated with the following formula:
( )( )J
FJJ
SE
RRESH
−=
where:
SHJ – Sharpe measure of portfolio effectiveness value,
E(RJ) – the value of the expected rate of return on portfolio J,
RF – risk-free rate of return,
SJ – standard deviation of portfolio returns J.
The higher is the value of this measure, the better the quality of portfolio management. Portfo-
lios lying on the line of greatest slope in the total system risk are preferred additional income.

252
Agnieszka Ulfik
Simulation of Markowitz’s portfolio selection using cellular automata
9. Simulations
Between 1st April 2009 and 1st April 2010 on Warsaw Stock Exchange there were 470 stock
companies that had enough long history, to be able to calculate their characteristics that gave
reasonable information for investors. For simulation were chosen all quotation with at least 70
quotation history in examined time.
To find effective portfolio it was necessary to establish work of CA and their three basic pa-
rameters: type of cells, starting value and function of passage from one iteration to the other. In
suggested solution all cells of cellular automata work collectively exchanging information between
each other.
All cells of CA have one aim: choose the effective portfolio so they have to include infor-
mation about composition of this portfolio and during iterations improve it. To be able to choose
portfolio, they also have to have access to all input data. Every cell can be interpreted as artificial
investor choosing the efficient portfolio. This artificial investor is working on his own choosing
the best result but at the same time he exchanges all information with other artificial investors
which are in CA arranged in grid.
At the beginning of simulation all cells of CA get randomly chosen portfolio. Sample random-
ly chosen portfolios used for simulations are shown on figure 4 on map risk and income. In the
center of this graph there are characteristics of index WIG.
Figure 4. Map of risk and income of randomly chosen portfolios
used for simulations and index WIG
Source: Own study.
Cellular automata after getting randomly chosen portfolios, calculates basic characteristics of
portfolios: rate of return and standard deviation. Then every cell communicates with its neighbours
with Moore’s or von Neumann’s. If in another cell there is portfolio with better characteristics
(with given criteria) then cell gets this portfolio from its neighbour. If portfolios in adjoining cells
���
���
���
��
��
��
��
��
���
���
�� �� �� �� �� ���
�����������������
��� ����

253
POLISH ASSOCIATION FOR KNOWLEDGE MANAGEMENT
Series: Studies & Proceedings No. 42, 2011
have worst characteristics (comparing with given criteria), then cell stays with its original portfo-
lio. In next step all cells work individually by looking for new portfolio with given criteria. They
get this portfolio as completely new, randomly chosen one. If new portfolio is better it stays as
current one if not, then it is passed over. This is repeated until all cells in CA get the same effec-
tive portfolio.
Simulation were done in application written in Borland C++ Builder by author. In those simu-
lations were used two-dimensional CA with 10 000 cells (100 rows and 100 columns in two
dimensional grid). The aim of this simulation was achieving stable state by cellular automata, in
which all cells have the same portfolio. This simulations were repeated several times with neces-
sary number of iteration. In cells portfolios changed when new randomly chosen portfolio was
better comparing to given criteria then present one.
In simulation as main aim was assumption to achieve portfolio with maximum income and
risk as less as it is possible. On figure 5 we can see results of 30 simulations on map risk and
income, together with index WIG. All results were unique and often did not appear in next execu-
tion of simulation even though input data were the same.
Figure 5. Map of risk and income of portfolios chosen by cellular automata
in simulations and index WIG
Source: Own study.
Because aim was to have maximum income in all portfolios cellular automata has chosen,
have rate of return higher than rate of return calculated for index WIG. At the same time those
portfolios have lowest risk comparing to all randomly chosen portfolios.
��
��
��
��
��
���
���
�� �� �� �� �� ���
�����������������
��� ����

254
Agnieszka Ulfik
Simulation of Markowitz’s portfolio selection using cellular automata
10. Conclusions
Aim of this work was to present methods of simulation of Markowitz’s portfolio selection us-
ing cellular automata.
On 1sth March 2006 on Warsaw Stock Exchange there were quotation of 248 joint-stock
companies. We have chosen 10 companies to simplified simulation of portfolio selection process.
Criterions of choosing portfolios were: high value of expected rate of return and low value of
standard deviation. Companies and portfolio with such characteristics are most interesting for
investors that want to have high level of income from its portfolio and they don’t want to take
height level of risk. All characteristics were counted basing on one year history of quotation from
1st April 2009 to 1st April 2010. Longer history is very commonly used but if we consider world
financial market crisis, longer history would now only disturb proper view of characteristics and
current situation.
Conducted simulations confirmed that cellular automata can select portfolio on stock market,
basing on classical Markowitz’s model of portfolio analysis using collective work of cells. All
portfolios obtained in simulation were different in every simulation.
[1] Baldwin J. T., Shelah S. On the classifiability of cellular automata, Theoretical Computer
Science, 2000, Vol. 230, Issue 1–2: s. 117–129.
[2] Haugen R. Nowa nauka o finansach, WIG–Press, Warszawa 1999: s. 828.
[3] Jajuga K., Jajuga T., Inwestycje, Wydawnictwo Naukowe PWN, Warszawa 2005: s. 230.
[4] Kari Jarkko, Theory of cellular automata: A survey, Theoretical Computer Science, 2005,
Vol. 334, Issue 1–3: s. 3–33.
[5] Katkow A., Ulfik A., Network Implementation of Investment Management, Elektronnoe
modelirovanie, 2007, T. 29 No 4: s. 7–17.
[6] Katkow A., Ulfik A., Simulation of Process of Portfolio Management Using Cellular
Automata, Sbornik trudov konferencii MODELIROVANIE – 2006, Simulation, Ukraine,
Kijev 2006: s. 47–52.
[7] Markowitz H., Portfolio selection, Journal of Finance, 1952: s. 77–91.
[8] Sharpe W., A Simplified Model For Portfolio Analysis, Management Science, 1963, Vol. 9,
Issue 2: s. 277–293.
[9] Ying Fan, Shang–Jun Ying, Bing–Hong Wang, Yi–Ming Wei, The effect of investor
psychology on the complexity of stock market: An analysis based on cellular automaton
model, Computers & Industrial Engineering 56, 2009: s. 63–69.

255
POLISH ASSOCIATION FOR KNOWLEDGE MANAGEMENT
Series: Studies & Proceedings No. 42, 2011
SYMULACJA DOBORU SKŁADNIKÓW DO PORTFELA INWESTYCYJNEGO MARKOWITZA Z U�YCIEM AUTOMATÓW KOMÓRKOWYCH
Streszczenie
Artykuł przedstawia symulacj� procesu doboru elementów do portfela inwesty-
cyjnego z zastosowaniem teorii klasycznego portfela Markowitza, u�ywaj�c do tego
równoległego �rodowiska obliczeniowego – automatu komórkowego.
H. Markowitz opublikował pierwsz� prac� na temat teorii portfelowej w 1952
roku, w której to rozpatrywał dwa kryteria: ryzyko i stop� zwrotu. Po ponad pół
wieku, ta teoria nadal nie jest szeroko stosowana w czystej postaci. Problem stanowi
zło�ono�� obliczeniowa.
Zaproponowanym rozwi�zaniem tego problemu jest równoległe �rodowisko ob-
liczeniowe – automat komórkowy z u�yt� sztuczn� inteligencj�.
Stworzone zostały modele funkcjonowania automatu komórkowego ze zdolno-
�ci� do wykonywania oblicze� prowadz�cych do maksymalizacji oczekiwanej stopy
zwrotu lub minimalizacji ryzyka inwestycji giełdowej. W ró�nych modelach komórki
komunikuj� si� ze sob� w ró�ny sposób, wymieniaj�c tym samym informacje. Ró�ne
modele daj� ró�ne rezultaty z ró�nymi danymi wej�ciowymi. Porównano symulacje
przeprowadzone zgodnie z poszczególnymi modelami. Dane u�yte do symulacji to
dane pochodz�ce z Giełdy Papierów Warto�ciowych w Warszawie.
Na pocz�tku artykułu jest przedstawiona klasyczna teoria analizy portfelowej
Markowitza wraz ze wszystkimi wzorami u�ytymi w trakcie oblicze�. W dalszej cz�-
�ci przybli�ono zagadnienie automatu komórkowego wraz ze zdolno�ci�
do przeprowadzenia oblicze�. Póniej zaprezentowano symulacje (ze wszystkimi za-
ło�eniami) oraz ich rezultaty. Symulacje s� przeprowadzone na danych
pochodz�cych z polskiej giełdy. Wszystkie obliczenia s� przeprowadzone przez au-
torski program komputerowy napisany w �rodowisku Borland C++ Builder.
Wnioski zaprezentowano na ko�cu artykułu.
Słowa kluczowe: wybór portfela, analiza portfelowa, zarz�dzanie portfelem inwestycyjnym,
automat komórkowy, symulacje, giełda, Giełda Papierów Warto�ciowych
w Warszawie
Agnieszka Ulfik
Instytut Ekonometrii i Informatyki
Wydział Zarz�dzania
Politechnika Cz�stochowska
e-mail: [email protected]