simulation of primary production and export fluxes in...
TRANSCRIPT

Simulation of primary production and export uxesin the Northwestern Mediterranean Sea
by Marina Levy1 Laurent Memery1 and Jean-Michel Andre2
ABSTRACTA biogeochemical model BIOMELL (BIOgeochemical Model of the Euphotic Layer of Lodyc)
has been developed to simulate the temporal evolution of the main nitrogen stocks and uxes at theDyFAMed station (Dynamiquedes FluxAtmospheriquesen Mediterranee) located in the Northwest-ern Mediterranean Sea This mainly oligotrophic region is characterized by a strong seasonal cycleand a signi cant export of dissolved organic matter compared to the particulate export measured bysediment traps Validation of the model is made using temperature nitrate and chlorophyll pro lesacquired at DyFAMed approximatelyevery month in 1991 Extended datasets from speci c years arealso used to validate seasonal variationsof other variables for which the coverage in 1991 was ratherpoor (new and total production particulate export dissolved organic matter export bacteriazooplankton)Sensitivity studies on selected parameters are carried out in order to give an idea of themargin of error in the model predictions The model is then used to analyze the behavior of thebiogeochemical system during various production regimes (winter spring bloom oligotrophyautumn bloom) It is shown that several processes which are often neglected in biogeochemicalmodels must be taken into account phytoplankton growth limitation by deep mixing CChl ratiodependence on light nitri cation and semi-refractory dissolved organic matter accumulation in thesurface layer
1 Introduction
The role of the ocean as regards carbon dioxide assimilation is a key questionconcerning climatic and environmental changes (Houghton et al 1990 Siegenthaler andSarmiento 1993) Within the ocean primary production and export uxes are thebiological processes that ought to be understood and evaluated As a matter of facttogether with oceanic dynamics they control total inorganic carbon content of the mixedlayer which is directly in contact with the atmosphere and thus the carbon dioxideexchange between the ocean and the atmosphere (Longhurst and Harrison 1989)
Due to seasonal and regional variations of the climatic forcings and oceanic dynamicsvarious speci c regimes of primary production take place in the world ocean for instancethe oligotrophic subtropical gyre systems the upwelling areas the large-scale spring
1 LODYC Universite Pierre et Marie Curie 5 Place Jussieu 75252 Paris Cedex 05 France2 ORSTOM Centre de Noumea Noumea Cedex New Caledonia
Journal of Marine Research 56 197ndash238 1998
197
blooms or the winter regime in convective regions In order to build realistic dynamical-biological coupled models of the world ocean each regime must be understood In thisrespect the Mediterranean Sea can be considered as an interesting target as several of theseregimes can be found in a rather small area In particular in the northern basin deepconvection occurs during winter leading to a spring bloom Oligotrophy prevails duringsummer while perturbations in the meteorological forcing generate a secondary bloom infall Another reason for dedicating a study to the Mediterranean Sea is that it is relativelywell known More speci cally the Dynamique des Flux Atmospheriques en Mediterranee(DyFAMed) program part of the France-Joint Global Ocean Flux Study (France-JGOFS)provides a rich dataset of biological geochemical and physical parameters which allowedus to carry out and validate simulations (Marty 1993)
The aim of the present work is to achieve a 1D modeling study throughout the annualcycle in the Northwestern Mediterranean Sea paying particular attention to physicalcontrols on primary production and export uxes Several biogeochemical models of thecarbon nutrients and plankton cycles have already been published (Fasham et al 1990hereafter FDM McGillicuddy et al 1995) but failed in predicting correct export uxesThe present modeling relies essentially on these models with an improved description ofparticulate and dissolved matter uxes exported from the surface layer
First we present a brief description of the dynamics in the Northwestern Mediterraneanand of the main features concerning primary productivity based on recent in situmeasurements Then a detailed description of the BIOgeochemical Model of the EuphoticLayer of Lodyc (BIOMELL) is provided Finally we simulate an annual cycle at theDyFAMed station and perform model sensitivity studies The behavior of the model duringthe various production regimes is validated and analyzed
2 Present knowledge
a The hydrological and productivity characteristics of the region
The DyFAMed station is located 52 km southeast of Nice at 43deg25N 07deg52E (Fig 1)2350 m deep it is in the central zone of the Ligurian Sea the northeastern part of theWestern Mediterranean Sea bounded by the French (Provence Corsica) and Italian (Gulfof Geneva) coasts The circulation of the Ligurian Sea is characterized by a permanentcyclonic gyre (Millot 1987) The Ligurian Current ows along the coast inside a stripabout 30 km wide It is separated from the offshore central zone by a frontal zone identi edby a rapid horizontal change of densityThe DyFAMed station is far enough away from theLigurian Current to be sufficiently protected from lateral transport and to justify a 1D study(Marty 1993) The density structure of the zone has the shape of a dome with minimalstrati cation at the center In winter a succession of strong and dry continentalwind eventsoccurs over the gyre The surface strati cation is progressively eroded in the vortex centerIntense vertical convection occurs within the central zone mixing the cool dense surfacewater and the underlying saltier Levantine intermediate water This mixing results in local
198 Journal of Marine Research [56 1
deep water formation typical of the western basin (Medoc group 1970) This processachieved through baroclinic instabilities (Gascard 1978) emphasizes the limits of theone-dimensional behavior of the water column physics at DyFAMed
The winter mixing also brings nutrients into the upper layer However the shortresidence time of algae in this layer swept along by the vertical water motions prevents thedevelopment of biomass (hereafter referred as lsquolsquodeep-mixing limitationrsquorsquo process Andre1990) Short periods of stabilization during winter (due to good weather conditions) canoccur and are associated with short-lived diatom blooms (DyFAMed 1995) Progressing inthe year the surface layer becomes stable over a longer period thus allowing the winternutrient enrichment to be utilized continuously As a consequence algae are bloomingFrom Coastal Zone Color Scanner (CZCS) observations Morel and Andre (1991) haveobserved this change of regime between early April and mid-May After mid-May anduntil November the situation remains steady The upper layer nutrient content is very lowthe system is mainly oligotrophic and characterized by a deep chlorophyll maximum(DCM) (Jacques et al 1976) As the heat budget becomes negative in late autumn thethermocline begins to erode which brings nutrients again into the upper layer and allows asecondary bloom to occur This autumnal bloom is less extended than the spring bloomwith lower surface pigment concentrations (Morel and Andre 1991)
Figure 1 Location of the DyFAMed station This station is located outside the coastal Liguriancurrent and is typical of the offshore Northwestern Mediterranean Sea The main cycloniccirculation is shown by arrows The area over which ECMWF atmospheric model heat ux andwind data have been extracted for the use of this study is shown by the speckled square
1998] 199Levy et al Primary production model of NW Mediterranean Sea
b Primary production and export uxes in the Northwestern Mediterranean Sea
Primary or total production (TP) can be partitioned into new production (NP) suppliedby vertical transports of nutrients from below the euphotic layer and into regeneratedproduction (RP) based on nutrients recycled within the productive layer FollowingDugdale and Goering (1967) NP is associated with nitrate assimilation while RP is linkedto ammonium uptake However recent measurements in surface waters of the Mediterra-nean Sea show signi cant nitri cation rates which can be a source of locally recyclednitrate implying that nitrate utilization cannot be simply associated with NP (Gentil-homme 1992Ward 1986 Ward et al 1989) Evidence of apparent nitri cation in the rsthundred meters of the water column have also been reported in Eppley et al (1990) and inEppley and Koeve (1990) In the North Mediterranean Basin TP is about 80 gCm 2 2y 2 1
(Minas 1970) Based on phosphate or oxygen balance NP estimates are 12ndash35 gCm 2 2y 2 1
(Bethoux 1989) Nitri cation measurements in the Almeria-Oran frontal system (Bianchiet al 1993) shows that nitri cation may supply 40 of the nitrate assimilation in theeuphotic layer
At steady state the rate of new nitrogen assimilation (nitrate assimilation minusnitri cation) must equal the rate of nitrate supply and must be balanced by export It haslong been believed that this export is achieved largely by sinking particles (Eppley andPeterson 1979) The mean value of vertical ux of particulate organic carbon at 200 m for1987ndash1990 estimated from sediment traps is 4 gCm2 2 y 2 1 (Miquel et al 1994) But newobservations of the dissolved organic carbon (DOC) annual cycle show that the export ofDOC can equal or exceed the particle export caught in traps (Carlson et al 1994)Estimated DOC export (from DOC contents) is 148 gCm2 2 y 2 1 in the Mediterranean Sea(Copin-Montegut and Avril 1993) This large DOC export ux reconciles organic carbon ux estimates with NP data (Marty et al 1994a)
3 The BIOMELL
a General presentation
Most biogeochemical models follow the general structure of the FDM model (Drange1994 Prunet et al 1996) They consist of different compartments describing nitrateammonium phytoplankton zooplankton bacteria detritus and dissolved organic matter(DOM) and use nitrogen as currency Interactions among these compartments aredesigned to represent the main biogeochemical processes BIOMELL is in the line of thesemodels and has been developed more speci cally to represent adequately the processesinvolved in primary production and export uxes that are believed to be important in theMediterranean Sea such as DOM export nitri cation and deep-mixing limitation and thatwere not treated in FDM To better represent the export of organic carbon from the surfacewaters the compartments involved in the export ie dissolved and particulate organicmatter have been reformulated As a result each organic matter compartment (particulateand dissolved) is divided into two subcompartments The particulate compartment isdivided into small and large detritus subcompartments and the DOM compartment is
200 Journal of Marine Research [56 1
divided into refractory DOM and labile DOM The small detritus and the labile DOMconcern mostly regeneration The large detritus comparable to the matter measured insediment traps and the refractory DOM that accumulates in the mixed layer until thewinter destrati cation represent the basic pools implied in export uxes
b The biogeochemical processes and the associated equations
A schematic representation of the compartments and processes involved in BIOMELL isshown Figure 2 (corresponding equations are given Table 1) All biogeochemical concen-trations are submitted to vertical mixing
i Nutrients (Eq 1ndash2) In order to discriminate between new and regenerated production(Dugdale and Goering 1967) the model deals with two nutrients nitrate as supporting NP(as far as local nitri cation does not occur) and ammonium as supporting RP Nitrate ismainly supplied to the productive layer by winter convection (through mixing processes)but also by nitri cation At steady state these supplies are balanced by phytoplanktonuptake Ammonium is produced by bacteria mortality and zooplankton excretion It isuptaken by phytoplanktonand bacteria It contributes to nitrate production by nitri cationDependent nitrate and ammonium uptakes are parameterized according to Hurtt andArmstrong (1996) This parameterizationuses only one parameter (half-saturation constant
Figure 2 Schematic representationof the compartments and processes of the BIOMELL
1998] 201Levy et al Primary production model of NW Mediterranean Sea
Table 1 Equations 1 to 10 describe the temporal partial derivatives of respectively nitrate(NO3) ammonium (NH4) phytoplankton (P) microzooplankton (Zs) mesozooplankton(Zl) bacteria (B) small detritus (Ds) large detritus (Dl) labile dissolved organic matter(DOMl) and refractory dissolved organic matter (DOMr) The rst term on the right-hand side of these equations accounts for vertical mixing (kz being the vertical diffusioncoefficient) The other terms are the biogeochemical sinksource terms that distributenitrogen between compartments Eqs 11 to 16 describe the computation of theCarbonChlorophyll ratio Eqs 17 to 27 de ne the notations that are being used inequations 1 to 10 (except for the parameters that are de ned Table 2)
shy tNO3 5 shy z (kz shy zNO3) 2 JLno3LMP 1 Rnh4
LTNH4 (1)
shy tNH4 5 shy z (kz shy zNH4) 2 JLnh4LMP 2 U nh4 2 Rnh4
LTNH4
1 e zlmicrozl
Zl 1 e zsmicrozs
Zs 1 mbB 1 h G zs
b R cnbacR cn
phy (2)
shy tP 5 shy z (kzshy zP) 1 (1 2 g )J (Lno31 Lnh4
)LMP 2 G zs
p 2 G zl
p 2 mpP (3)
shy tZs 5 shy z (kz shy zZs ) 1 a zs
p G zs
p 1 (a zs
b 2 h R cnbacR cn
phy )G zs
b 1 a zs
dsG zs
ds 2 microzsZs 2 mzs
Zs 2 G zl
zs (4)
shy tZl 5 shy z (kz shy zZl ) 1 a zl
pG zl
p 1 a zl
zsG zl
zs 1 a zl
dsG zl
ds 2 microzlZl 2 mzl
Zl (5)
shy tB 5 shy z (kzshy zB) 1 U nh4 1 U doml 2 mbB 2 G zs
b (6)
shy tDs 5 shy z (kzshy zDs) 1 (1 2 a zs
p )G zs
p 1 (1 2 a zs
b )G zs
b 1 (1 2 a zs
ds )G zs
ds
1 mpP 1 mzsZs 1 mzl
Zl 2 microdsDs 2 G zl
ds 2 G zs
ds 2 Vdsshy zDs
(7)
shy tDl 5 shy z (kzshy zDl) 1 (1 2 a zl
zs )G zl
zs 1 (1 2 a zl
p )G zl
ps 1 (1 2 azl
ds)Gzl
ds 2 microdlDl 2 Vdl
shy zDl (8)
shy tDOMl 5 shy z(kzshy zDOMl ) 1 (1 2 e zl) fdoml
microzlZl 1 (1 2 e zs
) fdomlmicrozs
Zs
1 fdomlg J (Lno3
1 Lnh4)LMP 1 fdoml
microdsDs 1 fdoml
microdlDl 1 microdomr
DOMr 2 U doml(9)
shy tDOMr 5 shy z (kz shy zDOMr ) 1 (1 2 e zl)(1 2 fdoml
)microzlZl 2 microdomr
DOMr
1 (1 2 e zs)(1 2 fdoml
)microzsZs 1 (1 2 fdoml
) g J (t z)(Lno31 Lnh4
)LMP
1 (1 2 fdoml)microds
Ds 1 (1 2 fdoml)microdl
Dl
(10)
minimal ChlorophyllNitrogen ratio R chlnmin 5 12R cn
phyR cchlmax (11)
maximal ChlorophyllNitrogenratio
R chlnmax 5 12R cn
phyR cchlmin (12)
optimal ChlorophyllNitrogen ratiowhen PUR PURmax
Rchln 5 R chlnmin
Rchln 5 1 R chlnmax 2 (R chln
max 2 R chlnmin )
PUR
PURmax2 (13)
202 Journal of Marine Research [56 1
Table 1 (Continued)
optimal ChlorophyllNitrogen ratiowhen PUR PURmax
middotNO3 1 NH4
Knh41 NO3 1 NH4
(14)
ChlorophyllNitrogen ratio shy tRchln 5(Rchln 2 Rchln )
J(Lno31 Lnh4
)LM(15)
CarbonChlorophyll ratio Rcchl 5 12R cnphyRchln (16)
nitrate limitation on phytoplanktongrowth
Lno35
Knh4NO3
(Knh41 NH4)(Knh4
1 NO3 1 NH4 )(17)
ammonium limitation on phyto-plankton growth
Lnh45
NH4
NH4 1 Knh4
(18)
temperature limitation on phyto-plankton growth LT 5 aT
(T2 T opt) (19)
deep mixing limitation on phyto-plankton growth
LM depends on mixed layer and euphoticlayer depths (see text for more details)
(20)
light dependent phytoplanktongrowth
J 5 12Rc-chl amaxc micro max 3 KPUR opt
3 LT 3 (1 2 e 2 PURKPUR opt 3 LT )
3 e 2 b 3 PURKPURopt3 LT
(21)
grazing (Y 5 P B Zs or Ds andX 5 Zs or Zl)
GXY 1 gX fTX
pXYY
KX 1 FX
(22)
preferences (Y 5 P B Zs or Ds andX 5 Zs or Zl)
pXY 5
p XY
SY
p XYY (23)
total food availability (Y 5 P B Zs
or Ds and X 5 Zs or Zl)FX 5 S
YpX
YY (24)
temperature limitation onzooplankton grazing fT 5 1
Tmax 2 T
Tmax 2 Topt 2(Tmax 2 Topt)Rg
exp 1T 2 Topt
Rg 2 (25)
substrate for bacteria S 5 min (NH4 h DOMl) (26)
ammonium bacterial uptake U nh4 5 LTVbBS
Kb 1 S (1 1 1 h )(27)
labile DOM bacterial uptake U doml 5 LTVbBSh
Kb 1 S (1 1 1h )(28)
1998] 203Levy et al Primary production model of NW Mediterranean Sea
for ammonium) compared to three in the more classical representation by FDM (half-saturation constant for nitrate and for ammonium and ammonium inhibition parameter)and keeps the inhibition effect of ammonium on nitrate uptake meaning that phytoplank-ton preferentially takes up ammonium (Eq 17ndash18) in agreement with data (Harrison et al1996)
ii Phytoplankton (Eq 3) A unique generic phytoplankton compartment is consideredThis can be a limitation when dealing with the spring succession from large fast sinkingdiatoms to small slowly sinking cells (Raimbault et al 1988) Nitrogen exudation asDOM is assumed to be a constant fraction of total net primary production The otherphytoplankton loss terms are grazing by zooplankton and natural mortality Mortality isde ned by a constant rate and fuels the small detritus compartment
The photosynthetic growth rate (in carbon unit per chlorophyll unit) is modeledaccording to Morel (1991) (Eq 19ndash21) as a function of the Photosynthetic UsableRadiation (PUR) computed from the Photosynthetic Available Radiation (PAR) using amean absorption spectrum The PAR is predicted as a function of phytoplankton pigmentcontent according to the spectral algorithm of Morel (1988) The growth rate is convertedto s 2 1 using time dependent CChl ratios (Eq 21) Following Doney et al (1996) theCChl ratio is driven by irradiance and nutrient concentrations In BIOMELL this ratio isdamped toward a local CChl value which varies with the mean PUR of the previous dayrsquossunlight hours The time constant of this damping is given by the growth time ofphytoplankton (Eq 15ndash16) which is considered as the adaptation time of the planktonicbiomass Its order of magnitude is equal to about one day Above a threshold value of thePUR (PURmax) this parameter is set to its maximum value RCChlmax (Eq 11ndash13) Belowthat level the CChl ratio decreases with PUR bounded by a lower value RCChlmin (Eq11ndash12ndash14)
The inhibition of primary production when the mixed layer is signi cantly deeper thanthe euphotic layer has been observed earlier (Gran and Braarud 1935 Riley 1942)Sverdruprsquos (1953) model gave the rst statements allowing the growth of an algalpopulation to be diagnosed as a function of the mixed layer depth to the compensationdepth ratio Previous studies (Woods and Onken 1982 Yamazaki and Kamykowski 1991)used a Lagrangian approach to model cell trajectories in the light gradient and gave somequantitative insight on the biological response to deep vertical mixing Their resultshowever do not provide a simple representation for prediction of growth rates as a functionof photosynthetic capacity and of vertical mixing intensity during winter Such a simpleparameterization can be developed on the basis of Andrersquos (1990) study of the Northwest-ern Mediterranean winter regime His work assumes that only the fraction of the populationthat spends enough time in the euphotic layer to insure cell division contributes to theglobal growth the rest being swept away into the dark part of the mixed layer whererespiration prevails In the frame of 1D vertical homogeneous turbulent diffusion anensemble Lagrangian approach allowed this fraction (LM) to be computed as a function of
204 Journal of Marine Research [56 1
the vertical diffusion coefficient (kz) for typical values of doubling time and euphotic layerdepth (ZE) when the mixed-layer depth (ZM) is signi cantly deeper (ZM 2ZE) Withdoubling times of 1ndash2 days ZE in the range of 50 to 100 m and kz of 10 2 3 to 102 1 m2 s 2 1 LM
varies between 0 and 30 In order to integrate these results in an Eulerian model it wasthen assumed that the actual population growth rate in the euphotic layer is given by themaximal growth rate J (Eq 21 controlled by the mean irradiance in this layer) correctedby the fraction LM of the cells which actually growth and divide at this rate (Eq 3) In thepresent study we assume that LM remains constant when ZM 2ZE and equal to a typicalvalue of 10 Moreover in order to cover the transition period between the pure winterregime (ZM 2ZE) and the bloom regime (ZM ZE) we assume that LM varies linearlywith ZMZE from 10 to 100 A sensitivity study to this parameterization is presented inSection 5
iii Zooplankton (Eq 4ndash5) The need to explicitly represent the detritus export as seen bysediment traps (large particles) has motivated the choice of two zooplankton compart-ments We name these microzooplankton and mesozooplankton with the followingfunctional de nitions microzooplankton feed on phytoplankton bacteria and detritusmesozooplanktonfeed on phytoplanktonmicrozooplanktonand detritus and contribute tothe sinking export The formulation of the grazing terms (Eq 22) weighted foodpreferences (Eq 23) and total food availability (Eq 24) are conceptually similar for thetwo zooplankton compartments This formulation is basically that of FDM and relies onthe assumption that zooplankton feed preferentially on the most abundant food organismsThe zooplankton growth also depends on temperature following the Simonot (1988)function (Eq 25) The assimilated fraction of total grazing supports the growth while thenonassimilated fraction is excreted as fecal pellets Microzooplankton fecal pellets areentirely directed toward the small particle compartment whereas mesozooplankton fecalpellets are considered large particles Zooplankton liquid excretion is partitioned intoammonium and DOM As microzooplankton graze partly on bacteria (characterized by alow CN ratio) there is a surplus in nitrogen uptake compared to carbon as in Drange(1994) that surplus is directed toward the ammonium pool (last term of Eq 2) Zooplank-ton mortality represents natural mortality as well as predation by implicit higher predatorsZooplankton carcasses supply the small particle compartment To avoid zooplankton totalextinction during winter under a zooplankton concentration threshold (Z s
min and Z lmin for
micro and mesozooplankton respectively) excretion and mortality are set to zero
iv Bacteria (Eq 6) Bacteria in the model remineralize DOM into ammonium LabileDOM is uptaken following Eq 26ndash28 while an ammonium uptake is also considered (Eq26ndash27) to insure nitrogen balance Formulations of equations 26 to 28 comes from FDMcorrected by Drange (1994) based on considerations concerning CN ratios of bacteriaBacteria fuel the ammonium compartment by mortality and are grazed by microzooplank-ton
1998] 205Levy et al Primary production model of NW Mediterranean Sea
v Particulate organic matter (Eq 7ndash8) Detritus consists of fecal material and deadorganisms Their sizes and sinking velocities vary from several orders of magnitude (cfAndersen and Nival 1988b for a review) Previous studies (FDM Fasham et al 1993Prunet et al 1996 Sarmiento et al 1993) have shown that if only one size of detritus isconsidered its sinking velocity could entirely determine the ecosystem equilibriumMoreover Small et al (1987) have observed that tiny microzooplanktonpellets do not sinkbut are remineralizedor reingested in situ whereas pellet ux is achievedby mesozooplank-ton Thus in the present model the two detritus compartments differ by their speci cbreakdown rates and sinking velocities Only small detritus is grazed as large particlesrapidly sink out of the productive layer Small particle aggregation and large particledisaggregation are not considered here
vi Dissolved organic matter (Eq 9ndash10) The oceanic DOM pool is still poorly knownThe most labile molecules enter the so called lsquolsquomicrobial looprsquorsquo since they are easily brokendown by bacteria (Ducklow and Carlson 1992 Fuhrman 1992) while more refractorycompounds last long enough to be exported to the deep ocean where they are slowlyremineralized (over months to centuries Ducklow et al 1995) In spite of this diversityonly two DOM compartments will be considered in the present study labile DOMsupporting the microbial loop and refractory DOM exportable from the surface layer Inthe model total DOM produced by phytoplankton exudation release by zooplankton anddetritus breakdown is mainly directed to the labile pool and to a lesser extent to therefractory pool Refractory DOM removal from surface waters is carried out by verticaldiffusion and winter mixing Some degradation of refractory DOM to labile DOM isallowed
c Choice of the BIOMELL parameters for DyFAMed
The ecosystem equations contain about fty parameters which are listed in Table 2 withthe standard run values The physical and bio-optical parameters can be found in Gaspar etal (1990) and Morel (1988 1991) The assignment of values for biologicalparameters is adifficult task The most satisfactory way of approaching this issue is through dataassimilation (Prunet et al 1996) when the data coverage is good enough Taking intoaccount the large number of parameters at play and important gaps in the dataset (forzooplanktonor bacteria for instance) we have followed a more classical approach We useparameters for which either generic values (from FDM Prunet et al 1996) or speci cvalues for the Mediterranean Sea (from Andersen and Nival 1988ab) are available Theremaining parameters were tuned to predict the seasonal cycle of nitrogen for theDyFAMed station for which a signi cant amount of physical and biological data havebeen acquired since 1987 In the following particular attention is paid to the parameterswhich have been modi ed from the set given by Prunet et al (1996) and FDM
206 Journal of Marine Research [56 1
i Nutrient parameters Previous modeling studies have employed half-saturation con-stants for nutrients often larger than 01 mmole N m 2 3 (FDM Doney et al 1996 Prunet etal 1996) Larger values for nitrate than for ammonium were used despite the inhibitioneffect of ammonium on nitrate uptake However recent observations emphasize theoverestimation of these parameters and strong nutrient limitation even at the lowconcentrations of oligotrophic regimes is questionable (Harrison et al 1996) Moreoverassimilation of the BermudaAtlantic Time Series (BATS) data has led Hurtt and Armstrong(1996) from which the nutrient uptake formulation comes from to vary the half saturationconstant for ammonium (Knh4) from 001 mmoleN m 2 3 to 0002 mmole N m 2 3 whenadditional constraints on ammonium concentrations are used Therefore the value chosenhere (0007 mmoleN m 2 3) takes into account these considerations Results are notsensitive to Knh4 variations between 0004 and 001 mmole N m 2 3
ii Phytoplankton parameters At DyFAMed sediment trap data (Miquel et al 1994)indicate that the CN mole ratio is relatively constant It increases with depth from a meanof 73 at 80 m to 76 at 200 m and 84 at 2000 m presumably because of the fasterdegradation of nitrogen compounds relative to carbon In BIOMELL the classical meanvalue of 656 (10516) is adopted and is used to convert model outputs from nitrogen unitsto carbon units (Takahashi et al 1985) Note that this ratio does not appear in theequations even though the growth rate derived from Morel (1991) is in mgC (mgChl)2 1s 2 1while the model currency is nitrogen This difference in units implies that the phytoplank-ton growth rate must be divided by the CN ratio while phytoplankton biomass must bemultiplied by the same ratio before being converted to chlorophyll units by variable CChlratio The threshold value PURmax has been chosen empirically close to the KPURopt valueused in the bio-optical model The CChl ratio is bounded between 30 and 150 mgC(mgChl)2 1 which are in the range of extreme measured values (between 20 and 200 mgC(mgChl)2 1 Cloern et al 1995)
iii Zooplankton parameters Earlier studies have shown that model simulations are aboveall sensitive to grazing variations (Fasham 1995 Frost 1987) Here the microzooplanktongrazing rate has been tuned to obtain a satisfactory seasonal cycle of phytoplankton (cfsection 5) The value of 1 d 2 1 is held which is the value used in FDM and the upper valueconstrained to be compatible with the occurrence of a spring bloom in subarctic oceans(Fasham 1995) Zooplankton is assumed to feed preferentially on live matter Thereforetheir preference for detritus is set to 20 Moreover microzooplankton is assume to grazepreferentially on phytoplankton rather than on bacteria Nival et al (1975) reported wintervalues of larval abundance measured with 50 microm mesh size and found in units of nitrogena value of about 003 mmoleN m 2 3 On this basis considering that the mesh size samplesmainly mesozooplankton the winter threshold values for microzooplankton (Z s
min) andmesozooplankton(Z l
min) are set respectively to 00075 and 00225 mmole N m 2 3
1998] 207Levy et al Primary production model of NW Mediterranean Sea
Table 2 Parameters of the BIOMELL model togetherwith the values assigned for them inthe standard simulation Parameters for which sensitivity studies are discussed in thepaper are identi ed with an
Nutrients parametershalf-saturationconstant for ammonium Knh4 0007 mmole m 2 3
nitri cation rate Rnh4 005 d2 1
Phytoplankton parametersmaximal photosynthesisefficiency c micromax 007 moleC (mole quanta)2 1
gross absorption amax 32 m2 (gChl)2 1
minimum CarbonChlorophyll ratio R c-chlmin 30 mgC (mgChl)2 1
maximum CarbonChlorophyll ratio R c-chlmax 150 mgC (mgChl)2 1
maximum PUR for CChl adaptation PURmax 90 microE m 2 2 d 2 1
optimal PUR KPURopt 35 microE m 2 2 d 2 1
Photoinhibitionparameter b 001optimal photosynthesis temperature T opt 15 degCVanrsquot Hoff coefficient aT 1065phytoplanktonexsudation fraction g 005phytoplanktonmortality rate mp 0078 d2 1
phytoplanktonCN ratio R cnphy 657 moleC (mole N) 2 1
Zooplankton parametersoptimal temperature for zooplanktongrowth T opt 15 degCmaximal temperature for zooplanktongrowth Tmax 35 degCwidth of zooplankton temperature function Rg 20 degCmicrozooplanktonmaximum grazing rate gzs 10 d2 1
half saturation constant for microzooplanktongrazing Kzs
1 mmole N m 2 3
mesozooplanktonmaximum grazing rate gzl 022 d2 1
half saturation constant for mesozooplanktongrazing Kzl
1 mmole N m 2 3
microzooplanktonpreference for phyto-plankton p ss
p 05
microzooplanktonpreference for bacteria p zs
b 03
microzooplanktonpreference for detritus p zs
ds 02
mesozooplanktonpreference for phytoplankton p zl
p 04mesozooplanktonpreference for micro-
zooplankton p zl
zs 04
mesozooplanktonpreference for detritus p zl
ds 02assimilated phytoplanktonby micro-
zooplankton a zs
p 07
assimilated bacteria by microzooplankton a zs
b 07
assimilated detritus by microzooplankton a zs
ds 05assimilated phytoplanktonby meso-
zooplankton a zl
p 05assimilated microzooplanktonby meso-
zooplankton a zl
zs 05
208 Journal of Marine Research [56 1
iv Detritus parameters At the DyFAMed site Miquel et al (1994) derived a meanparticle settling velocity of at least 92 m d2 1 from mass ux data at three different depthsAs the sediment traps catch only large particles a value of 100 m d 2 1 is chosen for the largeparticle sinking rate The settling velocity of small particles is set to 1 m d 2 1 a mediumvalue taking into account the settling velocity of diatom cells (01 to 21 m d2 1 Andersenand Nival 1988b) and of smaller particles which are known to contribute to approximately95 of the total particle mass and have settling velocities lower than 1 m d 2 1 Breakdownrates are (10 d)2 1 for small particles and (30 d)2 1 for larger ones These values consideringthe respective sinking velocities allow small particles to be almost entirely remineralizedwithin a 100 m depth layer and large particles to contribute mainly to the export
v DOM parameter The fdomlratio is the percentage of total DOM directed toward the
refractory DOM compartment the remainder feeding the labile DOM compartment Itsvalue (15) has been determined by trial-and-error simulations to reproduce the observedDOC export (see Section 5) The decay time constant towards labile DOM is set to oneyear which allows accumulation during the oligotrophic summer A CN ratio of 12 is usedto validate the export against data
Table 2 (Continued)
assimilated detritus by mesozooplankton a zl
ds 03ammonium fraction of microzooplankton
excretion e zs 075ammonium fraction of mesozooplankton
excretion e zl075
microzooplanktonexcretion rate microzs01 d 2 1
mesozooplanktonexcretion rate microzl 002 d 2 1
microzooplanktonmortality rate mzs0037 d 2 1
mesozooplanktonmortality rate mzl0018 d 2 1
microzooplanktonconcentration threshold Z smin 00075 mmole N m 2 3
mesozooplanktonconcentration threshold Z lmin 00225 mmole N m 2 3
Bacteria parametersmaximum bacterial uptake rate Vb 20 d 2 1
bacteria half-saturationuptake constant Kb 05 mmole N m 2 3
ratio of DOM to ammonium bacterial uptake h 06bacterial mortality rate mb 005 d 2 1
bacterial CN ratio R cnbac 42 mole C (mole N) 2 1
DOM parameterlabile DOM fraction fdoml
075refractory DOM breakdown rate microdomr
1 y 2 1
refractory DOM CN ratio R cndom 12 mole C (mole N) 2 1
Detritus parameterssedimentation speed for small detritus Vds
1 m d2 1
sedimentation speed for large detritus Vdl100 m d2 1
small detritus breakdown rate microds 01 d 2 1
large detritus breakdown rate microdl 0033 d 2 1
1998] 209Levy et al Primary production model of NW Mediterranean Sea
d The 1991 simulation at DyFAMed
The rst three hundred meters of the water column are covered with a ve meter verticalresolution Initialization is done with DyFAMed data from January 24 1991 except whennot available ie for zooplankton bacteria detritus ammonium and labile DOM whichare set to small positive concentrations in order to enable their growth (10 2 6 mmole Nm 2 3) The model is run on a perpetual 1991 year until steady state is achieved for allvariables Steady state is obtained during the rst two years and all the presented modelresults are from the third year of simulation
Surface layer dynamics are derived from the turbulent kinetic energy model (TKE) ofGaspar et al (1990) at all depths It is driven by the forcing uxes provided by theEuropean Center for Medium-Range Weather Forecast (ECMWF) for 1991 (Fig 1 and 3)Six hourly estimates are available making this forcing suitable to high frequency studiesWinds and heat uxes resulting from Atmospheric General Circulation Models can bestrongly in error as an example it is well known that ECMWF overestimates the shortwave radiation due to poor representation of clouds Therefore the formulation of thesurface uxes is similar to the one generally used in Ocean General Circulation Models adamping term driving the sea surface temperature towards the data is added to the ECMWFestimates of the uxes Nevertheless the annual heat budget is not closed Even at alocation like DyFAMed supposed to be mostly 1D horizontal advection can explain partof that drift Very few data are available to estimate the period of the year when 3Ddynamics could modify the vertical structure at DyFAMed which makes correctionsdifficult to introduce However winter convection and restrati cation during spring are
Figure 3 Daily averages of (a) net heat ux in Wm 2 2 (with an albedo of 003) and (b) strength of thewind stress in Pa from 1991 ECMWF simulations over the DyFAMed station
210 Journal of Marine Research [56 1
mostly 3D processes (Gascard 1978) Moreover winter can be considered as the initialcondition for the annual cycle Finally during convection pro les are rather homoge-neous Therefore during 30 days before day 40 for which data are available and which isnot far from the time when the mixed layer is the deepest in the model the temperaturepro le is forced toward observations using a simple nudging techniqueAlso because thereis no surface salinity forcing available the same technique is applied to salinity We areaware of the questions that can be raised by that very crude parameterization but thatsolution seems to be a reasonable compromise for this 1D study taking into account thelack of data and the intrinsic 3D behavior of the ocean This solution prevents system driftThe vertical diffusion coefficients kz derived by the TKE model are used to estimate thevertical diffusion uxes of biogeochemical tracers The mixed-layer is de ned as thesurface layer where kz remains higher than 10 2 5 m2 s 2 1
Because the model is closed at the bottom (300 m) the model cannot by itself achievesteady state as it loses nitrogen by particulate sedimentation and refractory DOMaccumulation In order to obtain steady state nitrate and refractory DOM are relaxedtowards their pro les at day 40 with a one-month time scale thus providing nitrate andexporting DOM from the system As for temperature this nudging can be interpreted as amean of replacing 3D effects during this period and thus accounts for winter mixingComparisons with a simulation with no nudging have shown that nudging induces nomodi cation of the system behavior and actually only prevents its drift This result is notsurprising since nitrate is not limiting in December and refractory DOM has a weakfeedback on the biogeochemical system
4 Comparison of the model output with data
The rst step of the validation is made using data obtained in 1991 approximately everymonth Temperature chlorophyll and nitrate pro les were acquired at the DyFAMedstation from CTD uorescence and nutrient analyses respectively (DyFAMed 1995)Extended datasets from different years is also used to validate seasonal variations of othervariables for which the coverage in 1991 was poor zooplanktonsediment traps and DOC
a Hydrography
Simulated seasonal temperature evolution is compared to interpolated 1991 in situpro les (Fig 4) Seasonal variations are well reproduced in winter the temperature isuniform in the water column and below 13degC In spring isotherms rapidly deepen (in themodel this happens at the precise time when the forcing heat ux becomes positive)Between spring and summer the progressive warming of the surface induces maximumstrati cation of the water column Destrati cation in fall is more progressive thanstrati cation in spring (which is obvious in the model mixed-layer depth Fig 5)Nevertheless even though the slope of the isotherms are comparable the summerthermocline is more diffused in the model than in the data This suggests that the TKE
1998] 211Levy et al Primary production model of NW Mediterranean Sea
derived diffusion coefficients might be overestimated in the summer thermoclineCompari-sons of the heat budgets between the data and the model show that the increase (decrease)during summer (fall) is too large in the model by several Wm 2 2 which means that insummer either the ECMWF uxes are too large or that 3D processes cool the watercolumn The simulated mixed layer is also in good general agreement with the mixed layer
Figure 4 (a) Simulated temperature for 1991 (b) Temperature data measured at the DyFAMedstation in 1991 interpolated in time and depth Dotted lines show the eight measured pro les
Figure 5 Simulated mixed layer depth (solid line using the criteria that kz 10 2 5 m2 s 2 1) andeuphotic layer depth (dotted line 1 of incident illumination) Mixed-layer depth estimates fromCTD data (using the criteria that the density gradientbetween the surface and the base of the mixedlayer is 005) are shown by the capital letter D
212 Journal of Marine Research [56 1
estimated from in situ density pro les (Fig 5) One exception is the early March estimatethe model restrati es too early which again could either be due to shortcomings in theforcing or to 3D processes However we will assume that the physics derived from the 1Dmodel is satisfactory for the purposes of this study
b Standing stocks mean seasonal variability
The time evolution of the simulated nitrate phytoplankton and chlorophyll are shownFigures 6a 7a and 7b Phytoplankton evolution is mainly controlled by nutrient and light(mixed-layer depth) availability and grazing From mid-January to the end of Februarynutrients that have been brought up to the surface by winter mixing are fully available(Fig 6a) The mixed-layer is much deeper than the euphotic layer (Fig 5) and the strongand permanent mixing inhibits photosynthesis it is a typical winter regime as observed byGostan and Nival (1963) This strong deep mixing induces low CChl ratio close to its
Figure 6 (a) Simulated nitrate for 1991 (b) Nitrate data measured at the DyFAMed station in 1991(with a detection limit of 005 mmole N m 2 3) interpolated in time and depth Dotted lines show theten measured pro les (c) Simulated nitrate in a sensitivity experiment where nitri cation is notaccounted for Units are mmole N m 2 3
1998] 213Levy et al Primary production model of NW Mediterranean Sea
lower bound (Fig 7c) As soon as the water column is strati ed (Fig 5) phytoplanktonstart to grow and a bloom occurs followed by a strong microzooplankton production(Fig 8a) about a month later and mesozooplankton production one month after that (Fig8b) This succession of species is consistent with observations (Jacques 1988) andanalysis of speci c compositionof fatty acids in sediment traps (Marty et al 1994b) Fromthese analyses a high biological production was found in spring and early summer withhighest phytoplankton debris in MarchndashApril but highest zooplankton debris in late Juneand July In summer and early autumn the simulated system is characteristic of oligotro-phy with a surface-depleted nutrients (Fig 6a) a DCM (Fig 7b) located in the nitraclineand high CChl ratio in the upper ocean (Fig 7c) This oligotrophic regime has rst beendiscussed by Jacques et al (1976) and is also obvious in the DyFAMed (1995) datasetDestrati cation causes new nutrient supply and a late autumn secondary bloom (Fig 5 6a7a) clearly seen in the 1991 observations In mid-January a short bloom is observed(Fig 7a) due to a short event of restrati cation of the upper ocean (Fig 5) This event islikely related to winter diatom blooms (Marty 1993) Pigment biomarker analyses
Figure 7 Annual cycle of simulated (a) phytoplankton(in mmole N m 2 3) (b) chlorophyll(in mgChlm 2 3) and (c) CChl ratio (in mgC(mgChl)2 1) for 1991
214 Journal of Marine Research [56 1
(Claustre 1994 Marty 1993) have also distinguished among seasonal regimes Divinyl-chlorophyll identi ed from August to November is characteristic of prochlorophytesstrongly associated to oligotrophy fucoxanthine abundant from December to March ischaracteristic of diatoms indicating strong mixing and agellate pigments observedduring AprilndashJune are evidence for strati cation
c Standing stocks comparison with data
Figure 6 shows the comparison between simulated nitrate with full model resolution anddata in 1991 linearly interpolated to model resolution in both directions (time and depth)The general patterns are reasonably reproduced by the model in particular the formationof a sharp nitracline in April and its deepening throughout the year Low summer surfacevalues are also consistent with data
Above 50 m the model simulates a strong nitrate depletion in April followed by anincrease in nitrate concentrations in May The depletion is correlated to the spring
Figure 8 Annual cycle of simulated (a) microzooplankton(b) mesozooplanktonand (c) bacteria for1991 Units are mmole N m 2 3
1998] 215Levy et al Primary production model of NW Mediterranean Sea
phytoplanktonbloom (Fig 7a) The increase in May is due to nitri cation the major nitratesource at this time of the year (Fig 13) consistent with high ammonium levels just after thephytoplanktonbloom (Fig 16) and during the growth phase of microzooplankton(Fig 8a)On March 7 nitrate surface concentrations are lower in the model than in the data whichcould mean that the bloom starts a few days too early in the model This is consistent withthe fact that strati cation starts earlier in the model than in the data (Fig 5) On May 16nitrate pro les are quite similar in the model and in the data nevertheless due to the timeresolution of the data (no data between March 7 and May 16) the increase of nitrateconcentration in May is not obviously seen in the dataset
During fall the increase in nitrate observed in the data occurs earlier than in the modelAt the end of summer the mixed layer begins to deepen but it is not until the beginning ofDecember that its depth reaches the nitracline Therefore the model cannot supply theupper ocean with nitrate before that time The shift could be due either to shortcomings inthe 1D dynamics or to overestimation of the nitrate uptake during summer Simulationsperformed with a modi ed representation of the nutrient limitation or with differentparameters associated with primary production led us to the conclusion that the structureof the biological model itself cannot reproduce the increase in the surface nitrateconcentration in October It is more likely that the dynamics (vertical velocities mesoscaleactivity) could explain the differences between the data and the model results
Figure 9 compares chlorophyll results with time and depth interpolated data Besides thegeneral good behavior of the model four points are emphasized by this gure In winteralthough the simulated chlorophyll is low it is about twice as large as the data Theseresults are very sensitive to the parameters associated with the CChl ratio (PURmaxRCChlmax RCChlmin) Small increases of RCChlmin or decreases of PURmax lower the chloro-phyll values in winter
Between March 7 and May 13 no data are available maximum surface chlorophyllvalues of 2 to 3 mgChl m 2 3 as detected from satellite sensors (Andre 1990) have beenmissed These concentrations are obtained with the model which simulates a clear springbloom in March Figure 9b con rms that the bloom occurs several days too early in thesimulation As the bloom starts very suddenly and at the precise moment when themixed-layer depth decreases sharply in spring the time lag is not believed to be verysigni cant
The intensity of the DCM is well reproduced by the model but in early summer thismaximum is too deep and in late summer too shallow In the model the DCM is closelyassociated with the position of the nitracline and the CChl ratio gradient With constantparameters all along the year the model is not able to reproduce large variations of theDCM depth Succession of species and vertical layering of phytoplankton populations(Pollehne et al 1993) with different CChl values can modify the evolutionof the verticalstructure of chlorophyll and partly explain the trend in the DCM depth However June ischaracterized by an uplift and September by a downward de ection of the deep nitrate eld (Fig 6b) Though not clear from the temperature distribution vertical movements
216 Journal of Marine Research [56 1
could be responsible for such patterns Numerical experiments have shown that averagevertical velocitiesof less than 1 md 2 1 during a week or two are able to create displacementsof about 10 m in the nitrate and chlorophyll elds (Levy 1996)
During the second half of November the model exhibits an increase of chlorophyll at60 m That short event occurs just when the mixed layer reaches the depth of the nitraclinewhich is close to the euphotic zone depth at this time of the year (Fig 5) Light andnutrients are sufficient to locally stimulate production As the mixed layer deepens moreand more the chlorophyll patch is quickly diluted afterwards
It is almost impossible to compare the simulated zooplankton cycles to observations aswe know of no comprehensive sampling of zooplankton at DyFAMed Nival et al (1975)sampled zooplankton along the Nice-Calvi transect during two of the 15-day legs of theMediprod-I Program the rst in March the second in April They used vertical net hauls(mesh size 200 microm) over a depth range of 0ndash75 m They reported very low zooplanktonconcentrationsduring the rst late winter cruise with dry weights of about 5 mg m 2 3 andmuch higher concentrations (about 60 mg m 2 3) from the surface down to 50 m during thesecond spring cruise Converting these data to nitrogen units (according to Nival et al1975) gives a variation from 0024 mmole N m 2 3 in winter to 028 mmole N m 2 3 in springScarce additional zooplanktonmeasurements in other parts of the North Mediterranean Seashow similar zooplankton variations Alcaraz (1988) reported mean summer values of006 mmoleN m 2 3 in the Balearic Islands while Razouls and Kouwenberg (1993)encountered a MayndashJune zooplankton maximum of 02 mmole N m 2 3 and a winterminimum of 005 mmole N m 2 3 in the Gulf of Lion The simulated mesozooplankton
Figure 9 (a) Simulated chlorophyll for 1991 (b) Chlorophyll data measured at the DyFAMedstation in 1991 interpolated in both time and depth Dotted lines show the nine measured pro lesUnits are in mgChl m 2 3
1998] 217Levy et al Primary production model of NW Mediterranean Sea
concentrations show a maximum of 014 mmole N m 2 3 occurring in June within the rangeof the reported data and with a good timing Clearly data on microzooplankton stocks areimportant for further calibration of this model
Several authors (Cho and Azam 1990 Krstulovic et al 1995) have shown that withincreasing oligotrophy phytoplankton biomass is far below bacterial biomass while ineutrophic waters bacterial biomass is generally much smaller than phytoplanktonbiomassCompared bacteria and phytoplanktonconcentrations (Fig 7a and 8c) show that the modelagrees with this general pattern during the bloom as well as in summer Integrated over the rst 100 m in nitrogen units the ratio of the bacterial and phytoplanktonic biomasses isequal to 066 during the bloom and 220 during the summer (042 and 140 in carbon units)We only dispose of three bacteria pro les from the DyFAMed station (Fig 10 L Gulianopers comm) The two measured pro les in November are very different Besides the pickat 50 m the 1994 one is similar in distribution and order of magnitude to the simulatedbacteria for November 1991 while the 1993 one is smaller by a factor two The pro lefrom May 1994 has again the right order of magnitude although the model results show amaximum at 75 m not seen in the data
Vertical pro les of DOC content were obtained monthly at the DyFAMed site (startingfrom July 1991) using a high temperature catalytic oxidation method (Avril 1995) Acomposite year made out of these pro les (Fig 11b) show an excess of DOC in surfacewaters increasing from February to October The simulated refractory DOC pro les(Fig 11a) also show this accumulation though the year The range of variation simulated inthe surface layers agrees with the data Nevertheless the vertical gradient is too small andthe maximal surface accumulation of DOC is reached about a month later in the simulation
Figure 10 Simulated and measured bacteria pro les at DyFAMed in May and in November Unitsare mmole N m 2 3
218 Journal of Marine Research [56 1
By construction (damping toward a homogeneous pro le in winter) and due to strongmixing in the deep mixed layer in winter there is no DOC vertical gradient in FebruaryndashMarch in the model (as for nitrate) The time shift in the decrease of the accumulation ofsurface DOC may be compared with the same shift in nitrate increase (Fig 6a) whichcould imply shortcomings in the deepening of the mixed layer in fall However thecrudeness in the representation of DOC in the model and problems raised by the de nitionof labile and refractory DOM must obviously be considered as well
Figure 11 (a) Simulated refractory DOM annual cycle for 1991 converted to carbon units using aCN constant ratio of 12 (b) Composite year of DOC concentrations derived from measurementsat DyFAMed from 1991 to 1994 (from Avril 1995) Units are mmole C m 2 3
1998] 219Levy et al Primary production model of NW Mediterranean Sea
d Production uxes
Using 14C measurements Minas (1970) has estimated the Northwestern MediterraneanTP rate to be about 78 gC m 2 2 y 2 1 Morel and Andre (1991) have derived primaryproduction rates from satellite (CZCS) observations and evaluated the annual rate ofcarbon xation for the whole western basin to be about 94 gC m 2 2 y2 1 They also haveprovided a review of primary production measurements in the area (Bethoux 1981 1989Jacques 1988 Minas et al 1988) in good agreement with their estimate However usingdifferent parameter values and cloud forcing the rst estimate of Morel and Andre hasbeen revised to 1577 gC m 2 2 y 2 1 by Antoine et al (1995) The simulated annual mean TP(Fig 12 1055 gC m 2 2 y 2 1) falls between these two estimates
14C measurements during Mediprod 1 yields to TP values of 387 mgC m 2 2 d 2 1 in Marchand 982 mgC m 2 2 d 2 1 in April Recent TP DyFAMed data acquired once in March andonce in April 1994 give higher daily estimates ( 800 and 1900 mgC m 2 2 d 2 1 respectively
Figure 12 Mean annual concentrations (mmole N m 2 2) and mean uxes (mmole N m 2 2 d 2 1) in the rst 100 m Mean concentrations are indicated within each compartment The smaller guresunderneath indicate the vertical diffusion trend of the compartment (when not negligible) whilebiogeochemical trends between two compartments are indicated over the arrow between thesecompartments the directionof the arrow accountingfor the sign of the trend (positive for a sourcenegative for a sink) Nudging trends are those close to bent arrows The factor used to convertmmole N m 2 2 d 2 1 to the carbon units given in the text (gC m 2 2 y2 1) is 12 3 657 3 0365 exceptfor DOM export which is computed using a CN ratio of 12 instead of 657
220 Journal of Marine Research [56 1
J Chiaverini pers comm) Indeed the rst Mediprod 1 estimates are likely not tracemetal clean and may be biased low The model averaged predictions are much lower402 mgC m 2 2 d 2 1 in March 413 mgC m 2 2 d2 1 in April and 501 mgC m 2 2 d 2 1 in May Anexplanation could be that the time of incubation (12 h during Mediprod 1 4 h atDyFAMed) is too short to derive the exact net production putting the measured estimatessomewhere between gross and net production whereas the model predicts net productionAn other reason could be the underestimation of total production by the bio-optical modelof Morel (1991) under spring bloom conditions as suggested by comparisons of the recentPP measurements at DyFAMed with estimates derived from the Morel (1991) model forcedwith in-situ chlorophyll (J Chiaverini pers comm) It is thus difficult to say whether themodel predicted spring TP is too low or if the measurements are overestimates
Due to nitri cation exact NP is hardly assessable from nitrate uptake On an annualaverage NP equals nitrate-based production minus nitri cation but instantaneouslynitri cation can prevail over nitrate-based production when the latter is strongly inhibited(particularly during winter) Biological activity is then is a net source of nitrate in theeuphotic layer By subtracting nitri ed nitrate to total nitrate consumption by phytoplank-ton both averaged over the 100 m surface layer we obtain an annual estimate of newproduction of 209 gC m 2 2 y 2 1 (Fig 12) The same result is obtained by summing thevertical uxes of nitrogen over the 100 m surface layer and then adding the winter nudgingterm This value is consistent with previous estimates of NP in the NorthwesternMediterranean basin estimating phosphate supply from deeper layers and its subsequentconsumption in the euphotic layer Minas et al (1988) reported a value of 18 gC m 2 2 y 2 1Applying the oxygen utilization method and taking into account the annual deep waterformation Bethoux (1989) derived a value of 12ndash35 gC m 2 2 y 2 1 The metabolic CO2
production over the year 1990 yields an estimate of 184 gC m 2 2 y 2 1 ( 6 40) (Lefevre etal 1996)
Phosphate consumption between the two one-month interval Nice-Calvi transects ofMediprod 1 gave an estimate of 247 mgC m 2 2 d 2 1 for new production during the bloom(Minas et al 1988) The mean simulated nitrate-based production during the bloom is276 mgC m 2 2d2 1 and is presumably very close to NP as nitri cation is weak in theeuphotic layer during that period (Fig 13) The difference between the model and the datais low and could be due to interannual nitrate input variability From the 1964 lsquolsquoBoueeLaboratoirersquorsquo experiment Minas and Codispoti (1993) estimated a NP of about 55 mgCm 2 2 d 2 1 in September and 90 mgC m 2 2 d 2 1 during the summer season The meansimulated nitrate-based productions for the oligotrophic and autumn periods are respec-tively 50 and 57 mgC m 2 2 d2 1 Although nitri cation is no longer negligible the modelreproduces right orders of magnitude
Nitri cation measurements in the Almeria-Oran frontal system (Bianchi et al 1993)have shown that the nitrate resulting from nitri cation is able to contribute as much as 40of the nitrate supply for phytoplankton They report ammonium oxidation rates varyingfrom 10 2 3 to 45 102 2 mmole N m 2 3 d 2 1 and a maximum of nitrite oxidation rates located
1998] 221Levy et al Primary production model of NW Mediterranean Sea
at the top of the nitracline In the standard simulation ammonium oxidation rates varywithin the same range (Fig 13) and nitri cation sustains about 30 of the overall nitrateconsumption in the rst 100 m as an annual mean We are aware this value is verycontroversial However nitri cation occurs mostly in summer and autumn (about 3 timesthe spring value) and is maximum just below the euphotic layer where nitri cation kineticsprevails over ammonium consumption by phytoplankton Note that this value is aboutthree times smaller if the budget is undertaken in the euphotic layer (Fig 5) nitri cationaccounts for 007 mmole N m 2 3 d 2 1 in nitrate production which represents 10 of nitrateconsumption
The ratio between NP and TP cannot be derived directly from the model but it can bebounded by the ratio between nitrate-based production and TP and the ratio betweennitrate-based production minus nitri cation and TP The mean simulated f-ratio for springis 070 It is much higher than the 036 spring f-ratio estimated from Mediprod 1 (Minasand Bonin 1988 Minas and Codispoti 1993 Minas et al 1988) However the 070 valueseems much realistic for a bloom period when nitrate are fully available The surprisinglylow value of 036 has been explained by the presence of zooplankton but this point iscontroversial as zooplankton develops only one month after phytoplankton In summerthe simulated f-ratio ranges between 010 and 017 characteristic of an oligotrophicregime and it reaches 019 to 037 in autumn The 05 (Minas et al 1988) estimate forsummer is much higher and surprisingly higher than the reported f-ratio during spring
e Export uxes
What we will refer as lsquolsquoexportrsquorsquo is the export of organic matter below 100 m which issomewhat different than the lsquolsquorealrsquorsquo export to the deep ocean (Bender et al 1992) Due totheir high sinking velocity (100 m d 2 1) compared to their remineralization rate ((30 d)2 1)large particles ux at 100 m is about the same than at 200 m It is not the case with smallparticles which are almost entirely remineralized when they reach 200 m leading to DOMstorage between 100 and 200 m
Time series measurements of downward uxes of settling particles have been monitoredsince 1987 in the framework of the DyFAMed project (Miquel et al 1993 1994)
Figure 13 Daily averaged nitrogen ux between ammonium and nitrate compartments due tonitri cation units are mmole N m 2 3 d 2 1 The plain dark line marks the limit of the euphotic zone
222 Journal of Marine Research [56 1
Automated sediment traps were used to collect samples particularly at 200 m-depthFigure 14 compares 1987 sediment traps measurements to the 1991 simulated large particleexport calculated at 200 m as no data are available for 1991 These two uxes have thesame order of magnitude and follow the same temporal pattern They increase from Marchto MayndashJune and then gradually decrease Surprisingly high winter downward uxesduring a period where primary production is believed to be minimum have been observedand are not simulated They have become the focus of attention and various explanationshave been proposed Miquel et al (1994) pointed out that particle uxes were enhancedduring vertical mixing events and attributed this winter anomaly to a physical rather thanbiological control of the uxes Marty et al (1994b) used organic biomarker analyses tounderstand the origin of these uxes They have found that the higher uxes occurringduring winter are associated primarily with old refractory organic matter probably ofcontinental origin This second hypothesis is supported by the fact that the same temporalpattern has been observed in near shore Northwestern Mediterranean waters (Fowler et al1991) The contribution of diatoms to the monitored vertical ux in winter could alsoexplain the discrepancy between model results and data during that period as phytoplank-ton does not directly contribute to the large detritus pool in the model
The model annual large particle export is 39 gC m 2 2 y 2 1 (Fig 12) very close to themean monitored export (40 gC m 2 2 y 2 1 for the period 1987ndash1990) This good agreementcomes partly from the fact that several critical parameters associated with mesozooplank-ton have been tuned (see part 5) It is interesting to note that the model predicts an export ofphytoplankton through mixing processes of 091 gC m 2 2 in January when a wintersecondary bloom is simulated This gure can be related to the winter vertical export of
Figure 14 Large particle ux (a) standard simulation for 1991 and (b) 200 m sediment traps data atDyFAMed for 1987 from (Miquel et al 1994) Units are mgC m 2 2d 2 1
1998] 223Levy et al Primary production model of NW Mediterranean Sea
organic matter presumably achieved through diatoms which means that the particulateexport could then be too high in the model Similar signi cant export of phytoplanktonbywinter deep-mixing events was found by Doney et al (1996) Data constraining the diatomcontribution to winter export are of course needed for further conclusion The non-parameterized processes of aggregation and disaggregation are probably responsible for another source of error
The model predicts an annual refractory organic matter export of 147 gC m 2 2 y 2 1mostly through winter vertical mixing (Fig 12) Copin-Montegut and Avril (1993) havemade an estimate of the DOC export on the assumption that all the DOC accumulated inthe surface waters is removed by winter mixing This led to a winter DOC export of148 gC m 2 2 y 2 1 The model reproduces DOC export quite well This good agreement isnot surprising since for a xed CN ratio the fdoml
ratio value has been tuned accordinglyThe model also calculates other forms of export (Fig 12) like small particle sedimenta-
tion (35 gC m 2 2 y 2 1 at 100 m and 015 gC m 2 2 y 2 1 at 200 m) and dead or living organismexport by winter diffusion (42 gC m 2 2 y 2 1 at 100 m achieved mainly by detritus bacteriaand phytoplankton and 048 gC m 2 2 y 2 1 at 200 m) This last mechanism has beenproposed by Nival et al (1975) to close the phytoplanktonconsumption budget they havefound that 7 of phytoplankton and zooplankton biomasses had to be lost from theproductive layer through hydrological processes
5 Sensitivity studies
The success of a model depends rst on its structure and on the parameterization of theprocesses involved but also on the choice of parameter values Here we estimate modelerror as a function of key or unknown parameters In view of the large number ofparameters this study is far from being exhaustive It only seeks to point out selectedde ciencies in the present knowledge of processes that seem to be important componentsof the oceanic carbon and nitrogen cycles and to point out the lack of suitable measure-ments to overcome these uncertaintiesPercentage values given in the following discussioncorrespond to the sensitivity experiment estimates relative to the annual mean predictionsof the standard simulation given in Figure 12
a CChl ratio
Few biogeochemical models take into account variability in CChl ratio (Doney et al1996 Hurtt and Armstrong 1996 Lawson et al 1996) However data clearly show thatthis ratio can vary by one order of magnitude (Cloern et al 1995) Figure 15 shows thesimulated phytoplanktonand the chlorophyll distributions for a sensitivity study where theCChl ratio is constant and equal to 55 mgC (mgChl)2 1 During the oligotrophic summerthis sensitivity study shows that a variable CChl ratio is not needed to create a subsurfacemaximum in biomass Its amplitude has the same order of magnitude but it is shallower(35 m vs 50 m in the standard run Fig 7a and 15a) Phytoplanktonicbiomass is also larger
224 Journal of Marine Research [56 1
at the sea surface as in the standard run the CChl ratio decreases with depth from surfacevalues larger than 100 mgC (mgChl)2 1 to about 45 mgC (mgChl)2 1 at the DCM Thechlorophyll vertical gradient is larger and the DCM a little deeper than the biomassmaximum Therefore with a constant CChl ratio the surface chlorophyll is too high byalmost a factor of 3 and the DCM is too shallow and not pronounced enough Thus it isdifficult to get simultaneously reasonable surface chlorophyll concentrationswhich can bevalidated against satellite data and a realistic DCM without taking into account variationsof CChl ratio with light and nutrients However that does not mean that the parameteriza-tion proposed here should not be improved Finally with a constant CChl ratio of 55 mgC(mgChl)2 1 the PP is globally decreased by 168 the large particle export ux by 408and refractory DOM export by 96 Other sensitivity studies (not shown) emphasize thedelicate coupling between productivity chlorophyll pro les and CChl ratio whichdepends on several parameters (PURmax RCChlmax RCChlmin) which are not very wellconstrained and which certainly vary with phytoplanktonicpopulations (whereas only onetype of phytoplankton is considered in BIOMELL)
b Nitri cation
Nitri cation long been neglected in the surface ocean is now believed to be asigni cant nitrate source in the euphotic layer even though it is light inhibited (Gentil-homme 1992 Ward 1986 Ward et al 1989) The nitri cation budget predicted by themodel seems impressive 432 of the overall nitrate supply in the rst 100 m (Fig 12)
Figure 15 Annual cycle of simulated (a) phytoplankton (in mmole N m 2 3) (b) chlorophyll (inmgChl m 2 3) in a sensitivityexperimentwhere the CChl ratio is held constant and equal to 55 mgC(mgChl)2 1
1998] 225Levy et al Primary production model of NW Mediterranean Sea
and 125 of the annual ammonium uptake by phytoplankton However there existsinsufficient nitri cation data to contest this assertion
To assess the role of nitri cation in BIOMELL a sensitivity simulation is performedwhere nitri cation is not taken into account In this no-nitri cation simulation forconsistency with the standard simulation ammonium concentrations in winter are relaxedtoward the day 40-pro le of the standard simulation (similar to what is done for nitrate andDOM) Besides nitrate and ammonium (Fig 6 and 16) all the other pools remain almostidentical The annual TP is increased (10) resulting in a shift from regeneratednitrate-based assimilation to more efficient ammonium assimilation Annual NP is alsoincreased (8) even though nitrate-based production is decreased This increase in NPresults mainly in a winter export of ammonium With no nitri cation a highly concentratedammonium pocket forms just under the euphotic layer with a maximum reaching16 mmoleN m 2 3 (Fig 16b) In the Mediterranean Sea very ew ammonium data areavailable Nevertheless none of them reaches values larger than 02 mmole N m 2 3
(Gentilhomme and Slawyck 1991 Woodward 1994) Therefore ammonium concentra-tions predicted when nitri cation is taken into account (Fig 16a) seem much morerealistic Recently high ammonium concentrations (up to 1 mmole N m 2 3) have beenmeasured in the North Atlantic (BOFS data) the model run at 20W 47N in 1989reproduces these high values even with nitri cation (not shown)
The overestimation of ammonium values when nitri cation is not parameterized seemsto be a general feature of biogeochemical models (Fasham et al 1993) Fasham (1995)concluded that the kinetics of ammonium assimilation are too slow and thus decreases the
Figure 16 (a)Annual cycle of ammonium for 1991 derived by the model in the standard simulationwhen nitri cation is included (b) Annual cycle of ammonium for 1991 derived in a sensitivityexperiment where nitri cation is not accounted for Units are mmole N m 2 3
226 Journal of Marine Research [56 1
value of Knh4 to 001 mmole N m 2 3 in order to decrease the ammonium stock In the presentruns the value used for Knh4 is even smaller When the parameterization of nutrientlimitation used by Fasham (1995) is taken into account in the model nitri cation is neededto obtain ammonium concentrations smaller than 20 mmole N m 2 3
Moreover nitrate concentrations predicted by the model when nitri cation is notaccounted for are much too low below the nitracline during fall (Fig 6 2ndash3 mmole N m 2 3
instead of 3ndash4 mmole N m 2 3 in the standard simulation as well as in the data) In such acase the amount of missing nitrogen in the nitrate compartment is kept in the ammoniumcompartment and vertical diffusion below the nitracline is too low to sustain signi cantinput of nitrate Nitrate data therefore agree better with the simulation when nitri cation isincluded
Other sensitivity studies have been performed using different parameterizations ofnitri cation (Michaelis-Menten kinetics light-inhibition term) As nitri cation is mainlyimportant below the euphotic layer and when ammonium concentrations are high thedifferences between these simulations and the standard one are negligible
These simulations show that nitri cation cannot be neglected Nevertheless not enoughmeasurements of nitri cation rate (and of its possible inhibition with light) or ofammonium concentrations are available If it turns out that this mechanism must beconsidered even in the upper ocean data are crucial the paradigm linking annualnitrate-based production and export uxes is no more valid
c Zooplankton in uence
The effect of zooplankton abundance on the phytoplankton population can be eitherunfavorable (grazing) or favorable (excretion) The relative importance of these twoprocesses in terms of phytoplankton growth determines the evolution of phytoplanktonabundancenutrient utilizationand feeds back on the zooplanktongrowth Microzooplank-ton grazing rate has been tuned to obtain satisfactory phytoplankton concentrationsparticularly in the DCM where they are steady over a large period of time A higher grazingrate (125 d2 1 ie 1 25) modi es as expected the stocks of phytoplankton and micro-zooplankton (respectively 2 158 and 1 224) without modifying substantially the totalproduction ( 1 40) microzooplankton grazing stimulates regeneration through higherexcretion ( 1 205) but phytoplankton losses by grazing are also higher ( 1 201)Surprisingly the increase of microzooplankton does not stimulate its predator Thecoupling between microzooplankton and phytoplanktonis faster with higher grazing ratesTherefore the maximum in microzooplankton occurs earlier and is not as high as in thestandard run Due to mortality and exudation its decrease occurs earlier as wellMicrozooplanktonaccounts for the major part (60) of the food supply for mesozooplank-ton In the sensitivity run the mesozooplankton development occurs too late to useefficiently the microzooplankton bloom Consequently the particulate export is smaller
1998] 227Levy et al Primary production model of NW Mediterranean Sea
( 2 85) and this decrease is compensated by the small DOM export increase ( 1 48)When the microzooplanktongrazing rate is decreased by 25 (075 d 2 1) the total export isdecreased ( 2 528 and 2 118 for the particulate and the DOM export respectively)The grazing rate is too small to induce a consequent microzooplankton biomass ( 2 69)and mesozooplankton cannot grow Therefore due to the non linearity of the model withthe choice of the parameters done in the standard run modi cations of the grazing rate ofmicrozooplankton seems to always decrease the particulate ux which is quite unex-pected
Apart from the grazing rate zooplankton development also depends on its winterthreshold value We have tested doubled threshold values for microzooplankton andmesozooplankton separately A higher value of Z s
min allows microzooplankton to developabout one week earlier and to reach a slightly higher maximum (3) The phytoplanktonbloom is thus a couple of days shorter The major uxes are unchanged (by less than 1)and the impact on mesozooplankton is too low to signi cantly modify the distribution ofthe exports Z l
min is a more sensitive parameter With doubled Z lmin starting from higher
values in spring the mesozooplankton maximum is increased by 33 leading to anincrease of 263 of the particulate export With almost the same NP the dissolved exportis decreased in consequenceSimultaneouslymicrozooplanktonis less abundant ( 2 93)but phytoplankton abundance is quite identical ( 2 16) TP is decreased ( 2 371) aswell as the total grazing pressure on phytoplankton ( 2 155) In conclusion within theseranges Z s
min seems to control the timing of the end of the bloom while Z lmin is correlated to
the particulate exportThe assigned values for the microzooplankton grazing rate and the zooplankton
threshold values seem satisfactory as phytoplanktonabundance and particulate export arewell predicted but are clearly interdependent as they both control the particulate exportZooplankton mortality is another parameter which can modify signi cantly estimates ofbiomass and export uxes Micro and mesozooplankton data are necessary for bettercalibration of the model
d Dissolved organic matter
As already mentioned the fdomlratio (15) has been tuned to reproduce the Copin-
Montegut and Avril (1993) estimate of the DOC export at DyFAMed assuming a CN ratioof 12 for refractory DOM A higher ratio (20) yields to a refractory DOM compartmentgrowth at the expense of all other variables DOM export is enhanced by 246 and largeparticle export lowered by 77 Total production is also lower ( 2 54) because a largerpart of the nitrogen is kept in the refractory DOM compartment and cannot be used forregeneration With a smaller ratio (10) the modi cations are similar but of oppositesign Without refractory DOM the large particulate export is only raised up to 46 gC m 2 2
y 2 1 ( 1 172) NP (ie total export) is thus drastically lowered In fact the compartments
228 Journal of Marine Research [56 1
associated with the regenerated production are greatly increased and nitri cation is almostdoubled
e The deep mixed-layer regime growth limitation
The role of the limitation term LM is emphasized by comparing the standard simulationto a simulation where this constraint is ignored The differences appear clearly in thechlorophyll abundance (Fig 7a and 17) With no limitation winter chlorophyll concentra-tions are much higher than those usually observed and the spring bloom is shorter in timeand less intenseThis test shows that local Eulerian limitationby light as usually de ned inbiogeochemical models cannot by itself be sufficient to reproduce the low winterphytoplanktonabundance in the Mediterranean Sea Lagrangian limitation processes are tobe parameterized and the chosen parameterization in spite of its extreme simplicity seemsto be satisfactory Moreover the effect of winter dynamics on biology in particular thetransport of phytoplanktoncells to shadow areas appears to also be of primary importancebecause it preconditions the period of highest productivity the spring bloom and thus theexport With no mixing limiting term phytoplanktoncontent at the beginning of the bloomis higher which allows production to begin sooner Nevertheless as zooplankton starts togrow earlier as well its limiting effect on the bloom is more rapidly effective and theintensity of the bloom is smaller When photosynthesis is not explicitly limited by mixingduring winter NP as well as export production are increased on an annual basis by 30
6 Synthesis of the simulation
a Annual balance
From the annual budget (Fig 12) general remarks regarding the functioning of thesystem can be made Grazing appears to be the most important loss term for phytoplanktonHowever phytoplankton mortality is about the same order of magnitude and is thereforealso of importance in the model
Mesozooplankton is much less abundant than microzooplankton and its grazingpressure on phytoplankton and microzooplankton is negligible compared to the otherphytoplankton and microzooplankton loss terms ( 5 of total losses) However meso-
Figure 17 Annual cycle of chlorophyll derived by the model in a sensitivity experiment where thedeep-mixing limitation term is not included Units are mgChl m 2 3
1998] 229Levy et al Primary production model of NW Mediterranean Sea
zooplankton has a crucial role in the export as it is responsible for all the large particulateexport which accounts for about 20 of the total export
Small detritus consist of microzooplankton egestion (51) dead phytoplankton (29)and dead zooplankton (20) To our knowledge no available data can con rm theseproportions In this model bacteria and small detritus represent the main microzooplank-ton food sources before phytoplankton Small detritus are also the main source for DOM(and therefore of DOM export) far above zooplankton excretion and phytoplanktonexudation
Bacteria is an important actor in regeneration (Fuhrman 1992) First they can competewith phytoplankton for ammonium assimilation Second bacteria assimilate DOM andrecycle it almost equally towards microzooplankton growth (through grazing) and ammo-nium Bacterial production based on DOM accounts for around 80 of PP Data (Ducklowand Carlson 1992 Ducklow et al 1995) show that this ratio is generally smaller(20ndash50) although it can sometimes reach these high values (Ducklow et al 1995) BPmight be overestimated by the model which could partially explain some discrepanciesbetween the data and the model
Zooplanktonexcretion represents the other signi cant source of ammonium (larger thanthe bacteria source) This result is in good agreement with Ferrier-Pages and Rassoulzade-gan (1994) study on ammonium excretion rate in Mediterranean waters which indicatesthat protozoa may account for over 50 of the nutrient recycling in these waters
Therefore regeneration in the model occurs through two main pathways of equalimportance a short one including phytoplankton microzooplankton and ammonium andanother one based on bacteria assimilation of labile DOM resulting mostly from smallparticle degradation In addition to this closed system NP fuels particulate and dissolvedexport and accounts for about 20 of the TP ux
b Turnover times
Estimation of nitrogen turnover times in each compartment presents an interesting wayof describing and understanding the model behaviorThis turnover time is taken as the ratiobetween the concentration and the net ux into or out of the compartment Turnover timesappear to be very short in the regenerated compartments (ammonium DOM smallparticles) with values of the order of one day Kirchman et al (1991) suggested that asubstantial fraction of upper ocean DOC has potential turnover times of 5ndash100 days whichis in agreement with our estimate summing the two DOM pools In the primary(phytoplankton bacteria) and secondary (microzooplankton) producer compartments theturnover time varies between 1 day (at the surface during the bloom or at the location of theDCM during summer) and 5 days (at the surface during summer) This time is longer formesozooplankton(5 to 30 days) These results indicate that nitrogen tends to stay longer inthe higher trophic levels They also show that turnover times are shorter where biomassesare more important
230 Journal of Marine Research [56 1
c Successive regimes analyses
In order to analyze each production regime and to understand how the ecosystemswitches from one regime to another six different periods of the year of unequal durationare examined separately These periods correspond either to a speci c regime or to atransition period between two different regimes In the following values in parenthesesgive the mean 100 m- uxes over these periods and are in units of mmole N m 2 3 d 2 1
(1) The winter regime corresponding to the period of deep convection (days 20 to 50) Itis characterized by a deep mixed layer (more than 150 m depth) enrichment of nitrate inthe mixed layer (up to about 4 mmole N m 2 3 Fig 6a) and low concentrations in the livingcompartments Low phytoplankton production (078 due to winter mixing and lightlimitation) do not compensate mortality (085) and diffusive losses of phytoplankton(036) Therefore phytoplankton abundance decreases over the whole period The smalldetritus compartment is fed by dead phytoplankton cells and is remineralized throughlabile DOM and bacteria to ammonium (185) Photosynthesis is slowed by the deep-mixing limitation and nitri cation (049) is much higher than nitrate uptake (005) Asalready mentioned this period is also characterized by a large DOM export (199) but alsoan important export of bacteria (061) and phytoplankton (036) through diffusive pro-cesses
(2) The early bloom regime or the growth phase of phytoplankton (days 50 to 75) Assoon as the water column is stabilized production is no longer inhibited Indeed theshallowing of the mixed-layer from 200 m to 20 m depth in a few days has resulted in anitrate rich mixed-layer shallower than the euphotic layer (Fig 5) The conditions forgrowth are therefore optimal This regime is characterized by a high nitrate consumption(668) associated to a high f-ratio (088 neglecting nitri cation) Phytoplankton keepsgrowing in the mixed layer causing the shallowing of the euphotic layer Zooplankton isstill at its threshold value and does not play any role (grazing-022 is negligible comparedto phytoplankton mortality-232 and particulate export-009 is low) As during theprevious period bacteria is the main source for ammonium (099 compared to 006 fromzooplankton excretion)
(3) The late bloom regime when primary production starts being limited (days 75 to100) This period is characterized by the development of microzooplankton and bacteriaand decrease in mixed-layer phytoplanktoncontent (Fig 7a) The mixed-layer nitrate stockdecreases (Fig 6a up to 2 mmole N m 2 3) but is still nonlimitingMean uxes suggest thatmicrozooplankton is responsible for phytoplanktondecrease as grazing (288) is the trendthat has the most increased from the previous period (about 13 times higher) Zooplanktonuse the largest part of its sources to increase its biomass and its contribution toremineralization is still low (excretion of ammonium-052) Bacteria uses more ammonium(162) than it produces (157) and starts competing with phytoplankton for ammonium(ammonium-based production is 185)
(4) The transition regime from bloom to oligotrophy (days 100 to 150) This period isdriven by microzooplankton which reaches its maximum biomass (Fig 8a) Grazing
1998] 231Levy et al Primary production model of NW Mediterranean Sea
(444) is the rst phytoplankton sink far larger than mortality (148) and simultaneouslyzooplankton excretion is a large source of regenerated nitrogen (669) More generally allthe regeneration uxes are the highest during this period (ammonium utilization byphytoplankton-507 by bacteria-318 DOM assimilation by bacteria-531 ) Mostbiogeochemical models produce oscillations in the phytoplankton eld during that periodHere we do not get these oscillations as long as zooplankton is allowed to graze on detritus(not shown) The very intense exchanges between microzooplankton and detritus empha-sizes the role of detritus grazing in stabilizing the system (732 for the grazing of detritusand 939 for the production of fecal pellets) Such oscillations seem to be a bias inherent tothe mathematical solution of the biogeochemical equations and could only be detectedusing moored uorometers In the Sargasso Sea Marra et al (1992) have carried out thistime continuous measurement and captured this transition regime with no evidence ofsuch oscillations This transition period is important because it is characterized bymaximum mesozooplankton growth (025) and therefore maximum large fecal pelletproduction (017) and substantial detritus export (017)
(5) The oligotrophic regime characterized by a quasi-constant low phytoplanktonbiomass and the presence of a DCM (days 150ndash300) The system is close to steady stateThe surface layer is completely nitrate depleted and phytoplanktongrows at the basis of thepreviously set nitracline progressively eroding it Production is mainly regenerated ( f-ratio between 015 and 03) Labile DOM assimilated by bacteria (355) is entirelyremineralized through grazing of bacteria (368) and zooplankton excretion of ammonium(356) However to grow on DOM bacteria need ammonium to maintain its low CN ratioAs in the previous regime they compete efficiently phytoplanktonto share the ammoniumstock (213 are uptaken by bacteria and 308 by phytoplankton) The mesozooplanktongrowth is still responsible for consequent particulate export (02)
(6) The late autumn-early winter regime characterized by secondary blooms (days300-20) Two secondary blooms occur in the 1991 simulation (Fig 7a mid-December andmid-January) The December bloom is associated with the progressive deepening of themixed layer providing new nitrate to the system and thus breaking the previousequilibrium As soon as the mixed layer is deeper than the euphotic layer light limitsproduction causing the decrease of the bloom In mid-January temporarily mild weatherconditionsallow another secondary bloom to occur for a few days the surface heat forcingbecomes positive (Fig 3a) with a correlated decrease in the wind intensity (Fig 3b) Asubsequent stabilizationof the mixed layer takes place (its depth varies from 100 to 40 m)initiating this secondary bloom which is then stopped in its evolution by the occurrence ofa strong wind burst on January 15 This winter bloom is consistent with observed diatomblooms that have occurred in similar conditions (Marty 1993) It is too short to enable thedevelopmentof zooplanktonand is not nutrient limited It is thus entirely controlled by themixed-layer depth (light limitation)This short winter bloom is responsible for an export ofphytoplankton cells through mixing processes as soon as the mixed layer deepens againThis pathway for instantaneous export have been observed in the Northeast Atlantic (Ho
232 Journal of Marine Research [56 1
and Marra 1994) The end of these secondary blooms are thus controlled by themixed-layer depth in contrast with the spring bloom which is controlled by zooplanktonabundance and nutrient limitation Other characteristics of this period are a less efficientregeneration (by about of 3 times compared to summer) and low zooplankton concentra-tions
7 Summary and conclusions
In order to understand and simulate the major uxes involved in the nutrient and carboncycles in the ocean a generic 10-box biogeochemical model has been developedFollowing previous works (Fasham et al 1990 Prunet et al 1996) BIOMELL is basedon nitrogen It takes into account new and regenerated production as well as the particulateand dissolved parts of the exported production It has been validated in a rather oligotro-phic region the Northwestern Mediterranean Sea using the dataset obtained at theDyFAMed station (DyFAMed 1995) This region is characterized by a strong seasonalcycle and a signi cant export through DOM Coupled to a 1D mixed-layer model andforced by the ECMWF surface uxes BIOMELL reproduces the annual evolution of themajor stocks and uxes for 1991
This study has shown that several processes although crudely represented should betaken into account Very low winter phytoplankton biomass can only be simulated whenparameterizing Lagrangian effects of cell excursions to shadow areas by a limiting factoron growth depending on the mixed-layer depth CChl dependence with light is necessaryto simulate simultaneously low surface chlorophyll concentration and high pigmentcontent in the DCM Nitri cation may be an important process even close to the surfacewhich means that new production should be distinguished from nitrate based productionThis process had to be taken into account in our simulation to reproduce reasonable valuesof ammonium DOM export cannot be represented if an explicit semi-refractory DOMcompartment is not taken into account
Nevertheless several important issues have not found any satisfying solution in thisstudy As an example a single generic phytoplankton may be inappropriate to properlysimulate production and export Although the model is able to answer qualitatively well tothe seasonal variability of the forcing phytoplankton species follow each other accordingto the hydrodynamical and geochemical environment They are characterized by differentgrowth rates and sedimentation velocities and probably different CChl ratio Alsodepending on their size phytoplankton species have different predators which havedifferent grazing rates Moreover whether the phytoplankton considered remains in theregeneration loop (small agellates) or is grazed by larger plankters (diatoms) andultimately exported via large particles is a crucial question concerning the fate of organicmatter more speci cally when carbon exchanges with the atmosphere are consideredTherefore it is certainly suitable to develop models with different types of phytoplanktonall the more that zooplanktonis already divided into two size classes in the BIOMELL The
1998] 233Levy et al Primary production model of NW Mediterranean Sea
alternative choice could be to follow the ideas developed by Hurtt and Armstrong (1996)based on allometric considerations
Making a model more complex is justi ed only if there is enough data to constrain itsbehavior and the processes involved which brings us to a major problem concerningbiogeochemical modeling It concerns lack of data either to prescribe internal parametersor to validate the simulations even for a model which can be considered relatively simplewith regard to biological processes At the present time although it is believed to becrucial very little is known about the kinetics regulating the DOM compartments In thestandard run the partitioning between labile and refractory DOM has been tuned in orderto obtain correct export uxes as no direct measurements were available to set thatparameter Initial conditions of zooplankton concentrations are not known although thewinter threshold value strongly constrains the intensity and the timing of the bloom as wellas the export production The role of nitri cation has only been qualitatively assessed asthere is no ammonium data at DyFAMed station Concerning validation the lack ofmicrozooplankton data has already been emphasized Finally some basic parameters orvariables are measured or evaluated in different units For instance phytoplanktongrowthrates and DOM are usually given in carbon units whereas phytoplankton concentrationsare in chlorophyll units As the CN ratios are not well known and as most of thebiogeochemical models use nitrogen validation can only be qualitative as it has beenshown in the present study with DOM This issue goes beyond validation and puts theproblem of coupling the cycles of different biogeochemical tracers such as carbon andnitrogen
Acknowledgments Funding for this study was provided by French-JGOFS (Joint Global OceanFlux Studies) program the DRET (Direction des Recherches Etudes et Techniques) and the CNRS(Center National de la Recherche Scienti que) We are grateful to Diana Ruiz-Pino for usefuldiscussions We thank Jean-Claude Marty Bernard Avril Juan-Carlos Miquel Jacques ChiaveriniMicheline Bianchi France Van Wambeke and Laura Guliano for providing us the DyFAMed dataWe also thank Christophe Menkes and Nicolas Metzl for helpful comments on the manuscript andJean-PhilippeBoulanger for help in the graphic outputs
REFERENCESAlcaraz M 1988 Summer zooplankton metabolism and its relation to primary production in the
Western MediterraneanOcean Acta 9 Pelagic Mediterranean Oceanography185ndash191Andersen V and P Nival 1988a Modele drsquoecosysteme pelagique des eaux cotieres de la Mer
Ligure Ocean Acta 9 Pelagic Mediterranean Oceanography211ndash217mdashmdash 1988b A pelagic ecosystem model simulating production and sedimentation of biogenic
particles role of salps and copepodsMar Ecol Prog Ser 44 37ndash50Andre J-M 1990 Teledetection spaciale de la couleur de la mer algorithme drsquoinversion des
mesures du Coastal Zone Color Scanner Applications a lrsquoetude de la Mediterranee occidentalePhD University Paris 6 France
Antoine D A Morel and J-M Andre 1995 Algal pigment distribution and primary production inthe Eastern Mediterranean as derived from coastal zone color scanner observations J GeophysRes 100 16193ndash16209
Avril B 1995 Le carbone organiquedissous en milieu marin PhD University Paris 6
234 Journal of Marine Research [56 1
Bender M H Ducklow J Kiddon J Marra and J Martin 1992 The carbon balance during the1989 spring bloom in the North Atlantic Ocean 47degN 20degW Deep-Sea Res 39 1707ndash1725
Bethoux J-P 1981 Le phosphore et lrsquoazote en mer Mediterranee bilans et fertilite potentielleMarChem 10 141ndash158
mdashmdash 1989 Oxygen consumptionnew productionvertical advection and environmentalevolution inthe MediterraneanSea Deep-Sea Res 36 769ndash781
Bianchi M P Morin and P Le Corre 1993 Nitri cation rates nitrite and nitrate distribution in theAlmeria-Oran frontal system (easternAlboran Sea) J Mar Syst 5 327ndash342
Carlson C A H W Ducklow and A F Michaels 1994 Annual ux of dissolved organic carbonfrom the euphotic zone in the Northwestern Sargasso Sea Nature 371 405ndash408
Cho B C and F Azam 1990 Biogeochemical signi cance of bacterial biomass in the oceanrsquoseuphotic zone Mar Ecol Prog Ser 63 253ndash259
Claustre H 1994 The trophic status of various oceanic provinces as revealed by phytoplanktonpigment signaturesLimnol Oceanogr 39 1206ndash1210
Cloern J E C Grenz and L Vidergar-Lucas 1995 An empirical model of the phytoplanktonchlorophyllcarbon ratiomdashthe conversion factor between productivity and growth rate LimnolOceanogr 40 1313ndash1321
Copin-Montegut G and B Avril 1993 Vertical distribution and temporal variation on dissolvedorganic carbon in the Northwestern MediterraneanSea Deep-Sea Res 40 1963ndash1972
Doney S C D M Glover and R G Najjar 1996 A new coupled one dimensional biological-physical model for the upper ocean applications to the JGOFS Bermuda Atlantic Time seriesStudy (BATS) site Deep-Sea Res 43 591ndash624
Drange H 1994 An isopycnic coordinate carbon cycle model for the North Atlantic and thepossibilityof disposingof fossil fuel CO2 in the ocean PhD University of Bergen Norway
Ducklow H W and C A Carlson 1992 Oceanic bacterial production in Advances in MicrobialEcology P P K C Marshall New-York 113ndash181
Ducklow H W C A Carlson N R Bates A H Knap and A F Michaels 1995 Dissolved organiccarbon as a component of the biological pump in the North Atlantic Ocean Phil Trans R SocLond 348 161ndash167
Dugdale R C and J J Goering 1967 Uptake of new and regenerated forms of nitrogen in primaryproductivityLimnol Oceanogr 12 196ndash206
DYFAMED-JGOFS France 1995 Recueil de donnees (Janvier 1991ndashDecembre 1993)Eppley R W C Garside E H Renger and E Orellana 1990Variabilityof nitrate concentrationsin
nitrogen-depletedsubtropical surface waters Mar Biol 107 53ndash60Eppley R W and R W Koeve 1990 Nitrate use by plankton in the eastern subtropical North
Atlantic MarchndashApril 1989 Limnol Oceanogr 35 1781ndash1788Eppley R W and B J Peterson 1979 Particulateorganic matter ux and planktonicnew production
in the deep ocean Nature 282 57ndash70Fasham M J R 1995 Variations in the seasonal cycle of biological production in subarctic oceans
a model sensitivity analysis Deep-Sea Res 42 1111ndash1149Fasham M J R H W Ducklow and S M McKelvie 1990 A nitrogen-based model of plankton
dynamics in the oceanic mixed-layer J Mar Res 48 591ndash639Fasham M J R J L Sarmiento R D Slater H W Ducklow and R Williams 1993 Ecosystem
behavior at Bermuda station lsquolsquoSrsquorsquo and ocean weather station lsquolsquoIndiarsquorsquo a general circulation modeland observationalanalysis Global Biogeo Cycles 7 379ndash415
Ferrier-Pages C and F Rassoulzadegan 1994 N remineralization in planktonic protozoa LimnolOceanogr 39 411ndash419
1998] 235Levy et al Primary production model of NW Mediterranean Sea
Fowler S W L F Small and J La Rosa 1991 Seasonal particulate carbon ux in the coastalNorthwestern Mediterranean Sea and the role of zooplankton fecal matter Ocean Acta 1477ndash85
Frost B W 1987 Grazing control of phytoplankton in the open subarctic Paci c Ocean a modelassessing the role of mesozooplancton particularly the large calanoid copepods Neocalanus sppMar Ecol Prog Ser 39 49ndash68
Fuhrman J 1992 Bacterioplankton roles in cycling of organic matter the microbial food web inPrimary Productivityand BiogeochemicalCycles in the Sea P G Falkowski andA D WoodheadPlenum Press New-York 361ndash383
Gascard J C 1978 Mediterranean deep water formation baroclinic instability and oceanic eddiesOcean Acta 1 315ndash330
Gaspar P Y Gregories and J M Lefevre 1990A simple eddy kinetic energy model for simulationsof the oceanic vertical mixing tests at station papa and long term upper ocean study site JGeophys Res 95 16179ndash16193
Gentilhomme V 1992 Quanti cation des ux drsquoabsorption et de regeneration de lrsquoazote mineral(nitrate nitrite et ammonium) et organique (uree) dans la couche euphotique des oceansoligotrophesPhD University of Aix-Marseille II France
Gentilhomme V and G Slawyk 1991 Dosage de lrsquoammonium et de lrsquouree dans la coucheeuphotique In Production pelagique de la Mediterranee sub occidentaleCampagne Mediprod VIcampagnes OceanographiquesFrancaises 16 133ndash138
Gostan J and P Nival 1963 Distribution hivernale des caracteristiques hydrologiques en merLigure et estimation de lrsquoabondance du phytoplancton par la methode des pigments C R AcadSc Paris 257 2872ndash2875
Gran H and T Braarud 1935A quantitativestudy of phytoplanktonin the Bay of Fundy in the Gulfof Maine J Biol Board Canada I (5) 279ndash467
HarrisonW G L R Harris and B D Irwin 1996 The kineticsof nitrogenutilization in the oceanicmixed-layer nitrate and ammonium interactionsat nanomolar concentrationsLimnol Oceanogr41 16ndash32
Ho C and J Marra 1994 Early-spring export of phytoplanktonproduction in the NortheastAtlanticOcean Mar Ecol Prog Ser 114 197ndash202
Houghton J T G J Jenkins and J J Ephraums 1990 Climate Change the IPCC Scienti cAssessmentWMO UNEP
Hurtt G C and R A Armstrong 1996 A pelagic ecosystem model calibrated with BATS dataDeep-Sea Res 43 653ndash683
Jacques G 1988 Flux de carbone en milieu pelagique de Mediterranee occidentale lors de la oraison printaniere Ocean Acta 9 Pelagic Mediterranean Oceanography143ndash148
Jacques G M Minas J Neveux P Nival and G Slawyk 1976 Conditions estivales dans ladivergence de Mediterranee Nord-Occidentale III Phytoplancton Ann Inst Oceanogr 52141ndash152
Kirchman D L Y Susuki C Garside and H W Ducklow 1991 Bacterial oxidation of dissolvedorganic carbon in the North Atlantic cean during the spring bloom Nature 352 612ndash614
Krstulovic N T Pucher-Petkovic and M Solic 1995 The relation between bacterioplankton andphytoplanktonproduction in the mid Adriatic Sea Aquat Microb Ecol 9 41ndash45
Lawson L M E E Hofmann and Y H Spitz 1996 Time series sampling and data assimilation in asimple marine ecosystem model Deep-Sea Res 43 625ndash651
Lefevre D M Denis C Lambert and J-C Miquel 1996 Is DOC the main source of organicmatterremineralizationin the ocean water column J Mar Syst 7 281ndash291
236 Journal of Marine Research [56 1
Levy M 1996 Modelisation des cycles biogeochimiques en Mediterranee nord-occidentalevariabilitemesoechelle et cycle saisonnierPhD Paris 6
LonghurstA R and W G Harrison 1989 The biologicalpump pro les of planktonproductionandconsumption in the upper ocean Prog Oceanogr 22 47ndash123
Marra J T Dickey W S Chamberlin C Ho T Granata D A Kiefer C Langdon R Smith RBidigare and M Hamilton 1992 Estimation of seasonal primary production from moored opticalsensors in the Sargasso Sea J Geophys Res 97 7399ndash7412
Marty J-C 1993 Operation DYFAMED rapport drsquoactivite pour 1993 et programme pour 1994programme FranceJGOFS
Marty J-C B Avril G Copin-Montegut and J-C Miquel 1994a Importance of the dissolvedpathway in the vertical ux of carbon in the Ligurian Sea ndeg3 Le courrier de JGOFS-France
Marty J-C E Nicolas J C Miquel and S W Fowler 1994b Particulate uxes of organiccompounds and their relationship to zooplancton fecal pellets in the Northwestern MediterraneanSea Mar Chem 46 387ndash405
McGillicuddy D J J J McCarthy and A R Robinson 1995 Coupled physical and biologicalmodeling of the spring bloom in the North Atlantic (I) model formulation and one dimensionalbloom processesDeep-Sea Res 42 1313ndash1357
Medoc group 1970 Observationof formation of deep water in the MediterraneanSea 1969 Nature227 1037ndash1040
Millot C 1987 Circulation in the Western Mediterranean Sea Ocean Acta 9 Pelagic Mediterra-nean Oceanography143ndash149
Minas H J 1970 La distribution de lrsquooxygene en relation avec la production primaire enMediterranee nord-occidentaleMar Biol 7 181ndash204
Minas H J and M-C Bonin 1988 Oxygenation physique et biologique de la Mediterraneenord-occidentaleen hiver et au printemps Ocean Acta 9 Pelagic Mediterranean Oceanography123ndash131
Minas H J and L A Codispoti 1993 Estimation of primary production by observationof changesin the mesoscale nitrate eld ICES Mar Sci Symp 197 215ndash235
Minas H J M Minas B Coste J Gostan P Nival and M C Bonin 1988 Productionde base et derecyclage une revue de la problematique en Mediterranee Nord-Occidentale Ocean Acta 9155ndash162
Miquel J-C S W Fowler and J La Rosa 1993 Vertical particle uxes in the Ligurian Sea AnnInst Oceanogr 69 107ndash110
Miquel J-C S W Flower J La Rosa and P Buat-Menard1994 Dynamics of the downward ux ofparticles and carbon in the open Northwestern MediterraneanSea Deep-Sea Res 41 243ndash262
MorelA 1988 Optical modeling of the upper ocean in relation to its biogenousmatter content (caseI waters) J Geophys Res 93 10749ndash10768
MorelA 1991 Light and marine photosynthesisa spectralmodel with geochemicaland climatologi-cal implicationsProg Oceanogr 26 263ndash306
Morel A and J-M Andre 1991 Pigment distribution and primary production in the westernMedterraneanas derived and modeled from coastal zone color scanner observations J GeophysRes 96 12685ndash12698
Nival P S Nival and A Thiriot 1975 In uence des conditions hivernales sur les productionsphyto-etzooplanctoniquesen Mediterranee nord-occidentaleV Biomasse et productionzooplanc-tonique-relationsphyto-zooplancton Mar Biol 31 249ndash270
Pollehne F B Klein and B Zeitzschel 1993 Low light adaptation and export production in thedeep chlorophyllmaximum layer in the Northern Indian Ocean Deep-Sea Res 40 737ndash752
1998] 237Levy et al Primary production model of NW Mediterranean Sea
Prunet P J-F Minster D Ruiz Pino and I Dadou 1996 Assimilation of surface data in aone-dimensionalphysical biogeochemicalmodel of the surface ocean 1 Method and preliminaryresults Glob Biogeochem Cycl 10 111ndash138
Raimbault P M Rodier and I Taupier-Letage 1988 Size fraction of phytoplanktonin the LigurianSea and the Algerian Basin (MediterraneanSea) size distribution versus total concentrationMarMicrobial Food Webs 3 1ndash7
Razouls C and J H M Kouwenberg 1993 Spatial distribution and seasonal variation ofmesozooplankton biomass in the Gulf of Lions (Northwestern Mediterranean) Ocean Acta 16393ndash401
Riley G A 1942 The relationshipof vertical turbulenceand spring diatom owerings J Mar Res5 67ndash87
Sarmiento J L R D Slater M J R Fasham J R Ducklow J R Toggweiler and G T Evans1993 A seasonal three-dimensional ecosystem model of nitrogen cycling in the North Atlanticeuphotic zone Glob Biogeochem Cycl 7 417ndash450
Siegenthaler U and J L Sarmiento 1993Atmospheric carbon dioxide and the ocean Nature 365119ndash125
Simonot J-Y 1988 Thermodynamic-biological-optical coupling in the oceanic mixed-layer JGeophys Res 93 8193ndash8202
Small L F G A Knauer and M D Tuel 1987 The role of sinking fecal pellets in strati edeuphotic zones Deep-Sea Res 34 1705ndash1712
Sverdrup H U 1953 On conditions for the vernal blooming of phytoplanktonJ Cons Int ExporMer 18 287ndash295
Takahashi T W S Broecker and S Langer 1985 Red eld ratio based on chemical data fromisopycnal surfaces J Geophys Res 90 6907ndash6924
Ward B B 1986 Nitrogen transformations in the Southern California Bight Deep-Sea Res 34785ndash805
Ward B B K A Kilpatrick E H Renger and R W Eppley 1989 Biological nitrogen cycling inthe nitraclineLimnol Oceanogr 34 493ndash513
Woods J D and R Onken 1982 Diurnal variation and primary production in the oceanmdashpreliminary results of a Lagrangian ensemble model J Plankton Res 4 735ndash756
Woodward E M S 1994 Nanomolar ammonia concentrations in the western Mediterranean inWater Pollution Research report 32 J M Martin and H Barth eds 87ndash96
Yamazaki H and D Kamykowski 1991 The vertical trajectories of motile phytoplankton in awind-driven water column Deep-Sea Res 38 219ndash241
Received 29 January 1997 revised 30 September 1997
238 Journal of Marine Research [56 1
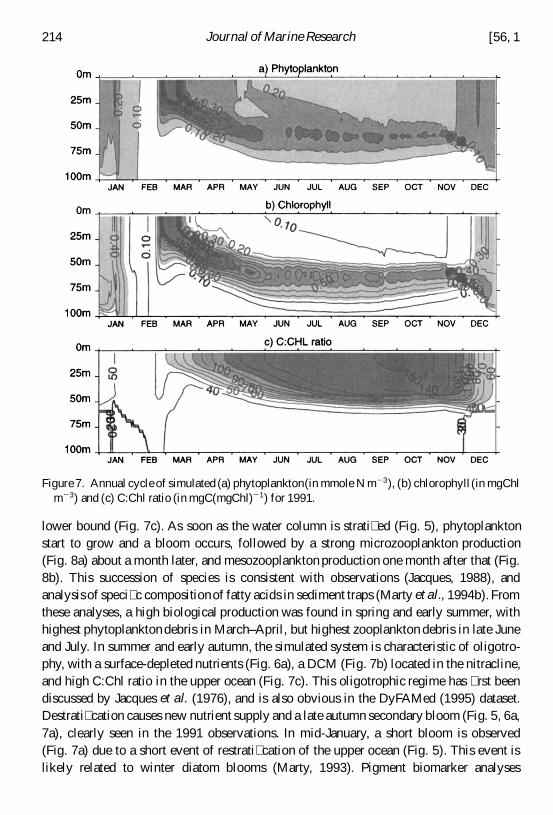