simulation study of impact of aeroelastic characteristics ... · nasa/tp-2002-211943 simulation...
TRANSCRIPT

NASA/TP-2002-211943
Simulation Study of Impact of Aeroelastic
Characteristics on Flying Qualities of a High
Speed Civil Transport
David L. Raney, E. Bruce Jackson, and Carey S. Buttrill
Langley Research Center, Hampton, _rginia
October 2002
https://ntrs.nasa.gov/search.jsp?R=20020084988 2018-08-18T21:33:38+00:00Z

The NASA STI Program Office... in Profile
Since its founding, NASA has been dedicated to the
advancement of aeronautics and space science. The
NASA Scientific and Technical Information (STI)
Program Office plays a key part in helping NASA
maintain this important role.
CONFERENCE PUBLICATION.
Collected papers from scientific and
technical conferences, symposia,
seminars, or other meetings sponsored or
co-sponsored by NASA.
The NASA STI Program Office is operated by
Langley Research Center, the lead center for NASA'sscientific and technical information. The NASA STI
Program Office provides access to the NASA STI
Database, the largest collection of aeronautical and
space science STI in the world. The Program Officeis also NASA's institutional mechanism for
disseminating the results of its research and
development activities. These results are
published by NASA in the NASA STI Report
Series, which includes the following report
types:
TECHNICAL PUBLICATION. Reports of
completed research or a major significant
phase of research that present the results
of NASA programs and include extensive
data or theoretical analysis. Includes compilations
of significant scientific and technical data and
information deemed to be of continuing reference
value. NASA counterpart of peer-reviewed formal
professional papers, but having less stringent
limitations on manuscript length and extent of
graphic presentations.
TECHNICAL MEMORANDUM.
Scientific and technical findings that are
preliminary or of specialized interest,
e.g., quick release reports, working
papers, and bibliographies that containminimal annotation. Does not contain
extensive analysis.
CONTRACTOR REPORT. Scientific and
technical findings by NASA-sponsored
contractors and grantees.
SPECIAL PUBLICATION. Scientific,
technical, or historical information from
NASA programs, projects, and missions,
often concerned with subjects having
substantial public interest.
TECHNICAL TRANSLATION. English-
language translations of foreign scientific
and technical material pertinent toNASA's mission.
Specialized services that complement the
STI Program Office's diverse offerings include
creating custom thesauri, building customized
databases, organizing and publishing
research results.., even providing videos.
For more information about the NASA STI
Program Office, see the following:
• Access the NASA STI Program Home
Page at http://www.sti.nasa.gov
• Email your question via the Internet to
• Fax your question to the NASA STI
Help Desk at (301) 621-0134
• Telephone the NASA STI Help Desk at
(301) 621-0390
Write to:
NASA STI Help Desk
NASA Center for AeroSpace Information7121 Standard Drive
Hanover, MD 21076-1320

NASA/TP-2002-211943
Simulation Study of Impact of Aeroelastic
Characteristics on Flying Qualities of a High
Speed Civil Transport
David L. Raney, E. Bruce Jackson, and Carey S. Buttrill
Langley Research Center, Hampton, _rginia
National Aeronautics and
Space Administration
Langley Research Center
Hampton, Virginia 23681-2199
October 2002

The use of trademarks or names of manufacturers in this report is for accurate reporting and does not constitute an I
official endorsement, either expressed or implied, of such products or manufacturers by the National Aeronautics andSpace Administration.
Available from:
NASA Center for AeroSpace Information (CASI)7121 Standard Drive
Hanover, MD 21076-1320
(301) 621-0390
National Technical Information Service (NTIS)
5285 Port Royal RoadSpringfield, VA 22161-2171
(703) 605-6000

Contents
Nomenclature ..................................................................................................................................................... vii
Summary .............................................................................................................................................................. 1Introduction .......................................................................................................................................................... 1
Test Objectives and Approach ............................................................................................................................ 2
Experimental Design and Apparatus .................................................................................................................. 3Aeroelastic HSCT Simulation Model ............................................................................................................. 3
General Configuration Description, Propulsion, and Gear Models .......................................................... 3
Dynamic Aeroservoelastic Model .............................................................................................................. 4Control Laws .............................................................................................................................................. 4
Variation of Dynamic Aeroelastic Characteristics ........................................................................................ 5Variation of Structural Stiffness ................................................................................................................ 5
Variation of Modal Damping ..................................................................................................................... 6Elimination of Control Excitation of Selected Modes .............................................................................. 7
Elimination of DASE Visual Cues ............................................................................................................ 8
Variation of Turbulence Level ................................................................................................................... 8
Test Matrix and Evaluation Procedure ...................................................................................................... 8
Evaluation Maneuvers .................................................................................................................................... 9
Nominal Approach and Landing ................................................................................................................ 9
IAG Lateral Offset Landing ....................................................................................................................... 9
Composite Flight Director Tracking ........................................................................................................ 10Data Collected ............................................................................................................................................... 10
Transcribed Cooper-Harper Ratings and Comments .............................................................................. 10
ASE Ride Quality and Control Influence Ratings ................................................................................... 10
Digital Time Histories .............................................................................................................................. 11
Videotape Recordings .............................................................................................................................. 11
Langley Visual Motion Simulator ................................................................................................................ 12
Cab Arrangement and Control Inceptor ................................................................................................... 12
Visual Projection and Display Formats ................................................................................................... 12
Motion Characteristics and Responses .................................................................................................... 12Results and Discussion ...................................................................................................................................... 14
Configuration Rankings by Pilot Preference Based on DASE Ratings ...................................................... 14
DASE Ride Quality Ratings Versus Pilot Preference ............................................................................. 14
Control Influence Ratings Versus Pilot Preference ................................................................................. 15
Biodynamic Coupling ................................................................................................................................... 15
Configuration Ranking Based on Cooper-Harper Ratings .......................................................................... 17
Impact of Structural Stiffening ..................................................................................................................... 18
Impact of Display Compensation ................................................................................................................. 18
Impact of Damping Level ............................................................................................................................. 19
Impact of Cancellation .................................................................................................................................. 19
Impact of Increasing Turbulence Level ........................................................................................................ 20
Correlation of Ride Quality Ratings With Cockpit Vibration Spectra ........................................................ 20
Concluding Remarks ......................................................................................................................................... 21
Appendix A--Test Pilot Biographies ............................................................................................................... 60
Appendix B-- Flight Cards ................................................................................................................................ 61
Appendix C--HUD Symbology ....................................................................................................................... 68
Appendix D--Flight Director Implementation for Task 3115 ........................................................................ 74References .......................................................................................................................................................... 78
iii

<
List of Tables
Table
Table
Table
Table
Table
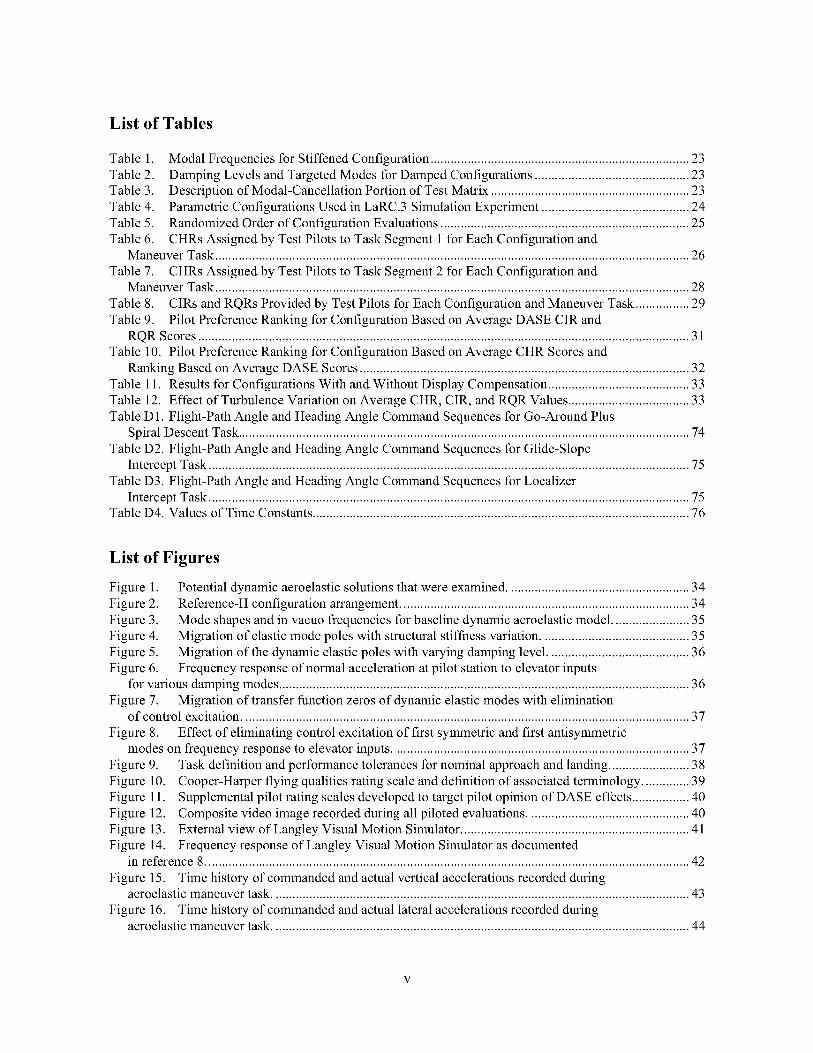
1. Modal Frequencies for Stiffened Configuration ............................................................................. 23
2. Damping Levels and Targeted Modes for Damped Configurations .............................................. 23
3. Description of Modal-Cancellation Portion of Test Matrix ........................................................... 23
4. Parametric Configurations Used in LaRC.3 Simulation Experiment ............................................ 24
5. Randomized Order of Configuration Evaluations .......................................................................... 25
Table 6. CHRs Assigned by Test Pilots to Task Segment 1 for Each Configuration andManeuver Task ............................................................................................................................................. 26
Table 7. CHRs Assigned by Test Pilots to Task Segment 2 for Each Configuration andManeuver Task ............................................................................................................................................. 28
Table 8. CIRs and RQRs Provided by Test Pilots for Each Configuration and Maneuver Task ................ 29
Table 9. Pilot Preference Ranking for Configuration Based on Average DASE CIR and
RQR Scores .................................................................................................................................................. 31
Table 10. Pilot Preference Ranking for Configuration Based on Average CHR Scores and
Ranking Based on Average DASE Scores .................................................................................................. 32
Table 11. Results for Configurations With and Without Display Compensation .......................................... 33
Table 12. Effect of Tuxbulence Variation on Average CHR, CIR, and RQR Values .................................... 33
Table D 1. Flight-Path Angle and Heading Angle Command Sequences for Go-Around Plus
Spiral Descent Task ...................................................................................................................................... 74
Table D2. Flight-Path Angle and Heading Angle Command Sequences for Glide-Slope
Intercept Task ............................................................................................................................................... 75
Table D3. Flight-Path Angle and Heading Angle Command Sequences for Localizer
Intercept Task ............................................................................................................................................... 75Table D4. Values of Time Constants ................................................................................................................ 76
List of Figures
Figure
Figure
Figure
Figure
Figure
1. Potential dynamic aeroelastic solutions that were examined ...................................................... 34
2. Reference-H configuration arrangement ...................................................................................... 34
3. Mode shapes and in vacuo frequencies for baseline dynamic aeroelastic model ....................... 35
4. Migration of elastic mode poles with structural stiffness variation ............................................ 35
5. Migration of the dynamic elastic poles with varying damping level .......................................... 36
Figure 6. Frequency response of normal acceleration at pilot station to elevator inputs
for various damping modes .......................................................................................................................... 36
Figure 7. Migration of transfer function zeros of dynamic elastic modes with eliminationof control excitation ..................................................................................................................................... 37
Figure 8. Effect of eliminating control excitation of first symmetric and first antisymmetric
modes on frequency response to elevator inputs ........................................................................................ 37
Figure 9. Task definition and performance tolerances for nominal approach and landing ........................ 38
Figure 10. Cooper-Harper flying qualities rating scale and definition of associated terminology .............. 39
Figure 11. Supplemental pilot rating scales developed to target pilot opinion of DASE effects ................. 40
Figure 12. Composite video image recorded during all piloted evaluations ................................................ 40
Figure 13. External view of Langley Visual Motion Simulator .................................................................... 41
Figure 14. Frequency response of Langley Visual Motion Simulator as documentedin reference 8 ................................................................................................................................................ 42
Figure 15. Time history of commanded and actual vertical accelerations recorded duringaeroelastic maneuver task ............................................................................................................................ 43
Figure 16. Time history of commanded and actual lateral accelerations recorded duringaeroelastic maneuver task ............................................................................................................................ 44

Figure17. PilotpreferencerankingofparametricaeroelasticconfigurationsbasedonDASEratings................................................................................................................................................45
Figure18. Averageridequalityratingversusoverallpilotpreferencerankingofparametricconfigurations...............................................................................................................................................46
Figure19. Averagecontrolinfluenceratingversusoverallpilotpreferencerankingofparametricconfigurations............................................................................................................................46
Figure20. Power-spectralanalysisofbiodynamiccouplingincidentforpilotB........................................47Figure21. ExamplesofbiodynamiccouplingincidentsforpilotsB,E,andC...........................................48Figure22. Variationof averageRQRwithincreasingstructuralstiffness...................................................49Figure23. Variationof averageCIRwithincreasingstructuralstiffness.....................................................49Figure24. Variationof averageCHRwithincreasingstructuralstiffness...................................................50Figure25. Variationof averageRQRwithincreasingmodaldamping........................................................50Figure26. Variationof averageCIRwithincreasingmodaldamping.........................................................51Figure27. Impactofmode-cancelingcontrolonRQR.................................................................................51Figure28. Impactofmode-cancelingcontrolonaverageCIR.....................................................................52Figure29. Variationof averageCHRwithincreasingdampingandmodalcancellation............................52Figure30. Measuredlateralaccelerationsfromlast15sofoneexamplerunperformed
withSTIF2configuration...........................................................................................................................53Figure31. Lateralvibrationspectrumplotforexampletimehistory...........................................................54Figure32. Lateralvibrationspectraplotsforall lateral-offsettimehistoriesgivenRQRof 5...................55Figure33. Lateralvibrationspectralenvelopebasedonmaximumandminimumrms
spectrumvaluesforallrunsgivenRQRof5..............................................................................................56Figure34. LateralvibrationspectralenvelopesforvariousRQRlevels......................................................57Figure35. VerticalvibrationspectralenvelopesforvariousRQRlevels....................................................58Figure36. Verticalvibrationspectralenvelopesbasedonridequalityratingplotted
withISOverticalvibrationstandard............................................................................................................59FigureB1. Compositeflightdirectortrackingtask........................................................................................64FigureFigureFigureFigureFigureFigureFigureFigureFigureFigureFigureFigureFigureFigureFigureFigureFigureFigureFigureFigureFigureFigure
B2. Nominalapproachandlanding.....................................................................................................65B3. IAGlateraloffsetlanding.............................................................................................................66B4. Taskratingcard.............................................................................................................................67C1. HUDdisplay..................................................................................................................................68C2. Bankanglescalewithrollpointerandsideslipindicator............................................................69C3. Headingscale-horizonline...........................................................................................................69C4. Airspeedtapedisplay....................................................................................................................69C5. Altitudedisplaytape.....................................................................................................................70C6. Velocityvectorcluster..................................................................................................................71C7. Pitchgrid,referencewaterline,andheadingscale.......................................................................71C8. ILSglide-slopeandlocalizerdisplays..........................................................................................72C9. Analog-digitalangleofattackdisplay..........................................................................................72C10.Analog-digitalaccelerationtapedisplay......................................................................................72C11.Takeoffclimbguidancesystem....................................................................................................73C12.Depressedglide-slopereferenceline............................................................................................73C13.Tail-scrapebar...............................................................................................................................73C14.Referencewaterline.......................................................................................................................73C15.Digitalinformationselectivedisplay............................................................................................73D1. Flight-pathangleandheadingangletimehistories.....................................................................74D2. Flight-pathangletimehistoryforglide-slopeintercepttask.......................................................75D3. Headinganglecommandtimehistoryforlocalizerintercepttask..............................................76D4. Flightdirectorsymbol...................................................................................................................77
vi

Nomenclature
AGL
ALT
AN
AOA
ARI
A/T
Amp
Avg
BDC
CDU
C.G.
CGI
CHR
CIR
CRT
Config
DASE
DH
DIA
DME
Dir
EAS
EPR
FAA
above ground level, ft
altitude
antisymmetric
angle of attack, deg
aileron-rudder interconnect
autothrottle
amplitude
average
biodynamic coupling
cockpit display unit
center of gravity, percentage of mean aerodynamic chord
computer generated imagery
Cooper-Harper rating
control influence rating
cathode-ray tube
aircraft configuration
dynamic aeroservoelastic
decision height
Denver International Airport
distance measuring equipment (distance to runway threshold)
directional
equivalent airspeed
exhaust pressure ratio (shorthand for throttle position)
Federal Aviation Administration
vii

F/D
fpm
ft/sec,fl/s
G,g
GEAR
GS
GW
HSCT
HSD
HSR
HUD
IAG
IC
ILS
KEAS/m
kn,kts
LaRC
Lat
LEF
LOC
M
MAC
MFC
MIC
MTE
flightdirector
feetperminute
feetpersecond
accelerationduetogravity,32.2fl/s2
landinggearposition
glideslope(partofinstrumentlandingsystem)
grossweight
HighSpeedCivilTransport
horizontalsituationdisplay
highspeedresearch
head-updisplay
NiagraFallsInternationalAirport
initialcondition
instrumentlandingsystem
equivalentairspeed,knots
knots
LangleyResearchCenter
lateral
leading-edgeflaps,deg
localizer(partofinstrumentlandingsystem)
Machnumber
meanaerodynamicchord
finalcruisemasscondition
initialcruisemasscondition
missiontaskelement
Vlll

MTOGW
MZFW
Max
Min
ms
M13
N/A
NASA
Ny
Nz
nmi
OM
PF
PFD
PIO
PNF
PSCAS
ps
p/6
QSAE
R/C
RCB
RQR
Ref-H
Rwy
maximum takeoff gross weight
maximum zero-fuel weight
maximum
minimum
millisecond
Mass case 13_aximum taxi weight at forward C.G.
not applicable
National Aeronautics and Space Administration
lateral acceleration, g units
normal acceleration, g units
nautical miles
outer marker
pilot flying (evaluation pilot)
primary flight display
pilot-induced oscillation
pilot not flying (test engineer)
Pitch Stability and Control Augmentation System
pilot station
lateral-directional control law
quasi-static aeroelastic
rate of climb
ride comfort boundary
ride quality rating
Boeing Reference-H supersonic transport design
runway
ix

rills
R 1,R2
SCAS
SPD
SVS
SY
ss
TCA
TEF
TIFS
TOGA
Trim
VFR
VMS
gapp
Vappl
Vapp2
gg/a
gmin
Vmo, Mmo
Vr
Vref
v1
v2
root mean square
constant value during a run, either + 1 or -1
stability and control augmentation system
surface position display
synthetic vision system
symmetric
stall speed
Technology Concept Aircraft
trailing-edge flaps, deg
total in-flight simulator
takeoff go-around
indicates this parameter should be set to value required to achieve trimmed (unaccelerated)initial conditions
visual flight rules
Langley Visual Motion Simulator
approach speed
approach speed, first approach segment
approach speed, second approach segment
go-around speed
minimum operating speed
maximum operating speeds
takeoff rotation speed, knots
reference speed
takeoff decision speed
takeoff safety speed

XTD
XVS
x
YTD
Y
z
_,/v
c_
number of feet from threshold
external vision system
longitudinal displacement of simulator cockpit
number of feet from centerline
lateral displacement of simulator cockpit
vertical displacement of simulator cockpit
angle of attack
longitudinal control law
standard deviation
bank angle, deg
yaw angle, deg
xi
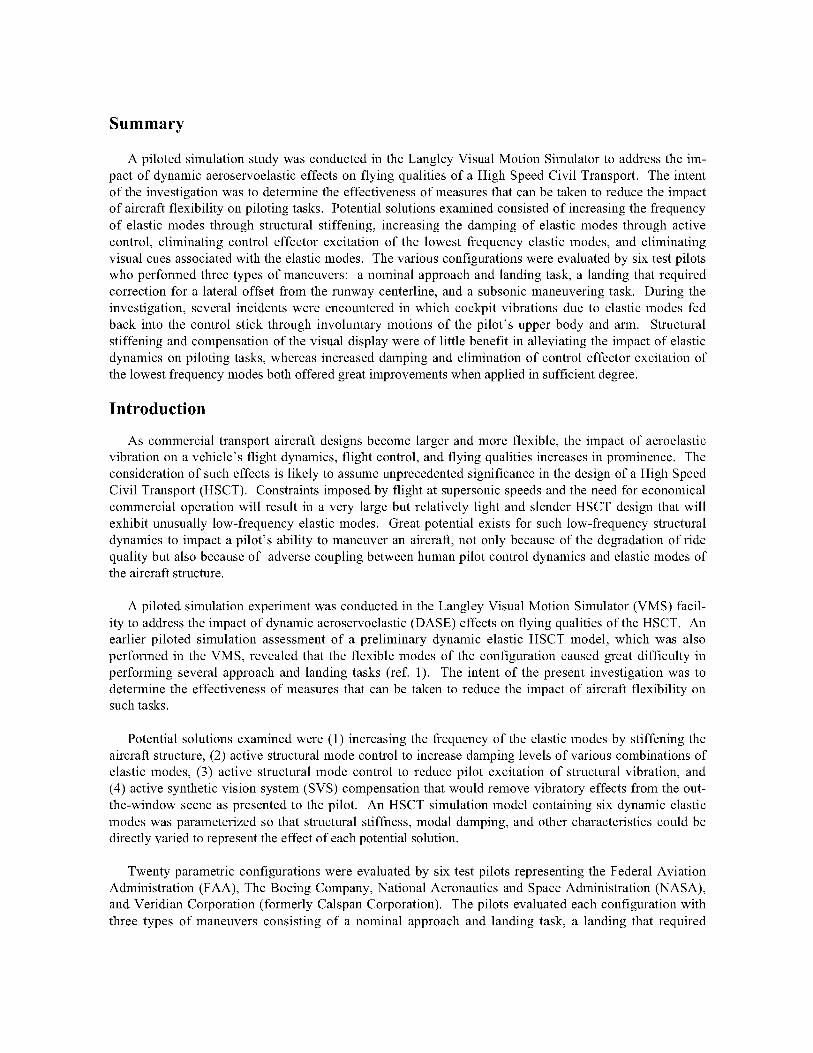
Summary
A piloted simulation study was conducted in the Langley Visual Motion Simulator to address the im-
pact of dynamic aeroservoelastic effects on flying qualities of a High Speed Civil Transport. The intent
of the investigation was to determine the effectiveness of measures that can be taken to reduce the impact
of aircraft flexibility on piloting tasks. Potential solutions examined consisted of increasing the frequency
of elastic modes through structural stiffening, increasing the damping of elastic modes through active
control, eliminating control effector excitation of the lowest frequency elastic modes, and eliminating
visual cues associated with the elastic modes. The various configurations were evaluated by six test pilots
who performed three types of maneuvers: a nominal approach and landing task, a landing that required
correction for a lateral offset from the runway centerline, and a subsonic maneuvering task. During the
investigation, several incidents were encountered in which cockpit vibrations due to elastic modes fed
back into the control stick through involuntary motions of the pilot's upper body and arm. Structural
stiffening and compensation of the visual display were of little benefit in alleviating the impact of elastic
dynamics on piloting tasks, whereas increased damping and elimination of control effector excitation of
the lowest frequency modes both offered great improvements when applied in sufficient degree.
Introduction
As commercial transport aircraft designs become larger and more flexible, the impact of aeroelastic
vibration on a vehicle's flight dynamics, flight control, and flying qualities increases in prominence. The
consideration of such effects is likely to assume unprecedented significance in the design of a High Speed
Civil Transport (HSCT). Constraints imposed by flight at supersonic speeds and the need for economical
commercial operation will result in a very large but relatively light and slender HSCT design that will
exhibit unusually low-frequency elastic modes. Great potential exists for such low-frequency structural
dynamics to impact a pilot's ability to maneuver an aircraft, not only because of the degradation of ride
quality but also because of adverse coupling between human pilot control dynamics and elastic modes ofthe aircraft structure.
A piloted simulation experiment was conducted in the Langley Visual Motion Simulator (VMS) facil-
ity to address the impact of dynamic aeroservoelastic (DASE) effects on flying qualities of the HSCT. An
earlier piloted simulation assessment of a preliminary dynamic elastic HSCT model, which was also
performed in the VMS, revealed that the flexible modes of the configuration caused great difficulty in
performing several approach and landing tasks (ref. 1). The intent of the present investigation was to
determine the effectiveness of measures that can be taken to reduce the impact of aircraft flexibility onsuch tasks.
Potential solutions examined were (1) increasing the frequency of the elastic modes by stiffening the
aircraft structure, (2) active structural mode control to increase damping levels of various combinations of
elastic modes, (3) active structural mode control to reduce pilot excitation of structural vibration, and
(4) active synthetic vision system (SVS) compensation that would remove vibratory effects from the out-
the-window scene as presented to the pilot. An HSCT simulation model containing six dynamic elastic
modes was parameterized so that structural stiffness, modal damping, and other characteristics could be
directly varied to represent the effect of each potential solution.
Twenty parametric configurations were evaluated by six test pilots representing the Federal Aviation
Administration (FAA), The Boeing Company, National Aeronautics and Space Administration (NASA),
and Veridian Corporation (formerly Calspan Corporation). The pilots evaluated each configuration with
three types of maneuvers consisting of a nominal approach and landing task, a landing that required

correctionfora lateraloffsetfromtherunwaycenterline,andasubsonicmaneuveringtask.Pilotratingsandcockpitvibrationmeasurementswereanalyzedtoprovideinsightregardingtheeffectivenessof eachpotentialsolutionconsidered.
Test Objectives and Approach
The primary objective of this investigation was to determine the effectiveness of measures that can be
taken to reduce the impact of aircraft flexibility on piloting tasks for an HSCT. The secondary objective
was to establish preliminary guidelines for designing a structural mode control system for an HSCT
concept. An earlier simulation study that used a preliminary dynamic aeroelastic HSCT model was
performed in the VMS. That study, referred to as the "LaRC.1 Piloted Simulation Assessment" in the
High Speed Research Program, revealed an increase in the difficulty of approach and landing tasks when
dynamic elastic modes were included in the simulation (ref. 1). The approach of the present investiga-
tion, referred to as the "LaRC.3 Aeroelastic Simulation Experiment" in the High Speed Research
Program, was to parametrically vary certain aspects of the aeroelastic model to provide a simplified
representation of several potential means of reducing the impact of dynamic aeroelasticity on piloting
tasks. These potential solutions are depicted in figure 1 and described subsequently.
The first potential solution considered was to stiffen the vehicle structure. Structural stiffening tends
to increase the modal frequencies and was approximated in the experiment by simply applying a stiffen-
ing factor to the frequencies associated with each DASE mode in the existing model. In vacuo frequen-
cies of the dynamic elastic modes were multiplied by a given frequency ratio to represent a stiffer aircraft
structure without altering the aerodynamic characteristics, mass characteristics, or in vacuo mode shapes
of the configuration. This experimental approach therefore represents an idealization in which structural
stiffness is added without the associated weight penalty. In this way we sought to gain insight into how
stiff the structure must be to avoid difficulties in flying qualities caused by aeroelasticity.
The second potential solution was to increase modal damping, as could be achieved by employing an
active mode suppression control system. The effect of such a system was approximated by increasing the
damping of the existing elastic modes. By simply varying the damping ratios associated with selected
elastic modes, the experiment examined the level of damping augmentation that an active mode suppres-
sion system must provide to restore acceptable flying qualities.
An idealized mode-canceling control system may also be envisioned that could use multiple control
effectors at the tail, wing, and/or nose of the aircraft to pitch, roll, or yaw the vehicle while avoiding any
excitation of the lowest frequency elastic modes. This mode-canceling system would represent a higher
risk structural mode control concept, and it is the third potential solution considered in the investigation.
The term "mode-canceling control" is used here to refer to input shaping for distributed control effectors
that would avoid excitation of selected modes. The modal dynamics would remain, however, and would
be subject to excitation by turbulence. Such a solution was approximately represented in the experiment
by eliminating the ability of control effector inputs to excite the first symmetric and first antisymmetric
modes. This approach provided information regarding the effectiveness of such a control concept and the
relative importance of modal cancellation versus modal damping.
Compensation of the pilot's visual display to eliminate perturbations due to structural vibration was
the fourth potential solution considered in the investigation. This factor had been considered by Waszak,
Davidson, and Schmidt in an earlier investigation where compensation of visual cues was used to elimi-
nate bouncing of the horizon relative to the head-up display (HUD) due to dynamic elasticity (ref. 2).

Suchcompensationwasfoundto haveapositiveeffectonthepilots'opinionof a flexibleB-1aircraftsimulation.A similarapproachwasrepresentedin theexistingaeroelasticHSCTsimulationby simplyeliminatingthedisplaypertuxbationsduetoaeroelasticitythatwerenominallyincludedin thesimulation.
Byexploringtheparametricvariationsjustdescribed,informationwasgainedregardingtheeffective-nessof eachapproachandthedegreetowhichit mustbeexercisedinorderto achievethedesiredflyingqualities.Themeansof approximatingthevariousapproachesbydirectlymanipulatingcharacteristicsofthedynamicaeroelasticmodelpermittedtimelyexecutionof anexperimentthatcapturedthefundamentaleffectsofinterestwithouthavingtodesignandimplementcandidatesolutions.
Experimental Design and Apparatus
The following sections of this report describe the mathematical aircraft simulation model, the test
matrix of aeroelastic configurations, the piloted evaluation maneuvers and data collected, and the test
procedures used in this experiment, as well as the motion-based simulation facility in which the evalua-tions were conducted.
Aeroelastic HSCT Simulation Model
This experiment used a mathematical simulation of the so-called Cycle 3 version of the Boeing
Reference-H (Ref-H) supersonic transport design (ref. 3). The model was published by Boeing Commer-
cial Airplane Group in the summer of 1996 as the fourth major release in a series of increasingly detailed
math models of the Ref-H configuration. The simulation model is based upon a combination of wind
tunnel and computational fluid dynamics studies of the Ref-H design, ranging from low subsonic to
Mach 2.4 supersonic wind tunnel studies.
The Cycle 3 release has improved fidelity over previous releases for aerodynamics, inertia, engines,
landing gear, and actuation systems. The geometry of the Ref-H configuration was modeled in the simu-
lation so that an accurate assessment of tail, nacelle, and wingtip strike incidents (inadvertent contact with
ground) could be made during landing evaluations. In addition, finite-element structural models were
used to predict the effect of steady flight loads upon aerodynamic stability derivatives, referred to as
quasi-static aeroelastic (QSAE) effects. A key feature of the math model is the inclusion of DASE
effects, which requires additional states to represent the dynamic flexing of the aircraft structure.
General Configuration Description, Propulsion, and Gear Models
The Ref-H vehicle design has a cranked-arrow planform, a conventional aft tail, and four underslung
engines as shown in figure 2. The control devices include an independently actuated horizontal stabilizer
and elevator, a three-segment rudder on a fixed vertical fin, eight trailing-edge flaperons (four per wing),
four leading-edge flaps (two per wing), and a vortex fence device and two spoiler-slot deflectors on each
wing. The elevator and horizontal tail are geared 2:1 by software in the current pitch control law.
The fuselage has a maximum diameter on the order of 12 ft and is expected to carry approximately
300 passengers in three seating classes. The configuration is approximately 310 ft long with a wingspanof 130 ft.
The aircraft has an operating empty weight of 280 000 lb and a maximum taxi weight of 650 000 lb.
Final cruise weight is expected to be approximately 385000 lb. Maximum takeoff gross weight
(MTOGW) is 650 000 lb and maximum zero-fuel weight (MZFW) is 350 000 lb. The center of gravity
(C.G.) can vary from as far forward as 48.1 percent mean aerodynamic chord (MAC) to as far aft as

56.6percentMAC. Thetasksthatwereperformedduringthisexperimentusedthefinalcruiseweightof384862lbwithaC.G.at53.2percentMAC.TheMACisapproximately86ft.
TheRef-Hdesignincludestwomixed-flowturbofanenginesundereachwingcapableof 53500lb ofgrossthrustattakeoff.Theaxisymmetricinletincludesatranslatingcenterbodyspiketo adjusttheloca-tionof theshockwaveduringsupersoniccruise.Theoutboardenginesarelocated31.2ft fromthecenterlineof theaircraftandarecantedinwardat2.4° andupward3.25° relativeto thecenterlineoftheaircraft.Theinboardenginesarelocated17.4ft fromthecenterlineandarecantedinward1° andupward5.7°.
Thelandinggearmodelcontainedin theCycle3simulationconsistsofthreesetsofmaingear,locatedjustbehindtheC.G.envelopeandarrangedin left,center,andrightsetsof tiresabreastof eachother,andanosegear.Themaingeararelocatedapproximately156ft behindthecockpitandhavea17.7-ftstance.Thenosegearis locatedapproximately56ft behindthecockpit.Turningangleof thenosegearis 75°.Thedynamicaeroelasticmodelusedin thisexperimentcannotaccuratelyrepresenttheaeroelasticexcita-tionthatwouldoccurduringlandingrolloutssincetherearenoaeroelasticinputsforgearreactionforces.Aeroelasticperturbationsatthecockpitstationin responseto geartouchdownalsocouldnotbeaccuratelyrepresentedin this simulation.Therefore,pilotsparticipatingin thisexperimentdidnotconsiderthederotationor landingrolloutintheiraeroelasticevaluations.
Dynamic Aeroservoelastic Model
The dynamic aeroservoelastic portion of the model used in this simulation experiment contained six
flexible aircraft modes, three symmetric (SY) and three antisymmetric (AN). The general mode shapes
and their associated in vacuo frequencies are shown in figure 3. The aeroelastic model was based on a
NASTRAN version of the Elfini 892-STR-E finite-element model. The model was generated at three
different flight conditions: Mach 0.24 at a weight of 384 862 lb and a C.G. location of 53.2 percent MAC
(landing), Mach 2.4 at a weight of 384 862 lb and a C.G. location of 53.2 percent MAC (final supersonic
cruise), and Mach 0.24 at a weight of 649914 lb and a C.G. location of 48.1 percent MAC (takeoff).
Only the landing case was used in this experiment.
Dynamic aeroelastic modes contained in the model could be excited by turbulence and by control
effector movements. No inputs from landing gear or engine pylon reaction forces were included in the
model. Visual effects of the structural flexibility were provided in the simulation. The out-the-window
scene presented on the cockpit monitors moved in relation to the HUD to represent the local perturbations
in pitch and yaw at the pilot station. The overall effect was that the out-the-window scene appeared to
bounce slightly both vertically and laterally in response to elastic excitation. These visual perturbations
were typically approximately --0.1 ° during maneuvers performed with DASE effects.
Control Laws
The simulation model used control laws referred to as the )/V system in the longitudinal axis and the
p/[3 system in the lateral-directional axis (refs. 4 and 5). These designs allowed the pilot to command
flight-path rate with longitudinal stick inputs, roll rate with lateral stick inputs, and sideslip angle with
rudder inputs. The longitudinal )/V system also included an autothrottle for airspeed regulation. When
the stick was in or very near the neutral position (detent), the control laws maintained constant flight path,
bank angle, and airspeed. These control laws were developed by The Boeing Company and were imple-
mented in the Langley simulation model. As a whole, the combined control laws are referred to as the
"stability and control augmentation system," or SCAS. The SCAS is designed to provide stabilization

andcontrolauthoritysufficientto performthevariousmaneuvertasksincludedin theLaRC.3experi-ment.Thedesignof theSCASissomewhatoptimisticin thatit usesidealfeedbacksignalsthatreflectthemotionsof themeanbodyaxis,acoordinatesystemthattracksthecentroidof thevibratingaircraftstructure.Theaeroelasticdynamicsthereforeinfluencedstabilityof theclosed-loopsystemonlytotheextentthatthemeanaxismotionswereinfluenced.In reality,localaeroelasticperturbationswouldinfluencesensorfeedbacks,creatingthepotentialforadverseinteractionsbetweenelasticmodesandthestabilityaugmentationsystem.Thepotentialfor suchinteractionswill presentamajorchallengetodesignersof thevehicleflightcontrolsystems.Furtherexplanationof thecontrollawstrategy,architec-ture,andimplementationisprovidedin references4and5.
Theneedto operatewithintheexistingairspacesystemmandatesthattheHSCTmixwithsubsonictrafficin theterminalenvironmentandoperateatsubsonicspeeds.Thisoperationrequiresthedesigntofly mostapproachesonthe"backside"of thedragcurve;thatis, anincreaseinpowerisrequiredto trimfor areductioninairspeed.Thisunconventionalthrottleoperationwouldprobablynecessitateextensiveretrainingof flightcrews.However,thebacksidecharacteristiccanbemaskedby usinganautothrottlesystem.AnautothrottleisanintegralpartoftheBoeing)/V controllaw,andlandingswerealwaysper-formedwiththeautothrottleactiveduringthisinvestigation.
Themethodofusingavailablecontrolsurfacesforvariousflightcontrolfunctions(controlallocation)isbasedontheinformationprovidedin reference3,alongwithactuatorratelimitsthatwereappliedtothecontrolsurfaces.In theLaRC.1simulationassessment,severalincidentsof pilot-inducedoscillation(PIO)wereencounteredduringtasksexecutedwithoutDASEeffectspresent.Thedataindicatedthatflaperonratelimitingwasprobablythecauseoftheseincidents.Flaperonactuatorratelimitsof 50deg/swereusedduringtheLaRC.1assessment,andtheHSRGuidanceandFlightControlIntegratedTechnol-ogyTeamconcludedthataratelimit of 90deg/smighteliminatethePIOdifficulty. Therefore,the(LaRC.3)simulationexperimentdescribedinthispaperusedthefaster(90deg/s)flaperonactuatorrates.
Variation of Dynamic Aeroelastic Characteristics
The baseline model was modified to allow parametric variation of several characteristics associated
with the DASE effects. These modifications allowed the impact of structural stiffening, modal damping,
modal cancellation, and visual cues to be evaluated from a piloted control standpoint.
Variation of Structural Stiffness
The effect of structural stiffening was represented in the simulation by increasing the frequencies of all
six dynamic elastic modes included in the model. The in vacuo frequencies of the modes were multiplied
by a given frequency ratio to represent a stiffer aircraft structure without altering the aerodynamic
characteristics, mass characteristics, or in vacuo mode shapes of the configuration. This experimental
approach therefore represents an idealization in which structural stiffness is added without the associated
weight penalty. The representation of structural stiffening by directly manipulating the model in this
fashion was clearly approximate, but was sufficient to capture the basic effect. Frequency ratios of 1.0
(BASE0 configuration), 1.16 (STIF1 configuration), 1.36 (STIF2), and 1.60 (STIF3) were chosen. This
selection produced frequencies for the first symmetric bending mode of 1.25, 1.45, 1.70, and 2.0 Hz. The
corresponding stiffness increases for the STIF1, STIF2, and STIF3 configurations are 35, 85, and
156 percent, respectively. The method of increasing modal frequency without modifying mode shape
assumes that the stiffness increase is applied uniformly throughout the entire aircraft structure. The
resulting frequencies of all six modes for each configuration are shown in table 1.

Linearizedmodelsof thedynamicaeroelasticsimulationwereproducedforeachstiffnesscondition.Migrationof theelasticpolesofthelinearmodelthatoccurredasthestiffnesslevelwasvariedis shownin figure4. Thetotalrangeof stiffnessvariationprobablyextendsbeyondtheconditionsthatwouldbephysicallypracticalfor this designbecauseof weightpenaltiesassociatedwith producingthestifferstructure.TheSTIF1condition,withafrequencyof 1.45Hzfor thefirst symmetricmode,wasdeemedmostrepresentativeof theactualdesignbecausetheoriginalfinite-elementstructuralmodelwasconsid-eredtohaveslightlyunderpredictedstiffnessoftheoverallconfiguration.
Theoriginalbaselineaeroelasticconfiguration(BASEO) had a first symmetric fuselage bending mode
at 1.25 Hz in the final cruise weight condition. But work with the more mature Technology Concept
Aircraft (TCA) finite-element structural model indicated that the first mode frequency was likely to be
closer to 1.45 Hz at the final cruise weight condition and that this frequency was more likely to be repre-
sentative of the actual aircraft. For this reason, the STIF1 configuration was used as a baseline condition
for all other parametric variations and is referred to as the "modified baseline" configuration. Time
histories from the real-time simulation were used to verify that the parameterization method produced thedesired effect.
Variation of Modal Damping
Ten parametric configurations were included in the portion of the test matrix that addressed the varia-
tion of modal damping levels. Damping levels applied to various modes, along with the associated
configuration names, are shown in table 2. This portion of the investigation actually targeted three relatedissues.
The first issue was the level of modal damping required to achieve acceptable pilot evaluations.
Damping ratios of 0.07, 0.15, and 0.30 were selected based on feedback obtained during discussions with
Boeing flight control researchers. The damping ratios of various modes contained in the model were set
to these values for various configurations.
The second issue dealt with the frequency range of the modes to which these damping levels were ap-
plied. The intent was to gain insight into the relative importance of suppressing only the first fuselage
bending modes as opposed to the first and second fuselage harmonics. In one variation, damping was
applied only to elastic modes with frequencies less than 2 Hz. For the modified baseline configuration
(STIF 1), this frequency range included the first symmetric mode shape and the first antisymmetric mode
shape shown in figure 3. The frequencies of these two modes for the STIF 1 configuration were 1.45 Hz
(SY1) and 1.61 Hz (AN1). The configurations, DAMP1, DAMP2, and DAMP3, shown in table 2, set the
damping ratios of these first two modes to 0.07, 0.15, and 0.30, respectively. In a second variation,
damping was applied to elastic modes with frequencies less than 3 Hz. This range included the SY1
and AN1 mode shapes shown in figure 3. The configurations, DAMP6, DAMP7, and DAMP8, also shown
in table 2, set the damping ratios of these four modes to 0.07, 0.15, and 0.30, respectively.
Figure 5 illustrates the pole migrations of the dynamic elastic modes as the various damping levels
were applied in these two frequency ranges. The plots shown in figure 6 illustrate normal acceleration at
the pilot station in response to elevator inputs and lateral acceleration at the pilot station in response to
rudder inputs. These frequency response plots show the attenuation of the elastic response to control
inputs that results from increased damping levels.
A third issue addressed by this portion of the investigation was the relative importance of damping
symmetric modes versus antisymmetric modes. In both frequency ranges, a damping ratio of 0.3 was

appliedto thesymmetricmodesaloneandthentheantisymmetricmodesalone. TheconfigurationentitledDAMP4in table2appliedadampingratioof 0.30to thefirstsymmetricmodeonly,andthecon-figurationentitledDAMP5appliedadampingratioof0.30tothefirstantisymmetricmodeonly. Likewise,theconfigurationsentitledD/XAVlP9andD/XAvlPl0appliedadampingratioof 0.30tothefirsttwosymmetricmodesandfirsttwoantisymmetricmodes,respectively.
Again,sincethemodelwasdirectlymanipulatedtoproducedesireddampinglevels,therepresentationof anactivemodesuppressionsystemis approximateandlacksnonlinearitiesandadditionalfilterdynamicsthatmightbepresentin theactualsystem.Buttherepresentationis sufficientto capturethefundamentaleffectsof thevariationsof dampinglevel,targetedfrequencyrange,andsymmetricversusantisymmetricmodesuppression.
Elimination of Control Excitation of Selected Modes
Another portion of the test matrix examined the impact of modal cancellation, which refers to elimi-
nation of the control effector excitation of a particular DASE mode or modes. It is intended to represent
the effect that would be produced by using command shaping together with multiple control effectors to
allow the pilot to pitch, roll, or yaw the aircraft without exciting the specifically targeted modes. Canard
and elevator inputs, for instance, could be appropriately proportioned and blended to pitch the vehicle
without exciting the first fuselage-bending mode. In the lateral case, rudder and chin fin effectors may be
used in combination to avoid excitation of the first antisymmetric mode. The modal dynamics would
remain, however, and would be subject to excitation by turbulence.
An idealized representation of such a design was achieved by eliminating elements of the B matrix
(the control effect matrix) in the dynamic aeroelastic model that represent the control effector excitation
inputs to the first symmetric and first antisymmetric fuselage bending modes. Control deflections com-
manded by the pilot during evaluation maneuvers therefore could not excite these modes. Only the first
symmetric and first antisymmetric modes were canceled in this fashion because cancellation of higher
fuselage harmonics would probably require more control effectors. Table 3 shows the parametric condi-
tions and associated configuration names for the portion of the test matrix that examined mode-cancelingcontrol.
The CANCl configuration shown in table 3 consists of the STIF1 baseline with modal cancellation ap-
plied to the first symmetric and first antisymmetric bending modes. Mode-canceling configurations were
also generated for each of the three damping levels so that the test matrix would include direct compari-
sons of cancellation on and off for each damping condition. In this regard, the configurations labeled
CANC2, CANC3, and CANC4 in table 3 are directly comparable with DAMP6, DAMP7, and DAMP8 in table 2
(with damping ratios of 0.07, 0.15, and 0.30, respectively).
Representation of the mode-canceling control design by eliminating the elements of the B matrix in
the dynamic aeroelastic model is inherently approximate since it cannot convey the effect of nonlineari-
ties (such as control saturation or rate limiting) in the actual mode suppression. This investigation makes
no attempt to examine the achievability or practical limitations of such a mode-canceling control
approach, but instead only evaluates the merits of an ideal representation of such a design.
Figure 7 illustrates the migration of transfer function zeros that result from elimination of the control
effector excitation elements of the B matrix in the dynamic aeroelastic model. Zeros associated with the
canceled modes in the transfer function of pitch rate to elevator move very near the poles. The modal
dynamics remain and are subject to excitation by turbulence or by coupling from other elastic modes.

Thefrequencyresponseplotsshownin figure8illustratethatthefirst symmetricandfirst antisymmetricmodescannolongerbedirectlyexcitedbycontroleffectorinputsforthecanceledconfigurations.Theslightresponseof symmetricmode1thatremainsisduetocouplingwithsymmetricmode2.
Elimination of DASE Visual Cues
In order to represent an ideally compensated display, the aeroelastic perturbations in the out-the-
window scene produced by structural flexing were turned off. The conformality of the horizons on the
HUD and the outside visual scene was thereby restored for the display-compensated configuration. This
condition was used to represent idealized compensation of an external vision system (XVS) for dynamic
elastic effects. The variation was performed for only one aeroelastic condition, the DAMP1 configuration.
The configuration called D IS P0 represents the visual perturbations off case of the DAMP1 aeroelastic
configuration. Visual perturbations due to aeroelastic effects were included in all other configurationsevaluated.
Variation of Turbulence Level
Variation of turbulence level was the final factor examined in this experiment. All tasks were flown
with the standard Dryden Spectra Turbulence Model. For the majority of configuration and task evalua-
tions, an rms turbulence level of 3 ft/s was used (light turbulence). But for two configurations, pilots also
performed the nominal approach and landing task with rms turbulence levels of 4.5 ft/s (moderate) and
6.0 ft/s (heavy). It was hoped that these spot evaluations of selected configurations would provide insight
into the variation of configuration acceptability that could be expected to result from increasing turbu-
lence levels. The two configurations chosen for the turbulence level variation were the QSAE0 configura-
tion (no dynamic aeroelastic effects) and the DAMP7 configuration (0.15 damping applied to modes 1 4).
This moderately damped aeroelastic configuration was selected to provide a general representation of the
variation in flight characteristics that could be expected with increasing turbulence levels.
Test Matrix and Evaluation Procedure
A complete list of the parametric configurations used in the LaRC.3 experiment is shown in table 4.
The test matrix contains 20 parametric configurations that target the effects of structural stiffening, modal
damping level, modal cancellation, and display filtering. Also included are four additional conditions
corresponding to varying turbulence levels for the QS_0 and DAMP7 configurations.
As noted earlier, one of the stiffened cases was used as a modified baseline for the majority of the
evaluations. The first stiffened parametric configuration, STIF1, was used as the baseline configuration
throughout this investigation as it was considered more representative of the actual aircraft design. The
STIF1 configuration had the frequency of the first symmetric mode increased to 1.45 Hz with all other
modes multiplied by the corresponding frequency ratio. Therefore the parametric variations on damping
and modal cancellation, as well as the display compensation case, were applied to this modified baseline
with a first symmetric mode at 1.45 Hz (STIF1) rather than the original baseline configuration with its
first symmetric mode at 1.25 Hz (BASE0).
Although table 4 presents the complete list of parametric configurations evaluated in this experiment,
it does not indicate the order in which the six test pilots evaluated these configurations. The order of
evaluation of the 20 configurations was random and differed for each pilot. The pilots were not informed
which configuration they were evaluating. The exception to this practice was the turbulence variation that
occurred at the end of the experiment. Pilots were informed as to the configuration and the turbulence
level for those evaluations. All other evaluations were performed with mild turbulence.

Therandomizedorderof configurationevaluationsfor eachof thesixtestpilotsisshownin table5.Eachpilot flewandratedallthreemaneuvertasks(describedin thefollowingsection)for agivencon-figurationbeforeproceedingtothenextrandomconfiguration.Simulationsessionswerearrangedsothatpilotsspentnomorethan2 consecutivehoursin thecockpitata time,twiceaday,withaminimumof2hoursbetweensessions.Pilotswerebriefedpriortotheirfirstsimulationsessionsregardingoveralltestobjectivesandevaluationprocedures,andeachpilothadbeenprovidedwithawrittentestplanatleast1weekbeforeparticipationin theexperiment.Thetestplandescribedtheobjectives,procedures,maneu-vertasks,andevaluationtoolsofthisexperiment.Briefsummariesofthepriorflightexperiencesof eachevaluationpilotareprovidedinappendixA.
Evaluation Maneuvers
Three maneuver tasks were evaluated by each pilot for the parametric configurations that are presented
in table 4. The maneuvers included a nominal approach and landing, a lateral offset landing, and a sub-
sonic flight director tracking task. The turbulence-variation portion of the test matrix shown in table 4
was evaluated only with the nominal approach and landing task after the pilot completed the random
portion of the test matrix in which the 20 parametric configurations were evaluated.
Nominal Approach and Landing
A flight card showing the task definition and performance criteria for the nominal approach and land-
ing (task 4020) is provided in appendix B. The task was initiated in level flight at an altitude of 1500 ft
and an airspeed of 190 knots on course for a localizer intercept of 30 °. The pilot used the instrument
landing system (ILS) localizer and glide-slope displays on the HUD (shown in appendix C) to perform
the approach. At a distance of 7 nmi from the runway, autothrottles were commanded to reduce airspeed
to the final approach speed of 159 knots. The procedure for the nominal approach included an automatic
reconfiguration of leading- and trailing-edge devices that was initiated at a gear altitude of 390 ft and
executed over a period of 18 s. The impetus for this automatic flap reconfiguration is the trade-off
between noise restrictions imposed in the terminal area and the desire to reduce the aircraft pitch attitude
at touchdown. The nominal autoflap procedure therefore configured the aircraft for a low-spee&low-
noise approach down to an altitude of 390 ft, at which point the vehicle passed a critical noise-measuxing
station. Flaps and leading-edge devices were then automatically commanded to a high-lift low-pitch
attitude setting of 0 ° for leading-edge flap and 30 ° for trailing-edge flap for the final flare and touchdown;
this configuration reduced the potential for tail strike at touchdown. During this period, thrust was in-
creased by approximately 12 percent and pitch attitude was reduced by approximately 6 ° to compensate
for the flap change. During the approach and landing with autothrottles engaged, these changes occurred
automatically. A sketch depicting the nominal landing task segment definitions and performance criteria
is shown in figure 9. A flare cue was provided on the HUD during the final portions of the landing. The
flare cue used the tuning that was defined during the so-called Ames.5 simulation experiment documentedin reference 6.
IA G Lateral Offset Landing
The Niagra Falls International Airport (IAG) lateral offset landing (task 4069) was the most challeng-
ing of the three evaluation maneuvers. This task was initiated at an altitude of 750 ft with a
300-ft lateral offset and 580-ft longitudinal offset of the ILS approach glide slope from the nominal
approach path. The pilot was directed to fly down the offset ILS glide slope to an altitude of 250 ft.
At this point, the pilot not flying (PNF) called "correct," and the pilot executed a descending lateral
correction to reacquire the runway centerline. The pilot then executed the flare and attempted to achieve

touchdownwithinthetolerancesrequiredfordesiredperformance.Thefirstsegmentofthistaskcoveredtheapproachfromanaltitudeof 750ft to 50ft andincludedthelateralcorrectionmaneuver.Thesecondsegmentbeganatanaltitudeof 50ft andincludedtheflareandtouchdownportionsof thetask.Thetaskrequiredanaggressivelateralmaneuverdueto thelow altitudeatwhichthecorrectionwasinitiated.Aflight cardshowingthetaskdefinitionandperformancecriteriafor theoffsetlanding(task4069)isprovidedinappendixB.
Composite Flight Director Tracking
The composite flight director tracking (task 3115) allowed the pilot to evaluate the ability to accurately
maneuver the aircraft by following flight director commands. The flight director was path oriented rather
than attitude oriented. Originally, it was envisioned that either a sum-of-sines algorithm or a filtered
random signal would be used to drive the flight director motions, as was used in the flexible B-1 study
described in reference 2. However, references 7 and 8 suggest that greater consistency among pilot
ratings was obtained when the flight director behaved in a fashion that is more representative of actual
flight maneuver segments. For this reason, the decision was to drive the flight director with a composite
signal containing elements from various maneuver segments examined in previous HSCT simulations.
These maneuver segments included the localizer capture from the nominal approach, glide-slope capture,
a descending turn, and a rapid pull-up as found in the landing go-around tasks from reference 1. Flight
path and track angle command segments from these tasks were combined with varying order and sign to
produce a flight director behavior that was not easily anticipated but still representative of actual flight
maneuver tasks. The task was performed with mild turbulence. A flight card showing the task definition
and performance criteria for the composite flight director tracking (task 3115) is provided in appendix B.
Details regarding the operation of the flight director and the computation of task performance metrics are
presented in appendix D.
Data Collected
Transcribed Cooper-Harper Ratings and Comments
Pilots used the familiar Cooper-Harper rating (CHR) scale shown in figure 10 to assign a flying quali-
ties rating to each parametric configuration (ref. 9). The pilot's task performance, in terms of touchdown
parameters, flight-director tracking accuracy, and other information concerning maximum deviation from
target values, was presented on the pilot's head-down "scorecard" display in the cockpit immediately
following each task. This information provided a basis for assessing whether desired or adequate
performance tolerances were achieved, which helped the pilot to navigate through the Cooper-Harperdecision tree.
Pilots rated the configurations immediately following execution of a particular maneuver task using
the task rating card presented in appendix B. After completing a sufficient number of runs to rate a
particular configuration for a given task, the test pilot's verbal responses to the task rating card were taped
using a hand-held microcassette recorder in the cockpit. The recorded pilot comments were later tran-
scribed and organized according to configuration. A complete listing of all transcribed pilot comments
collected during this experiment is provided in reference 10.
ASE Ride Quality and Control Influence Ratings
In addition to CHRs, test pilots were asked to provide a numerical assessment of the extent to which
dynamic elastic effects adversely impact their control inputs and comfort (ride quality). Two supple-
mental rating scales were designed for this experiment to target these issues independent of deficiencies
that the pilot may have perceived in the SCAS. The aeroelastic ride quality rating (RQR) scale and
10

controlinfluencerating(CIR)scaleareshownin figure11. It wasimportantto obtainanindependentratingof aeroelasticdeficienciesseparatefromevaluationof theSCAS.Forinstance,if apilotawardedthenominallandingtaskaCHRof4 foraparticularconfiguration,butprovidedaCIRof 1andanRQRof 1,thenwecouldconcludethatthedeficientCHRwasdueto pilotdissatisfactionwiththeSCASandnotwith theaeroelasticcharacteristicsof thatparticularconfiguration.Pilot feedbackregardingthedesignof thesescaleswasincorporatedbasedonpreliminaryassessmentsperformedpriorto thestartoftheexperiment.
TheCIRscalebearsfurtherdiscussion.Thescalewasdevelopedbasedonpilot commentsfromtheearlier(LaRC.1)preliminarypilotedassessmentof dynamicaeroelasticeffects.Duringthatassessment,pilotssometimesindicatedthattheywere"reducingthegain"or"backingoff' ontheircontrolinputstoavoidexcitationof thedynamicelasticmodes.SeveraltimehistoriesfromtheLaRC.1testsuggestedthattheaeroelasticcockpitvibrationshadsometimescorruptedtheprecisionof pilotcontrolinputsor evencausedoccasionalinvoluntarystickinputs.Forthisreason,thecontrolinfluenceratingscalewasdevel-opedto specificallyaddressthisissuein additionto thepilot comfortor ridequalityissue.Theratingscalesshownin figure11wereincludedonthetaskratingcardusedbythepilotsduringtheirverbalconfigurationevaluationsperformedinthecockpitimmediatelyfollowingthemaneuvers.
Thedynamicaeroelasticevaluationscalesshownin figure11includedratingsthatcouldbeawardedwhenthedynamicaeroelasticeffectsresultedina lossof controlorwhenthecockpitvibrationenviron-mentmotivatedthepilotto abandontheevaluation.Thetestpilotcoulddepressatriggeronthesidestickcontrolinceptortohaltthesimulationif theridequalitywassevereenoughtowarranttaskabandonment.In suchinstances,activationof thetriggerswitchimmediatelyterminatedtherunandthetestpilotawardedtheconfigurationaDASERQRof 6 asdescribedonthescaleshownin figure11. Poortaskperformanceoranimminentlandingoutsidethedesiredtouchdownboxwasnotavalidreasonforuseofthetaskabandonmenttriggerswitch.
Digital Time Histories
A digital record of selected simulation parameters was made for each run. These parameters included
flight conditions, pilot control inputs, aircraft control effector responses, and parameters describing the
responses of the dynamic aeroelastic model. Time histories of the simulation parameters were recorded at
a sample rate of 20 Hz. Some of the recorded parameters were analyzed immediately following the run to
generate the information concerning maximum deviation from target values that was presented on the
pilot's head-down scorecard display.
Videotape Recordings
Four separate video channels were tiled together and recorded on VHS-C tape for all piloted evalua-
tions. Figure 12 shows a single frame of the composite video image recorded during the experiment. The
first channel (lower right of fig. 12) showed an exterior view of the simulator cab as it rotated and trans-
lated on its hexapod motion platform. The second channel (upper center of fig. 12) captured the view that
was presented on the pilot's forward cockpit monitor within the cab, which consisted of the HUD sym-
bology superimposed upon the computer-generated out-the-window scene. The third channel (back-
ground image of fig. 12) contained a wide-angle video image of the interior of the cab as viewed from
over the pilot's right shoulder and behind the pilot and copilot's seats. This angle captured the body
motions of both the pilot and pilot not flying as they were jostled in their seats. The fourth video channel
(lower left of fig. 12) provided a downward-looking view of the pilot's hand on the sidestick control
inceptor. Cockpit audio was also included on the videotapes. These video recordings proved extremely
useful during postrun analysis of many simulated aeroelastic maneuver tasks.
11

Langley Visual Motion Simulator
Cab Arrangement and Control Inceptor
The VMS, shown in figure 13, uses a synergistic hexapod motion system. The cockpit configuration at
the time of this experiment included a left seat pilot flying (PF) station and a right seat PNF station. A
throttle quadrant with four throttles was located between the pilot stations and included a cockpit display
unit (CDU) that was used in this experiment to monitor and adjust various functions of the simulation. A
fold-down jump seat was located behind and slightly to the left of the PNF station for an observer. Four-
point harnesses were provided at all seats for motion operation.
The inceptor (control stick) used for all maneuvers performed during the LaRC.3 experiment was a
McFadden left-handed side stick. The PF seat included a left-side armrest that was adjustable to provide
appropriate forearm support for the left arm of the evaluation pilot.
Visual Projection and Display Formats
An Evans & Sutherland ESIG-3000 visual image generator was used to provide out-the-window scen-
ery onto four mirror-beam-splitter monitors: a left- and a fight-side view, and two forward views (one for
each pilot). The terminal environment used for takeoff and landing work was a representation of the
Denver International Airport (DIA). To assist the landing tasks, "desired" and "adequate" landing boxes
were drawn on the image of the primary runway (DIA 35L), along with a target landing reference stripe
to either side of the target touchdown aim point.
A simulated HUD was provided through an electronic video mix with the forward view. Appendix C
contains a schematic of this HUD format used for the LaRC.3 experiment. Six other CRT displays were
provided in the cockpit, arranged to the front and side of either pilot, in addition to the CDU. These
displays provided a head-down primary flight display (PFD) and a horizontal situation display (HSD).
It is anticipated that an operational HSCT will include some enhanced XVS to eliminate the need to
lower the nose for landing. Although the visual scene presented to the pilot during this experiment was
not fully representative of an enhanced vision system, the display included symbology superimposed on
the forward view that was similar to proposed XVS symbology. However, the forward field of view was
shown at lower resolution and in a smaller field of view than that proposed for an operational XVS.
In addition, two specialized displays used in the LaRC.3 study were a surface position display (SPD)
and a trim display. These displays were used to monitor the wing flap positions and the engine thrust
levels, as well as to ensure proper configuration of the autothrottle and landing gear positions prior to
each simulation run. A scorecard display was also provided at the completion of each run to indicate the
numeric value of certain performance metrics achieved during the run to assist the evaluation pilot in
assessing the configuration. The performance parameters described on the flight cards in appendix B
were reported on the pilot's scorecard display.
Motion Characteristics and Responses
The motion platform provides acceleration cues up to --0.6g vertically within a 5.75-ft travel envelope;
lateral and longitudinal acceleration limits are similar. The angular limits of the VMS are +300/-20 °
pitch, --32 ° yaw, and --22 ° roll (positive pitch with the nose up).
12
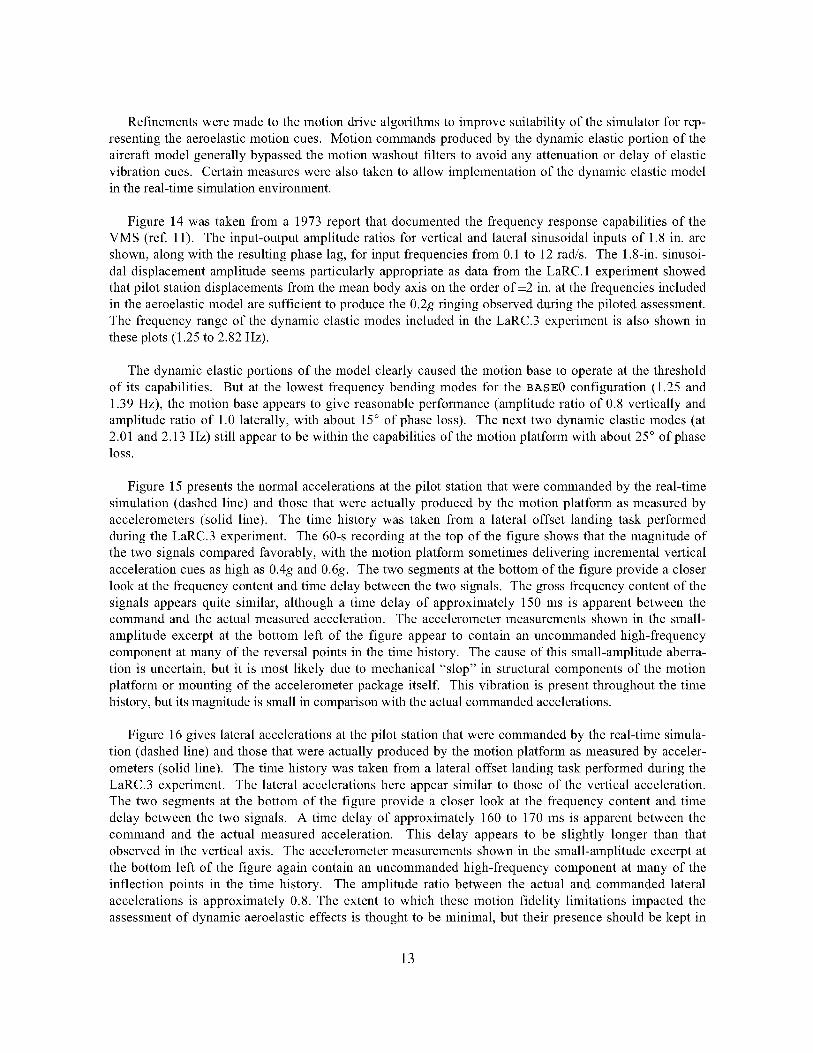
Refinementsweremadetothemotiondrivealgorithmsto improvesuitabilityof thesimulatorforrep-resentingtheaeroelasticmotioncues.Motioncommandsproducedbythedynamicelasticportionoftheaircraftmodelgenerallybypassedthemotionwashoutfiltersto avoidanyattenuationordelayof elasticvibrationcues.Certainmeasureswerealsotakento allowimplementationof thedynamicelasticmodelinthereal-timesimulationenvironment.
Figure14wastakenfroma 1973reportthatdocumentedthefrequencyresponsecapabilitiesof theVMS(ref.11). Theinput-outputamplituderatiosfor verticalandlateralsinusoidalinputsof 1.8in. areshown,alongwiththeresultingphaselag,forinputfrequenciesfrom0.1to 12rad/s.The1.8-in.sinusoi-daldisplacementamplitudeseemsparticularlyappropriateasdatafromtheLaRC.1experimentshowedthatpilotstationdisplacementsfromthemeanbodyaxisontheorderof--2in. atthefrequenciesincludedin theaeroelasticmodelaresufficienttoproducethe0.2gringingobservedduringthepilotedassessment.Thefrequencyrangeof thedynamicelasticmodesincludedin theLaRC.3experimentis alsoshownintheseplots(1.25to2.82Hz).
Thedynamicelasticportionsof themodelclearlycausedthemotionbasetooperateatthethresholdof its capabilities.Butatthelowestfrequencybendingmodesfor theBASE0configuration(1.25and1.39Hz),themotionbaseappearsto givereasonableperformance(amplituderatioof 0.8verticallyandamplituderatioof 1.0laterally,withabout15° of phaseloss).Thenexttwodynamicelasticmodes(at2.01and2.13Hz)still appearto bewithinthecapabilitiesofthemotionplatformwithabout25° of phaseloss.
Figure15presentsthenormalaccelerationsatthepilotstationthatwerecommandedbythereal-timesimulation(dashedline)andthosethatwereactuallyproducedbythemotionplatformasmeasuredbyaccelerometers(solidline). Thetimehistorywastakenfroma lateraloffsetlandingtaskperformedduringtheLaRC.3experiment.The60-srecordingatthetopof thefigureshowsthatthemagnitudeofthetwosignalscomparedfavorably,withthemotionplatformsometimesdeliveringincrementalverticalaccelerationcuesashighas0.4gand0.6g.Thetwosegmentsatthebottomof thefigureprovideacloserlookatthefrequencycontentandtimedelaybetweenthetwosignals.Thegrossfrequencycontentof thesignalsappearsquitesimilar,althoughatimedelayof approximately150msis apparentbetweenthecommandandtheactualmeasuredacceleration.Theaccelerometermeasurementsshownin thesmall-amplitudeexcerptatthebottomleft of thefigureappearto containanuncommandedhigh-frequencycomponentatmanyofthereversalpointsin thetimehistory.Thecauseofthissmall-amplitudeaberra-tionis uncertain,but it is mostlikelydueto mechanical"slop"in structuralcomponentsof themotionplatformormountingof theaccelerometerpackageitself. Thisvibrationis presentthroughoutthetimehistory,butitsmagnitudeissmallincomparisonwiththeactualcommandedaccelerations.
Figure16giveslateralaccelerationsatthepilotstationthatwerecommandedbythereal-timesimula-tion(dashedline)andthosethatwereactuallyproducedbythemotionplatformasmeasuredby acceler-ometers(solidline). ThetimehistorywastakenfromalateraloffsetlandingtaskperformedduringtheLaRC.3experiment.Thelateralaccelerationshereappearsimilarto thoseof theverticalacceleration.Thetwosegmentsatthebottomof thefigureprovideacloserlookatthefrequencycontentandtimedelaybetweenthetwosignals.A timedelayof approximately160to 170msis apparentbetweenthecommandandtheactualmeasuredacceleration.Thisdelayappearsto beslightlylongerthanthatobservedin theverticalaxis. Theaccelerometermeasurementsshownin thesmall-amplitudeexcerptatthebottomleft of thefigureagaincontainanuncommandedhigh-frequencycomponentatmanyof theinflectionpointsin thetimehistory. Theamplituderatiobetweentheactualandcommandedlateralaccelerationsis approximately0.8.Theextentto whichthesemotionfidelitylimitationsimpactedtheassessmentof dynamicaeroelasticeffectsis thoughttobeminimal,buttheirpresenceshouldbekeptin
13

mindwheninterpretingtheresultsof theexperiment.Basedontheinitial dynamicaeroelasticimple-mentationin theearlierLaRC.1investigation(ref.1)andthemeasuredresponsesof theVMSplatform,thefacilityappearsto provideareasonablerepresentationof thelowestfrequencymodesincludedin thedynamicaeroelasticmodel.
Results and Discussion
Time history data, subjective pilot comments, and pilot configuration ratings were examined in vari-
ous combinations to provide some basic insights into the effectiveness of the differing approaches in
dealing with the DASE effects studied in this experiment. The CHRs, CIRs, and RQRs of the pilots were
compiled and plotted for each variation included in the test matrix. In general, CHRs did not seem
to discriminate among configurations as clearly as the CIRs and RQRs, which specifically targeted
DASE effects. A summary of all CHRs provided by the pilots for each configuration and task is shown in
tables 6 and 7. A summary of all DASE CIR and RQR scores provided by the pilots for each configura-
tion and task is shown in table 8. The following sections interpret the data shown in these tables.
Configuration Rankings by Pilot Preference Based on DASE Ratings
The first approach to compiling the data was to formulate a pilot-preference ranking of the 20 para-
metric configurations based on the average DASE CIR and RQR scores assigned by pilots for all three
maneuver tasks with a given configuration. This ranking is based only on the DASE CIR and RQR scores
by using the scales shown in figure 11. (CHRs will be discussed later.) The ranking was developed
simply by averaging all DASE ratings from all pilots for each configuration and then by arranging them
in ascending order (larger average score meaning lower pilot preference). Pilot-preference ranking of the
20 configurations is shown in table 9 and is plotted in figure 17.
This simple approach to ranking the configurations passes a number of intuitive checks. First, the
Ref-H baseline aeroelastic configuration (BASE0), with no structural stiffening or active mode suppres-
sion, was ranked the worst configuration as one might expect. Also reassuringly, the rigid configuration
without any dynamic aeroelastic effects (QSAE0, quasi-static elastic effects only) was ranked the best.
Differentiation among configurations is greatest at the start of the ranking, in the most desirable region,
and tapers off to near ties at the undesirable end of the spectrum. The stiffened cases without active mode
suppression were all ranked poorly, suggesting that this approach was not effective at reducing the impact
of dynamic elastic effects on piloting tasks. The configuration with the highest level of damping (0.3)
applied to the greatest number of modes (four) and with modal cancellation (CANC4) was ranked the best
of the aeroelastic configurations but was still very different from the rigid aircraft in terms of pilot ratings.
The next best configuration was identical to this one with the exception of damping level, which was
reduced to 0.15 (CANC3). The fourth ranked configuration had 0.3 damping on four modes, but had no
cancellation (DAMP8). The order of ranking may provide some interesting insights regarding potential
trades between mode-canceling control and additional damping. Another insight is gained when we
compare the rankings of the configuration that had only symmetric modes damped (DAMP9, ranked 18th)
with the configuration that had only antisymmetric modes damped (DAMP 10, ranked 9th). It is clear that
the pilots found the undamped antisymmetric motions to be more problematic than undamped symmetric
motions. Many other interesting comparisons can be drawn from this configuration-ranking chart, which
represents the most fundamental summation of the LaRC.3 experiment results.
DASE Ride Quality Ratings Versus Pilot Preference
The overall ranking shown in figure 17 provides insight regarding the order of pilot preference for
the 20 parametric configurations but does not indicate the point in ranking at which dynamic elastic
14

characteristicsmaketheconfigurationunacceptable.Figure18attemptsto addressthisissuebyshowingtheaverageridequalityratingassignedbypilotsforeachconfigurationplottedagainsttheoverallpilotpreferencerankingfromthepreviousfigure.Thesubjectivedescriptionoftheridequalityratingassignedbypilotsis shownadjacentto theridequalityaxisalongwith shadingto indicatethetransitionfromacceptableto marginalto unacceptableconfigurationcharacteristics.Onthebasisof theaverageridequalityratings,thefirstfourconfigurations(QSAE0,CANC4,CANC3,andDAMP8)appeartobeinorontheborderof theacceptableridequalityregion.Alsoshownin theplotarethemaximumandminimumridequalityratingsassignedtotheconfigurations.Onthebasisofthemaximumrating,eventhemosthighlymode-suppressedconfiguration(CANC4)providesonlymarginallyacceptableride qualityat thepilotstation.It shouldbenotedthattheseratingswereprovidedduringtasksperformedwithmildturbulence,andthattheridequalityacceptabilitywill probablydegradewith increasingturbulencelevel. Figure18providesa subjectivebasisfor thejudgmentof anacceptablelevelof modesuppressionfromapilot'sridequalityperspective.In thisexperiment,thedampinglevelof 0.3wasbasedon theaverageridequalityrating.
Control Influence Ratings Versus Pilot Preference
Figure 19 provides an analogous ranking to figure 18 in terms of the CIR instead of RQR. The sub-
jective description of the control influence rating assigned by the pilots is shown adjacent to the control
influence axis, along with graduations to indicate the transition from acceptable to marginal to unaccept-
able configuration characteristics. The unacceptable threshold was placed at the point where cockpit
vibrations impact the precision of voluntary control inputs. On the basis of the average control influence
ratings, the first four configurations (QSAE0, CANC4, CANC3, and DAMP8) again lie within the acceptable
region. On the basis of the maximum rating, the most highly mode-suppressed configuration (CANC4)
again lies in the marginally acceptable region from a control influence perspective.
The border between acceptable and marginal control influence in this plot is somewhat arbitrary as it
might be perfectly acceptable for the pilots to intentionally modify their control inputs to avoid excitation
of the dynamic elastic modes as long as their ability to precisely control the aircraft is in no way hindered
by this practice. However, recorded time histories of pilot stick deflections indicate that pilots were
sometimes unaware that cockpit vibrations were in fact impacting their control inputs.
The potential for involuntary biodynamic feed-through of cockpit vibrations through the pilot's arm
and back into the control inceptor due to aeroelastic effects of a supersonic transport was hypothesized in
reference 12. The occurrence is involuntary and therefore may indeed be unnoticed by the pilot in minor
instances. Use of the CIR scale shown in figure 19 requires the pilot to be aware of the occurrence, and
therefore the CIRs may sometimes be optimistic. However, pilots did note a number of profound in-
stances of frequent or sustained biodynamic feed-through of cockpit vibrations back into the control
inceptor as indicated by the maximum CIRs shown in the figure. Frequent or sustained biodynamic feed-
through of cockpit vibrations through the pilot's arm and back into the inceptor will be referred to as
"biodynamic coupling" (BDC) in this report.
Biodynamic Coupling
Figure 20 presents a power spectral analysis of a lateral offset landing run in which the pilot experi-
enced BDC while flying the ST I F1 (modified baseline) configuration with no additional damping or
cancellation. The time history at the top of the figure shows lateral cockpit accelerations in g units
(dashed line) and lateral stick deflections (solid line). Although the units on the two quantities differ, the
scaling of--1 is convenient as it represents the maximum throw for lateral stick deflection and since
15

lateralaccelerationcommandedbythesimulationremainedintherangeof--lg. Theplotin thelowerleftof thefigureshowsthepowerspectraldensityof lateralaccelerations(dashed)andlateralstickdeflec-tions(solid)appliedtoa6-ssegmentofthetimehistory(from39to45s).Thefrequencyspectrumofthepilot'svoluntarycontrolinputtimehistoryduringthisperiodliesprimarilybelow1Hz. Thefrequencyspectrumof thelateralaccelerationsatthepilotstationshowssomecontentat thefirst antisymmetricmodefrequencyof 1.6Hzandthesecondantisymmetricmodefrequencyof 2.5Hzdueto minorturbu-lenceexcitationof thesestructuralmodes.A clearseparationexistsbetweenthefrequencyof thepilot'sinputspectrumandthefrequencyofcockpitaccelerationsduetothelateralelasticmodes.
Thepowerspectrumof a later6-ssegmentof thetimehistory(from44to 50s)indicatesthebulkofthepilot'sinputspectrumremainsbelow1Hz,but it alsoshowssomefrequencycontentof thepilot'sinputsin therangeof thelateralelasticmodes.Oncethepilotbeginstomovethestickattheresonantfrequencyof thefirstantisymmetricstructuralmode,thereistremendouspotentialforthelateralmodetobeexcitedbythecontrolinputsandproducelargerlateralaccelerationsatthepilotstation.Theselateralaccelerationscanmovethepilot'sframein afashionthatproducesinvoluntarycontrolinputsthatfurtherexcitethestructuralmode.
Thethirdpowerspectrumplotisappliedto a6-ssegmentof thetimehistoryfrom47to 53s. Here,thespectrumof thepilot's stickinputexhibitsapronouncedresonantpeakatthefrequencyof thefirstantisymmetricstructuralmode.It is highlyunlikelythatthepilot inputsin this frequencyrangearevoluntary(althoughtheyarewithinthepilot'svoluntarybandwidth).Videofootageof thecockpitinte-rior andof thepilot'shandonthesidestickdepictsastrongcorrelationbetweentheinvoluntarymotionsofthepilot'supperbodywiththemotionsofhishandonthestick.A clearchangein thecharacterofthepilot'sstickinputsisapparentin thetimehistoryshownin figure20andindicatesawell-developedBDCincidentaslateralaccelerationsfeedthroughthepilot'sflameandbackintothecontrolinceptor.Thepilotwouldbreaktheinvoluntarycouplingloopif hereleasedthestick,butheis in themidstoftheflareandthereforeunabletodoso.
Thistypeof adverseinteractionbetweenpilotandaircraftdynamicsisnotentirelyunprecedented.ArecentinvestigationperformedattheDrydenFlightResearchCenteridentifieda similarphenomenoninvolvingtheuseof asidestickcontrolinceptor(ref. 13)in theF-16XLthatresultedin roll ratchetingduringabrupthigh-raterollingmaneuvers.Reference14documentsthesefindings.Researcherspro-ducedananalyticalmodelof thecoupledsystemincludingdynamicsof thepilot'sframeandthecontrolinceptor.Thedynamicresponsesappearedquitesimilarto thoseencounteredduringtheincidentsoflateralBDCin theLaRC.3experiment.TheDrydenresearchersin reference14identifiedalateralreso-nantfrequencyof approximately2.1Hzfortheircombinedpilotandcontrolinceptordynamicalsystem(ref.13).
Threeof thesix testpilotsencounteredBDCduringvariousportionsof theexperiment.Thephe-nomenonwasusuallyencounteredwhentestpilotsflewtheHSCTwithno activesuppressionof thelateralstructuralmodes.EncounterswithBDCseverelydegradedthepilot'sabilityto controltheaircraft,andsometimesresultedin terminationof arundueto lossof controlor uncomfortablyhighlevelsofcockpitvibration.Examplesof BDCincidentsfor pilotsB, E,andC areshownin figure21. Powerspectraof thepilot stickinputsfor eachcaseindicatearesonantpeakatthefrequencyof thefirst anti-symmetricelasticmode.PilotsB andE experiencedBDConmanyoccasionsandwithmanydifferentconfigurations.PilotCtendedto experiencelesspronouncedintermittentinstancesof biodynamicfeed-through.Notethatpilot CexperiencedcouplingwiththeSTIF3configuration,whichhasitsfirst anti-symmetricmodeatahigherfrequencythantheSTIF1baseline(2.2Hzinsteadof 1.6Hz).
16

ThetimehistoriesshownforpilotsB andE in figure21arefortheDAMP9 configuration, which actu-
ally applies 0.3 damping to the symmetric modes but leaves the antisymmetric modes undamped. The
presence of significant damping for symmetric modes did little to prevent the coupling because the lateral
axis is far more prone to BDC for a number of reasons.
First, the pilot's seat tends to support the body longitudinally and vertically but not laterally; thus side-
to-side accelerations are more difficult to resist. Symmetric modes produce vertical accelerations,
whereas the stick input is fore and aft; therefore there is less tendency for the pilot's body motions to feed
directly into the stick. However, antisymmetric modes produce lateral accelerations that feed directly into
lateral stick deflections. A sidestick control inceptor was used in this experiment. The susceptibility of
various inceptor types to biodynamic feed-through is a potential topic for future investigations. Certain
measures to prevent BDC may be devised and incorporated during design of the control inceptor for theHSCT.
Another element of the control system implicated in the occurrence of BDC is the aileron-rudder inter-
connect (ARI). This is the control path whereby lateral stick displacements produce rudder deflections in
proportion to aileron deflections to achieve turn coordination. But it is also the path whereby lateral
cockpit vibrations may feed directly through the pilot-inceptor dynamics and back into rudder deflections;
lateral elastic modes are further excited. Some provision may possibly be included in the design of the
ARI to interrupt or prevent BDC.
To summarize, BDC is indicated when cockpit vibrations due to elastic modes feed directly through
the pilot's arm and back into the control stick. The phenomenon is evidenced by a resonant peak in the
power spectrum of the pilot's stick inputs at the frequency of one of the dynamic elastic modes. The
tendency to couple with structural modes appears to increase when pilots tighten their grip on the stick,
often in preparation for the flare as the aircraft nears the runway. The phenomenon is influenced by
design of the control inceptor and control laws, piloting style, and probably even certain aspects of the
pilot's physical stature.
The potential hazard posed by BDC would seem to suggest that certain elements of the HSCT active
mode suppression control system, or at least some provision in the basic SCAS to prevent BDC, will need
to be designated as flight critical. However, a final judgment regarding this issue should be made on the
basis of evaluations performed with a high-fidelity dynamic aeroelastic model of the final aircraft con-
figuration. The severity of the coupling sometimes observed indicates that some provision must be made
to ensure that BDC is never encountered during either normal or reversionary operation of the HSCT
flight control system.
Configuration Ranking Based on Cooper-Harper Ratings
A configuration ranking similar to that shown in table 9 was produced with CHRs of the pilots instead
of DASE ratings. The resulting configuration ranking is shown in table 10 along with the configuration
ranking that was produced with the DASE scores. The overall ranking is similar, but the scores were
much closer and there were a few ties. The outlined sections of the table indicate groupings of configura-
tions that were ranked similarly. The CHR scale was not specifically designed to target DASE effects,
but rather address overall control of the augmented flight dynamics provided by the SCAS. The DASE
effects impacted CHRs from the perspective of increased pilot workload due to vibration environment,
but the impact of DASE on pilot inputs and ride quality is not explicitly called out. Nevertheless, the
results shown in table 10 indicate that good agreement exists between the two ranking methods in terms
of general pilot preference for the various configurations. The summaries of all DASE ratings and the
17

summaryof all CHRsshownin tables6, 7, and8provideadditionalinformationregardingthepilots'ratings,suchaswhetheraconfigurationwasrankedpoorlyin thelateral-directionalaxis,or in thelongi-tudinalaxis,orinboth.
Impact of Structural Stiffening
Variation of average RQR and CIR with increasing structural stiffness is shown in figures 22 and 23.
Maximum and minimum ratings for these configurations are also indicated on the plots. Structural stiff-
ening did not appear to provide an effective solution to ride quality or control influence concerns posed
by dynamic aeroelastic effects. The average and maximum CIR and RQR metrics fell in the unacceptable
region for all structural stiffenings included in the experiment.
These findings are somewhat corroborated by results of the aforementioned investigation performed at
Dryden Flight Research Center addressing biomechanically induced oscillations experienced on the
F-16XL aircraft during rolling maneuvers (ref. 13). The Dryden researchers identified a lateral resonant
frequency of approximately 2.1 Hz for their combined pilot and control inceptor dynamical system. We
must assume that the LaRC.3 pilot and inceptor dynamical system possessed a resonant frequency in this
same vicinity as figure 21 indicated lateral resonances at approximately 1.6 and 2.2 Hz for the LaRC.3
pilots. No stiffness variation examined in the LaRC.3 experiment was sufficiently high to remove all
structural dynamics from this resonant frequency range. It is likely that no stiffnesses received favorable
ratings because none were sufficient to raise the elastic dynamic frequencies beyond the region in which
they tend to interfere with piloted flight. The ineffectiveness of increasing the frequencies of dynamic
elastic modes through structural stiffening suggests that some form of active mode suppression control
will be necessary.
The variation of CHRs with structural stiffening is shown in figure 24. Again, no significant
improvement is apparent as a result of increasing modal frequencies through added stiffness. Each
configuration received maximum CHRs that were in the Level 3 region.
Impact of Display Compensation
No significant improvement due to aeroelastic display compensation was observed in this experiment
in any pilot rating. To represent an ideally compensated display, the aeroelastic perturbations in the out-
the-window scene produced by structural flexing were turned off. The conformality of the horizons on
the HUD and the outside visual scene was thereby restored for the display-compensated configuration
(DISP0). Table 11 shows the results for the configuration with display perturbations turned off and the
analogous configuration with display perturbations turned on. In no instance did the pilot consistently
report that the display compensation case improved the precision or ease with which maneuver tasks were
performed. In most cases, the pilots did not indicate awareness that the configuration being evaluated was
the display-compensated case. (Recall that the configurations were evaluated in random order and that
pilots were not informed which condition was being evaluated.)
Although the display-compensated configuration was ranked slightly better than its counterpart with-
out display compensation in terms of pilot preference, the difference in the DASE rating upon which this
ranking was based is only 1 point (129 versus 130). This difference was clearly within the margin of
error for the experiment, and pilot preference for the two configurations was a tie for all intensive pur-
poses. The DAMP1 data set used only 0.07 damping for only the first two symmetric modes so that the
aeroelastic vibrations experienced by the pilot were still rather vigorous. The increased workload result-
ing from aeroelastic vibrations likely meant that there was simply too much going on for pilots to notice
18

theeffectof thedisplaycompensationandthatthecompensationprovidednosignificantbenefitfor theaeroelasticallyactiveconfiguration.
Impact of Damping Level
The variations in average RQR and CIR that resulted as damping was added to the dynamic elastic
modes are shown in figures 25 and 26. The triangular symbols indicate the trend that resulted when
damping was applied only to the first symmetric (SY1) and first antisymmetric (AN1) modes. The
square symbols indicate the trend that resulted when damping was applied to the SY1, SY2, AN1, and
AN2 modes. A clear improvement in RQRs and CIRs is apparent with increasing damping ratio. Recall
that these configurations were evaluated in random order and that the order differed for each pilot; in no
instance did a pilot experience a monotonic increase or decrease in damping. The figures also suggest
that some additional improvement in ride quality resulted from damping the first four modes instead of
only the first two. This difference is probably due to the second antisymmetric mode, which contributes
significantly to the lateral accelerations experienced at the pilot station.
No definitive instances of biodynamic coupling were observed when the damping level applied to the
first symmetric and first antisymmetric modes was 0.15 or greater. Several instances of biodynamic feed-
through were noted for cases in which a damping ratio of 0.07 was applied to the first two and the first
four elastic modes. Although the improvement in the average ratings with increasing damping is pro-
nounced, the maximum damping level of 0.3 applied to the first four modes still produces average CIRs
and RQRs that only lie on or near the border of the acceptable region. Table 8 includes the individual
ratings awarded by each pilot for these configurations, along with the maximum, minimum, and standard
deviation for each configuration.
Impact of Cancellation
The impact of the mode-canceling control is shown in figures 27 and 28. These figures show the same
data as the previous figures with the addition of mode-canceling control methods (indicated by the dia-
mond symbols). Recall that modal cancellation in this experiment refers to the use of the canard and chin
fin together with the elevator and rudder in a fashion that permits the pilot to pitch or yaw the vehicle
without ever exciting the first symmetric or first antisymmetric modes. Therefore, the forward surfaces
are enlisted for attitude control as well as mode suppression. The multisurface attitude control inputs
must incorporate knowledge of the particular mode shapes being canceled. The modal dynamics
remained, however, and were subject to excitation by turbulence. The mode-canceling methods evaluated
in this experiment represented an ideal implementation of such a control scheme.
The use of modal cancellation in combination with damping applied to the first four dynamic elastic
modes produced very good results. The average control influence ratings with modal cancellation shown
in figure 28 were in the acceptable region for levels of damping as low as 0.07. No instances of sustained
biodynamic feed-through were observed for any of the mode-canceling control methods. This result is
probably attributable to the fact that mode-canceling control breaks the biodynamic coupling loop
because inadvertent pilot inputs due to elastic vibrations can no longer excite elastic dynamics of the
targeted modes.
The average RQRs also benefited from the use of mode-canceling control. Average RQRs for 0.15
and 0.30 damping with cancellation lie in or at the border of the acceptable region, and pilots perceived a
ride quality improvement at all levels of damping. The benefit of using the forward surfaces for attitude
control as well as damping is that it prevents the initial excitation of the structure from maneuver control
inputs. Damping by itself is effective in attenuating the response of the structure to both turbulence
19

excitationandmaneuvercontrolexcitation,butwithoutcancellationthepilot still feelsa largeinitialbumpduringanyabruptmaneuverbecausetheaircraftstructureinitiallybendsandsnapsbackwhilethevehiclepitchesoryaws.In termsof theaircraftdesign,theuseofmodalcancellationsuggestsaneedfortruemultifunctioncanardsfor attitudecontrolandmodesuppressionratherthandiminutiveridecontrolvanes,whichwouldonlyprovidemodaldampingasin theB-1. TheCHRsshownin figure29depictmuchlessvariationwithincreaseddampingandmodalcancellationthandidtheRQRsorCIRs.
Impact of Increasing Turbulence Level
Variation of turbulence level was the final factor examined in this experiment. For the majority of
configuration and task evaluations, an rms Dryden spectral turbulence level of 3 ft/s was used (light
turbulence). But for two configurations, the pilots also performed the nominal approach and landing task
with rms turbulence levels of 4.5 ft/s (moderate) and 6.0 ft/s (heavy). These spot evaluations of selected
configurations were intended to provide insight into the variation of configuration acceptability that could
be expected to result from increasing turbulence levels. The two configurations chosen for the turbulence
level variation were the QSAE0 configuration (no dynamic aeroelastic effects) and the D/XAVlP7configura-
tion (0.15 damping applied to modes SY1, AN1, SY2, and AN2).
The results shown in table 12 were inconclusive regarding the impact of turbulence level on the vari-
ous pilot rating metrics. The reason for this result is uncertain, for it seems likely that increasing the
turbulence excitation amplitudes of the aircraft structure would almost certainly degrade the cockpit
acceleration environment. The cockpit environment degradation due to increasing turbulence levels may
have been perceived as insignificant in comparison with the degradation that was experienced as a result
of the other parametric variations concurrently evaluated in this experiment.
Correlation of Ride Quality Ratings With Cockpit Vibration Spectra
Figure 18 provides a subjective basis for the judgment of an acceptable level of mode suppression
from a pilot's ride quality perspective. An attempt was made to correlate these subjective ratings of ride
quality with a quantitative characterization of the vibration environment the pilots were experiencing at
the time they provided the ratings. In this way we hoped to provide insight regarding allowable vibration
levels at the pilot station in response to maneuver excitation of the aeroelastic modes to achieve accept-
able ride quality. This analysis was performed only for the lateral offset landing task since that task
produced the greatest range of RQRs.
Measured lateral accelerations from the last 15 s of one particular run performed with the ST IF2 con-
figuration are shown in figure 30. The pilot assigned this configuration an RQR of 5. This measured
cockpit acceleration time history was analyzed to produce the rms lateral vibration spectrum plot shown
in figure 31. The first and second antisymmetric mode frequencies for the STIF2 configuration are
1.89 and 2.90 Hz, as indicated in table 1. These frequencies correspond to peaks in the spectrum plot of
measured accelerations shown in figure 31.
Similar vibration spectrum plots were generated for each run of the lateral offset landing task
performed by each evaluation pilot for each configuration. These vibration spectra were then grouped
according to the RQR that a particular run was given by the pilot, regardless of the configuration. Such a
grouping is shown in figure 32. Each run shown in this figure was assigned an RQR of 5, but the runs
were produced by different pilots flying different configurations. The plot contains runs for the BASE0
configuration as well as the STIF1, STIF2, D/LMP1, D/LNP2, and CANC1 configurations, and any others that
were assigned an RQR of 5 by any pilot as indicated in table 8. The maximum and minimum rms accel-
erations at each frequency from the complete set of runs were then used to produce a vibration spectral
20

envelopethatencompassesthecharacteristicsof allrunsawardedanRQRof 5. Thisspectralenvelopeisshownin figure33. In thiswaywehaveattemptedtocharacterizetherangeof vibrationenvironmentsthepilotsinourexperimentjudgedtohaveanRQRof5.
Similarspectralenvelopeswereproducedfor timehistoriesthatwereawardedRQRsfrom1to 4 asneeded.Theselateralvibrationspectralenvelopeswerethensuperimposedto producetheplotshowninfigure34. Thesameprocedurewasusedto producethecollectionof verticalvibrationspectralenvelopesshownin figure35. Thegoalis to provideinsightastotheacceptancebythepilotsof differentlevelsofcockpitvibrationovertherangeof modalfrequenciesthatwasincludedin thisexperiment.Vibrationlevelsfor agivenRQRscorewerehigherlongitudinallythanlaterally;thisresultagreeswithprecedentsintheliteratureandsuggeststhatlateralvibrationislesseasilytoleratedthanverticalvibration.
Becausethevibrationspectralenvelopesshownin figures34and35arebasedonalimitednumberofevaluationswitha limitednumberofpilots,wecannotdefinitivelystatethatallfutureconfigurationswithvibrationspectrapenetratingtheRQR5 envelopewill beawardedanRQRof 5. Also,theenvelopesoverlap.MuchoftheRQR4envelopeliesontopof portionsoftheRQR5envelope.However,theplotsdoprovideageneralindicationof theamountof vibrationconsideredacceptableattheparticularmodalfrequenciesincludedin theexperiment.Notethatthesevibrationlevelswereincurredduringpilotedmaneuverexcitationof thedynamicelasticmodesin thepresenceof mildturbulence.Theaeroelasticresponsesto controlexcitationduringthe maneuverswerethe dominantfactorin producingthevibrations.
An importantcaveatto noteis thatfigures34and35donotprovideinformationin thefrequencyrangewheretherewerenodynamicspresentin themodelsor in themotioncuestothepilot. Therangeof motion-basefidelityfor elasticresponsesextendsfromabout2.5to3Hz. Thedropinvibrationlevelsbeyond3 Hzshownin thespectralplotsdoesnotmeanthatpilot tolerancesareextremelylow atthisfrequency.It ismorelikelyaresultof thediminishingresponseof themotionplatformin thisfrequencyrange. Theplotsshownin figures34 and35simplyindicatetherangeof vibrationenvironmentsexperiencedat thetimethepilots awardeda particularRQRduringthisexperiment.Thespectralenvelopesfor verticalvibrationsfromfigure35areplottedwith theverticalvibrationstandardfromreference14in figure36.
Concluding Remarks
A piloted simulation experiment was conducted in the Langley Visual Motion Simulator (VMS) to
address the impact of dynamic aeroservoelastic (DASE) effects on flying qualities of the High Speed
Civil Transport. The intent of the experiment was to generate information regarding measures that can be
taken to reduce the impact of aircraft flexibility on piloting tasks. Potential solutions examined consisted
of increasing the frequency of the elastic modes, increasing the damping of various combinations of
elastic modes, eliminating control effector excitation of the lowest frequency elastic modes, and elimi-
nating visual cues associated with the elastic modes. The various configurations were evaluated by six
test pilots who performed three types of maneuvers consisting of a nominal approach and landing task, a
landing task that included a low-altitude correction for a lateral offset from the runway centerline, and a
subsonic maneuvering flight director tracking task.
During the investigation, several profound incidents of biodynamic coupling (BDC) were encountered
in which cockpit vibrations due to elastic modes fed back into the control stick through involuntary
motions of the pilot's upper body and arm. The phenomenon is evidenced by a resonant peak in the
power spectrum of the pilot's stick inputs at the frequency of one of the dynamic elastic modes. The
21

tendencytocouplewithstructuralmodesin thisfashionappearstoincreasewhenpilotstightentheirgriponthestick,ofteninpreparationfortheflareastheaircraftnearstherunway.
Twoof thesixevaluationpilotsencounteredpronouncedBDCforaeroelasticconfigurationsthathadlittle ornoadditionaldampingof theelasticmodes.A thirdpilot experiencedoccasionalor frequentfeed-throughof vibrationsbackintothecontrolstickthatimpactedtheprecisionof hisinputsforcertainstiffenedconfigurationswhennoadditionaldampingwaspresent.All pilotsindicatedthatvibrationsimpactedtheprecisionof theirinputsat somepointin theexperiment.Pilotswerefarmorepronetoexperienceadversecouplingwithantisymmetricmodesratherthansymmetricmodes.Someof themostextremeinstancesof BDCoccurredwiththeconfigurationsin whichadampingratioof 0.3wasappliedto thesymmetricmodes,whereasnoadditionaldampingwasappliedto theantisymmetricmodes.Theseverityof theBDCphenomenonmayhaveimplicationsfor controlstickdesignandfortheflightcriti-calityofanactivemodesuppressioncontrolsystem.
Theresultsof this investigationindicatethatstructuralstiffeningandcompensationof thevisualdisplaywereof little benefitin alleviatingtheimpactof elasticdynamicsonpilotingtasks,whereasincreaseddampingandeliminationof control-effectorexcitationof thelowestfrequencymodesbothofferedgreatimprovementswhenappliedin sufficientdegree.Structuralstiffeningdid notprovideeffectiverelieffromBDCforthetwopilotswhoappearedmostproneto thistypeof interaction.Damp-ing levelsof 0.15appliedto thefirst symmetricandfirst antisymmetricmodesappearedsufficienttopreventBDC. Whendampinglevelsof 0.3wereappliedto thefirsttwosymmetricandfirst twoanti-symmetricmodes,averagepilotratingsindicatedthataborderline-acceptableconfigurationwasachieved.Withtheadditionof mode-cancelingcontrol,inwhichcontroleffectorexcitationof thefirstsymmetricandfirstantisymmetricmodeswaseliminated,theaveragepilotratingsindicatethatanacceptablecon-figurationwasachieved.
22

Table 1. Modal Frequencies for Stiffened Configuration
Config
BASE0
STIFI
STIF2
STIF3
Frequency
ratio
1.00
1.16
1.36
1.60
Stiffness
ratio
1.00
1.35
1.85
2.56
Stiffness
increase,
percent
0
35
85
156
1st frequency,
Hz
SY AN
1.25 1.39
1.45 1.61
1.70 1.89
2.00 2.22
2d frequency,
Hz
SY AN
2.01 2.13
2.33 2.47
2.73 2.90
3.22 3.41
3d frequency,
Hz
SY AN
2.70 2.82
3.13 3.27
3.67 3.84
4.32 4.51
Table 2. Damping Levels and Targeted Modes for Damped Configurations
Config Damping ratio Modes damped
STIFI
DAMP 1
DAMP2
DAMP3
DAMP4
DAMP5
DAMP6
DAMP7
DAMP8
DAMP9
DAMP10
Nominal
0.07
0.15
0.30
0.30
0.30
0.07
0.15
0.30
0.30
0.30
None
SY1, AN1
SY1, AN1
SY1, AN1
SY1
AN1
SY1, SY2, AN1, AN2
SY1, SY2, AN1, AN2
SY1, SY2, AN1, AN2
SY1, SY2
AN1, AN2
Table 3. Description of Modal-Cancellation Portion of Test Matrix
Config
STIFI
CANCI
CANC2
CANC3
CANC4
Modes canceled Damping ratio ofremaining modes
None
SY1, AN1
SY1, AN1
SY1, AN1
SY1, AN1
None
None
0.07
0.15
0.30
23

Table 4. Parametric Configurations Used in LaRC.3 Simulation Experiment
Modification Config Label Description
None 1 QSAE0 Dynamic aeroelastic effects turned off
2 BASE0 Baseline dynamic aeroservoelastic configuration
Display
filtering 3 DISP0 DAMP1 with CGI DASE perturbations relative to HUD turned off
Structural 4 STIF1 a First mode increased to 1.45 Hz; all others by same frequency ratio
stiffening 5 STIF2 First mode increased to 1.80 Hz; all others by same frequency ratio
6 STIF3 First mode increased to 2.00 Hz; all others by same frequency ratio
7 DAMP 1 Modal damping increased to 0.07 for modes SY1 and AN1Modal
damping
Modal
cancellation
Turbulence
variation
8
9
10
11
12
13
14
15
DAMP2
DAMP3
DAMP4
DAMP5
DAMP6
DAMP7
DAMP8
DAMP9
Modal damping
Modal damping
Modal damping
Modal damping
Modal damping
Modal damping
Modal damping
Modal damping
increased to
increased to
increased to
increased to
increased to
increased to
increased to
increased to
16
17
18
19
20
21
22
23
24
DAMP10
CANCl
CANC2
CANC3
CANC4
Modal damping increased to
Modes SY1 and AN1 control
Modes SY1 and AN1 control
damped to 0.07
Modes SY1 and AN1 control
damped to 0.15
Modes SY1 and AN1 control
damped to 0.30
0.15 for modes SY1 andAN1
0.30 for modes SY1 and AN1
0.30 for mode SY1
0.30 for mode AN1
0.07 for modes SY1, AN1, SY2, and AN2
0.15 for modes SY1, AN1, SY2, and AN2
0.30 for modes SY1, AN1, SY2, and AN2
0.30 for modes SY1 and SY2
0.30 for modes AN1 and AN2
excitation eliminated
excitation eliminated; remaining modes
excitation eliminated; remaining modes
excitation eliminated; remaining modes
QSAE0
QSAE0
DAMP7
DAMP7
Moderate (c_ = 4.5) turbulence (nominal approach and landing only)
Heavy (c_ = 6.0) turbulence (nominal approach and landing only)
Moderate (c_ = 4.5) turbulence (nominal approach and landing only)
Heavy (c_ = 6.0) turbulence (nominal approach and landing only)
aModified baseline.
24
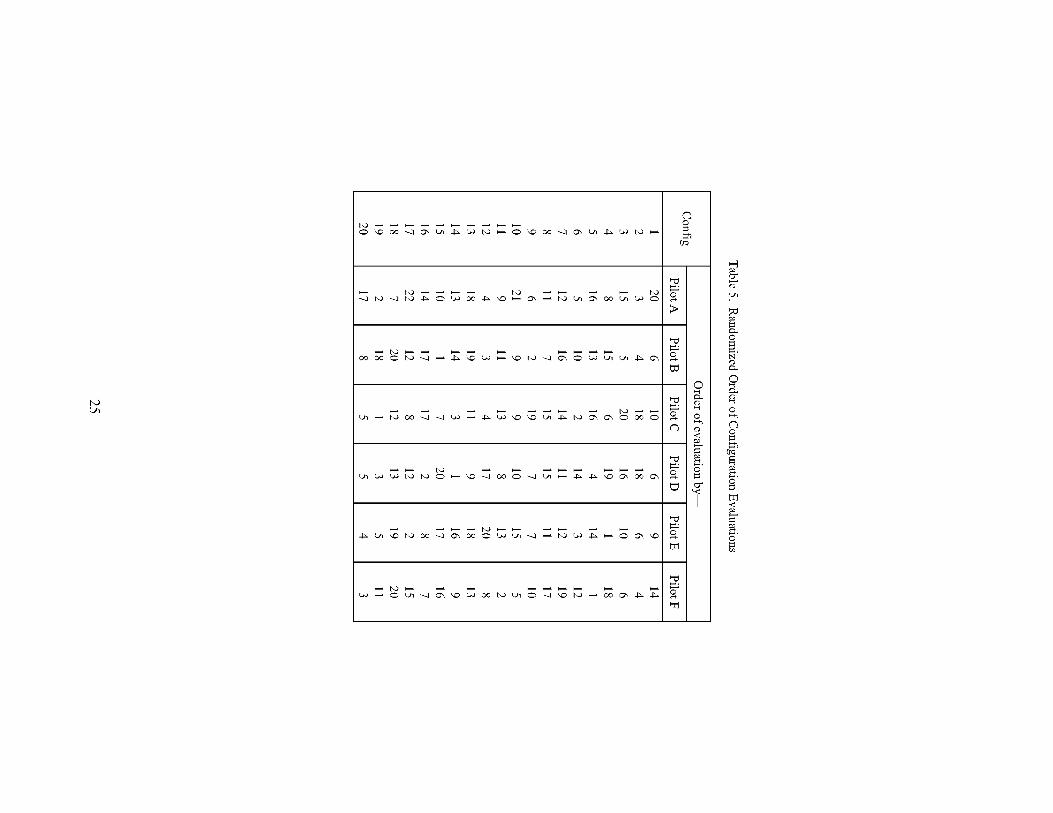
C_
©
_ o
C_
N
o
C_
C_
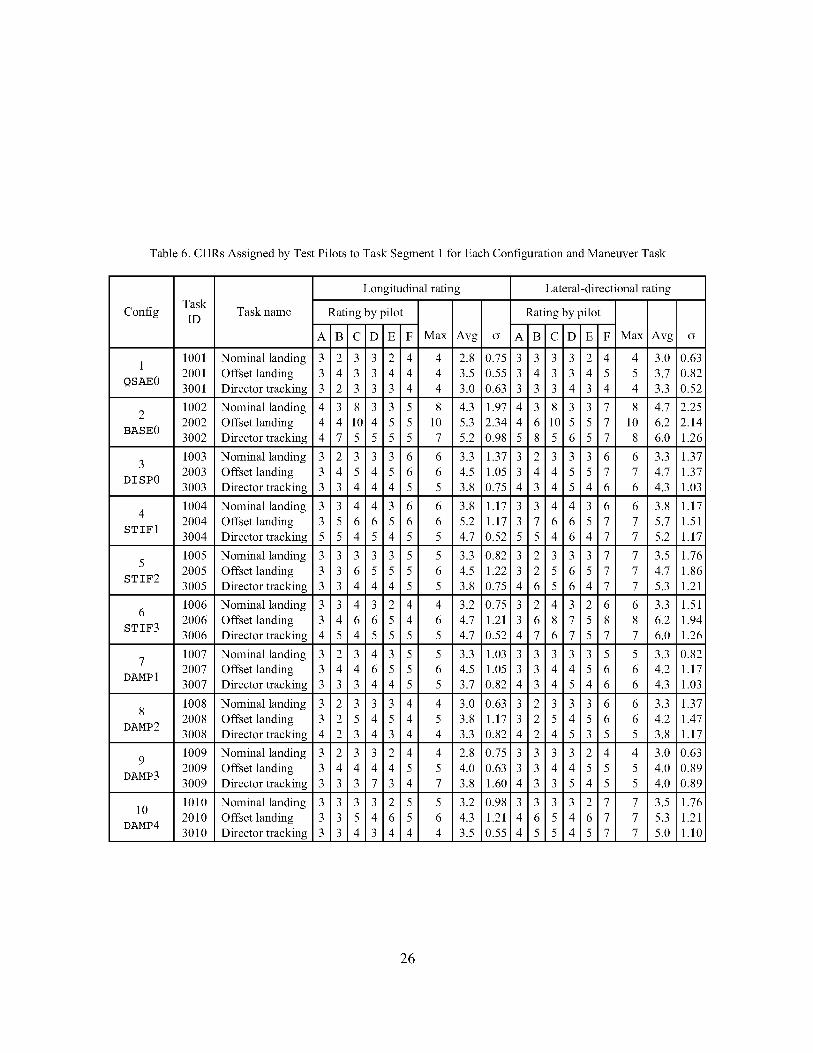
Table 6. CHRs Assigned by Test Pilots to Task Segment 1 for Each Configuration and Maneuver Task
Config
1
QSAE0
2
BASE0
3
DISP0
4
STIFI
5
STIF2
6
STIF3
7
DAMP l
8
DAMP2
9
DAMP3
10
DAMP4
TaskTask name
ID
Longitudinal rating Lateral-directional rating
Rating by pilot Rating by pilot
A B C D E F Max Avg c_ A B C D E F Max Avg c_
1001 Nominal landing 3 2 3 3 2 4
2001 Offset landing 3 4 3 3 4 4
3001 Director tracking 3 2 3 3 3 4
1002 Nominal landing 4 3 8 3 3 5
2002 Offset landing 4 4 10 4 5 5
3002 Director tracking 4 7 5 5 5 5
1003 Nominal landing 3 2 3 3 3 6
2003 Offset landing 3 4 5 4 5 6
3003 Director tracking 3 3 4 4 4 5
1004 Nominal landing 3 3 4 4 3 6
2004 Offset landing 3 5 6 6 5 6
3004 Director tracking 5 5 4 5 4 5
1005 Nominal landing 3 3 3 3 3 5
2005 Offset landing 3 3 6 5 5 5
3005 Director tracking 3 3 4 4 4 5
1006 Nominal landing 3 3 4 3 2 4
2006 Offset landing 3 4 6 6 5 4
3006 Director tracking 4 5 4 5 5 5
1007 Nominal landing 3 2 3 4 3 5
2007 Offset landing 3 4 4 6 5 5
3007 Director tracking 3 3 3 4 4 5
1008 Nominal landing 3 2 3 3 3 4
2008 Offset landing 3 2 5 4 5 4
3008 Director tracking 4 2 3 4 3 4
1009 Nominal landing 3 2 3 3 2 4
2009 Offset landing 3 4 4 4 4 5
3009 Director tracking 3 3 3 7 3 4
1010 Nominal landing 3 3 3 3 2 5
2010 Offset landing 3 3 5 4 6 5
3010 Director tracking 3 3 4 3 4 4
4 2.8 0.75 3 3 3 3 2 4 4 3.0 0.63
4 3.5 0.55 3 4 3 3 4 5 5 3.7 0.82
4 3.0 0.63 3 3 3 4 3 4 4 3.3 0.52
8 4.3 1.97 4 3 8 3 3 7 8 4.7 2.25
10 5.3 2.34 4 6 10 5 5 7 10 6.2 2.14
7 5.2 0.98 5 8 5 6 5 7 8 6.0 1.26
6 3.3 1.37 3 2 3 3 3 6 6 3.3 1.37
6 4.5 1.05 3 4 4 5 5 7 7 4.7 1.37
5 3.8 0.75 4 3 4 5 4 6 6 4.3 1.03
6 3.8 1.17 3 3 4 4 3 6 6 3.8 1.17
6 5.2 1.17 3 7 6 6 5 7 7 5.7 1.51
5 4.7 0.52 5 5 4 6 4 7 7 5.2 1.17
5 3.3 0.82 3 2 3 3 3 7 7 3.5 1.76
6 4.5 1.22 3 2 5 6 5 7 7 4.7 1.86
5 3.8 0.75 4 6 5 6 4 7 7 5.3 1.21
4 3.2 0.75 3 2 4 3 2 6 6 3.3 1.51
6 4.7 1.21 3 6 8 7 5 8 8 6.2 1.94
5 4.7 0.52 4 7 6 7 5 7 7 6.0 1.26
5 3.3 1.03 3 3 3 3 3 5 5 3.3 0.82
6 4.5 1.05 3 3 4 4 5 6 6 4.2 1.17
5 3.7 0.82 4 3 4 5 4 6 6 4.3 1.03
4 3.0 0.63 3 2 3 3 3 6 6 3.3 1.37
5 3.8 1.17 3 2 5 4 5 6 6 4.2 1.47
4 3.3 0.82 4 2 4 5 3 5 5 3.8 1.17
4 2.8 0.75 3 3 3 3 2 4 4 3.0 0.63
5 4.0 0.63 3 3 4 4 5 5 5 4.0 0.89
7 3.8 1.60 4 3 3 5 4 5 5 4.0 0.89
5 3.2 0.98 3 3 3 3 2 7 7 3.5 1.76
6 4.3 1.21 4 6 5 4 6 7 7 5.3 1.21
4 3.5 0.55 4 5 5 4 5 7 7 5.0 1.10
26

Table 6. Concluded
Config
11
DAMP 5
12
DAMP6
13
DAMP7
14
DAMP8
15
DAMP9
16
DAMPIO
17
CANCl
18
CANC2
19
CANC3
20
CANC4
TaskTask name
ID
Longitudinal rating Lateral-directional rating
Rating by pilot Rating by pilot
A B C D E F Max Avg c_ A B C D E F Max Avg c_
1011 Nominal landing 3 2 3 4 3 7
2011 Offsetlanding 3 3 5 4 5 7
3011 Director tracking 3 2 4 4 4 6
1012 Nominal landing 3 3 3 4 3 5
2012 Offsetlanding 3 3 5 4 5 5
3012 Director tracking 3 2 3 4 4 5
1013 Nominal landing 3 2 3 3 2 4
2013 Offsetlanding 3 4 4 3 5 5
3013 Director tracking 3 3 3 4 4 4
1014 Nominal landing 3 2 3 3 2 4
2014 Offsetlanding 3 3 4 5 4 5
3014 Director tracking 3 3 3 4 4 5
1015 Nominal landing 3 3 6 6 3 4
2015 Offsetlanding 3 5 6 5 6 4
3015 Director tracking 3 3 3 4 4 4
1016 Nominal landing 3 3 4 3 3 5
2016 Offsetlanding 3 4 5 6 5 7
3016 Director tracking 3 3 4 5 4 5
1017 Nominal landing 3 2 3 4 3 5
2017 Offsetlanding 3 4 6 4 4 5
3017 Director tracking 3 2 4 3 3 4
1018 Nominal landing 3 2 3 3 2 4
2018 Offsetlanding 3 3 4 4 5 5
3018 Director tracking 3 2 3 3 3 5
1019 Nominal landing 3 1 3 3 2 4
2019 Offsetlanding 3 2 4 4 4 5
3019 Director tracking 3 2 3 3 3 4
1020 Nominal landing 3 2 3 3 2 4
2020 Offset landing 3 2 4 3 5 4
3020 Director tracking 3 2 3 4 3 4
7 3.7 1.75 3 2 3 3 3 4
7 4.5 1.52 3 3 4 4 5 6
6 3.8 1.33 3 3 3 5 4 6
5 3.5 0.84 3 2 3 3 3 5
5 4.2 0.98 3 2 5 4 5 7
5 3.5 1.05 4 3 4 4 4 7
4 2.8 0.75 3 2 3 3 2 4
5 4.0 0.89 3 3 4 4 5 5
4 3.5 0.55 4 5 4 5 4 5
4 2.8 0.75 3 2 3 3 2 4
5 4.0 0.89 3 3 4 5 4 5
5 3.7 0.82 4 3 3 5 4 5
6 4.2 1.47 3 5 5 6 4 7
6 4.8 1.17 3 7 6 6 7 7
4 3.5 0.55 4 7 4 7 4 6
5 3.5 0.84 3 2 4 3 3 4
7 5.0 1.41 3 5 4 4 5 5
5 4.0 0.89 4 6 4 4 3 5
5 3.3 1.03 3 2 3 3 3 7
6 4.3 1.03 3 3 5 5 4 7
4 3.2 0.75 4 3 4 3 3 7
4 2.8 0.75 3 2 3 3 2 4
5 4.0 0.89 3 2 4 5 4 5
5 3.2 0.98 3 3 3 4 3 5
4 2.7 1.03 3 1 3 3 2 4
5 3.7 1.03 3 2 4 4 4 5
4 3.0 0.63 4 2 3 4 3 5
4 2.8 0.75 3 2 3 3 2 4
5 3.5 1.05 3 2 4 3 4 5
4 3.2 0.75 3 3 3 5 3 6
4 3.0 0.63
6 4.2 1.17
6 4.0 1.26
5 3.2 0.98
7 4.3 1.75
7 4.3 1.37
4 2.8 0.75
5 4.0 0.89
5 4.5 0.55
4 2.8 0.75
5 4.0 0.89
5 4.0 0.89
7 5.0 1.41
7 6.0 1.55
7 5.3 1.51
4 3.2 0.75
5 4.3 0.82
6 4.3 1.03
7 3.5 1.76
7 4.5 1.52
7 4.0 1.55
4 2.8 0.75
5 3.8 1.17
5 3.5 0.84
4 2.7 1.03
5 3.7 1.03
5 3.5 1.05
4 2.8 0.75
5 3.5 1.05
5 3.8 1.03
27

Table 7. CHRs Assigned by Test Pilots to Task Segment 2 for Each Configuration and Maneuver Task
Config
1
QSAE0
2
BASE0
3
DISP0
4
STIFI
5
STIF2
6
STIF3
7
DAMP 1
8
DAMP2
9
DAMP3
I0
DAMP4
II
DAMP 5
12
DAMP6
13
DAMP7
14
DAMP8
15
DAMP9
16
DAMP10
17
CANC 1
18
CANC2
19
CANC3
20
CANC4
TaskTask name
ID
Longitudinal rating Lateral-directional rating
Rating by pilot Rating by pilot
A B C D E F Max Avg c_ A B C D E F Max Avg c_
1001 Nominal landing 4 4 3 5 3 5
2001 Offset landing 3 4 4 5 4 5
1002 Nominal landing 5 4 8 5 4 5
2002 Offset landing 5 6 10 5 5 5
1003 Nominal landing 3 3 4 6 5 6
2003 Offset landing 5 4 5 6 5 6
1004 Nominal landing 5 5 5 7 5 6
2004 Offset landing 6 7 6 7 5 6
1005 Nominal landing 4 4 4 6 4 5
2005 Offset landing 5 5 6 5 6 5
1006 Nominal landing 5 4 5 5 3 5
2006 Offset landing 5 7 6 7 5 5
1007 Nominal landing 5 4 3 6 5 5
2007 Offset landing 5 5 5 6 5 5
1008 Nominal landing 4 4 3 4 4 5
2008 Offset landing 5 4 5 5 5 5
1009 Nominal landing 4 3 4 6 3 5
2009 Offset landing 5 6 5 7 4 5
1010 Nominal landing 5 4 5 5 5 5
2010 Offsetlanding 5 5 5 5 6 5
1011 Nominallanding 5 4 4 5 4 7
2011 Offset landing 5 4 5 5 5 7
1012 Nominal landing 4 5 4 6 5 5
2012 Offsetlanding 5 5 5 5 5 5
1013 Nominal landing 4 4 4 4 5 5
2013 Offsetlanding 4 5 4 5 5 5
1014 Nominal landing 3 3 3 5 3 5
2014 Offset landing 4 4 4 6 4 5
1015 Nominal landing 4 4 6 6 4 5
2015 Offsetlanding 4 8 6 5 6 5
1016 Nominal landing 4 3 5 6 5 5
2016 Offset landing 5 6 7 6 5 7
1017 Nominal landing 4 3 4 5 4 5
2017 Offset landing 5 5 6 5 4 5
1018 Nominal landing 4 4 4 5 3 5
2018 Offset landing 5 4 4 6 5 5
1019 Nominal landing 3 2 3 3 3 5
2019 Offset landing 5 2 4 5 4 5
1020 Nominal landing 3 4 3 5 3 5
2020 Offset landing 5 4 4 5 5 5
5 4.0 0.89 4 3 3 3 3 3 4 3.2 0.41
5 4.2 0.75 3 4 3 4 4 5 5 3.8 0.75
8 5.2 1.47 4 3 8 4 4 7 8 5.0 2.00
10 6.0 2.00 4 6 10 6 5 7 10 6.3 2.07
6 4.5 1.38 3 4 3 4 5 6 6 4.2 1.17
6 5.2 0.75 4 4 4 6 5 7 7 5.0 1.26
7 5.5 0.84 4 3 4 4 5 7 7 4.5 1.67
7 6.2 0.75 4 7 8 6 5 7 8 6.2 1.22
6 4.5 0.84 4 2 3 4 4 7 7 4.0 1.67
6 5.3 0.41 4 5 5 7 5 7 7 5.5 1.22
5 4.5 0.84 4 3 5 5 3 6 6 4.3 1.21
7 5.8 0.98 4 6 8 6 5 8 8 6.2 1.6
6 4.7 1.03 4 3 3 3 4 5 5 3.7 0.82
6 5.2 0.41 4 4 4 4 5 5 5 4.3 0.52
5 4.0 0.63 4 2 3 3 4 6 6 3.7 1.37
5 4.8 0.41 4 2 5 4 5 6 6 4.3 1.37
6 4.2 1.17 4 3 3 4 3 4 4 3.5 0.55
7 5.3 1.03 4 3 5 4 5 4 5 4.2 0.75
5 4.8 0.41 4 4 8 5 5 7 8 5.5 1.64
6 5.2 0.41 5 7 8 5 6 7 8 6.3 1.21
7 4.8 1.17 4 2 3 4 4 4 4 3.5 0.84
7 5.2 0.98 4 3 4 4 5 6 6 4.3 1.03
6 4.8 0.75 4 3 3 5 5 5 5 4.2 0.98
5 5.0 0.00 4 4 5 5 5 7 7 5.0 1.10
5 4.3 0.52 4 3 4 3 5 4 5 3.8 0.75
5 4.7 0.52 4 3 5 5 5 4 5 4.3 0.82
5 3.7 1.03 3 2 3 4 3 2 4 2.8 0.75
6 4.5 0.84 4 4 4 5 4 5 5 4.3 0.52
6 4.8 0.98 4 5 5 8 5 7 8 5.7 1.51
8 5.7 1.37 4 7 6 6 7 7 7 6.2 1.17
6 4.7 1.03 3 2 4 5 4 4 5 3.7 1.03
7 6.0 0.89 4 5 4 5 5 5 5 4.7 0.52
5 4.2 0.75 4 3 3 3 4 7 7 4.0 1.55
6 5.0 0.63 5 4 5 5 4 7 7 5.0 1.10
5 4.2 0.75 4 2 3 5 3 5 5 3.7 1.21
6 4.8 0.75 4 3 4 5 4 5 5 4.2 0.75
5 3.2 0.98 3 2 3 3 3 4 4 3.0 0.63
5 4.2 1.17 4 2 4 5 4 5 5 4.0 1.10
5 3.8 0.98 3 3 3 4 3 4 4 3.3 0.52
5 4.7 0.52 4 2 3 4 4 4 4 3.5 0.84
28

Config
1
QSAE0
2
BASE0
3
DISP0
4
STIFI
5
STIF2
6
STIF3
7
DAMP l
8
DAMP2
9
DAMP3
10
DAMP4
Table 8. CIRs and RQRs Provided by Test Pilots for Each Configuration and Maneuver Task
TaskTask name
ID
CIR RQR
Rating by pilot Rating by pilot
A B C D E F Max Avg c_ A B C D E F Max Avg c_
1001 Nominal landing 1 1 1 1 1 1
2001 Offset landing 1 1 1 1 1 1
3001 Director tracking 1 1 1 1 1 1
1002 Nominal landing 3 2 5 3 3 3
2002 Offset landing 3 2 6 3 4 3
3002 Director tracking 3 2 5 4 4 3
1003 Nominal landing 2 2 3 2 3 3
2003 Offset landing 2 2 3 3 3 3
3003 Director tracking 2 2 3 4 3 3
1004 Nominal landing 3 2 4 3 4 3
2004 Offset landing 3 4 4 3 4 3
3004 Director tracking 3 2 3 3 4 3
1005 Nominal landing 2 2 4 3 3 3
2005 Offset landing 2 2 5 4 4 3
3005 Director tracking 1 2 5 4 4 3
1006 Nominal landing 3 3 4 3 2 2
2006 Offset landing 2 3 5 3 3 3
3006 Director tracking 3 2 5 4 4 3
1007 Nominal landing 3 2 2 3 3 2
2007 Offset landing 3 2 3 3 3 3
3007 Director tracking 2 2 3 3 3 3
1008 Nominal landing 2 2 2 2 3 2
2008 Offset landing 2 2 3 2 3 2
3008 Director tracking 2 2 3 2 3 2
1009 Nominal landing 1 1 1 2 2 2
2009 Offset landing 1 2 2 3 2 2
3009 Director tracking 1 2 1 3 2 2
1010 Nominal landing 3 2 5 2 3 3
2010 Offsetlanding 3 2 5 2 4 3
3010 Director tracking 2 2 5 3 3 3
1 1.0 0 2 2 1 2 1 1
1 1.0 0 2 1 1 2 1 1
1 1.0 0 1 2 1 2 1 1
5 3.2 0.98 5 5 5 4 4 5
6 3.5 1.38 5 5 6 4 5 5
5 3.5 1.05 5 5 5 5 5 5
3 2.5 0.55 5 3 5 4 4 5
3 2.7 0.52 5 4 5 4 4 5
4 2.8 0.75 4 5 5 5 4 5
4 3.2 0.75 5 5 5 5 5 5
4 3.5 0.55 5 5 5 5 5 5
4 3.0 0.63 5 5 5 4 5 5
4 2.8 0.75 4 4 5 4 4 5
5 3.3 1.21 4 5 5 5 5 5
5 3.2 1.47 4 5 5 5 5 5
4 2.8 0.75 5 4 5 4 3 4
5 3.2 0.98 5 5 5 5 4 5
5 3.5 1.05 5 5 5 5 5 5
3 2.5 0.55 5 4 4 3 4 5
3 2.8 0.41 5 4 5 4 5 5
3 2.7 0.52 4 5 5 5 5 5
3 2.2 0.41 4 3 4 3 4 4
3 2.3 0.52 3 4 5 3 5 4
3 2.3 0.52 4 5 5 4 5 4
2 1.5 0.55 3 2 3 3 2 3
3 2.0 0.63 3 3 4 5 3 3
3 1.8 0.75 3 3 3 5 3 3
5 3.0 1.1 5 4 5 3 5 5
5 3.2 1.17 5 5 5 3 5 5
5 3.0 1.1 4 5 5 5 4 5
2 1.5 0.55
2 1.3 0.52
2 1.3 0.52
5 4.7 0.52
6 5.0 0.63
5 5.0 0
5 4.3 0.82
5 4.5 0.55
5 4.7 0.52
5 5.0 0
5 5.0 0
5 4.8 0.41
5 4.3 0.52
5 4.8 0.41
5 4.8 0.41
5 4.2 0.75
5 4.8 0.41
5 5.0 0
5 4.2 0.75
5 4.7 0.52
5 4.8 0.41
4 3.7 0.52
5 4.0 0.89
5 4.5 0.55
3 2.7 0.52
5 3.5 0.84
5 3.3 0.82
5 4.5 0.84
5 4.7 0.82
5 4.7 0.52
29

Table 8. Concluded
Config
11
DAMP 5
12
DAMP6
13
DAMP7
14
DAMP8
15
DAMP9
16
DAMPIO
17
CANCl
18
CANC2
19
CANC3
20
CANC4
TaskTask name
ID
CIR RQR
Rating by pilot Rating by pilot
A B C D E F Max Avg c_ A B C D E F Max Avg c_
1011 Nominallanding 3 2 4 2 3 3
2011 Offsetlanding 3 2 4 2 3 3
3011 Director tracking 2 2 3 2 3 3
1012 Nominal landing 3 3 2 3 3 2
2012 Offsetlanding 3 3 4 3 3 3
3012 Director tracking 2 3 4 3 3 2
1013 Nominal landing 2 1 2 1 2 2
2013 Offsetlanding 2 2 3 1 2 2
3013 Director tracking 1 2 2 2 2 2
1014 Nominal landing 1 2 1 2 2 2
2014 Offsetlanding 1 2 1 3 2 2
3014 Director tracking 1 1 1 2 3 2
1015 Nominal landing 2 3 4 4 3 3
2015 Offsetlanding 2 4 5 3 4 3
3015 Director tracking 2 2 4 4 3 2
1016 Nominal landing 2 2 3 3 3 2
2016 Offsetlanding 2 2 4 3 3 3
3016 Director tracking 1 2 3 3 3 2
1017 Nominal landing 2 4 3 2 2 3
2017 Offsetlanding 1 3 4 3 3 3
3017 Director tracking 1 2 3 2 3 3
1018 Nominal landing 1 1 3 2 1 1
2018 Offsetlanding 1 1 3 2 1 1
3018 Director tracking 1 1 2 1 2 1
1019 Nominal landing 1 1 1 1 1 2
2019 Offsetlanding 1 1 1 2 2 2
3019 Director tracking 1 2 1 1 2 2
1020 Nominal landing 1 1 1 1 2 1
2020 Offset landing 1 1 1 1 2 1
3020 Director tracking 1 1 1 1 2 1
4 2.8 0.75 5 4 5 4 5 5
4 2.8 0.75 5 4 5 3 5 5
3 2.5 0.55 4 4 5 5 5 5
3 2.7 0.52 5 5 5 4 4 4
4 3.2 0.41 5 5 5 4 5 5
4 2.8 0.75 4 5 5 5 4 5
2 1.7 0.52 4 3 4 2 2 3
3 2.0 0.63 4 4 5 2 2 3
2 1.8 0.41 4 5 4 3 2 4
2 1.7 0.52 3 2 2 2 2 3
3 1.8 0.75 3 2 2 4 2 3
3 1.7 0.82 2 3 2 3 3 3
4 3.2 0.75 5 5 5 6 5 5
5 3.5 1.05 4 6 5 4 5 5
4 2.8 0.98 4 5 5 5 5 5
3 2.5 0.55 3 3 4 4 4 5
4 2.8 0.75 3 5 5 4 5 5
3 2.3 0.82 4 4 4 4 5 4
4 2.7 0.82 4 4 5 3 3 5
4 2.8 0.98 4 5 5 5 4 5
3 2.3 0.82 4 5 5 3 4 5
3 1.5 0.84 4 2 4 2 2 3
3 1.5 0.84 4 2 4 2 3 3
2 1.3 0.52 4 2 3 2 3 3
2 1.2 0.41 3 1 3 2 2 3
2 1.5 0.55 4 1 3 2 2 4
2 1.5 0.55 3 2 2 2 3 4
2 1.2 0.41 2 1 3 2 2 3
2 1.2 0.41 2 1 3 2 2 3
2 1.2 0.41 2 2 3 2 2 2
5 4.7 0.52
5 4.5 0.84
5 4.7 0.52
5 4.5 0.55
5 4.8 0.41
5 4.7 0.52
4 3.0 0.89
5 3.3 1.21
5 3.7 1.03
3 2.3 0.52
4 2.7 0.82
3 2.7 0.52
6 5.2 0.41
6 4.8 0.75
5 4.8 0.41
5 3.8 0.75
5 4.5 0.84
5 4.2 0.41
5 4.0 0.89
5 4.7 0.52
5 4.3 0.82
4 2.8 0.98
4 3.0 0.89
4 2.8 0.75
3 2.3 0.82
4 2.7 1.21
4 2.7 0.82
3 2.2 0.75
3 2.2 0.75
3 2.2 0.41
30
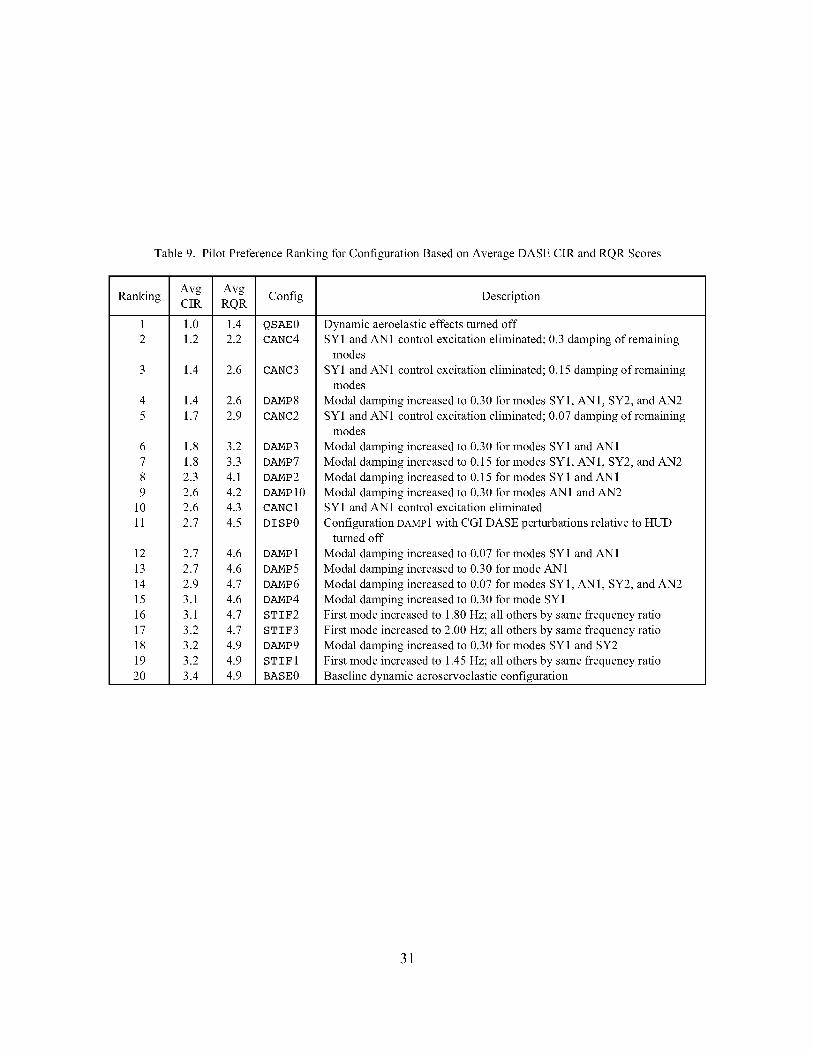
Table 9. Pilot Preference Ranking for Configuration Based on Average DASE CIR and RQR Scores
Avg Avg
Ranking CIR RQR
1 1.0 1.4 QSAE0
2 1.2 2.2 CANC4
6
7
8
9
10
11
12
13
14
15
16
17
18
19
20
1.4 2.6 CANC3
1.4 2.6 DAMP8
1.7 2.9 CANC2
1.8 3.2 DAMP3
1.8 3.3 DAMP7
2.3 4.1 DAMP2
2.6 4.2 DAMP10
2.6 4.3 CANC 1
2.7 4.5 DISP0
2.7 4.6 DAMP1
2.7 4.6 DAMP5
2.9 4.7 DAMP6
3.1 4.6 DAMP4
3.1 4.7 STIF2
3.2 4.7 STIF3
3.2 4.9 DAMP9
3.2 4.9 STIFf
3.4 4.9 BASE0
Config Description
Dynamic aeroelastic effects turned off
SY1 and AN1 control excitation eliminated;
modes
SY1 and AN1 control excitation eliminated;
modes
Modal damping increased to 0.30 for modes
SY1 and AN1 control excitation eliminated;
modes
Modal damping increased to 0.30 for modes
Modal damping increased to 0.15 for modes
Modal damping increased to 0.15 for modes
Modal damping increased to 0.30 for modes
SY1 and AN1 control excitation eliminated
Configuration DAMP 1 with CGI DASE perturbations relative to HUD
turned off
Modal damping increased to 0.07 for modes SY1 and AN1
Modal damping increased to 0.30 for mode AN1
Modal damping increased to 0.07 for modes SY1, AN1, SY2, and AN2
Modal damping increased to 0.30 for mode SY1
First mode increased to 1.80 Hz; all others by same frequency ratio
First mode increased to 2.00 Hz; all others by same frequency ratio
Modal damping increased to 0.30 for modes SY1 and SY2
First mode increased to 1.45 Hz; all others by same frequency ratio
Baseline dynamic aeroservoelastic configuration
0.3 damping of remaining
0.15 damping of remaining
SY1, AN1, SY2, and AN2
0.07 damping of remaining
SY 1 and AN 1
SY1, AN1, SY2, and AN2
SY 1 and AN 1
AN1 and AN2
31
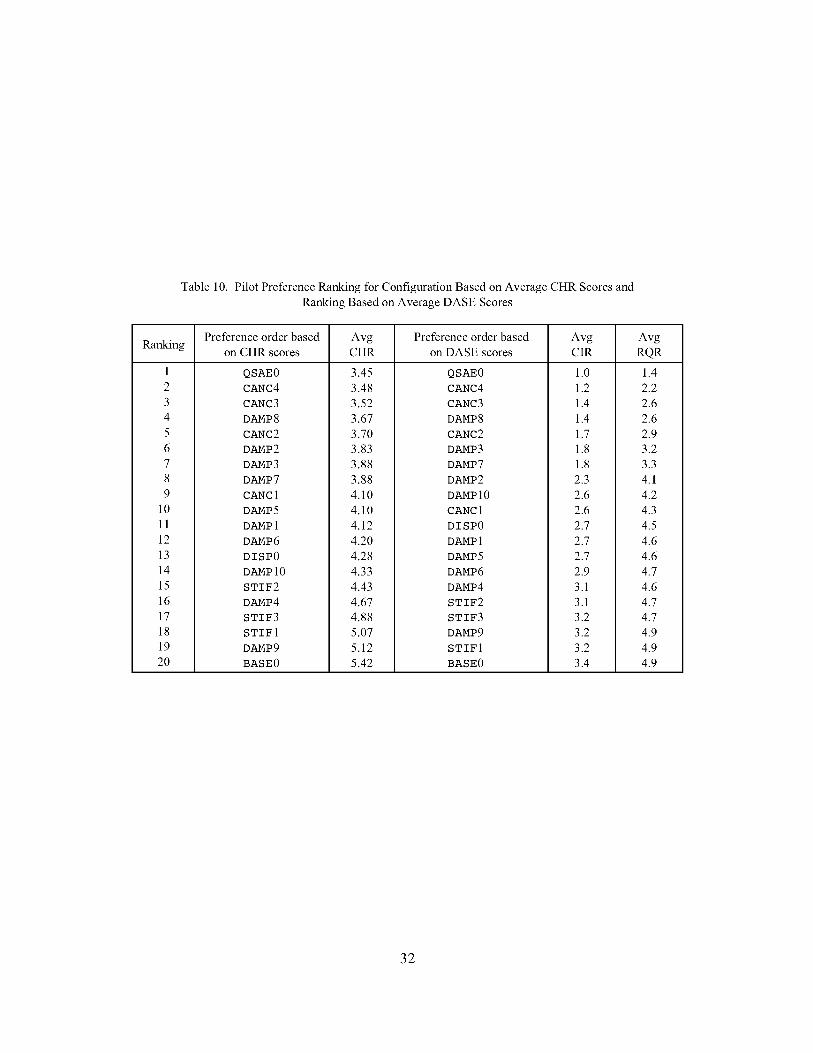
Table 10. Pilot Preference Ranking for Configuration Based on Average CHR Scores and
Ranking Based on Average DASE Scores
Preference order based Avg Preference order based Avg AvgRanking
on CHR scores CHR on DASE scores CIR RQR
1
2
3
4
5
6
7
8
9
10
11
12
13
14
15
16
17
18
19
20
QSAE0
CANC4
CANC3
DAMP8
CANC2
DAMP2
DAMP3
DAMP7
CANC 1
DAMP5
DAMP 1
DAMP6
DISP0
DAMP 10
STIF2
DAMP4
STIF3
STIFI
DAMP9
BASE0
3.45
3.48
3.52
3.67
3.70
3.83
3.88
3.88
4.10
4.10
4.12
4.20
4.28
4.33
4.43
4.67
4.88
5.07
5.12
5.42
QSAE0
CANC4
CANC3
DAMP8
CANC2
DAMP3
DAMP7
DAMP2
DAMP 10
CANC 1
DISP0
DAMP l
DAMP5
DAMP6
DAMP4
STIF2
STIF3
DAMP9
STIFI
BASE0
1.0
1.2
1.4
1.4
1.7
1.8
1.8
2.3
2.6
2.6
2.7
2.7
2.7
2.9
3.1
3.1
3.2
3.2
3.2
3.4
1.4
2.2
2.6
2.6
2.9
3.2
3.3
4.1
4.2
4.3
4.5
4.6
4.6
4.7
4.6
4.7
4.7
4.9
4.9
4.9
32

Table 11. Results for Configurations With and Without Display Compensation
Configuration name ...............................................
Display compensation ...........................................
DASE rating sum ...................................................
Pilot preference ranking ........................................
RQR
CIR
CHR
Max ....................................................
Avg ....................................................
Min .....................................................
Sum ....................................................
Max ....................................................
Avg ....................................................
Min .....................................................
Sum ....................................................
Max ....................................................
Avg ....................................................
Min .....................................................
Sum ....................................................
DISP0 a
On
129.0
11.0
5.0
4.5
3.0
81.0
4.0
2.7
2.0
48.0
7.0
4.3
2.0
257.0
DAMP 1b
Off
130.0
12.0
5.0
4.6
3.0
82.0
3.0
2.7
2.0
48.0
6.0
4.1
2.0
247.0
a0.07 damping applied to SY1 and AN1 modes.
bDAMP 1 configuration without DASE display perturbations.
Table 12. Effect of Turbulence Variation on Average CHR, CIR, and RQR Values
Turbulence, CHR CIR RQR
R/s(rms) QSAE0 DAMP7 QSAE0 DAMP7 QSAE0 DAMP7
3.0 3.0 3.5 1.0 1.7 1.5 3.3
4.5 3.1 3.6 1.0 1.8 1.5 3.8
6.0 3.5 3.9 1.2 2.3 1.7 3.8
33

Display compensation:
reduce impact of
visual cue_
Structural sti f_ning:increase modal
ffequencieActive suppression:
augment modal
[I oooooooooooo_o D
suppression:
mode-canceling control
Figure 1. Potential dynamic aeroelastic solutions that were examined.
Spoiler-slot deflectors
-Rudder segmem (3)
tor
Stabilizer
flap(two per wing)
Trailing-edge flap(lbur per wing)
Figure 2. Reference-H configuration arrangement.
34

Syimnetricmodes
SY
1.25
SY2
SY3
_ 2.71
In vacuo frequency, Hz Antisynm_etric modes
AN1
i AN2
2.13 _ .................. __
2.82 ..... __ --.........
Figure 3. Mode shapes and in vacuo frequencies for baseline dynamic aeroelastic model.
25
2O
-5
-3
AN1
":s_<'.:X%":
......... : .......... : .......... : ........ _---X ...... :.......... X .....
-2.5 -2 -1.5 -1 -.5 0 .5
Real axis
Figure 4. Migration of elastic mode poles with structural stiffness variation.
35

r_
}2
25
2O
15
10
5
0
.... 5
-10
Damping ratio
AN2, 2.50 Hz
SY2, 2.33 Hz
ANI, 1.62 Hz
SY1, 1.45 tiz
Real axis
Figure 5. Migration of dynamic elastic poles with varying damping level.
.25
.2O
...o
.15
.05
Figure 6.
0 l 2 3 4
Frequency, Hz
Frequency response of normal acceleration at pilot station to elevator inputs for various damping modes.
36

20
15
10
5
0'
-10
....15
....20
-20
STIF1
0 2O
5
0_
....5
-10
-15
-20
Real axis
C.z',NC1
2OC_
10 ....... _ ..........
0
c_
-20 0 20
Figure 7. Migration of transfer function zeros of dynamic elastic modes with elimination of control excitation.
.25
.20
.15
_.
.10
.O5
Baseline. with
cancellation_
! i
Baseline. without :
cancellati_ :.: .......
/
//
.............. r--. 07 damping. ,
r-. 15 damt)ing
1 2 3 4
Frequency, ttz
Figure 8. Effect of eliminating control excitation of first symmetric and first antisymmetric modes on frequency
response to elevator inputs.
37

ta,a
Target
touchdown
Nominal approach and landing:
Flaps automatically reconfigure at 390 fl
Disengage autothrottles at 50 fl
Manually reduce thrust through flare
Touchdown boxes indicated on runway CGI
r-------nr-------nr-------n
fl
r-------nr-------nr-------n
l"_-'_ 1000 fl
Threshold
Centerline
point, AN
1250 fl /' \
' / I Nz_l.08g
/i\I I
I I
I I
', __ 200 ft"" Flare initiation l
'_ I 45fl
Jj -3°'_
ILS glide slope
1500 fl
ILS glideslope Flare and
runway intercept, touchdown task
1000 fl (segment 2)
Flare and touchdown task performance criteria
Desired Adequate
X touchdown 1000 < XTD < 1500 fl 750 < XTD < 2250 fl
Y touchdown I YTD I < 10 fl I YTD I < 27 fl
Sink rate < 4 fl/s < 7 fl/s
Heading alignment I_1 < 3 ° I_1 < 6°
Speed at threshold 159 -+ 5 knots 159 -+ 10 knots
Max 0 below 50 fl 101<5° 101 < 7°
ILS approach
tracking task
(segment 1)
ILS approach task performance criteria
Desired Adequate
Glideslope error ±1/2 dot ±1 dot
Localizer error ±1/2 dot ±1 dot
Airspeed error 159 ± 5 knots 159 ± 10 knots
Figure 9 Task definition and performance tolerances for nominal approach and landing

COOPER-HARPER HANDLING QUALITIES RATING SCALE
Pilot decisions J
* Defini_on of required opera,on involves designa_on of flight phaseand/or subphases with accompanying conditions
Figure 10.
DEFINITIONS FROM TND-5153
COMPENSATION
The measure of additional pilot effortand attention required to maintain agiven level of performance in the faceof deficient vehicle characteristics.
HANDLING QUALITIES
Those qualities or charcteristics of anaircraft that govern the ease and pre-cision with which a pilot is able toperform the tasks required in supportof an aircraft role.
MISSION
The composite of pilot-vehicle functions
that must be performed to fulfil opera-tional requirements. May be specified fora role, complete flight, flight phase, or
flight subphase.
PERFORMANCE
The precision of control with respect to
aircraft movement that a pilot is able toachieve in performing a task. (Pilotvehicle performance is a measure of
handling performance. Pilot perform-ance is a measure of the manner or
efficiency with which a pilot moves theprincipal controls in performing a task.)
ROLE
The function or purpose that defines the
primary use of an aircraft.
TASK
The actual work assigned a pilot to be
performed in completion of or as repre-sentative of a designated flight segment.
WORKLOAD
The integrated physical and mental effort
required to perform a specified piloting task.
Cooper-Harper flying qualities rating scale and definition of associated terminology.
39

DASE influence on pilot's CIRcontrol inputs
Pilot does not alter control inputs as a
result of aircraft flexibi ity.
Pilot intentionally modifies control inputsto avoid excitation of flexible modes.
Cockpit vibrations impact precision of
voluntary control inputs.
Cockpit vibrations cause occasionalinvoluntary control inputs.
Cockpit vibrations cause Ii'equent
involuntary control inputs.
Cockpit vibrations cause sustained involun-
tar), control inputs or loss of control.
DASE influence on
ride quality
Cockpit vibrations do not impact ride
quality.
Cockpit vibrations are perceptible but notobjectionable: no improvement necessary.
Cockpit vibrations are mildly objectionable:improvement desired.
Cockpit vibrations are moderatelyobjectionable: improvement warranted.
Cockpit vibrations are highly objectionable:
improvement required.
Cockpit vibrations cause abandomnent
of task: improvement required.
RQR
Figure 11. Supplemental pilot rating scales developed to target pilot opinion of DASE effects.
Figure 12. Composite video image recorded during all piloted evaluations.
40
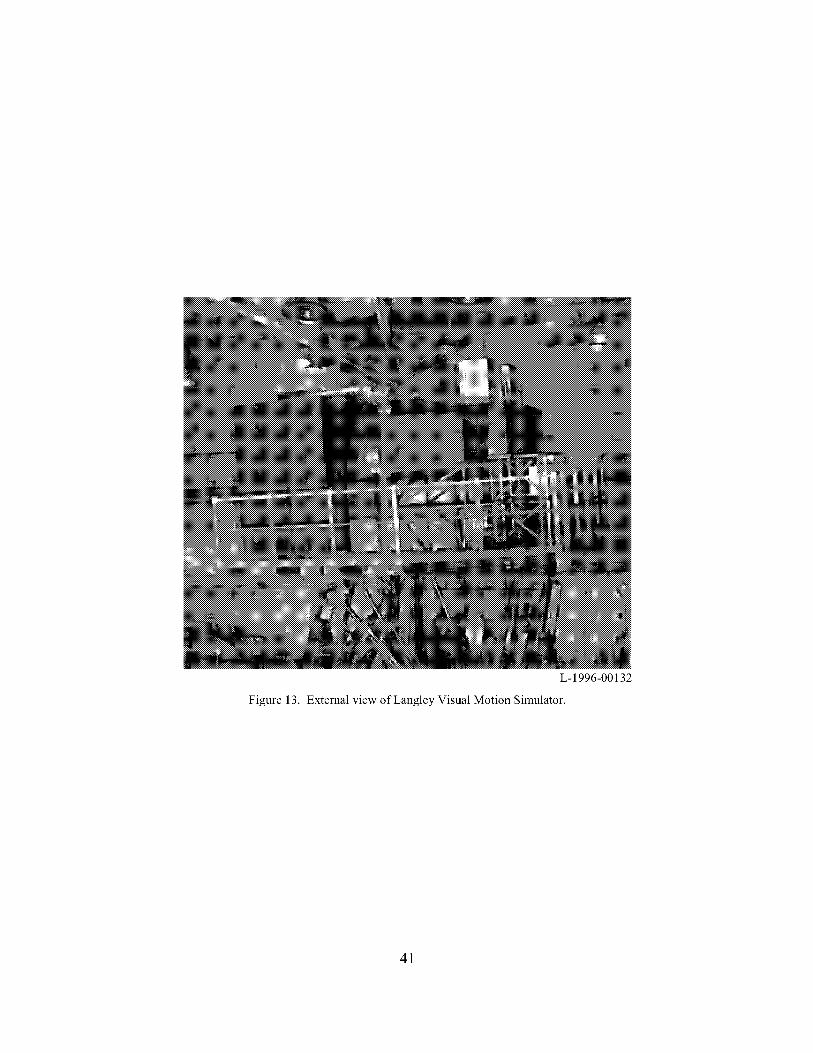
L-1996-00132
Figure 13. External view of Langley Visual Motion Simulator.
41

Figure 14.
_q
C)
- '_g'_i_i_i_i_i_i_i_i_i_i_i_i_i_i_iDASE: 1.2.>-_.< 2 Hz
1.2 .............
[] +1.8-in. peak
.8
.6
.4
.2
-- O ---1.8qn. peaki till II
O
<
1.2
1.0 _
.8
.6
.4
.2
---[ ........................................................
[] + 1.8-in. r eak
-- O -1.8-in. peaki lllll III
tat)_D
g_
30
I
__OXm__m
_.---_----t;ti- _ _: =-'l_g--i 12_-_n:= ....
..................... i
1 5
Frequency, rad/s
20
Frequency response of Langley Visual Motion Simulator as documented in reference 8.
42

__ ..................... acceleration,
Normal commanded
Norma! acce}eration: measured"i
"_7 =<'_ :' _ ,:. .ti! ;: _u,/
/
/ /i
5 10 15 20 25 30 35 40 45 50
v"ljx ::7:/ '_'.85 Mechanical "Slop"?
.80 A I15 16 17 18 19
Time, s
55
)litude ratio:
=.85 at 1.5 Hz
Time delay:
=150 ms
Figure 15. Time history of commanded and actual vertical accelerations recorded during aeroelastic maneuver task.
43

1.0
.8
.6 --
A
_ .2
_ 0
>_'_---.2
.... .4
-1.00
.20
.l 5
.l 0
._ .050
_.'_ -.05
-.10
-.15
-.202O
t I 1 I I _'"
................ Nomlal acceleration, commanded :..-'::
.....................Normal acceleration_ mea s urea t " ' _"_
t 1
5 10 15
/
//
f
20 25 30
Time, s
35
, / l...........40 45 50 55
Niechani'cal "Sl op"?
,' i.,...,, _i_ik g_iVii fitilii ,iiii i
>",li It i ',,_iv_..... . _ :ii_ i
_'_:i_:_:" i i::;7:,. !:i::,,::L:<' _ 7 " _l'
21 22 23 24 25 50 51 52 53 54 55
Time, s Time, s
ratio:
=.85 at 1.5 Hz
delay:
=150 ms
Figure 16. Time history of commanded and actual lateral accelerations recorded during aeroelastic maneuver task.
44
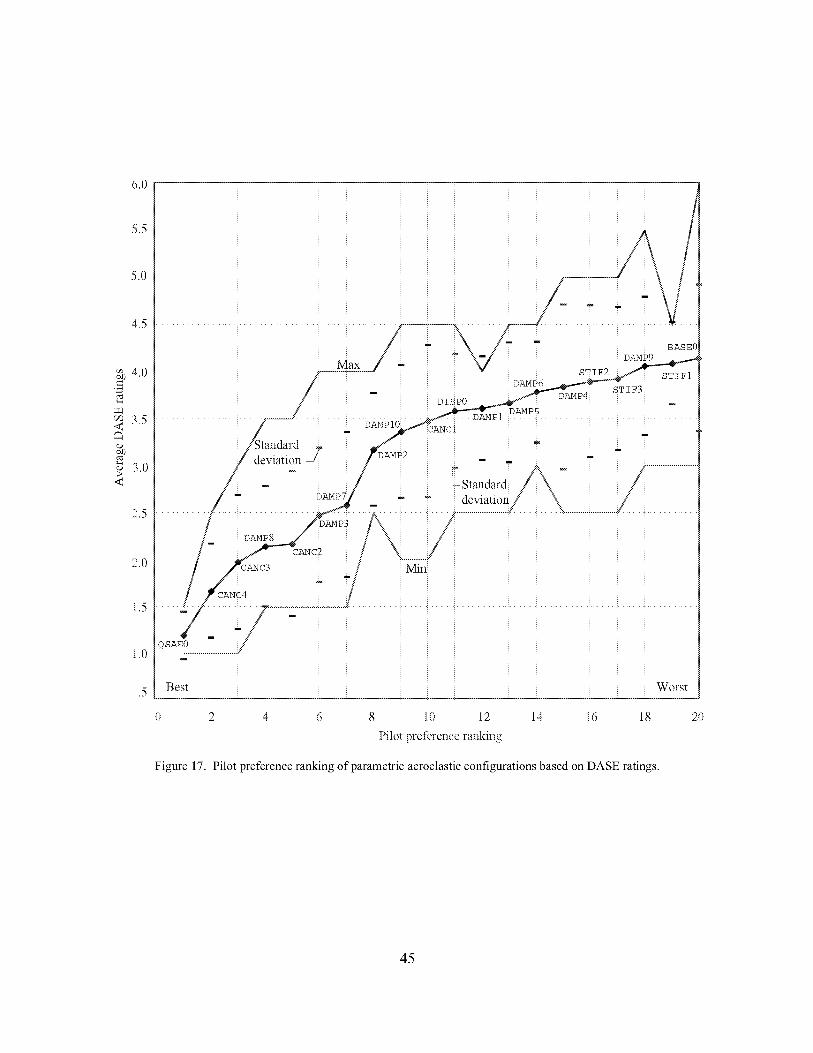
6_0
5.5
5.0
4.5
_'_ 4.0
"m
m_3_5
<
_at)
3.0<
2.5
2.0
1.5
1.0
.5
DAMP8
CANC2
Best
uEASE0
DAMP9
STIF2 STIFf
DAMP6
DAMP4 ST I F3
DAMP5
0 2 4 6 8 10 12 14 16 18
Pilot pret%rence ranking
Figure 17. Pilot preference ranking of parametric aeroelastic configurations based on DASE ratings.
2O
45

DASE influence on ride qtmlity RQR
Cockpit vibrations do not impact ride
quality.
Cockpit vibrations are perceptible but not
Objectionable: no improvement necessary.
Cockpit vibrations are mildly
objectionable: improvement desired.
Cockpit vibrations are moderately
Objectionable: improvement warranted.
Cockpit vibrations are highly
objectionable: improvement required.
Cockpit vibrations cause abandonment
of task: improvement required.
[] Acceptable: no improvement necessary
[] Marginal: improvement desired/warranted
[] Unacceptable: improvement required/mandatory
1.5
2.5
3.5
4.5
5.5
6.5t 0 2 4 6 8 10 12 14 16 18
ii! [--Pilot preference ranking -j
t--Average RQR
Figure 18. Average ride quality rating versus overall pilot preference ranking of parametric configurations.
2O
DASE influence on pilot's control inputs CIR
Pilot does not alter control inputs as a
result of aircraft flexibility.
Pilot intentionally modifies control inputs
to avoid excitation of flexible modes.
Cockpit vibrations impact precision of
voluntary control inputs.
Cockpit vibrations cause occasional
involuntary control inputs.
Cockpit vibrations cause frequent
involuntary control inputs.
Cockpit vibrations cause sustained
involuntary control inputs or loss of control.i
.5
1.5
2.5
D 3.5
D4.5
5.5
D6.5
[] Acceptable: no improvement necessary/[] Marginal: improvement desired, warranted
[] Unacceptable: improvement required/mandatory
2 4 6 8 10 12 141____Pilot preference ranking -J
Average CIR
16 18 20
Figure 19. Average control influence rating versus overall pilot preference ranking of parametric configurations.
46

--.-1
Time history of lateral stick deflections and lateral acceleration at pilot station
1.0
.8
.6
_= .4:'3
= "= .2
7 _;?-. 2-.4-.6
--.g
-1.0
ii! _:i_ _::_i _':!
0 .5 1.0 1.5 2.0 2.5 3.0 3.5 4.0
Frequency, Hz
Biodynamic coupling: sustained feed-through of
structural vibrations back into pilot stick inputs
Figure 20. Power-spectral analysis ofbiodynamic coupling incident for pilot B.

1.0
8.8
O
.2
_iiiiiiiiii_iiiiiiiii!iii_i!iii_i_iiiiiii_iiii!_!iiiii_iiiiiiiiiiiiiiiiiiiiii!i_i_ii_iiiiiii_i_i_i_i_iii_i_i_i_i_ii_i_i_iii_iiii_iiiiiii_i!i_i!iii_i_i_iiiL_
1 2 3
Frequency, Hz
40 42 44 46
Time, s
(a) Pilot B; DAMP9 configuration; CIR: 4, RQR: 6.
48 5O
40 42 44 46
Time, s
(b) Pilot E; DAMP9 configuration; CIR: 4, RQR: 5.
48 5O
1.0 _:7 " _: 4-- ...........................................
_;.6
.4 iiiii i iiiiiiiiiii iiiiiii!!iiii iiiiiiiiiiiiiiiiiiiiiiiiiiiiiiiiiiiiiiiiiii iiiiiiiii i ii !!iiiiiiiiii iiiiiii iiiiiiiiiiiii iiii i ! !! ! ! i iO ::: :: ::: ,
01 2 3 4
Frequency, Hz
1.0
©
-g ; >20
....140 42 44 46
Time, s
(c) Pilot C; STrF3 configuration; CIR: 5, RQR: 5.
Figure 21. Examples ofbiodynamic coupling incidents for pilots B, E, and C.
48 50
48

65
4
O _ 3
Avg
Re f-t t ST IF1 ST E F2 ST IF3 Rigid
baseline Configuration (QSAE0)(BASEl))
Figure 22. Variation of average RQR with increasing structural stiffness.
3O
0
Ref-H STIFI STIF2 STIF3 Rigid
baseline Configuration (QSAE0)
(BASEO)
Figure 23. Variation of average CIR with increasing structural stiffness.
49

10
9
8
7
_6
o 5
4
3
2
1
Ref-Hbaseline
(BASSO)
-- Min
STmF1 s TI F2 STJ: F3 Rigid
Configuration (QSAE 0)
Figure 24. Variation of average CHR with increasing structural stiffness.
6
0Undam
DASE Damping level
_ed .07 .15 .30 Rigid
(QSAS)
Figure 25. Variation of average RQR with increasing modal damping.
50

6
5
3
0Undamped .07 .15 .30 Rigid
DASE Damping level (QSAE)
Figure 26. Variation of average CIR with increasing modal damping.
0Undam t)e d .07 .15 .30 Rigid
DASE Damping level (QSAE)
Figure 27. Impact of mode-canceling control on RQR.
51

3
0Undamped .07 .15
DASE Dampinglevel.3O Rigid
(QSAE)
Figure 28. Impact of mode-canceling control on average CIR.
10
9
8
7
6
co5
4
3
Undamped .07 .15 .30 _gid
DASE Damping level (QSAE)
Figure 29. Variation of average CHR with increasing damping and modal cancellation.
52

_g
O
e-d
0
5
4
3
2
1
0
-1
---_2
-3
-4
-5
-640 42 44 46 48 5(I 52 54 56
Time, s
Figure 30. Measured lateral accelerations from last 15 s of one example run performed with ST I F2 configuration.
53

rms lateral acceleration spectrmn, g traits
N
o
m 3
J/i\
/
IrI
\/

//
\
sl.Ttm ,_ 'uo.T_solooo_ [_so_[ stm
u4
©
i
i i s ?
© ;2, _
t¢3
t¢3

.6
O
"5oo
.5
,4
.3
0
0
1.0 1.5 2.0 2.5 3.0 3.5 4.0 4.5 5.0
Frequency, Hz
Figure 33. Lateral vibration spectral envelope based on maximum and minimum rms spectrum values for all runsgiven RQR of 5.
56

.6
.5
4.4
¢.a_D
©
_ .3_o-d
_.2
iiiiiiiiiiiiiiiiiiiiiiiiiiii_iiiiiiiiiiiiiiiiiiiiiiiiiiiiiiiiiiiiiiiiiiiii
2 3 4
Frequency, Hz
Figure 34. Lateral vibration spectral envelopes for various RQR levels.
57

.6
O
_D
_DeOeO_d
>-
.5
.4
.3
.2
.1
2 3 4
Frequency, Hz
Figure 35. Vertical vibration spectral envelopes for various RQR levels.
58

c_
_.4
J_.3
3.2
Max_mu_2a_c_p_ble
--2 hr
--4hr-- 1-hr RCB"" 8 hr
1 2 3 4 5
Frequency, tlz
\.... 10 min
- 20 rain
.... 40 rain
.........lkn-
Figure 36. Vertical vibration spectral envelopes based on ride quality rating plotted with ISO vertical vibration
standard.
59

Appendix A
Test Pilot Biographies
Pilot A
Pilot A was trained as a Naval Aviator and flew F-8s in both active and reserve duty. Pilot A flew
with a major airline for 4 years in Boeing 727 aircraft before joining NASA as an Instructor Pilot in the
Shuttle Training Aircraft; then he became a Research Pilot at a NASA Research Center. As a NASA
pilot, he has flown a number of research aircraft in addition to research simulations of other vehicles.
Pilot A holds a Bachelor of Science degree from the University of North Carolina at Chapel Hill and a
Masters in Aerospace Engineering degree from the University of Virginia. Pilot A has accumulated over
10000 flying hours in over 45 different aircraft including F-8, F-18, F-16, F-15, F-5, A-4, Boeing 727,
Boeing 737, Gulfstream II/STA, T-38, OV-10, LR-28 aircraft, and a number of general aviation types.
Pilot B
Pilot B has a Bachelor of Science degree from the University of Washington where he attended a
flight test course. Pilot B served as Engineering Test Pilot for two general aviation manufacturers and
accumulated time as a test pilot on 30 different general aviation fixed wing aircraft, before joining an
HSR program industry partner as a research project pilot. He is a graduate of a company-run flight test
school. Pilot B holds an Airline Transport Pilot Certificate with type ratings in seven transport aircraft,
and has over 16 000 hours flight time, of which nearly 10 000 hours have been in flight tests. Pilot B is a
certificated flight instructor in both general aviation and transport aircraft with 3000 hours of instruction
given.
Pilot C
Pilot C was trained as a Naval Aviator and graduated from the U.S. Naval Test Pilot School, Patuxent
River, Maryland. Pilot C has a Ph.D. in Hypersonic Flight Dynamics from the University of Southern
California. He is employed by an HSR program industry partner as the chief pilot for the High Speed
Civil Transport and as a project experimental test pilot in a number of aircraft programs. He holds an
Airline Transport Pilot Certificate, and has first pilot time in over 50 aircraft, including the F-14A and
several transport aircraft.
Pilot D
Information not available.
Pilot E
Information not available.
Pilot F
Pilot F served with the U.S. Marine Corps from 1953 to 1962 as a single-engine fighter-bomber pilot.
He has been a research pilot with NASA since 1962 and has accumulated more than 10 000 total hours in
a wide variety of aircraft, including helicopter, VTOL, STOL, and light and heavy fixed wing aircraft. He
has an Airline Transport Pilot Certificate with type ratings in the Convair 990 and the Douglas DC-8.
60

Appendix B
Flight Cards
This appendix presents the flight cards used in the LaRC.3 experiment.
Nomenclature
AGL
ALT
AOA
A/T
CDU
C.G.
CHR
Config
DME
Dir
EPR
F/D
FPM
ft/sec
GEAR
G/S
GW
HUD
ILS
KEAS/m
Lat
above ground level, ft
altitude
angle of attack, deg
autothrottle
cockpit display unit
center of gravity, percentage of mean aerodynamic chord
Cooper-Harper pilot rating
aircraft configuration
distance measuring equipment (distance from runway threshold)
directional
exhaust pressure ratio (shorthand for throttle position)
flight director
feet per minute
feet per second
landing gear position
glide slope (part of instrument landing system)
gross weight
head-up display
instrument landing system
equivalent airspeed, knots
lateral
61

LEF
LOC
M
MFC
MIC
MTE
Mmo
M13
N/A
OM
PF
PFD
PIO
PNF
PSCAS
R
R/C
RQR
RSCAS
Rwy
TEF
TIFS
Trim
VFR
leading-edgeflaps,deg
localizer(partofinstrumentlandingsystem)
Machnumber
finalcruisemasscondition
initialcruisemasscondition
missiontaskelement
maximumoperatingMachnumber
masscase13:maximumtaxiweightatforwardC.G.
notapplicable
outermarker
pilotflying
primaryflightdisplay
pilot-inducedoscillation
pilotnotflying
pitchstabilityandcontrolaugmentationsystem
constantvalueduringruneither+1or-1
rateofclimb
ridequalityrating
roll stabilityandcontrolaugmentationsystem
runway
trailing-edgeflaps,deg
totalin-flightsimulator
indicatesthisparametershouldbesettovaluerequiredtoachievetrimmed(unaccelerated)initialconditions
visualflightrules
62

Vapp
Vapp1
Vapp2
Vg/a
Vmin
Vref
X
approachspeed
approachspeed,firstapproachsegment
approachspeed,secondapproachsegment
go-aroundspeed
minimumoperatingspeed
referencespeed
cross
63

3115 Composite Flight Director Tracking Task
Flight Phase I MTE I Weather State I Failures12B. Low Altitude 316. Flight Director I 1. Mild Turb. I 0. No Failures
Maneuvering Tracking I I_7. MFC - Final Cruise condition
Head/X I Turb/ I App .... h I Ceiling/ I Rwy Sur- IWind_e or Visibilit face
0 Kt/ I Moderate/ I 0 I Uiflinfited/ I Dry, I0Kt I N°_flimited I _c°°ved I
Initial PositionN/A
_KLT 1,5001 EPR Trim _?SCAS
EAS/M 1901 R/C 0 _SCAS
V 384,862 IC.G. 53.21 UD
EAR AUuP /OILEF/TEF onfig
NORMALNORMALlONONoNI'INA_+_"2rmals/Exce_'ti. ....
Ref H Cyc 3
Procedure Evaluation Pilot (PF):1. Establish s_raight and level flight at the indicated conditions.2. Follow the HDD Flight Director (F/D) flight path and heading commands tightly, keeping the F/D errors to
within desired performance.3. Terminate the maneuver in straight and level flight.
Procedure Test Engineer / Pilot Not Flying (PNF):1. Confmn lifitial conditions.
2. Monitor any perfomlance indicators ttmt will not be automaticaUy reported at the end of the ran.
Date: Pilot: Exposure: Configuration:
Evaluation Segment: Flight Director Tracking Long CHR I Lat / Dir CHR
Start Evaluation: Straight and Level Flight on Initial Conditions /End Evaluation: Straight and Level flight at End of Maneuver 1
Evaluation Basis: Evaluate the ability to accurately maneuver the aircraft following the flight director com-mands. There should be no tendency to oscillate about the flight director target and no tendency to PIO in ei-lher axis.
Performance Standards I Target I Desired I Adequate
Deviation from Flight Dire ctor coxrmland [100% ofrml tinle[ 70% of rmltinle l>90% of rml tinleI in inner circle [ in inner circle I in outer circle
Pilot-Induced Oscillations (PIO) / No PIO / No PIO / Not Divergent
Run No. % Desired % Adequate DASE Ratings:
CIR RQR
Display Pemlrbation hnpact? Y / N
3115 _ ]] 3115
Figure B1. Composite flight director tracking task.

t.m
4020 Nominal Approach & Landing
Flight Phase I MTE I Weather State I Failures15A. Initial Approach Fix 313. Complete Approach 1. Light Turb. 0. No Failures
and Landing
Loading: I 7. MFC - Final Cruise condition
Head/X Turb/ Approach Ceiling/ Rwy Sur-Wind, kt Gusts Category Visibility face Initial Position
0 Kt/ Light/ 0 Unlinlited/ Dry, 3 iml outside OM; On course for 30
0 Kt None Unlimited grooved intercept of LOC; 4,500 right ofcen-terline
_KLT 1,500 I Vapp 159 ?I_CAS NORMAL
EAS/M 190 I Vref 154 ]ISCAS NORMAL
liW 384,862 I Vg/a 159 _T ONC.G. 53.2 I Vmin 125 UD ON
EAR UP IF/D OFF
ILEFfrEF Autu IConfig RefH Cyc 3
Abnormals/Exceptions:
Procedure Evaluation Pilot (PF):1. Establish aircraft in steady level flight at the noted conditions, on intercept comse for LOC.2. Slow to Vapp when instructed by PNF.3. Capture LOC. Track LOC to G/S intercept and capture G/S.4. Discomlect autothro_les at 50 ft AGL.
5. Manually retard throttles and execute a flare to touchdown at the target point on the nmway.6. After touchdown, retard throttles to idle and lower the nosewheel to the nmway.
Procedure Test Engineer / Pilot Not Flying (PNF):1. Confirnl initial conditions.
2. Set Vapp as connnanded speed at DME 7.03. 1/2 dot before G/S capture, call Gear Down and move gear handle to tile down position
Date: Pilot: Exposure: Configuration:
Evaluation Segment:gtart Evaluation:
51d Evaluation:
Glideslope and Localizer Intercept Long CHR [ Lat / Dir CHR
1,500 ft, Final Approach Speed, Level /200 fl AGL, Landing Speed, Descending I
Evaluation Basis: Evaluate tile ability to accurately maneuver onto tile final approach path and nlaintain nolni-lal approach profile and speed at low altitudes. Attained tritmned flight before the middle marker (approxi-nately 0.5 iml from tile end of the runway).
Performance Standards I Target I Desired I Adequate
eviationfrom inalapproacha peed( )I 0 [ 5 [ l0)eviation from Glideslope (dots) 0 0.5 1.0
)eviation from Localizer (dots) 0 0.5 1.0
Evaluation Segment: Precision Landing Long CHR ILat / Dir CHR_tart Evaluation: 200 fl AGL, Landing Speed, Descending
51d Evaluation: Nosewheel touchdown
Evaluation Basis: Evaluate handling qualities in landing. For desired perfomlance, there should be no ten-lency to PIO or bobble in pitch or roll. There should also be no tendency to float or bounce after touchdown.Fhere should be no geometry s_ikes on touchdown.
Performance Standards
)eviation from Approach Airspeed at 50 fl (kt)
I Target0
Desired
5I Adequate
10
)eviation from Runway Heading at touchdown (deg) 0 3 6
Jongitudinal distance from threshold at touchdown (fl) 1250 1000-1500 750-2250
Jateral offset from nmway centerline at touchdown (fl) 0 10 27
gink Rate at touchdown (fl/sec) <1 4 7
vlaximlml Bank Angle below 50 fl AGL (deg) 0 5 7
)riot-Induced Oscillations (PIO) No PIO No PIO Not Divergent
ileometry S_ikes (tail, engine nacelle, wing tip) No Strikes No Strikes No Strikes
Run No. Sink Rate TD X TD Y DASE Ratings:
CIR RQR
Display Perturbation hnpact? Y / N
4020 11 IT 4020
Figure B2. Nominal approach and landing.

4069 IAG Lateral Offset Landing
I Flight Phase I MTE I Weather State I Failures
15B. Maneuver to Final 314. Approach and Land- 111.Light Turb. w/Gusts I0. No FailuresApproach Fix ing from Lateral Offset I I
7. MFC - Final Cruise condition
I Head/X I Turb/ I Approach I Ceiling/ I Rwy Sur- I
Initial PositionOutside OM, at 1,000 AGL
_KLT 1,500 I Vapp 159 ?Ill_CAS NORMAL Abnormals/Exceptions:l
EAS/M 159 I Vref 154 tHRSCAS NORMAL ILS localizer should be offset 300 feet toW 384,S62 1 Vg/a 159 _dT ON one side of the nmway centerline, 1581 feet
from tile rlmway threshold, and tile
C.G.EAR DOWN53"2I Vmin 125 1F/DUD oFFON glideslope set to 2.50.
ILEF:rEF Auto IConng RefHC_c3
Note: Procedure should be repeated for a total of 3 approaches and landings. Turbulence and discretegusts added on second and third approaches.
Procedure Evaluation Pilot (PF):1. Establish aircraft in steady level flight on downwind, dog-leg, or straight-in for LOC capture, as called for
by test engineer, for G/S intercept.
2. Maintain Vapp.3. Establish turn at no less than 3 nfiles fronl nmway threshold and descend in altitude as required to track
LOC to G/S intercept and capture G/S.4. Track LOC and G/S using HUD, following tile offset localizer raw data.
5. When PNF calls Correct, PF visually maneuvers as required to correct for tile lateral offset and set upfor a touchdown at tile target point on tile rlmway.
6. Discomlect autothrolfles at 50 ft AGL.
7. Manually adjust throttles as required and execute a flare to touchdown at the target point on the rlmway.8. If not in TIFS, after touchdown, retard throlfles to idle and lower the nosewheel to the rlmway.
Procedure Test Engineer / Pilot Not Flying (PNF):1. Confirm initial conditions.
2. During approach, PNF nlonitors any perfonnance indicators that will not be autonlatically reported at theend of tile run.
3. At250 ftAGL, call Correct
Date: Pilot: Exposure: Configuration:
Evaluation Segment:
_tart Evaluation:
51d Evaluation:
Glideslope and Localizer Tracking with Line-UpCorrection
1,000 ff AGL, Final Approach Speed, Level
50 feet AGL, De-Flare, Descending
Long CHR ILat / Dir CHR
Evaluation Basis: Evaluate tile ability to accurately nlaneuver onto tile final approach path and maintain nomi-lal approach profile and speed down tile Decision Height (when Correct is called). Evaluate tile ability to
naneuver aircraft into landing line-up from offset ILS approach guidance and establish satisfactory pre-flareanding conditions.
Performance Standards
)eviation from Approach Airspeed (kt) [AGL > DH]
)eviation from Glideslope (dots) [AGL > DH]
I Target I Desired I Adequate
i01 t0 0.5 1.0
0 0.5 1.0)eviation from Localizer (dots) [AGL > DH]
Evaluation Segment: Precision Landing - Close-in Long CHR ILat / Dir CHR
_tart Evaluation: 50 fl AGL, Pre-Flare, Descending
51d Evaluation: Main Gear Touchdown (Nosewheel Touchdown,if not in TIFS)
Evaluation Basis: Evaluate handling qualities in landing for a high-gain task. For desired perfonnance, tile
)ilot should be able to precisely and positively control tile aircraft touchdown and there should be no tendencyo PIO or bobble in pitch and roll. There should also be no tendency to float in flare. There should be no ge-mletry s_ikes.
Performance Standards I Target Desired I AdequateLongitudinal distance from threshold at touchdown (if) 1250 1000-1500 750-2250
Lateral offset from nmway centerline at touchdown (fl) 0 10 27
gink Rate at touchdown (fl/sec) <1 4 7
Vlaxinllml Bank Angle below 35 fi AGL (deg) 0 5 7
'riot-Induced Oscillations (PIO) No PIO No PIO Not Divergent
3eolnetry Strikes (tail, engine nacelle, wing tip) No Strikes No Strikes No Strikes
Run No. Sink Rate TD X TD Y DASE Ratings:
CIR RQR
Display Perturbation hnpact? Y / N
4069 1[ 4069
Figure B3. IAG lateral offset landing.

G_.....q
Task Rating Card -- TaskID: [l Nominal [l Offset [l Fit. Dir.
Pilot: Configuration: Date:
Evaluation Segment Long CHR Lat-Dir CHR DASE CIR DASE RQR N/A
A##toach
Lancing
F# D# _ack#Tg • C_#u/ut e
ADEQUACY FOR SELECTED TASK ORREQUIRED OPERATION*
Yes
No _
Imp rovementt_ Deficiencle s
Ye* N p t
O1:q:,;,esYes p t
No I
DASE INFLUENCE ON PILOT'S
CONTROL INPUTS
I ilot does not alter control inputs as aresult of aircraft flexibility
Pilot intentionally modifies control inputsto avoid excitation of flexible modes
Cockpit vibrations impact precision ofvoluntary control inputs
I Cockpit vibration s ca use occasion alinvoluntary control inputs
Cockpit vibration s ca use frequentinvoluntary control inputs
I Cockpit vibrations cause sustained involuntary control inputs or loss of control
DEMAND ON THE PILOT
AIRCRAFT IN SELECTED TASKCHARACTERISTICS OR REQUIRED OPERATION* CHR
Excellent Pilot corrpensation not a factor for UHighly desirable desired performance
Good Pilot compensation not a factor for H
Negligible deficiencies desired performance
Fair Some mildly Minimal pilot compensation required for
unpleasant deficiencies desired performance
Minor but annoying Desired performance requires moderatedeficiencies pilot compensation
M oderately objectionable Adequate performance requires H
deficiencies considerable pilot compensation
Very objectionable but Adequate performance requirestolerable deficiencies extensive pilot compensation
Major dehclencles Adequate pert ormance not attainable with
maximum tolerable pilot compensationControllability not in question
M ajor deficiencies forConsiderable pilot compensation is requiredcontrol _l
Major deficiencies retainlntenSecontrolPil°tcompensation is required to N
Major deficiencies requiredControlwilloperationbe lost during some portion of
*Definition of required operation involves designation of flight phase and/or
CIR DASE INFLUENCE ON RQRRIDE QUALITY
F ockpit vibrations do not impad ridequality
Cockpit vibrations are perceptible but notobjectionable no improvement necessary
L ockpit vibrations are mildly objectionableimprovement desired
I Cockpit vibrations are moderatelyobJectionable improvement warranted
Cockpit vibrations are highly objectionableimprovement required
Cockpit vibrations cause abandonmentof task improvement required
Do aeroelastic display perturbations impact the easeor precision with which the task is performed? Y/N
Display Perturbation hnpact? Y / N
I[ 11
Figure B4. Task rating card.

Appendix C
HUD Symbology
The head-up display (HUD) format shown in figure C1 was used during the LaRC.1 piloted Ref-H
evaluations and has all elements depicted. This full clutter mode is not used in any of the tasks of
LaRC.3, but various elements can be enabled for specific tasks. This symbology set has been made to
follow as closely as possible the symbology set discussed at an external vision system (XVS) symbology
workshop at Langley in September 1996, but does not completely conform to the XVS symbology set dueto resource limitations.
7 30
}Z %400
2o
7-10
Run 001
00:00 ET
12-12-99
@
____©
@
Figure C1. HUD display.
HUD display control: Display of all the following HUD items are controlled through the initial con-
dition (IC) files for each assessment task. Each task has several HUD options that can be viewed by
striking the HUD declutter button on the simulator instrument panel. In general, three HUD options are
available along with varying levels of declutter. Repeatedly striking the declutter button will eventually
remove all HUD symbology. Additionally, HUD mode changes, such as those encountered during the
go-around maneuver, will induce an automatic HUD change when the pilot strikes the takeoff go-around
(TOGA) button.
The various features of the HUD are indicated by their identification numbers (from 1 to 15) and are
described in sequence. Operation of the new HUD element logic is also discussed.
68

.
.
.
Bank angle scale with roll pointer and sideslip indicator. This section of the LaRC.1 HUD is
specified to be the same as previously employed for the 1995 LaRC.0 assessment study. It should
be noted that after initial evaluations during LaRC.0, the sideslip indicator (lower portion of roll
pointer triangle) displays complementary filtered sideslip angle as the default for all tasks. The
sideslip indicator will turn amber when it moves just past the edge of the roll pointer indicating a
sideslip angle of 4 °.
_........L_- L-4_ .......J.. _3030/_j. \
\.//
Figure C2. Bank angle scale with roll pointer and sideslip indicator.
Heading scale-horizon line. This section of the LaRC. 1 HUD is specified to be the same as previ-
ously employed for LaRC.0. Smaller tick marks, without labels, are drawn at 5° increments.
34 35 N 01 02I i l J 1 l l I 1
Figure C3. Heading scale-horizon line.
Airspeed tape display. Item 3 is a totally new element for the NASA LaRC Ref-H assessment
project. It displays analog and digitally filtered equivalent airspeed (EAS) that were displayed
only digitally on the 1995 LaRC.0 HUD. Several airspeed bugs are required for this system.
Takeoff decision speed V1, rotation speed Vr, takeoff safety speed V2, and maximum operating
speeds Vmo and Mmo are displayed. Vmo, Mmo, and Vmin boundaries are indicated by red and white
checkered areas on the fight side of the airspeed tape reference line. Values of V1, Vr, V2, Vmo,
Mmo, and Vmin are read from the maneuver IC files. Speeds V are displayed on the fight side of
airspeed tape reference line (white). Current commanded airspeed, either from the IC file or from
the CDU, are displayed by the appropriate icon shown in figure C4 on the left of the airspeed tape
line (white). Digital equivalent airspeed is displayed in the highlighted area to the nearest knot
(white). The airspeed trend line (green) indicates the anticipated airspeed that will exist in 10 s. It
emanates from the origin of the airspeed tape. The inertial acceleration parameter from the air-
speed complementary filter system is used for this purpose. A 1-s time lag is applied to this vari-
able to smooth its response. The open areas of the airspeed indicator are not shaded.
280 -
Commanded airspeed indicator (white) -_
Digital airspeed display (white) ..........._-
Airspeed tape reference line (white) ..................._--240 -
-V
22 (}_....a_
e.......................1/mo/M mo boundary (red/white)
Airspeed trend line (green)
Reference airspeeds (white)
m........................Vss boundau (red/white)
Figure C4. Airspeed tape display.
69

. Altitude display tape. The altitude tape display is also a new HUD element. It provides detailed
altitude information to the pilot. The digital altitude display (white) is different from the airspeed
digital display in that the digits representing hundreds of feet scroll at a different rate than the
digits representing tens of feet. For example, for altitudes between 6400 and 6500, the 064 would
remain constant and the digits representing tens of feet would change. Note that the digits repre-
senting tens of feet are resolved in 20-ft increments. The color of the altitude tape reference line,
tick marks, and labels is white unless the altitude is below the minimum altitude. When the alti-
tude is below the minimum, the altitude tick marks are amber. Minimum altitude is set at 200-ft
AGL. The rate of climb display (white) indicates the analog rate of climb only when the rate of
climb is between +4000 and -4000 fpm. When the rate of climb is greater than --4000 fpm, the
rate of climb will be displayed by three digits (white) at the top (or bottom) of the scale indicating
rate of climb in hundreds of feet per minute (fpm). The scaling of this display is nonlinear in that
the distance from 0 to 1000 fpm is twice that between 1000 and 2000 fpm, which is twice the dis-
tance between 2000 and 3000 fpm. The distance between 3000 and 4000 fpm is the same as 2000
to 3000 fpm. The minimum altitude wedge (amber) will become visible when the altitude reaches
the minimum altitude (200 ft) with the base of the wedge touching the altitude scale line when the
altitude reaches 0 ft. An option is given to switch between pressure altitude and radar (landing
gear) altitude. When in radar altitude mode, an R (white) is displayed at the top and bottom of
the altitude scale line. No indication is shown when not in radar altitude mode (i.e., a P is not
displayed when not in radar mode in an attempt to reduce HUD clutter). The open areas of thealtitude indicator are not shaded.
-6800 _
-6600
Digital altitude display (white) --_- {__
Altitude tape reference line (normal/white) -- _,- 76400
-6_00-"
t .........Rate of climb display (white)
Minimum altitude warning wedge (amber)
Figure C5. Altitude display tape.
. Velocity vector cluster. The velocity vector cluster (white) is similar to that used in the 1995
LaRC.0 HUD and includes the velocity vector symbol (an open circle with fins), option digital air-
speed, altitude and distance measuring equipment (DME) readouts, an airspeed error tape that
grows above or below the left fin of the velocity vector symbol, and an acceleration indicator. The
main difference is that the digital airspeed and altitude indicators of the 1995 LARC.0 HUD could
be moved to the airspeed and altitude display tapes. DME distance to the runway threshold can
also be displayed if desired. Other minor changes are that the acceleration diamond is now a caret
(>) and that it is driven differently. The acceleration caret indications are now dependent on iner-
tial acceleration computed in the airspeed complementary filter section. This computation employs
the acceleration of the C.G. of the aircraft resolved along the flight path. A 1-s lag is applied to
this signal to improve its motion. In addition, the capability to automatically move the acceleration
indicator from the velocity vector cluster to the pitch reference waterline has been implemented. It
will move to the reference waterline when the angle of attack is above 15 ° and back to the velocity
70

.
vector cluster when the angle of attack is below 14 °. Another feature of the acceleration arrow is
that its zero position can be biased to permit its use while maintaining a nonzero acceleration, such
as that desired for the entry phase of the recovery from limit flight tasks.
-- 6470 _ Altitude (either pressure or radar)Equivalent airspeed .............._ 2574.4
"_"_'-- Distance to runway threshold
Figure C6. Velocity vector cluster.
Pitch grid, rejerence waterline, and heading scale. The pitch grid and reference waterline (white)
were changed for the 1996 LARC.0 HUD. The waterline was replaced with a winged-V. Use of
the 1995 LARC.0 HUD takeoff rotation brackets (magenta) and expanded reference waterline
(item 14) are included in the HUD option. The pitch grid is much wider than the 1995 LARC.0
HUD and has the center open. Only one set of pitch grid labels is indicated for this HUD option
and the labels are placed inside the left-side pitch grid tick marks. The horizon line and heading
scale are the same as the 1995 LARC.0 HUD. The tail-scrape bar (red and white striped barber
pole), which is item 13, is also retained with this HUD option.
10 ................. -_ .......................Pitch gridRet?rence waterline
5
.... 5
7. and 8.
-10
Figure C7. Pitch grid, reference waterline, and heading scale.
ILS glide-slope and localizer displays. The ILS glide-slope and localizer displays are
colored white with a white moving diamond. When excessive deviation occurs, the white
diamond changes to an amber flashing diamond. Excessive deviation is one dot. The glide-
slope display is placed just outside the altitude display tape.
71

.
10.
11.
lo o /_ °l
Figure C8. ILS glide-slope and localizer displays.
Analog-digital angle of attack display. Digital angle of attack moves with the analog pointer on
the scale. If the angle of attack is not displayed with this display, digital angle of attack is dis-
played in the upper left-hand comer of the HUD.
20
Figure C9. Analog-digital angle of attack display.
Analog-digital acceleration tape (white) display. Digital normal acceleration moves with the
analog pointer on the scale. If the normal acceleration is not displayed with this display, digital
normal acceleration is displayed in the upper left-hand comer of the HUD.
2071.54
0q
Figure C10. Analog-digital acceleration tape display.
Takeoff climb guidance system. This system consists of a labeled dashed line with a velocity
vector guidance symbol (an open circle). The dashed line (magenta) is displayed when the pilot is
commanded to fly a specific climb gradient. The labels of this line represent the climb gradient, in
percent. When the velocity vector guidance system is operating in this mode, the velocity vector
guidance symbol (also magenta) is constrained to travel across the dashed line and provides the
pilot with steering information only to maintain the extended runway centerline. When the takeoff
guidance system is in airspeed command mode, the dashed line is removed and the velocity vector
guidance symbol provides both longitudinal and lateral information. Longitudinal guidance is a
combination of airspeed error and inertial acceleration and is provided to assist the pilot to main-
tain the desired airspeed when operating in a fixed-thrust mode. The pilot attempts to place the
velocity vector symbol on top of the velocity vector guidance symbol. The lateral guidance is the
same regardless which mode of the takeoff climb guidance system is selected.
72

12.
13 "Q_ -13
Figure C11. Takeoff climb guidance system.
Depressed glide-slope reference line. The purpose of this reference line is to provide the pilot with
an indication of where to place the velocity vector to fly a flight-path angle equal to the glide slope.
It is horizontally slaved to the velocity vector.
13.
Figure C12. Depressed glide-slope reference line.
Tail-scrape bar (red and white striped barber pole). The tail-scrape bar indicates what pitch atti-
tude the aircraft would have to reach in order to scrape the tail on the ground.
14.
15.
Figure C13. Tail-scrape bar.
ReJerence waterline (white). Most of the time the reference waterline is the smaller size, which is
indicated by the label normal reference waterline. During takeoff rotations, however, the reference
waterline becomes much larger and is used in conjunction with the pitch rate error brackets to pre-
cisely control the rotation performance of the aircraft. The pitch rate error brackets are approxi-
mately 2 ° high. A pitch rate error of--0.5 deg/s will displace the pitch rate error bracket one half
the height of the inner pointer with respect to the reference waterline. A pitch rate error of
--1.0 deg/s will displace the pitch rate error bracket one half its total height with respect to the ref-erence waterline.
_.1ff ...................Normal reference waterline
E_...._ _,t ................Pitch rate error bracketsEnlarged ret_rence waterline(used during takeoffrotation)
Figure C14. Reference waterline.
Digital information selective display in upper left-hand corner of HUD. When angle of attack and
normal acceleration are being displayed with the analog/digital tape displays, those parameters areremoved from this element.
28 .......... Wind indicator (speed and relative direction)Ground speed_ l_lots282 GS __.__I.
0.44 M -- Mach number
0.81G ..... Normal acceleration, g units
"-- Angle of attack, (leg
Figure C 15. Digital information selective display.
73

Appendix D
Flight Director Implementation for Task 3115
The composite flight director tracking task allowed the pilot to evaluate the ability to accurately
maneuver the aircraft by following flight director commands. The flight director was driven with a
composite signal containing elements from various maneuver segments that had been examined in previ-
ous Ref-H simulations. These maneuver segments included a localizer capture from the nominal
approach, glide-slope capture, a descending turn, and a rapid pull-up as found in the landing go-around
tasks. Each of these segments are described in this appendix. Flight-path and track angle commands
from these segments were combined with varying order and sign to produce a flight director behavior that
was not easily anticipated, but which was still representative of actual flight maneuver tasks.
Maneuver Segments for Use With Composite Flight Director Tracking Task
Go-Around Plus Spiral Descent
A sequence of flight-path and heading changes to the flight director was used to create an aggressive
pull-up followed by a descending turn. This sequence is shown in table D1 and figure D1.
Table D1. Flight-Path Angle and Heading Angle Command Sequences
for Go-Around Plus Spiral Descent Task
Flight-path angle Heading angle corn-Time, s
command, deg mand, deg (x R1)
010
13
2325
015
15
55
00
0
1515
18
"_ 16
14
Q
10
6
% 4Y=_2
00 5 10 15 20
Time, s
................ 1 ................ i................ r.............. r ..................
....... _ ........ i........ L ...... J_........
0 5 l0 15 20 25
Time, s
Figure D1. Flight-path angle and heading angle time histories.
74

Glide-Slope Intercept
Another portion of the flight director tracking task included a flight-path change corresponding to a
glide-slope intercept, as shown in table D2 and figure D2.
Table D2. Flight-Path Angle and Heading Angle Command Sequences
for Glide-Slope Intercept Task
Flight-path angle Heading angle command,Time, s
command, deg deg0 0 0
5 3 08 3 0
m- .......................................
-l.o ........ ; ........... ; ...........
....2_0 .........................i.........................i...........................i...........................
-3.5
0 2 4 6 8Time, s
Figure D2. Flight-path angle time history for glide-slope intercept task.
Localizer Intercept
The heading angle command change corresponding to a localizer intercept, shown in table D3 and fig-
ure D3, constituted the third portion of the flight director tracking task.
Table D3. Flight-Path Angle and Heading Angle Command Sequences
for Localizer Intercept Task
Flight-path angle Heading angle command,Time, s command, deg deg (x R2)
0 0 010 0 15
12 0 15
75

18
_16-g 14
o 10e3.)
"VJ_ 8
6.9-C3 4
2
0 2 4 6 8 10 12Time, s
Figure D3. Heading angle command time history for localizer intercept task.
Random Sense and Sequencing for Maneuver Segments
The sequence of execution of maneuver segments l, 2, and 3 was randomly chosen prior to the start of
a run. If a particular segment ended with a nonzero flight-path or track angle command, then the follow-
ing segment was executed relative to that nonzero condition. The sequence would always begin with a
3-s interval of straight and level flight before the first of the maneuver segment flight director commands.
After this 3-s interval, the flight path and heading command sequence began. The parameters R 1 and R2
were integers which had a constant value during a run, but which were randomly chosen to be either -1 or
+ 1 prior to the start of a run. Their values were independent of each another.
Filtering of Flight Director Signals
Second-order filters were applied to signals that drove the flight director symbol to prevent overly
abrupt changes in the target climb rate and turn rate. The second-order filters had the form shown in
equation (D 1).
As 2 +Bs+l(D1)
where A and B are time constants and s is the LaPlace operator. The time constants for these filters were
separately tuned for the vertical and lateral command paths based on preliminary pilot evaluations. The
time constants produced a critically damped second-order behavior with a natural frequency of 1.2 rad/s
in the longitudinal path and 0.6 rad/s in the lateral path. The values of the time constants are as follows:
Table D4. Values of Time Constants
Path A B
Vertical 0.70 1.30Lateral 2.80 2.60
76

Performance Tolerances for Flight Director Tracking Task
To compute the task performance for this maneuver, it was necessary to calculate the percentage of
time spent with the center of the flight-path marker symbol within 1° and within 2 ° of the center of the
flight director symbol. The flight director symbol consisted of two concentric circles centered on the
flight director command as shown in figure D4. The inner circle had a radius of 1.25 ° and the outer circle
had a radius of 2.25 °. Desired performance for the flight director tracking task required that the pilot
maintain the entire flight-path marker inside the inner circle (1.25 ° radius) for at least 70 percent of the
duration of the task. Adequate performance required that the pilot maintain the entire flight-path marker
inside the blue (2.25 ° radius) for at least 90 percent of the duration of the task. The task performance was
computed based on the pilot's flight-path command symbol (the output from his stick integrator which
appears on the HUD) and not the actual flight path of the vehicle. Therefore, this task provided an
indication of the pilot's ability to issue precise maneuver control inputs in the presence of aeroelasticdisturbances.
i
/z /t zzzzx "'_f,v v/ _,_,61 GS
0.45 M 101.04O -- ,,,i-" Concentric flight
12_5c_ 5 159'_4.4_- 1_%_ _J"f director circles
35 N 01i I _ I i I i
-5
....10
Figure D4.
Rm_ 00100:00 ET12-12-99
Flight director symbol.
77

References
1. Jackson, E. Bruce; Raney, David L.; Hahne, David E.; Derry, Stephen D.; and Glaab, Louis J.: Reference H
PiIoted Assessment (LaRC.1) PiIot Brieftng Guide. NASA/TM-1999-209533, 1997.
2. Waszak, Martin R.; Davidson, John B.; and Schmidt, David K.: A Simulation Study of the Flight Dynamics of
EIastic Aircraft Volumes I and lI. NASA CR-4102, 1987.
3. Churchill, Brett, et al.: High Speed Civil Transport Reference H_ycle 3 Simulation Data Base. Contract
NAS1-20220, Assignment No. 36, WBS 4.3.5.1.2.1, June 1996.
4. Kraft, Raymond; Duffy, Keith S.; Coleman, Edward E.; and Shaw, John L.: Flight Control System for NASA
Simulation. HSCT-BE49B-L95-013,14 (Contract NAS1-20220), Boeing Co., Aug. 18. 1995.
5. Williams, T. M.; Griffith, M. J.; and Rossitto, K. F.: Description of Lateral-Directional SCAS Control Laws for
Ref. H Assessment. Contract NAS1-20220, McDonnell Douglas Aerospace, August 1995.
6. Shweyk, Kamal M.; and Rossitto, Ken F.: Roll Performance and Criteria Development and HSCT Lateral
Control Issues. Rep. No. CRAD-9408-TR-3729 (Contract NAS1-20220), Boeing Co., Feb. 6, 1998.
7. Davidson, J. B., Jr.: Lateral-Directional Eigenvector Flying Qualities Guidelines and Gain Weighted Eigenspace
Assignment Methodology. Ph.D. Thesis, Purdue Univ., May 1997.
8. Bailey, R. E.; and Knotts, L. H.: Interaction of Feel System and Flight Control System Dynamics on Lateral
Flying Qualities. NASA CR-179445, 1990.
9. Cooper, George E.; and Harper, Robert P., Jr.: The Use of Pilot Rating in the Evaluation of Aircraft Handling
Qualities. NASA TN D-5153, 1969.
10. Bailey, Melvin L., ed.: Pilot Comments From the Boeing High Speed Research Aircraft, Cycle 3, Simulation
Study of the Effects of AeroservoeIasticity (LaRC.3), NASA/CR-2000-210307, 2000.
11. Parrish, Russell V.; Dieudonne, James E.; Martin, Dennis J.; and Copeland, James L.: Compensation Based on
Linearized Analysis for a Six-Degree-of-Freedom Motion Simulator. NASA TN D-7349, 1973.
12. Ashkenas, I. L.; Magdaleno, R. E.; and McRuer, D. T.: Flight Control and Analysis Methods for Studying
Flying and Ride Qualities of Flexible Transport Aircraft. NASA CR- 172201, 1983.
13. Smith, John W.; and Montgomery, Terry: BiomechanicaIIy Induced and Controller Coupled Oscillations
Experienced on the F-16XL Aircraft During Rolling Maneuvers. NASA TM-4752, 1996.
14. Ray, Jim; and Rossitto, Ken: HSCT Flight Control System Requirements Specification. NASA Contract
NAS1-20220, Boeing Co., Oct. 31, 1997.
78

Form ApprovedREPORT DOCUMENTATION PAGE OMB No. 0704-0188
The public reporting burden for this collection of information is estimated to average I hour per response, including the time for reviewing instructions, searching existingdata sources,
g_thering_ndm_int_iningthed_t_needed__ndc_mp_eting_ndreviewingthec___ecti_n_finf_rm_ti_n_ Sendcommentsregardingthisburdenestimateoranyotheraspectofthis
collection of information, including suggestions for reducing this burden, to Department of Defense, Washington Headquarters Sen/ices, Directorate for Information Operations andReports (0704-0188), 1215 Jefferson Davis Highway, Suite 1204, Arlington, VA 22202-4302. Respondents should be awarethat notwithstanding any other provision oflaw, no person
shall be subject to any penalty for failing to comply with a collection of information if it does not display a currently valid OMB control number.PLEASE DO NOT RETURN YOUR FORM TO THE ABOVE ADDRESS.
1. REPORT DATE/DD-/_//_/- YYYY) 2. REPORT TYPE
10-2002 Technical Publication
4. TITLE AND SUBTITLE
Simulation Study of Impact of Aeroelastic Characteristics on Flying
Qualities of a High Speed Civil Transport
6. AUTHOR(S)
Raney, David L.; Jackson, E. Bruce; and Buttrill, Carey S.
7. PERFORMING ORGANIZATION NAME(S) AND ADDRESS(ES)
NASA Langley Research Center
Hampton, VA 23681-2199
9. SPONSORING/MONITORING AGENCY NAME(S) AND ADDRESS(ES)
National Aeronautics and Space Administration
Washington, DC 20546-0001
3. DATES COVERED (From- To)
5a. CONTRACT NUMBER
5b. GRANT NUMBER
5c. PROGRAM ELEMENT NUMBER
5d. PROJECT NUMBER
5e. TASK NUMBER
5f. WORK UNIT NUMBER
537-08-23-21
8. PERFORMING ORGANIZATIONREPORT NUMBER
L-18157
10. SPONSOR/MONITOR'S ACRONYM(S)
NASA
11. SPONSOR/MONITOR'S REPORTNUMBER(S)
NASA/TP-2002-211943
12. DISTRIBUTION/AVAILABILITY STATEMENTUnclassified - Unlimited
Subject Category 08
Availability: NASA CASI (301) 621-0390 Distribution: Standard
13. SUPPLEMENTARY NOTESRaney, Jackson, and Buttrill, Langley Research CenterAn electronic version can be found at http://techreports.larc.nasa.gov/ltrs/or http://techreports.larc.nasa.gov/cgi-bin/NTRS
14. ABSTRACT
A piloted simulation study conducted in NASA Langley's Visual Motion Simulator ad&cessed the impact of dynamic aero-
servoelastic effects on flying qualities of a High Speed Civil Transport. The intent was to determine effectiveness of measures
to reduce the impact of aircraft flexibility on piloting tasks. Potential solutions examined were increasing frequency of elastic
modes through structural stiffening, increasing damping of elastic modes through active control, elimination of control effector
excitation of the lowest frequency elastic modes, and elimination of visual cues associated with elastic modes. Six test pilots
evaluated and performed simulated maneuver tasks, encountering incidents wherein cockpit vibrations due to elastic modes fed
back into the control stick through involuntary vibrations of the pilot's upper body and arm. Structural stiffening and compen-
sation of the visual display were of little benefit in alleviating this impact, while increased damping and elimination of control
effector excitation of the elastic modes both offered great improvements when applied in sufficient degree.
15. SUBJECT TERMS
Supersonic transport; Flying qualities; Cockpit vibration; Structural model control; Mode suppression; Ride quality;
Biodynamic coupling
16. SECURITY CLASSIFICATION OF:
a. REPORT b. ABSTRACT c. THIS PAGE
U U U
17. LIMITATION OFABSTRACT
UU
18. NUMBEROFPAG ES
92
19a. NAME OF RESPONSIBLE PERSON
STI Help Desk (email: [email protected])
19b. TELEPHONE NUMBER (Include area code)
(301) 621-0390
Standard Form 298 (Rev. 8-98)Prescribed by ANSI Std. Z3g. 18